communities and populations - weebly
TRANSCRIPT
Communities and Populations
Jean Brainard, Ph.D.
Say Thanks to the AuthorsClick http://www.ck12.org/saythanks
(No sign in required)
To access a customizable version of this book, as well as otherinteractive content, visit www.ck12.org
CK-12 Foundation is a non-profit organization with a mission toreduce the cost of textbook materials for the K-12 market bothin the U.S. and worldwide. Using an open-content, web-basedcollaborative model termed the FlexBook®, CK-12 intends topioneer the generation and distribution of high-quality educationalcontent that will serve both as core text as well as provide anadaptive environment for learning, powered through the FlexBookPlatform®.
Copyright © 2015 CK-12 Foundation, www.ck12.org
The names “CK-12” and “CK12” and associated logos and theterms “FlexBook®” and “FlexBook Platform®” (collectively“CK-12 Marks”) are trademarks and service marks of CK-12Foundation and are protected by federal, state, and internationallaws.
Any form of reproduction of this book in any format or medium,in whole or in sections must include the referral attribution linkhttp://www.ck12.org/saythanks (placed in a visible location) inaddition to the following terms.
Except as otherwise noted, all CK-12 Content (including CK-12Curriculum Material) is made available to Users in accordancewith the Creative Commons Attribution-Non-Commercial 3.0Unported (CC BY-NC 3.0) License (http://creativecommons.org/licenses/by-nc/3.0/), as amended and updated by Creative Com-mons from time to time (the “CC License”), which is incorporatedherein by this reference.
Complete terms can be found at http://www.ck12.org/terms.
Printed: February 6, 2015
AUTHORJean Brainard, Ph.D.
www.ck12.org Chapter 1. Communities and Populations
CHAPTER 1 Communities andPopulations
CHAPTER OUTLINE
1.1 Community Interactions
1.2 Characteristics of Populations
1.3 Human Population Growth
1.4 The Biodiversity Crisis
1.5 Natural Resources and Climate Change
1.6 References
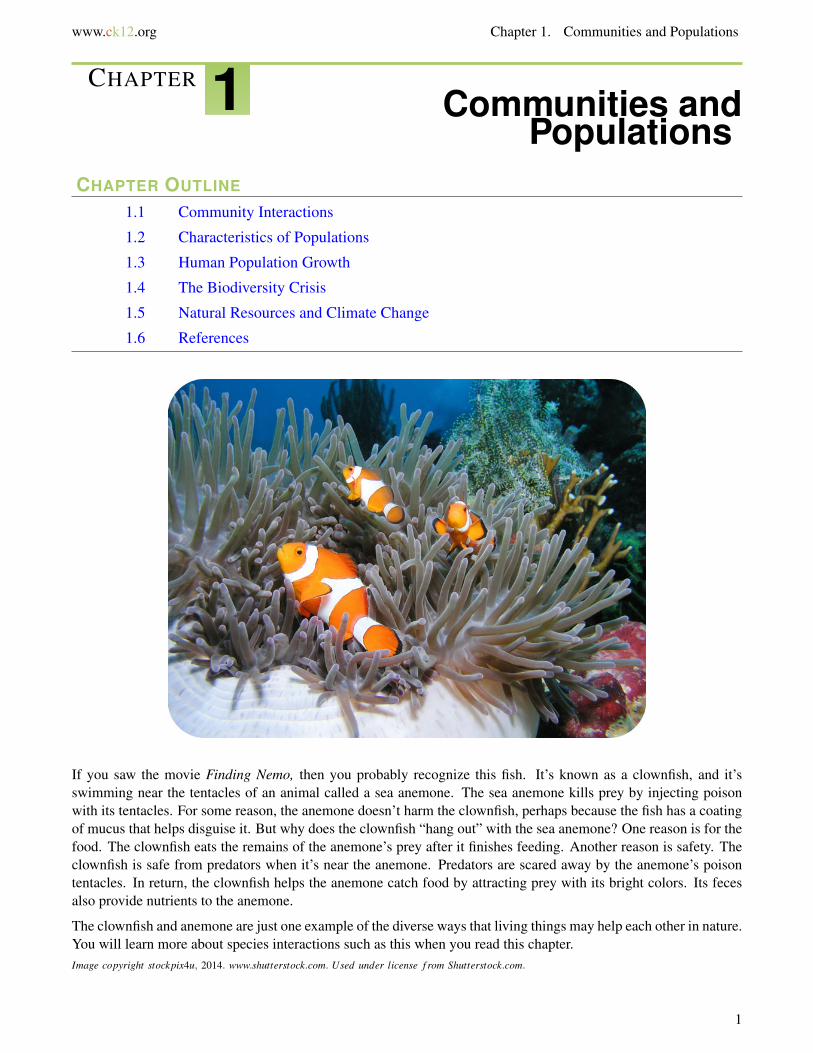
If you saw the movie Finding Nemo, then you probably recognize this fish. It’s known as a clownfish, and it’sswimming near the tentacles of an animal called a sea anemone. The sea anemone kills prey by injecting poisonwith its tentacles. For some reason, the anemone doesn’t harm the clownfish, perhaps because the fish has a coatingof mucus that helps disguise it. But why does the clownfish “hang out” with the sea anemone? One reason is for thefood. The clownfish eats the remains of the anemone’s prey after it finishes feeding. Another reason is safety. Theclownfish is safe from predators when it’s near the anemone. Predators are scared away by the anemone’s poisontentacles. In return, the clownfish helps the anemone catch food by attracting prey with its bright colors. Its fecesalso provide nutrients to the anemone.
The clownfish and anemone are just one example of the diverse ways that living things may help each other in nature.You will learn more about species interactions such as this when you read this chapter.Image copyright stockpix4u, 2014. www.shutterstock.com. Used under license f rom Shutterstock.com.
1
1.1. Community Interactions www.ck12.org
1.1 Community Interactions
Lesson Objectives
• Define community as the term is used in ecology.• Describe predation and its effects on population size and evolution.• Explain why interspecific competition leads to extinction or greater specialization.• Compare and contrast mutualism, commensalism, and parasitism.• Outline primary and secondary succession, and define climax community.
Vocabulary
• climax community• commensalism• ecological succession• host• interspecific competition• intraspecific competition• keystone species• limiting factor• mutualism• parasite• parasitism• pioneer species• predation• predator• prey• primary succession• secondary succession• specialization
Introduction
Biomes as different as deserts and wetlands share something very important. All biomes have populations ofinteracting species. Species also interact in the same basic ways in all biomes. For example, all biomes havesome species that prey on others for food. The focus of study of species interactions is the community.
2
www.ck12.org Chapter 1. Communities and Populations
What Is a Community?
A community is the biotic part of an ecosystem. It consists of all the populations of all the species in the same area.It also includes their interactions. Species interactions in communities are important factors in natural selection.They help shape the evolution of the interacting species. There are three major types of community interactions:predation, competition, and symbiosis.
Predation
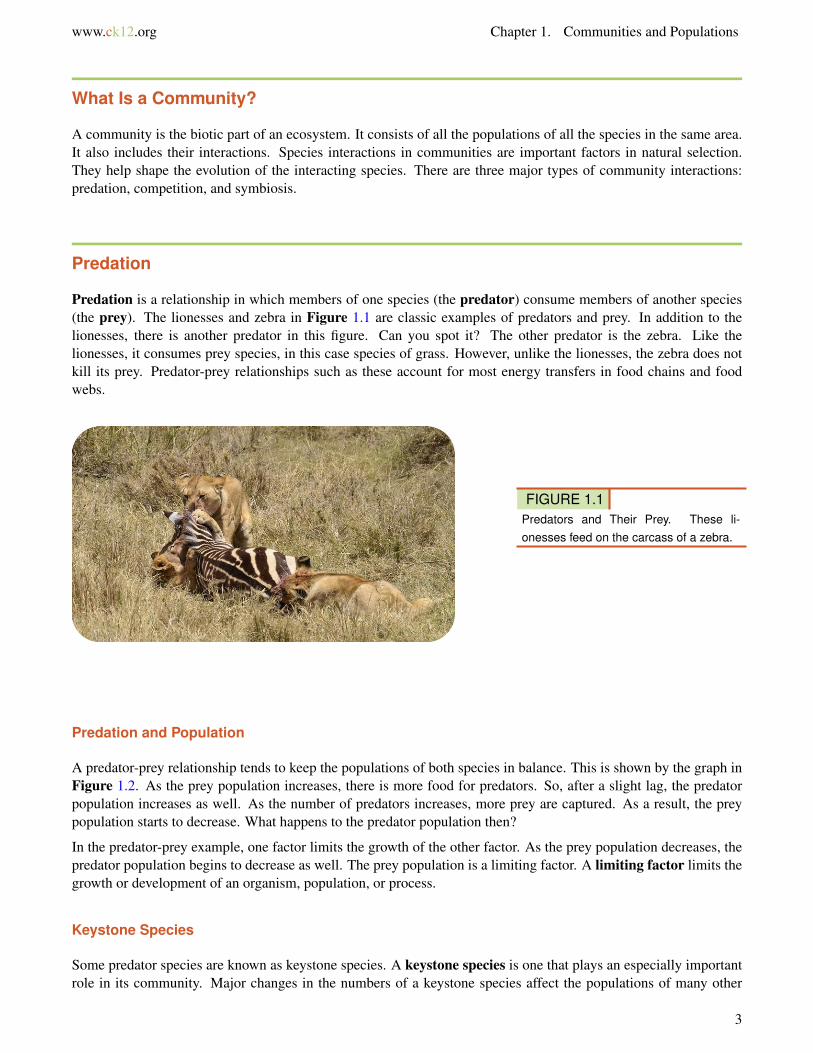
Predation is a relationship in which members of one species (the predator) consume members of another species(the prey). The lionesses and zebra in Figure 1.1 are classic examples of predators and prey. In addition to thelionesses, there is another predator in this figure. Can you spot it? The other predator is the zebra. Like thelionesses, it consumes prey species, in this case species of grass. However, unlike the lionesses, the zebra does notkill its prey. Predator-prey relationships such as these account for most energy transfers in food chains and foodwebs.
FIGURE 1.1Predators and Their Prey. These li-onesses feed on the carcass of a zebra.
Predation and Population
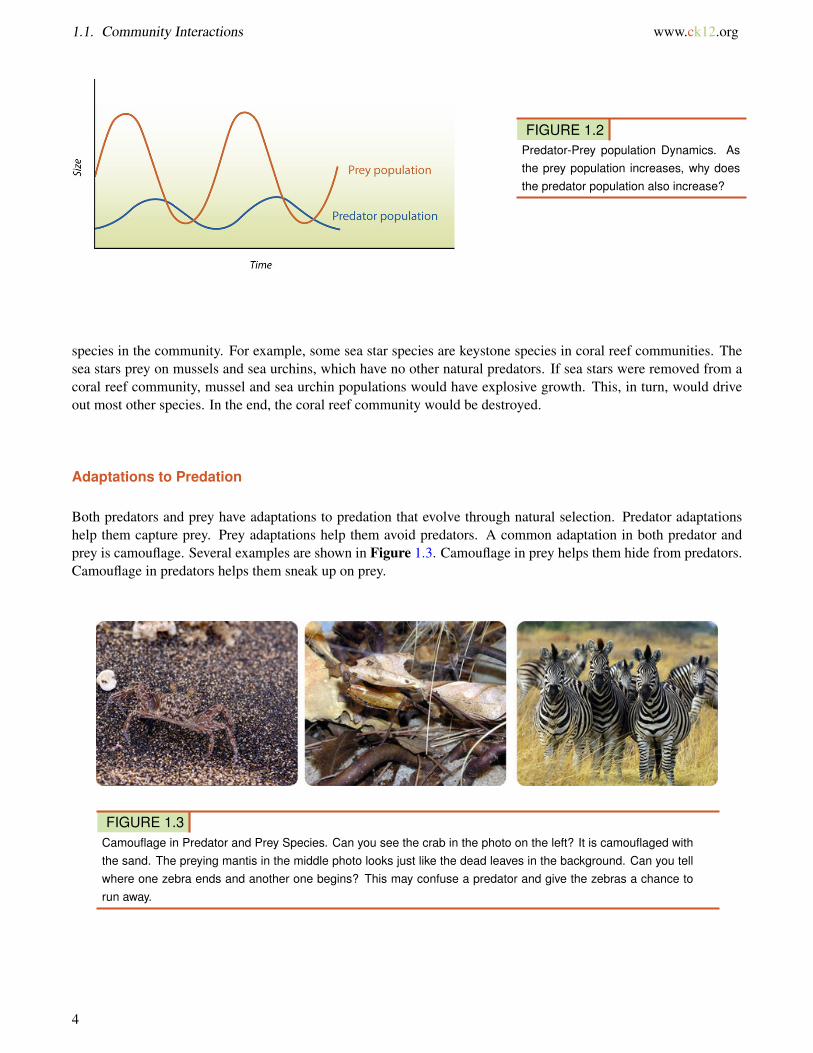
A predator-prey relationship tends to keep the populations of both species in balance. This is shown by the graph inFigure 1.2. As the prey population increases, there is more food for predators. So, after a slight lag, the predatorpopulation increases as well. As the number of predators increases, more prey are captured. As a result, the preypopulation starts to decrease. What happens to the predator population then?
In the predator-prey example, one factor limits the growth of the other factor. As the prey population decreases, thepredator population begins to decrease as well. The prey population is a limiting factor. A limiting factor limits thegrowth or development of an organism, population, or process.
Keystone Species
Some predator species are known as keystone species. A keystone species is one that plays an especially importantrole in its community. Major changes in the numbers of a keystone species affect the populations of many other
3
1.1. Community Interactions www.ck12.org
FIGURE 1.2Predator-Prey population Dynamics. Asthe prey population increases, why doesthe predator population also increase?
species in the community. For example, some sea star species are keystone species in coral reef communities. Thesea stars prey on mussels and sea urchins, which have no other natural predators. If sea stars were removed from acoral reef community, mussel and sea urchin populations would have explosive growth. This, in turn, would driveout most other species. In the end, the coral reef community would be destroyed.
Adaptations to Predation
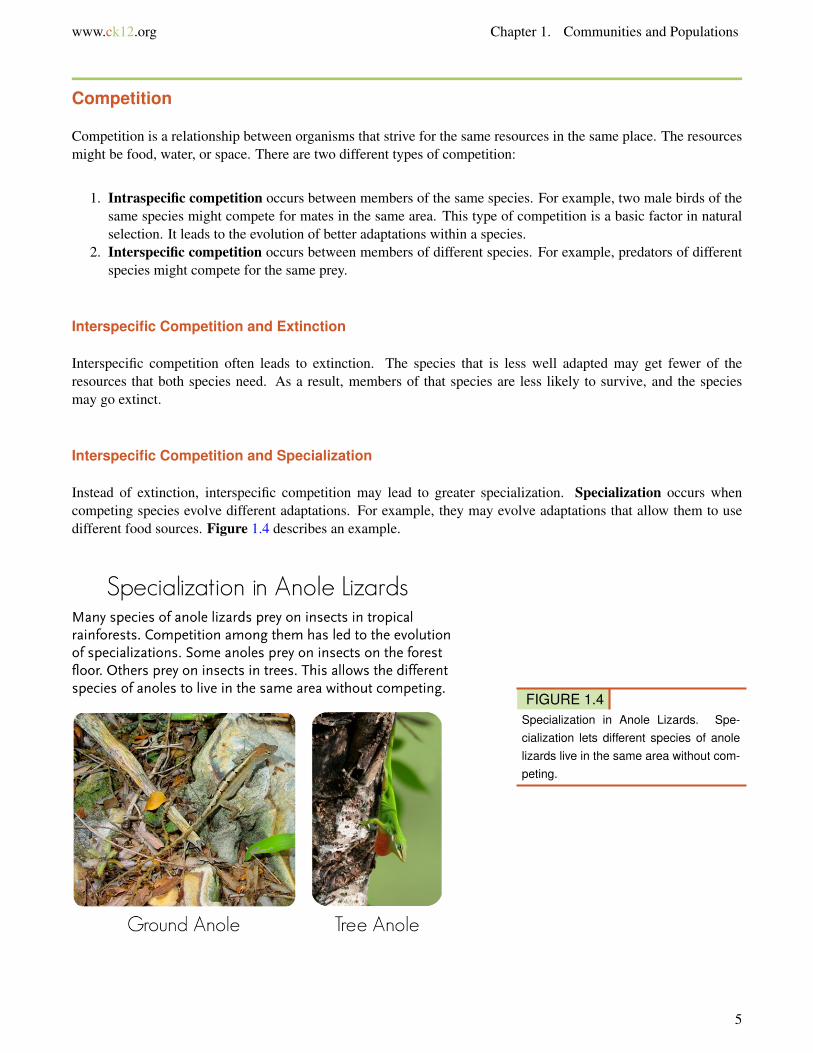
Both predators and prey have adaptations to predation that evolve through natural selection. Predator adaptationshelp them capture prey. Prey adaptations help them avoid predators. A common adaptation in both predator andprey is camouflage. Several examples are shown in Figure 1.3. Camouflage in prey helps them hide from predators.Camouflage in predators helps them sneak up on prey.
FIGURE 1.3Camouflage in Predator and Prey Species. Can you see the crab in the photo on the left? It is camouflaged withthe sand. The preying mantis in the middle photo looks just like the dead leaves in the background. Can you tellwhere one zebra ends and another one begins? This may confuse a predator and give the zebras a chance torun away.
4
www.ck12.org Chapter 1. Communities and Populations
Competition
Competition is a relationship between organisms that strive for the same resources in the same place. The resourcesmight be food, water, or space. There are two different types of competition:
1. Intraspecific competition occurs between members of the same species. For example, two male birds of thesame species might compete for mates in the same area. This type of competition is a basic factor in naturalselection. It leads to the evolution of better adaptations within a species.
2. Interspecific competition occurs between members of different species. For example, predators of differentspecies might compete for the same prey.
Interspecific Competition and Extinction
Interspecific competition often leads to extinction. The species that is less well adapted may get fewer of theresources that both species need. As a result, members of that species are less likely to survive, and the speciesmay go extinct.
Interspecific Competition and Specialization
Instead of extinction, interspecific competition may lead to greater specialization. Specialization occurs whencompeting species evolve different adaptations. For example, they may evolve adaptations that allow them to usedifferent food sources. Figure 1.4 describes an example.
FIGURE 1.4Specialization in Anole Lizards. Spe-cialization lets different species of anolelizards live in the same area without com-peting.
5
1.1. Community Interactions www.ck12.org
Symbiotic Relationships
Symbiosis is a close relationship between two species in which at least one species benefits. For the other species,the relationship may be positive, negative, or neutral. There are three basic types of symbiosis: mutualism, com-mensalism, and parasitism.
Mutualism
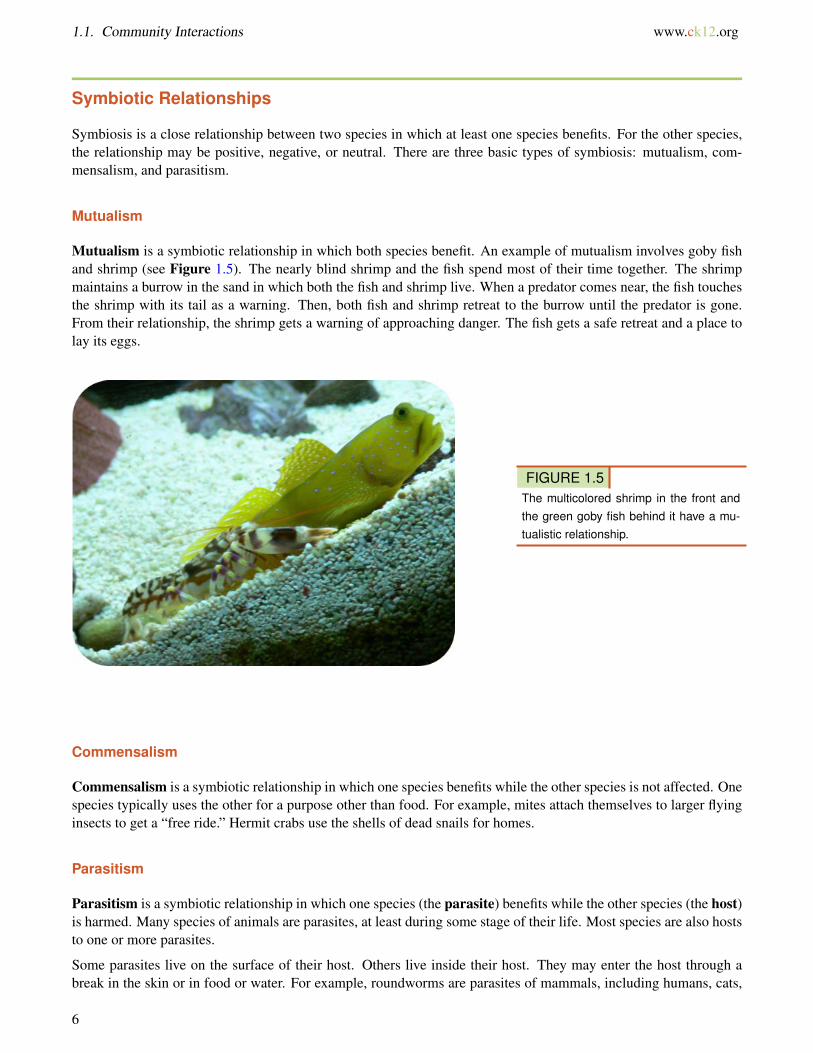
Mutualism is a symbiotic relationship in which both species benefit. An example of mutualism involves goby fishand shrimp (see Figure 1.5). The nearly blind shrimp and the fish spend most of their time together. The shrimpmaintains a burrow in the sand in which both the fish and shrimp live. When a predator comes near, the fish touchesthe shrimp with its tail as a warning. Then, both fish and shrimp retreat to the burrow until the predator is gone.From their relationship, the shrimp gets a warning of approaching danger. The fish gets a safe retreat and a place tolay its eggs.
FIGURE 1.5The multicolored shrimp in the front andthe green goby fish behind it have a mu-tualistic relationship.
Commensalism
Commensalism is a symbiotic relationship in which one species benefits while the other species is not affected. Onespecies typically uses the other for a purpose other than food. For example, mites attach themselves to larger flyinginsects to get a “free ride.” Hermit crabs use the shells of dead snails for homes.
Parasitism
Parasitism is a symbiotic relationship in which one species (the parasite) benefits while the other species (the host)is harmed. Many species of animals are parasites, at least during some stage of their life. Most species are also hoststo one or more parasites.
Some parasites live on the surface of their host. Others live inside their host. They may enter the host through abreak in the skin or in food or water. For example, roundworms are parasites of mammals, including humans, cats,
6
www.ck12.org Chapter 1. Communities and Populations
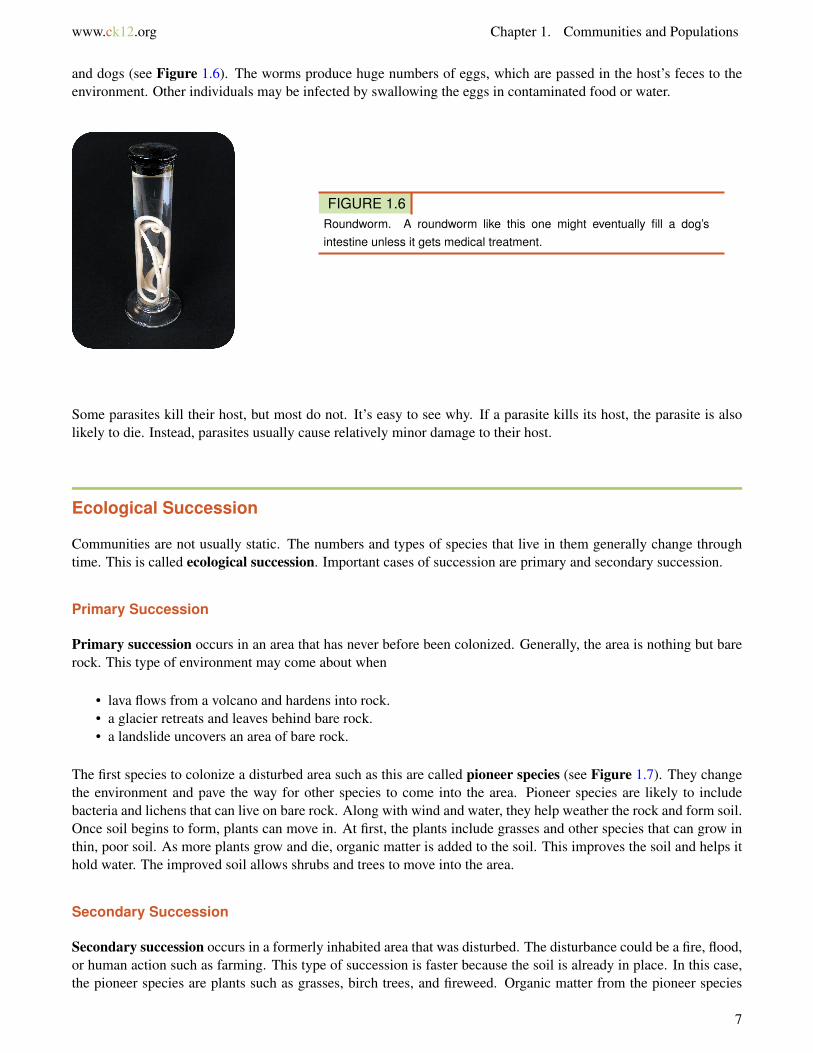
and dogs (see Figure 1.6). The worms produce huge numbers of eggs, which are passed in the host’s feces to theenvironment. Other individuals may be infected by swallowing the eggs in contaminated food or water.
FIGURE 1.6Roundworm. A roundworm like this one might eventually fill a dog’sintestine unless it gets medical treatment.
Some parasites kill their host, but most do not. It’s easy to see why. If a parasite kills its host, the parasite is alsolikely to die. Instead, parasites usually cause relatively minor damage to their host.
Ecological Succession
Communities are not usually static. The numbers and types of species that live in them generally change throughtime. This is called ecological succession. Important cases of succession are primary and secondary succession.
Primary Succession
Primary succession occurs in an area that has never before been colonized. Generally, the area is nothing but barerock. This type of environment may come about when
• lava flows from a volcano and hardens into rock.• a glacier retreats and leaves behind bare rock.• a landslide uncovers an area of bare rock.
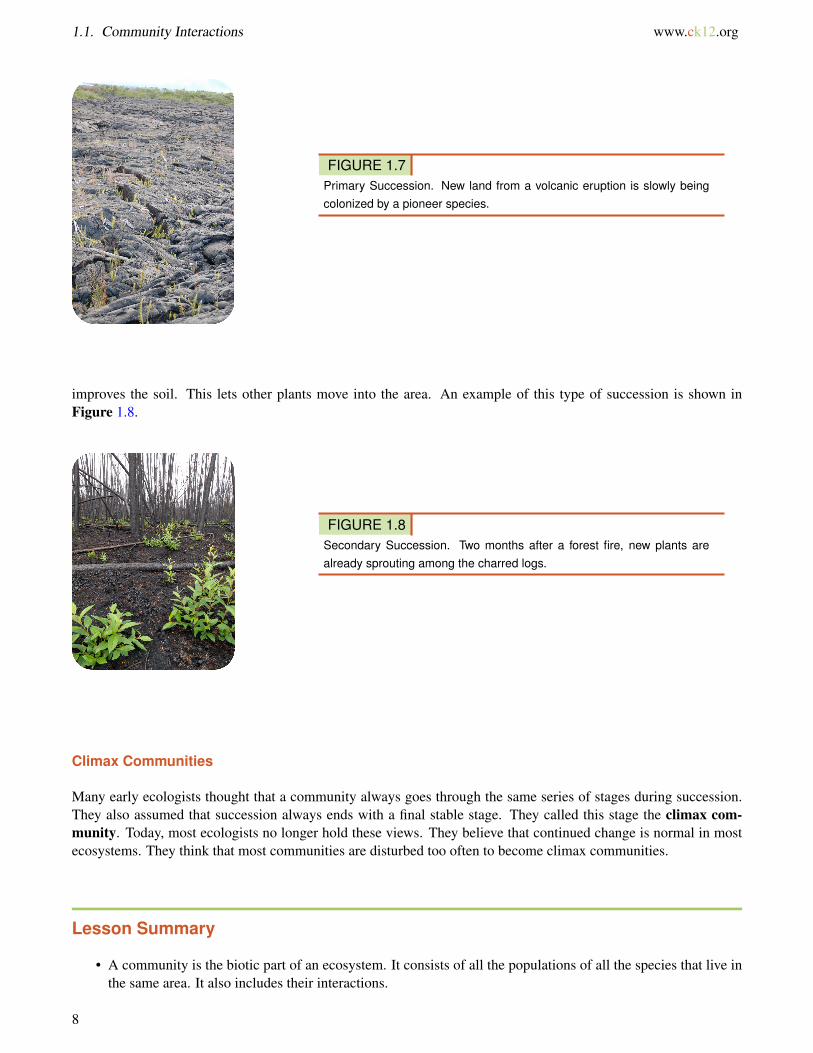
The first species to colonize a disturbed area such as this are called pioneer species (see Figure 1.7). They changethe environment and pave the way for other species to come into the area. Pioneer species are likely to includebacteria and lichens that can live on bare rock. Along with wind and water, they help weather the rock and form soil.Once soil begins to form, plants can move in. At first, the plants include grasses and other species that can grow inthin, poor soil. As more plants grow and die, organic matter is added to the soil. This improves the soil and helps ithold water. The improved soil allows shrubs and trees to move into the area.
Secondary Succession
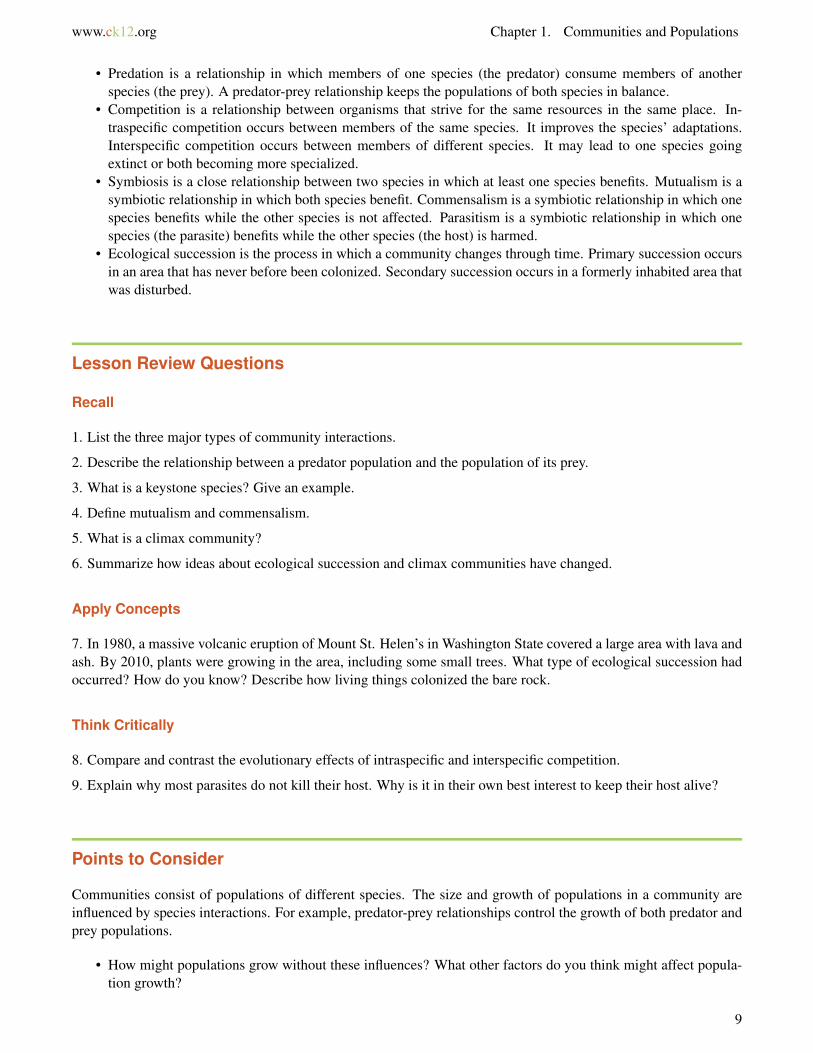
Secondary succession occurs in a formerly inhabited area that was disturbed. The disturbance could be a fire, flood,or human action such as farming. This type of succession is faster because the soil is already in place. In this case,the pioneer species are plants such as grasses, birch trees, and fireweed. Organic matter from the pioneer species
7
1.1. Community Interactions www.ck12.org
FIGURE 1.7Primary Succession. New land from a volcanic eruption is slowly beingcolonized by a pioneer species.
improves the soil. This lets other plants move into the area. An example of this type of succession is shown inFigure 1.8.
FIGURE 1.8Secondary Succession. Two months after a forest fire, new plants arealready sprouting among the charred logs.
Climax Communities
Many early ecologists thought that a community always goes through the same series of stages during succession.They also assumed that succession always ends with a final stable stage. They called this stage the climax com-munity. Today, most ecologists no longer hold these views. They believe that continued change is normal in mostecosystems. They think that most communities are disturbed too often to become climax communities.
Lesson Summary
• A community is the biotic part of an ecosystem. It consists of all the populations of all the species that live inthe same area. It also includes their interactions.
8
www.ck12.org Chapter 1. Communities and Populations
• Predation is a relationship in which members of one species (the predator) consume members of anotherspecies (the prey). A predator-prey relationship keeps the populations of both species in balance.
• Competition is a relationship between organisms that strive for the same resources in the same place. In-traspecific competition occurs between members of the same species. It improves the species’ adaptations.Interspecific competition occurs between members of different species. It may lead to one species goingextinct or both becoming more specialized.
• Symbiosis is a close relationship between two species in which at least one species benefits. Mutualism is asymbiotic relationship in which both species benefit. Commensalism is a symbiotic relationship in which onespecies benefits while the other species is not affected. Parasitism is a symbiotic relationship in which onespecies (the parasite) benefits while the other species (the host) is harmed.
• Ecological succession is the process in which a community changes through time. Primary succession occursin an area that has never before been colonized. Secondary succession occurs in a formerly inhabited area thatwas disturbed.
Lesson Review Questions
Recall
1. List the three major types of community interactions.
2. Describe the relationship between a predator population and the population of its prey.
3. What is a keystone species? Give an example.
4. Define mutualism and commensalism.
5. What is a climax community?
6. Summarize how ideas about ecological succession and climax communities have changed.
Apply Concepts
7. In 1980, a massive volcanic eruption of Mount St. Helen’s in Washington State covered a large area with lava andash. By 2010, plants were growing in the area, including some small trees. What type of ecological succession hadoccurred? How do you know? Describe how living things colonized the bare rock.
Think Critically
8. Compare and contrast the evolutionary effects of intraspecific and interspecific competition.
9. Explain why most parasites do not kill their host. Why is it in their own best interest to keep their host alive?
Points to Consider
Communities consist of populations of different species. The size and growth of populations in a community areinfluenced by species interactions. For example, predator-prey relationships control the growth of both predator andprey populations.
• How might populations grow without these influences? What other factors do you think might affect popula-tion growth?
9

1.1. Community Interactions www.ck12.org
• What factors do you think may have affected the growth of the human population?
10
www.ck12.org Chapter 1. Communities and Populations
1.2 Characteristics of Populations
Lesson Objectives
• Define population size, density, and dispersion.• Relate population pyramids and survivorship curves to population structure.• Identify factors that determine population growth rate.• Compare and contrast exponential and logistic growth.
Vocabulary
• age-sex structure• carrying capacity (K)• dispersal• emigration• exponential growth• immigration• K-selected• logistic growth• migration• population density• population distribution• population growth rate (r)• population pyramid• r-selected• survivorship curve
Introduction
Communities are made up of populations of different species. In biology, a population is a group of organisms ofthe same species that live in the same area. The population is the unit of natural selection and evolution. How largea population is and how fast it is growing are often used as measures of its health.
Population Size, Density, and Distribution
Population size is the number of individuals in a population. For example, a population of insects might consist of100 individual insects, or many more. Population size influences the chances of a species surviving or going extinct.Generally, very small populations are at greatest risk of extinction. However, the size of a population may be lessimportant than its density.
11
1.2. Characteristics of Populations www.ck12.org
Population Density
Population density is the average number of individuals in a population per unit of area or volume. For example, apopulation of 100 insects that live in an area of 100 square meters has a density of 1 insect per square meter. If thesame population lives in an area of only 1 square meter, what is its density? Which population is more crowded?How might crowding affect the health of a population?
Population Distribution
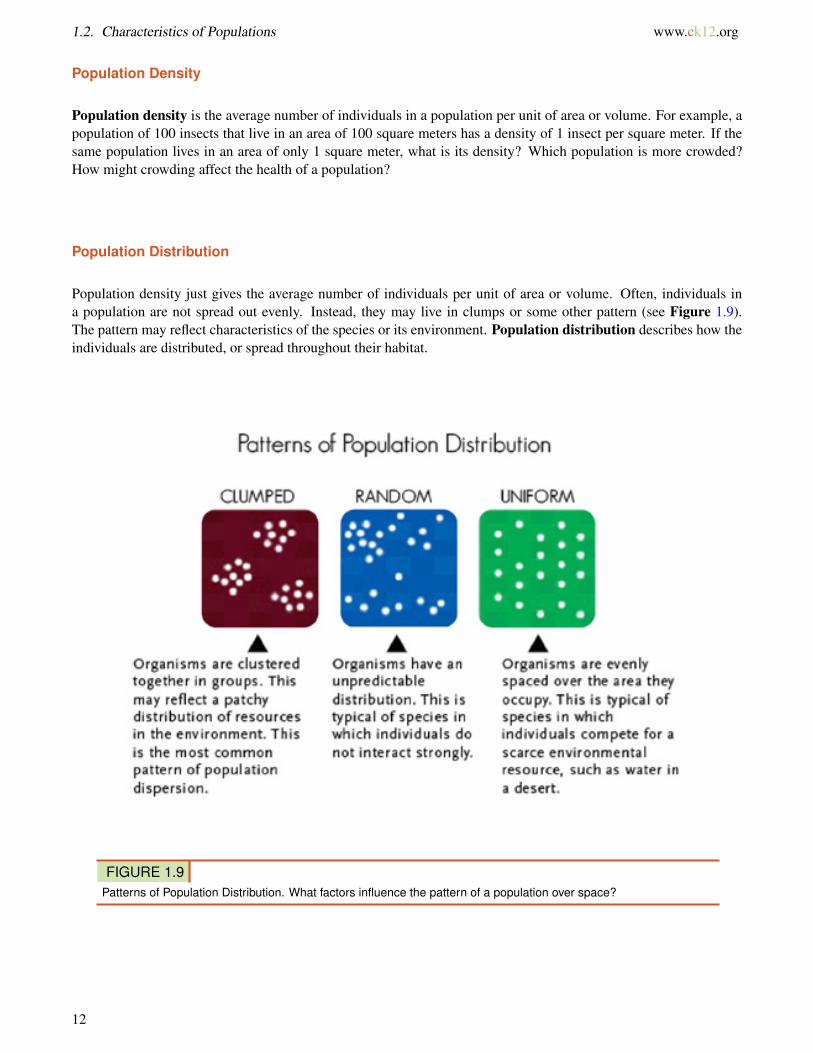
Population density just gives the average number of individuals per unit of area or volume. Often, individuals ina population are not spread out evenly. Instead, they may live in clumps or some other pattern (see Figure 1.9).The pattern may reflect characteristics of the species or its environment. Population distribution describes how theindividuals are distributed, or spread throughout their habitat.
FIGURE 1.9Patterns of Population Distribution. What factors influence the pattern of a population over space?
12
www.ck12.org Chapter 1. Communities and Populations
Population Structure
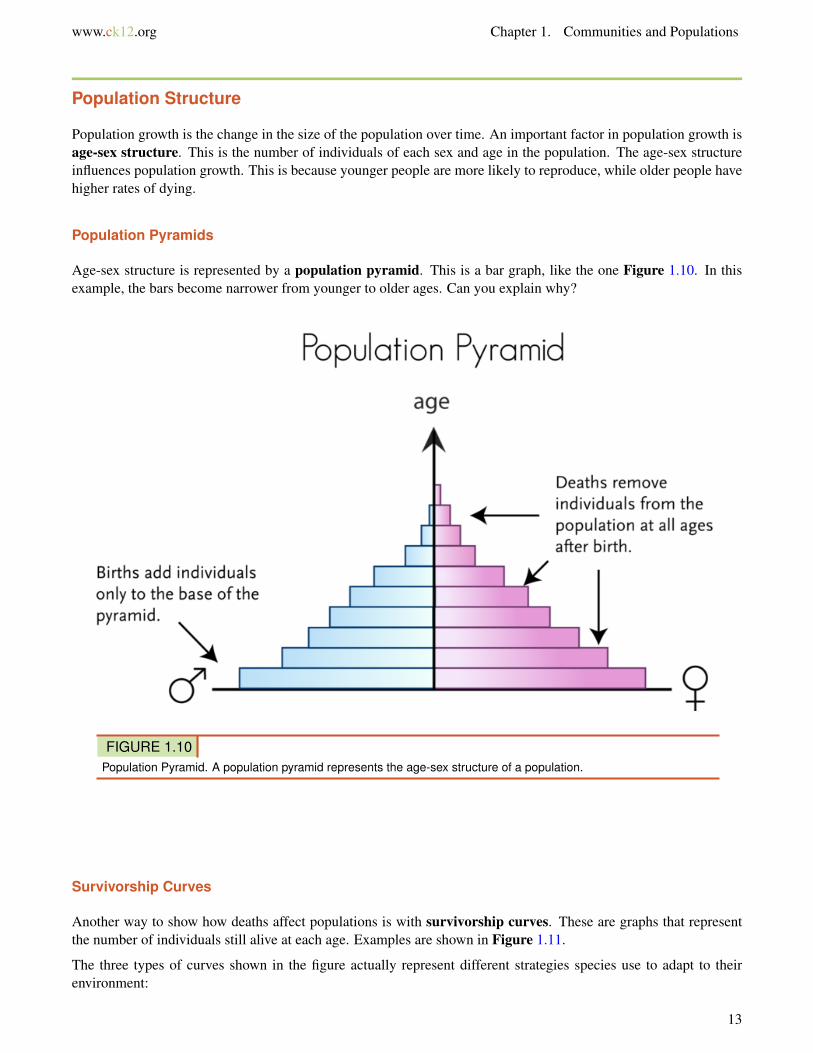
Population growth is the change in the size of the population over time. An important factor in population growth isage-sex structure. This is the number of individuals of each sex and age in the population. The age-sex structureinfluences population growth. This is because younger people are more likely to reproduce, while older people havehigher rates of dying.
Population Pyramids
Age-sex structure is represented by a population pyramid. This is a bar graph, like the one Figure 1.10. In thisexample, the bars become narrower from younger to older ages. Can you explain why?
FIGURE 1.10Population Pyramid. A population pyramid represents the age-sex structure of a population.
Survivorship Curves
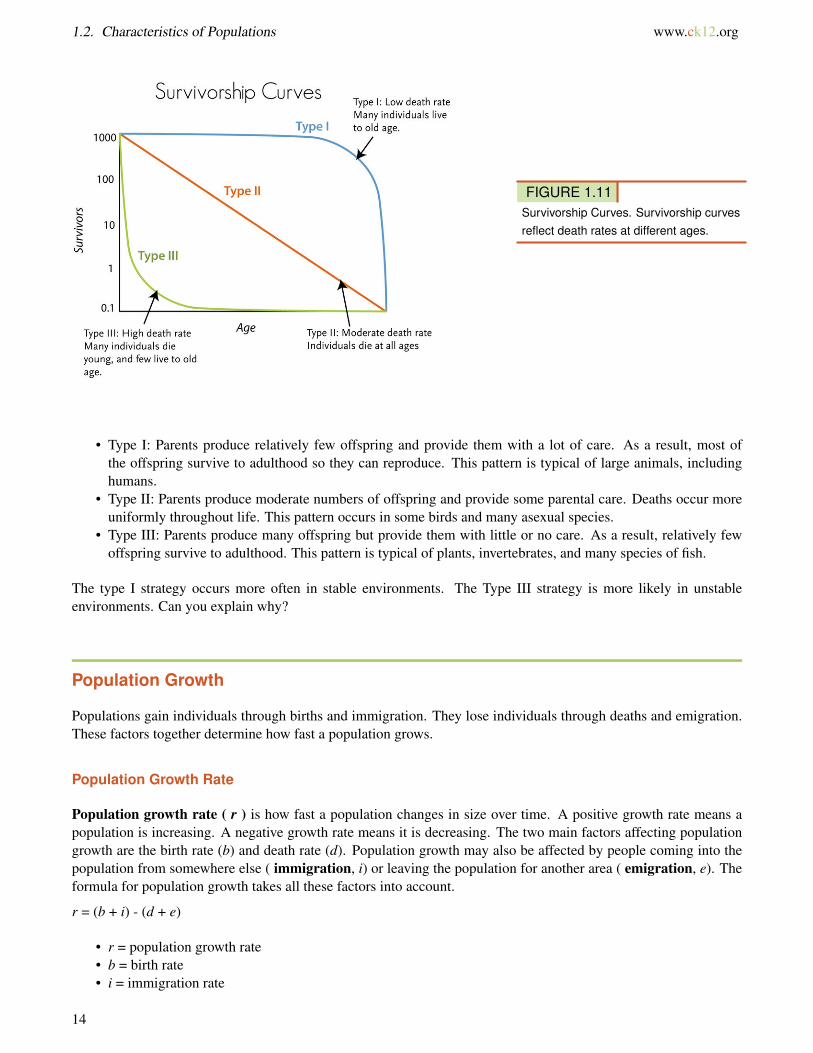
Another way to show how deaths affect populations is with survivorship curves. These are graphs that representthe number of individuals still alive at each age. Examples are shown in Figure 1.11.
The three types of curves shown in the figure actually represent different strategies species use to adapt to theirenvironment:
13
1.2. Characteristics of Populations www.ck12.org
FIGURE 1.11Survivorship Curves. Survivorship curvesreflect death rates at different ages.
• Type I: Parents produce relatively few offspring and provide them with a lot of care. As a result, most ofthe offspring survive to adulthood so they can reproduce. This pattern is typical of large animals, includinghumans.
• Type II: Parents produce moderate numbers of offspring and provide some parental care. Deaths occur moreuniformly throughout life. This pattern occurs in some birds and many asexual species.
• Type III: Parents produce many offspring but provide them with little or no care. As a result, relatively fewoffspring survive to adulthood. This pattern is typical of plants, invertebrates, and many species of fish.
The type I strategy occurs more often in stable environments. The Type III strategy is more likely in unstableenvironments. Can you explain why?
Population Growth
Populations gain individuals through births and immigration. They lose individuals through deaths and emigration.These factors together determine how fast a population grows.
Population Growth Rate
Population growth rate ( r ) is how fast a population changes in size over time. A positive growth rate means apopulation is increasing. A negative growth rate means it is decreasing. The two main factors affecting populationgrowth are the birth rate (b) and death rate (d). Population growth may also be affected by people coming into thepopulation from somewhere else ( immigration, i) or leaving the population for another area ( emigration, e). Theformula for population growth takes all these factors into account.
r = (b + i) - (d + e)
• r = population growth rate• b = birth rate• i = immigration rate
14
www.ck12.org Chapter 1. Communities and Populations
• d = death rate• e = emigration rate
Two lectures on demography are available at http://www.youtube.com/watch?v=3diw1Hu3auk (50:36) and http://www.youtube.com/watch?v=Wg3ESbyKbic (49:38).
Dispersal and Migration
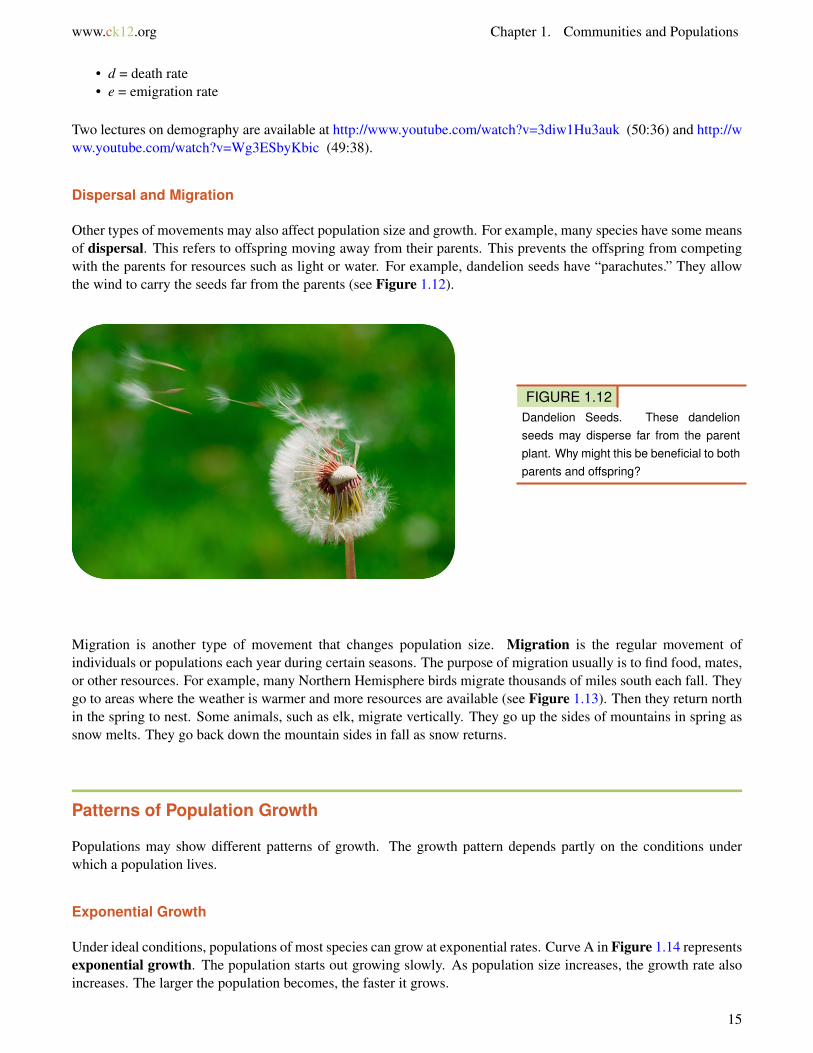
Other types of movements may also affect population size and growth. For example, many species have some meansof dispersal. This refers to offspring moving away from their parents. This prevents the offspring from competingwith the parents for resources such as light or water. For example, dandelion seeds have “parachutes.” They allowthe wind to carry the seeds far from the parents (see Figure 1.12).
FIGURE 1.12Dandelion Seeds. These dandelionseeds may disperse far from the parentplant. Why might this be beneficial to bothparents and offspring?
Migration is another type of movement that changes population size. Migration is the regular movement ofindividuals or populations each year during certain seasons. The purpose of migration usually is to find food, mates,or other resources. For example, many Northern Hemisphere birds migrate thousands of miles south each fall. Theygo to areas where the weather is warmer and more resources are available (see Figure 1.13). Then they return northin the spring to nest. Some animals, such as elk, migrate vertically. They go up the sides of mountains in spring assnow melts. They go back down the mountain sides in fall as snow returns.
Patterns of Population Growth
Populations may show different patterns of growth. The growth pattern depends partly on the conditions underwhich a population lives.
Exponential Growth
Under ideal conditions, populations of most species can grow at exponential rates. Curve A in Figure 1.14 representsexponential growth. The population starts out growing slowly. As population size increases, the growth rate alsoincreases. The larger the population becomes, the faster it grows.
15

1.2. Characteristics of Populations www.ck12.org
FIGURE 1.13Swainson’s hawks migrate from North toSouth America and back again each year.This map shows where individual hawkshave been identified during their migra-tion.
FIGURE 1.14Exponential and Logistic Growth. CurveA shows exponential growth. Curve Bshows logistic growth.
16
www.ck12.org Chapter 1. Communities and Populations
Logistic Growth
Most populations do not live under ideal conditions. Therefore, most do not grow exponentially. Certainly, nopopulation can keep growing exponentially for very long. Many factors may limit growth. Often, the factors aredensity dependent. These are factors that kick in when the population becomes too large and crowded. For example,the population may start to run out of food or be poisoned by its own wastes. As a result, population growth slowsand population size levels off. Curve B in Figure 1.14 represents this pattern of growth, which is called logisticgrowth.
At what population size does growth start to slow in the logistic model of growth? That depends on the population’scarrying capacity (see Figure 1.14). The carrying capacity (K) is the largest population size that can be supportedin an area without harming the environment. Population growth hits a ceiling at that size in the logistic growthmodel.
Species can be divided into two basic types when it comes to how their populations grow.
• Species that live in stable environments are likely to be K -selected. Their population growth is controlledby density-dependent factors. Population size is generally at or near the carrying capacity. These species arerepresented by curve B in Figure 1.14.
• Species that live in unstable environments are likely to r -selected. Their potential population growth is rapid.For example, they have large numbers of offspring. However, individuals are likely to die young. Thus,population size is usually well below the carrying capacity. These species are represented by the lower part ofcurve A in Figure 1.14.
Lesson Summary
• Population size is the number of individuals in a population. Population density is the average number ofindividuals per unit of area or volume. The pattern of spacing of individuals in a population may be affectedby characteristics of a species or its environment.
• The age-sex structure of a population is the number of individuals of each sex and age in the population.Age-sex structure influences population growth. It is represented by a population pyramid. The number ofsurvivors at each age is plotted on a survivorship curve.
• Population growth rate is how fast a population changes in size over time. It is determined by rates of birth,death, immigration, and emigration.
• Under ideal conditions, populations can grow exponentially. The growth rate increases as the population getslarger. Most populations do not live under ideal conditions and grow logistically instead. Density-dependentfactors slow population growth as population size nears the carrying capacity.
Lesson Review Questions
Recall
1. What is population density?
2. Define immigration and emigration.
17
1.2. Characteristics of Populations www.ck12.org
3. What is migration? Give an example.
4. Write the formula for the population growth rate. Identify all the variables.
5. State why dispersal of offspring away from their parents might be beneficial.
6. Describe exponential population growth.
7. What are K-selected and r-selected species?
Apply Concepts
8. A population of 820 insects lives in a 1.2-acre area. They gather nectar from a population of 560 flowering plants.The plants live in a 0.2-acre area. Which population has greater density, the insects or the plants?
9. Assume that a population pyramid has a very broad base. What does that tell you about the population itrepresents?
Think Critically
10. What can you infer about a species that has a random pattern of distribution over space? A uniform pattern?
11. Compare and contrast Type I and Type III survivorship curves.
Points to Consider
Human populations have an interesting history that you will read about in the next lesson. You just read aboutpopulation dispersion and growth. Make some predictions about dispersion and growth in human populations:
• Do you think human populations have a clumped, random, or uniform dispersion?• How fast do human populations grow? What might limit their growth?
18
www.ck12.org Chapter 1. Communities and Populations
1.3 Human Population Growth
Lesson Objectives
• Describe early human population growth.• Outline the stages of the demographic transition.• Explain trends in recent human population growth.• Summarize the human population problem and possible solutions to the problem.
Vocabulary
• demographic transition
Introduction
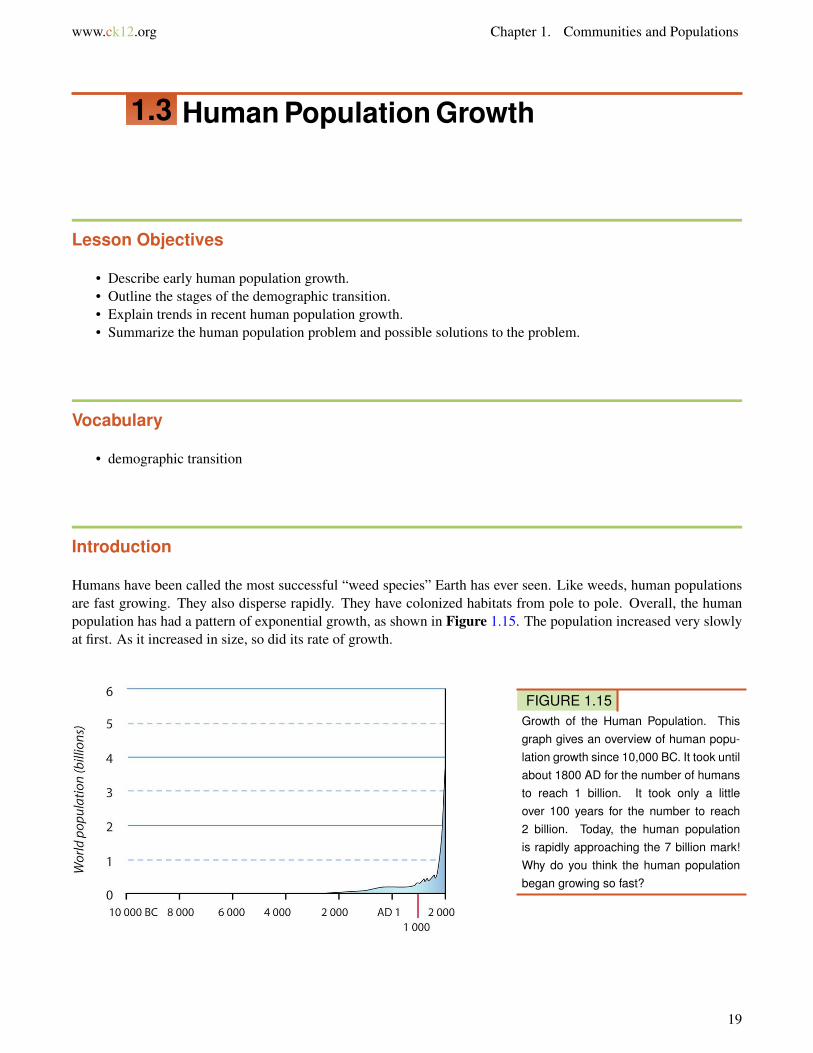
Humans have been called the most successful “weed species” Earth has ever seen. Like weeds, human populationsare fast growing. They also disperse rapidly. They have colonized habitats from pole to pole. Overall, the humanpopulation has had a pattern of exponential growth, as shown in Figure 1.15. The population increased very slowlyat first. As it increased in size, so did its rate of growth.
FIGURE 1.15Growth of the Human Population. Thisgraph gives an overview of human popu-lation growth since 10,000 BC. It took untilabout 1800 AD for the number of humansto reach 1 billion. It took only a littleover 100 years for the number to reach2 billion. Today, the human populationis rapidly approaching the 7 billion mark!Why do you think the human populationbegan growing so fast?
19
1.3. Human Population Growth www.ck12.org
Early Population Growth
Homo sapiens arose about 200,000 years ago in Africa. Early humans lived in small populations of nomadic huntersand gatherers. They first left Africa about 40,000 years ago. They soon moved throughout Europe, Asia, andAustralia. By 10,000 years ago, they had reached the Americas. During this long period, birth and death rates wereboth fairly high. As a result, population growth was slow.
Humans invented agriculture about 10,000 years ago. This provided a bigger, more dependable food supply. It alsolet them settle down in villages and cities for the first time. The death rate increased because of diseases associatedwith domestic animals and crowded living conditions. The birth rate increased because there was more food andsettled life offered other advantages. The combined effect was continued slow population growth.
Demographic Transition
Major changes in the human population first began during the 1700s in Europe and North America. First death ratesfell, followed somewhat later by birth rates.
Death Rates Fall
Several advances in science and technology led to lower death rates in 18th century Europe and North America:
• New scientific knowledge of the causes of disease led to improved water supplies, sewers, and personalhygiene.
• Better farming techniques and machines increased the food supply.• The Industrial Revolution of the 1800s led to new sources of energy, such as coal and electricity. This increased
the efficiency of the new agricultural machines. It also led to train transport, which improved the distributionof food.
For all these reasons, death rates fell, especially in children. This allowed many more children to survive toadulthood, so birth rates increased. As the gap between birth and death rates widened, the human population grewfaster.
Birth Rates Fall
It wasn’t long before birth rates started to fall as well in Europe and North America. People started having fewerchildren because large families were no longer beneficial for several reasons.
• As child death rates fell and machines did more work, farming families no longer needed to have as manychildren to work in the fields.
• Laws were passed that required children to go to school. Therefore, they could no longer work and contributeto their own support. They became a drain on the family’s income.
Eventually, birth rates fell to match death rates. As a result, population growth slowed to nearly zero.
Stages of the Demographic Transition
These changes in population that occurred in Europe and North America have been called the demographic transi-tion. The transition can be summarized in the following four stages, which are illustrated in Figure 1.16:
20
www.ck12.org Chapter 1. Communities and Populations
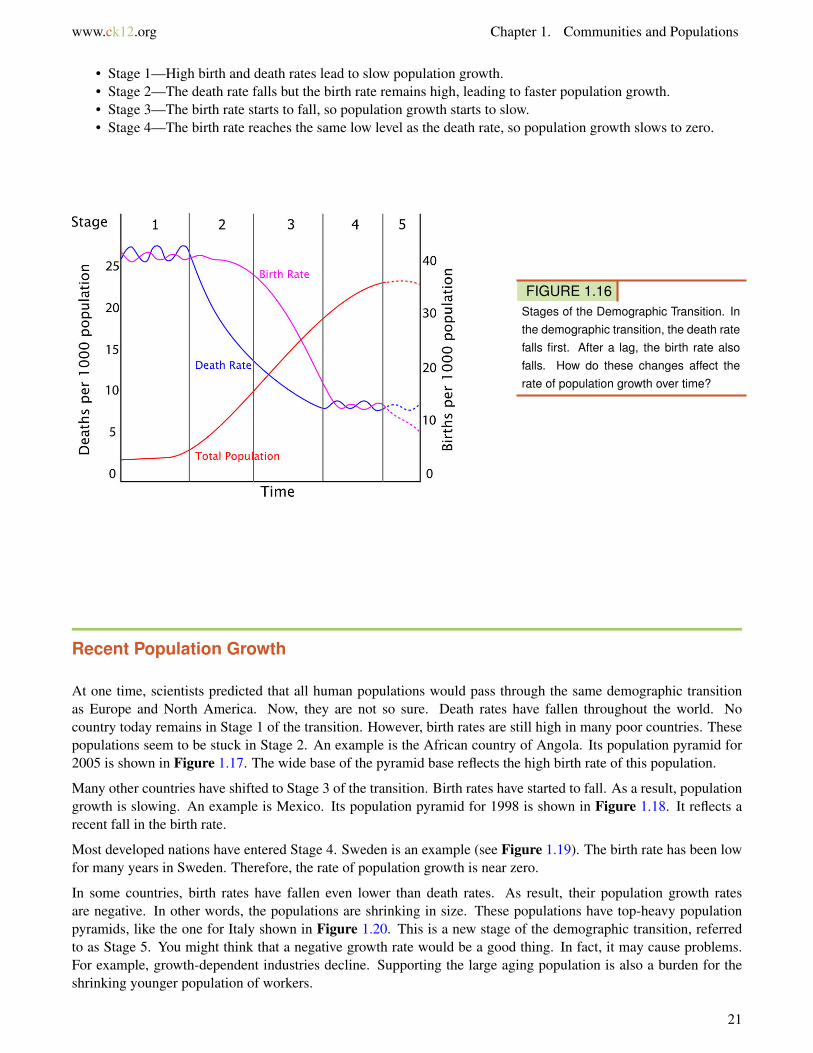
• Stage 1—High birth and death rates lead to slow population growth.• Stage 2—The death rate falls but the birth rate remains high, leading to faster population growth.• Stage 3—The birth rate starts to fall, so population growth starts to slow.• Stage 4—The birth rate reaches the same low level as the death rate, so population growth slows to zero.
FIGURE 1.16Stages of the Demographic Transition. Inthe demographic transition, the death ratefalls first. After a lag, the birth rate alsofalls. How do these changes affect therate of population growth over time?
Recent Population Growth
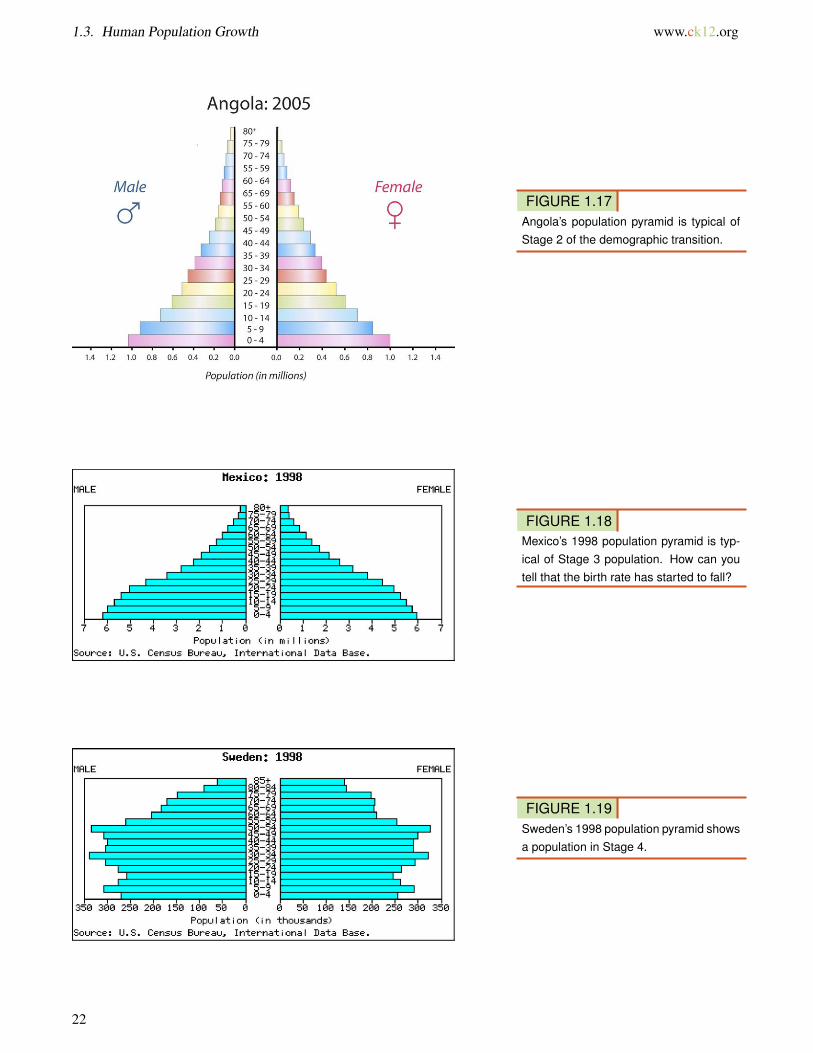
At one time, scientists predicted that all human populations would pass through the same demographic transitionas Europe and North America. Now, they are not so sure. Death rates have fallen throughout the world. Nocountry today remains in Stage 1 of the transition. However, birth rates are still high in many poor countries. Thesepopulations seem to be stuck in Stage 2. An example is the African country of Angola. Its population pyramid for2005 is shown in Figure 1.17. The wide base of the pyramid base reflects the high birth rate of this population.
Many other countries have shifted to Stage 3 of the transition. Birth rates have started to fall. As a result, populationgrowth is slowing. An example is Mexico. Its population pyramid for 1998 is shown in Figure 1.18. It reflects arecent fall in the birth rate.
Most developed nations have entered Stage 4. Sweden is an example (see Figure 1.19). The birth rate has been lowfor many years in Sweden. Therefore, the rate of population growth is near zero.
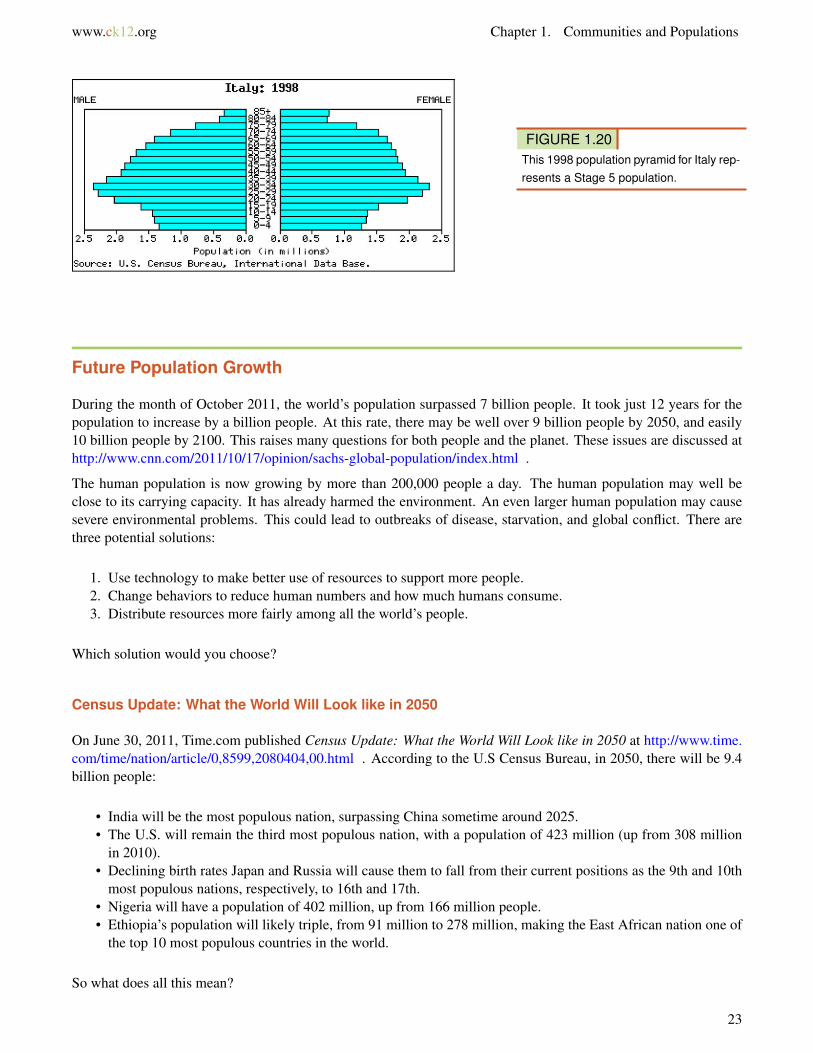
In some countries, birth rates have fallen even lower than death rates. As result, their population growth ratesare negative. In other words, the populations are shrinking in size. These populations have top-heavy populationpyramids, like the one for Italy shown in Figure 1.20. This is a new stage of the demographic transition, referredto as Stage 5. You might think that a negative growth rate would be a good thing. In fact, it may cause problems.For example, growth-dependent industries decline. Supporting the large aging population is also a burden for theshrinking younger population of workers.
21
1.3. Human Population Growth www.ck12.org
FIGURE 1.17Angola’s population pyramid is typical ofStage 2 of the demographic transition.
FIGURE 1.18Mexico’s 1998 population pyramid is typ-ical of Stage 3 population. How can youtell that the birth rate has started to fall?
FIGURE 1.19Sweden’s 1998 population pyramid showsa population in Stage 4.
22
www.ck12.org Chapter 1. Communities and Populations
FIGURE 1.20This 1998 population pyramid for Italy rep-resents a Stage 5 population.
Future Population Growth
During the month of October 2011, the world’s population surpassed 7 billion people. It took just 12 years for thepopulation to increase by a billion people. At this rate, there may be well over 9 billion people by 2050, and easily10 billion people by 2100. This raises many questions for both people and the planet. These issues are discussed athttp://www.cnn.com/2011/10/17/opinion/sachs-global-population/index.html .
The human population is now growing by more than 200,000 people a day. The human population may well beclose to its carrying capacity. It has already harmed the environment. An even larger human population may causesevere environmental problems. This could lead to outbreaks of disease, starvation, and global conflict. There arethree potential solutions:
1. Use technology to make better use of resources to support more people.2. Change behaviors to reduce human numbers and how much humans consume.3. Distribute resources more fairly among all the world’s people.
Which solution would you choose?
Census Update: What the World Will Look like in 2050
On June 30, 2011, Time.com published Census Update: What the World Will Look like in 2050 at http://www.time.com/time/nation/article/0,8599,2080404,00.html . According to the U.S Census Bureau, in 2050, there will be 9.4billion people:
• India will be the most populous nation, surpassing China sometime around 2025.• The U.S. will remain the third most populous nation, with a population of 423 million (up from 308 million
in 2010).• Declining birth rates Japan and Russia will cause them to fall from their current positions as the 9th and 10th
most populous nations, respectively, to 16th and 17th.• Nigeria will have a population of 402 million, up from 166 million people.• Ethiopia’s population will likely triple, from 91 million to 278 million, making the East African nation one of
the top 10 most populous countries in the world.
So what does all this mean?
23
1.3. Human Population Growth www.ck12.org
• The African continent is expected to experience significant population growth in the coming decades, whichcould compound the already-problematic food-supply issues in some African nations.
• Immigration and differing birth rates among races will change the ethnic composition of the U.S.• Population booms in Africa and India, the decline of Russia and the expected plateau of China will all change
the makeup of the estimated 9.4 billion people who will call Earth home in 2050.
Lesson Summary
• Early humans lived in small populations of nomadic hunters and gatherers. Both birth and death rates werefairly high. As a result, human population growth was very slow. The invention of agriculture increased bothbirth and death rates. The population continued to grow slowly.
• Major changes in the human population first began during the 1700s. This occurred in Europe and NorthAmerica. First, death rates fell while birth rates remained high. This led to rapid population growth. Later,birth rates also fell. As a result, population growth slowed.
• Other countries have completed a similar demographic transition. However, some countries seem stalled atearly stages. They have high birth rates and rapidly growing populations.
• The total human population may have to stop growing eventually. Even if we reduce our use of resources anddistribute them more fairly, at some point the carrying capacity will be reached.
Lesson Review Questions
Recall
1. How did the invention of agriculture affect human birth and death rates? How did it affect human populationgrowth?
2. Outline the four stages of the demographic transition as it occurred in Europe and North America.
3. State two reasons why death rates fell in Europe and North America, starting in the 1700s.
4. Why did birth rates fall in Europe and North America during the demographic transition?
5. Why was a fifth stage added to the demographic transition model? Describe a population at this stage.
Apply Concepts
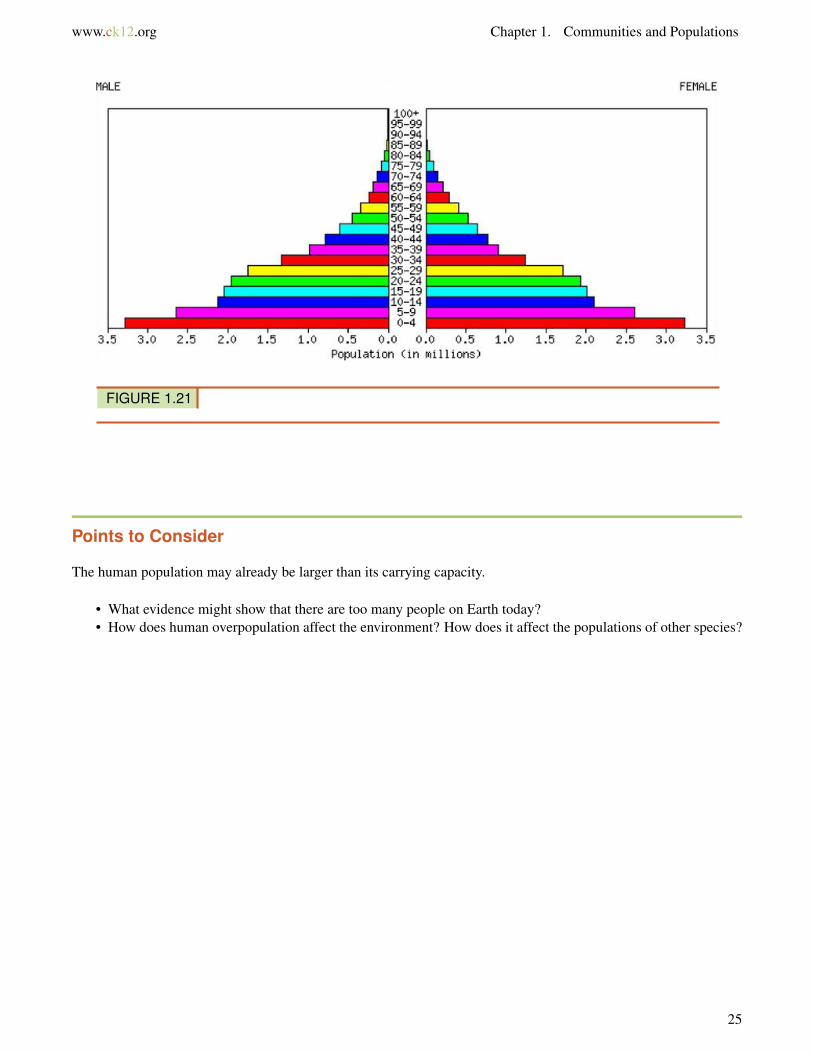
6. Which stage of the demographic transition is represented by the population pyramid in the Figure 1.21?
7. Assume you will add a line to the graph in Figure 1.16 to represent the population growth rate (r). Describe whatthe line would look like.
Think Critically
8. Evaluate how well the original demographic transition model represents human populations today.
9. What is the human population problem? What are some potential solutions? Which solution do you think is best?Present a logical argument to support your choice.
24
www.ck12.org Chapter 1. Communities and Populations
FIGURE 1.21
Points to Consider
The human population may already be larger than its carrying capacity.
• What evidence might show that there are too many people on Earth today?• How does human overpopulation affect the environment? How does it affect the populations of other species?
25
1.4. The Biodiversity Crisis www.ck12.org
1.4 The Biodiversity Crisis
Lesson Objectives
• Define biodiversity.• Identify economic benefits and ecosystem services of biodiversity.• Relate human actions to the sixth mass extinction.
Vocabulary
• exotic species• habitat loss• sixth mass extinction
Introduction
One of the effects of human overpopulation is the loss of other species. The rapidly growing human population hasreduced Earth’s biodiversity.
What Is Biodiversity?
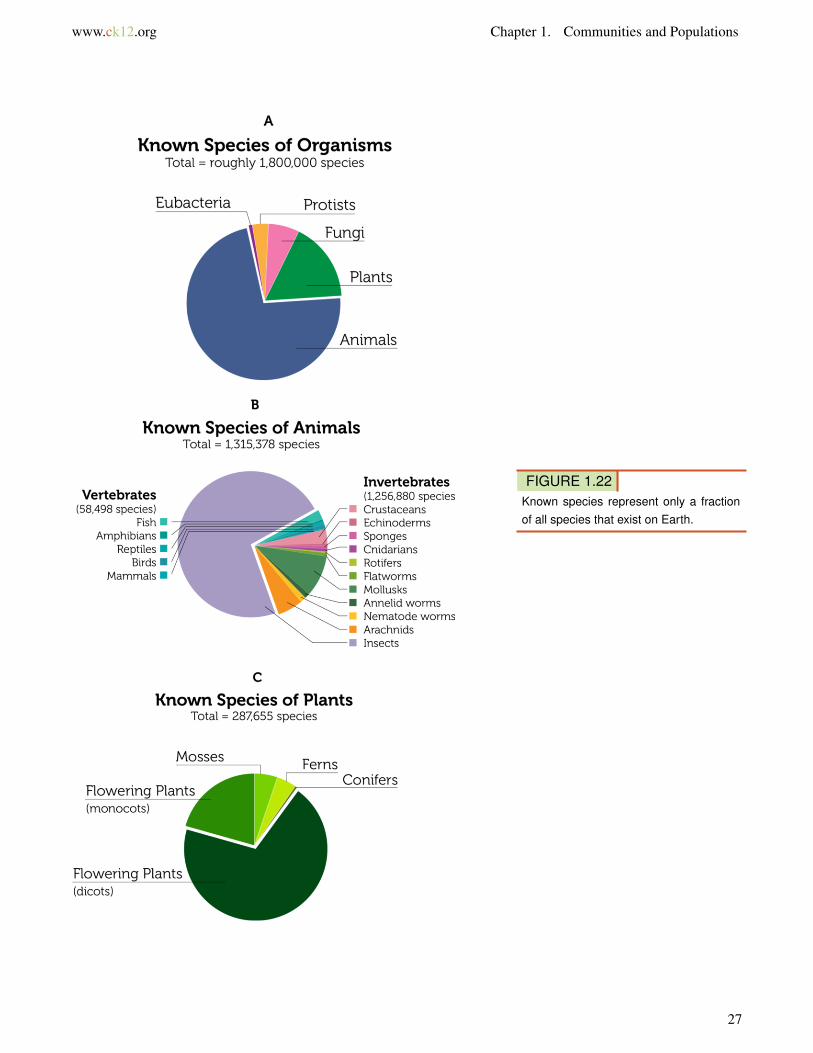
Biodiversity refers to the variety of life and its processes, including the variety of living organisms, the geneticdifferences among them, and the communities and ecosystems in which they occur. Scientists have identified about1.9 million species alive today. They are divided into the six kingdoms of life shown in Figure 1.22. Scientists arestill discovering new species. Thus, they do not know for sure how many species really exist today. Most estimatesrange from 5 to 30 million species.
A discussion of biodiversity is available at http://www.youtube.com/watch?v=vGxJArebKoc (6:12).
Millions of Unseen Species
A study released in August 2011 estimates that Earth has almost 8.8 million animal, plant and fungi species, butwe’ve only discovered less than a quarter of them. So far, only 1.9 million species have been found. Recent newlydiscovered species have been very diverse: a psychedelic frogfish, a lizard the size of a dime and even a blind hairymini-lobster at the bottom of the ocean. There are potential benefits from these undiscovered species, which need tobe found before they disappear from the planet. The study estimates that of the 8.8 million species, about 6.5 millionwould be on land and 2.2 million in the ocean. The research estimates that animals rule with 7.8 million species,followed by fungi with 611,000 and plants with just shy of 300,000 species. See http://news.yahoo.com/wild-world-millions-unseen-species-fill-earth-210051661.html for additional information.
26
www.ck12.org Chapter 1. Communities and Populations
FIGURE 1.22Known species represent only a fractionof all species that exist on Earth.
27
1.4. The Biodiversity Crisis www.ck12.org
Why Is Biodiversity Important?
Human beings benefit in many ways from biodiversity. Biodiversity has direct economic benefits. It also providesservices to entire ecosystems.
Economic Benefits of Biodiversity
The diversity of species provides humans with a wide range of economic benefits:
• Wild plants and animals maintain a valuable pool of genetic variation. This is important because domesticspecies are genetically uniform. This puts them at great risk of dying out due to disease.
• Other organisms provide humans with many different products. Timber, fibers, adhesives, dyes, and rubberare just a few.
• Certain species may warn us of toxins in the environment. When the peregrine falcon nearly went extinct, forexample, it warned us of the dangers of DDT.
• More than half of the most important prescription drugs come from wild species. Only a fraction of specieshave yet been studied for their medical potential.
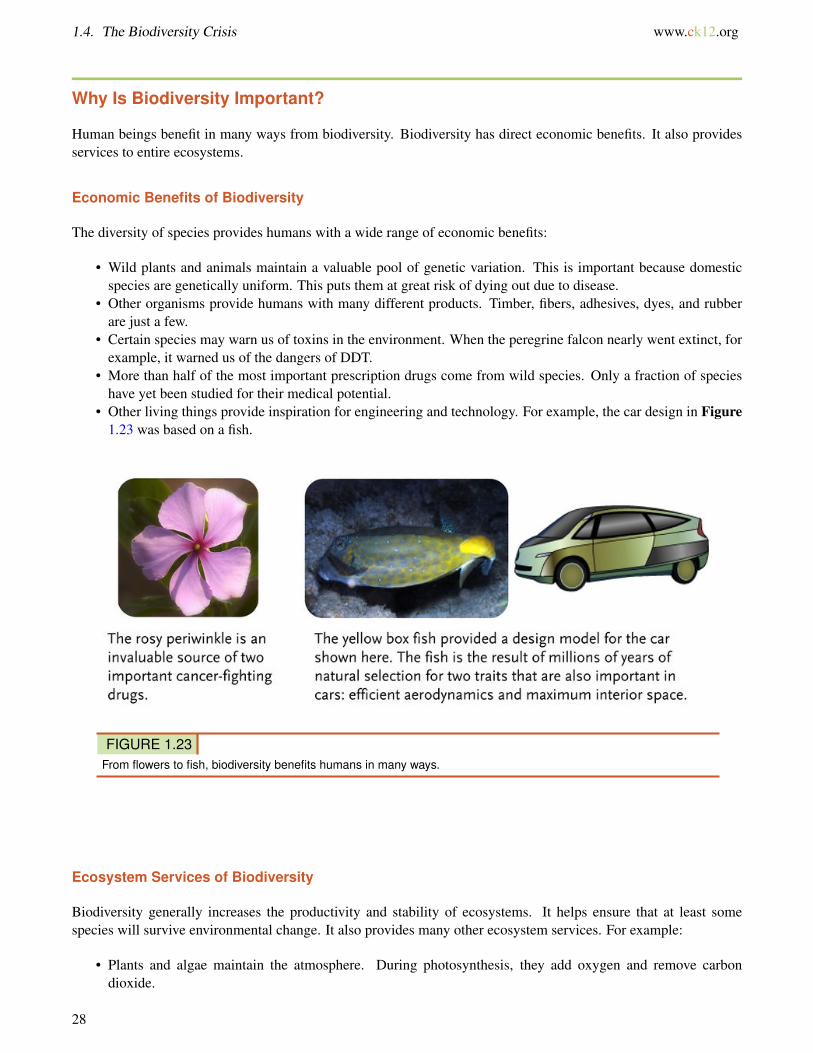
• Other living things provide inspiration for engineering and technology. For example, the car design in Figure1.23 was based on a fish.
FIGURE 1.23From flowers to fish, biodiversity benefits humans in many ways.
Ecosystem Services of Biodiversity
Biodiversity generally increases the productivity and stability of ecosystems. It helps ensure that at least somespecies will survive environmental change. It also provides many other ecosystem services. For example:
• Plants and algae maintain the atmosphere. During photosynthesis, they add oxygen and remove carbondioxide.
28
www.ck12.org Chapter 1. Communities and Populations
• Plants help prevent soil erosion. They also improve soil quality when they decompose.• Microorganisms purify water in rivers and lakes. They also return nutrients to the soil.• Bacteria fix nitrogen and make it available to plants. Other bacteria recycle the nitrogen from organic wastes
and remains of dead organisms.• Insects and birds pollinate flowering plants, including crop plants.• Natural predators control insect pests. They reduce the need for expensive pesticides, which may harm people
and other living things.
Human Actions and the Sixth Mass Extinction
Over 99 percent of all species that ever lived on Earth have gone extinct. Five mass extinctions are recorded in thefossil record. They were caused by major geologic and climatic events. Evidence shows that a sixth mass extinctionis occurring now. Unlike previous mass extinctions, the sixth extinction is due to human actions.
Some scientists consider the sixth extinction to have begun with early hominids during the Pleistocene. They areblamed for over-killing big mammals such as mammoths. Since then, human actions have had an ever greater impacton other species. The present rate of extinction is between 100 and 100,000 species per year. In 100 years, we couldlose more than half of Earth’s remaining species.
Causes of Extinction
The single biggest cause of extinction today is habitat loss. Agriculture, forestry, mining, and urbanization havedisturbed or destroyed more than half of Earth’s land area. In the U.S., for example, more than 99 percent of tall-grassprairies have been lost. Other causes of extinction today include:
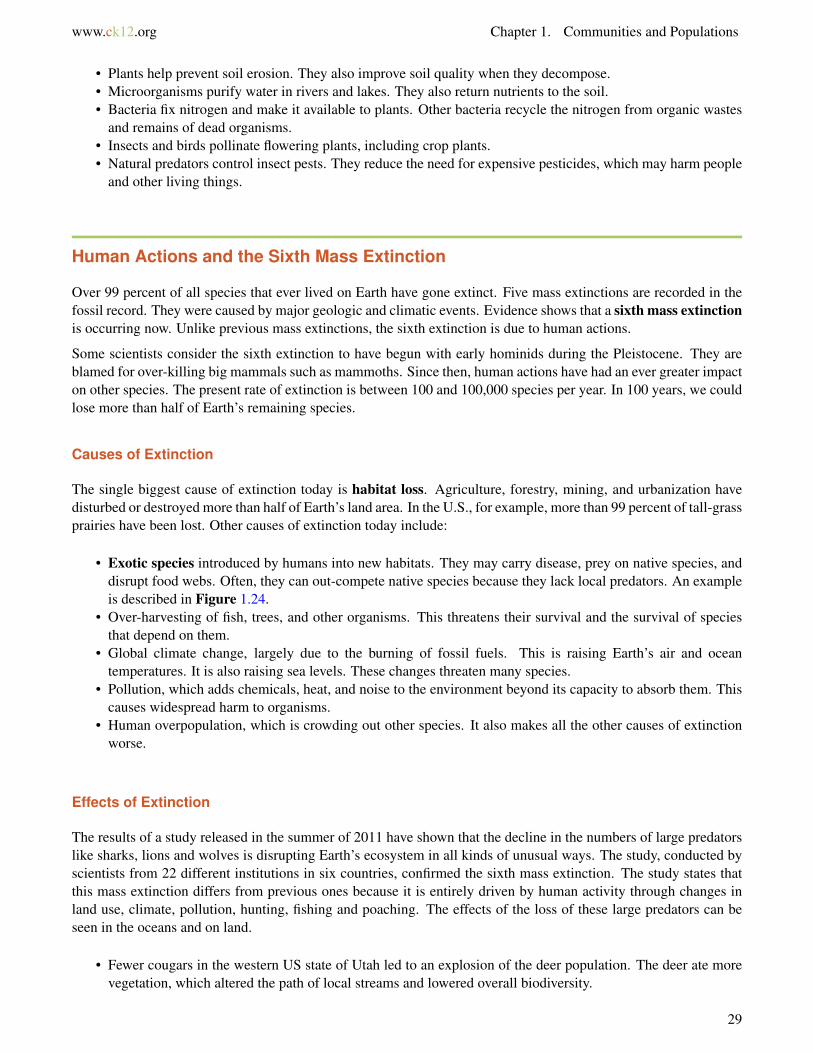
• Exotic species introduced by humans into new habitats. They may carry disease, prey on native species, anddisrupt food webs. Often, they can out-compete native species because they lack local predators. An exampleis described in Figure 1.24.
• Over-harvesting of fish, trees, and other organisms. This threatens their survival and the survival of speciesthat depend on them.
• Global climate change, largely due to the burning of fossil fuels. This is raising Earth’s air and oceantemperatures. It is also raising sea levels. These changes threaten many species.
• Pollution, which adds chemicals, heat, and noise to the environment beyond its capacity to absorb them. Thiscauses widespread harm to organisms.
• Human overpopulation, which is crowding out other species. It also makes all the other causes of extinctionworse.
Effects of Extinction
The results of a study released in the summer of 2011 have shown that the decline in the numbers of large predatorslike sharks, lions and wolves is disrupting Earth’s ecosystem in all kinds of unusual ways. The study, conducted byscientists from 22 different institutions in six countries, confirmed the sixth mass extinction. The study states thatthis mass extinction differs from previous ones because it is entirely driven by human activity through changes inland use, climate, pollution, hunting, fishing and poaching. The effects of the loss of these large predators can beseen in the oceans and on land.
• Fewer cougars in the western US state of Utah led to an explosion of the deer population. The deer ate morevegetation, which altered the path of local streams and lowered overall biodiversity.
29
1.4. The Biodiversity Crisis www.ck12.org
FIGURE 1.24Brown Tree Snake. The brown tree snake is an exotic species that has caused many extinctions on Pacific islandssuch as Guam.
• In Africa, where lions and leopard are being lost to poachers, there is a surge in the numbers of olive baboonswho are transferring intestinal parasites to human who live nearby.
• In the oceans, industrial whaling led a change in the diets of killer whales, who eat more sea lion, seals andotters and dramatically lowered those population counts.
The study concludes that the loss of big predators has likely driven many of the pandemics, population collapses andecosystem shifts the Earth has seen in recent centuries. See http://www.nsf.gov/news/news_summ.jsp?cntn_id=121020 for additional information.
KQED: Disappearing Frogs
Around the world, frogs are declining at an alarming rate due to threats like pollution, disease and climate change.Frogs bridge the gap between water and land habitats, making them the first indicators of ecosystem changes. Meetthe California researchers working to protect frogs across the state and across the world at http://www.kqed.org/quest/television/disappearing-frogs . Learn about the plight of the yellow-legged frog at http://www.kqed.org/quest/radio/plight-of-the-yellowlegged-frog .
MEDIAClick image to the left or use the URL below.URL: http://www.ck12.org/flx/render/embeddedobject/443
30
www.ck12.org Chapter 1. Communities and Populations
MEDIAClick image to the left or use the URL below.URL: http://www.ck12.org/flx/render/embeddedobject/108464
KQED: Nonnative Species
Scoop a handful of critters out of the San Francisco Bay and you’ll find many organisms from far away shores.Invasive kinds of mussels, fish and more are choking out native species, challenging experts around the state tochange the human behavior that brings them here. See http://www.kqed.org/quest/television/san-francisco-bay-invaders for more information.
MEDIAClick image to the left or use the URL below.URL: http://www.ck12.org/flx/render/embeddedobject/444
How You Can Help Protect Biodiversity
There are many steps you can take to help protect biodiversity. For example:
• Consume wisely. Reduce your consumption wherever possible. Re-use or recycle rather than throw out andbuy new. When you do buy new, choose products that are energy efficient and durable.
• Avoid plastics. Plastics are made from petroleum and produce toxic waste.• Go organic. Organically grown food is better for your health. It also protects the environment from pesticides
and excessive nutrients in fertilizers.• Save energy. Unplug electronic equipment and turn off lights when not in use. Take mass transit instead of
driving.
See http://www.youtube.com/watch?v=GnK7gNXxb3c for an outstanding 60 Minutes video of the Great Migrationin Kenya, and the issues facing these animals.
Lost Salmon
Why is the salmon population of Northern California so important? Salmon do not only provide food for humans,but also supply necessary nutrients for their ecosystems. Because of a sharp decline in their numbers, in part due tohuman interference, the entire salmon fishing season off California and Oregon was canceled in both 2008 and 2009.The species in the most danger of extinction is the California coho salmon. Explore the important role salmon playin their native ecosystems and methods to increase their numbers at http://www.kqed.org/quest/television/californias-lost-salmon and http://science.kqed.org/quest/video/saving-californias-salmon/ .
31
1.4. The Biodiversity Crisis www.ck12.org
MEDIAClick image to the left or use the URL below.URL: http://www.ck12.org/flx/render/embeddedobject/445
MEDIAClick image to the left or use the URL below.URL: http://www.ck12.org/flx/render/embeddedobject/146111
The Encyclopedia of Life
The Encyclopedia of Life (EOL) is a free, online collaborative encyclopedia intended to document all of the 1.9+million living species known to science. It is compiled from existing scientific databases, and from contributions byexperts and non-experts world-wide. Its goal is to build one infinitely expandable page for each species, includingvideos, sound, images, graphics, and text. As the discovery of new species is expected to continue (the current rate isabout 20,000 new species identified per year), EOL will grow continuously. As taxonomy finds new ways to includespecies identified by molecular techniques, the rate of new species additions will increase - in particular with respectto the microbial world of (eu)bacteria, archaebacteria and viruses. EOL went live on February 26, 2008 with 30,000entries.
The EOL has developed web-based tools and services that provide visitors enhanced capability to use EOL contentfor their own purposes and to contribute to the site and become part of a growing international community interestedin biodiversity.
See http://www.eol.org/ and http://www.youtube.com/watch?v=6NwfGA4cxJQ for additional information.
MEDIAClick image to the left or use the URL below.URL: http://www.ck12.org/flx/render/embeddedobject/418
In addition, Understanding Biodiversity, the CK-12 and EOL biodiversity-themed resource currently under de-velopment, is an expanding library of biodiversity information aimed at the secondary-level biology classroom.
32
www.ck12.org Chapter 1. Communities and Populations
Understanding Biodiversity pages will provide information for each species relevant to the high school biologycurriculum: cell biology, genetics, evolution, ecology, and physiology. If you would like to submit a species page toUnderstanding Biodiversity, email a proposal for contributions to [email protected].
Field Guides
http://fieldguides.eol.org/
Field Guides pull selected content from EOL species pages into a format that is easier to view and use for particularprojects. Rather than sorting through all 1.9 million species pages and all of the Table of Contents information, userswill see information for just the organisms and information they select. Users are able to customize and edit thecontent in their field guide.
You can try creating a field guide for the organisms found in your schoolyard or for the organisms discussed inanother chapter of this resource. See what information is found in EOL and what is missing. Is there anything youcan contribute to EOL, such as an image or class research information?
EOL Podcasts
http://education.eol.org/podcast
Lend an ear and discover the wonders of nature—right outside your back door and halfway around the world. EOLaudio broadcasts are aimed at learning about life-from organisms as small as yeast to as big as a bowhead whale.Hear people’s stories about nature and hone your backyard observation skills. Explore the diversity of life—fiveminutes and One Species at a Time. Listen to the podcasts online, or download them and take them with you on yourown exploration of the world around you.
One Species at a Time
The audio series One Species at a Time is a tribute to life on Earth http://education.eol.org/podcast/one-species-time . Each episode is a story, a mystery, a riddle, or an exploration of a different creature pulsing, fluttering, surging,respiring, and galloping on this planet. Biodiversity is center stage, from scurrying invasive beetles in Oregon to thethreatened cedar trees of Lebanon to Ediacaran fauna from 580 million years ago. There are associated Extras anda Meet the Scientist section with each podcast. Some have associated educational materials. Some have associatededucational materials. All podcasts are freely available and can be used in other projects.
The Biodiversity Heritage Library
http://www.biodiversitylibrary.org/
Twelve major natural history museum libraries, botanical libraries, and research institutions have joined to form theBiodiversity Heritage Library. The participating libraries have over two million volumes of biodiversity literaturecollected over 200 years to support the work of scientists, researchers, and students in their home institutions andthroughout the world.
The Biodiversity Heritage Library (BHL) consortium cooperates to digitize and make accessible the biodiversityliterature held in their collections and to make that literature available for open access and responsible use as a partof a global “biodiversity commons.” Because of the BHL’s success in digitizing a significant mass of biodiversityliterature, the scientific documentation of the study of living organisms since the time of Linnaeus has became easilyaccessible.
33
1.4. The Biodiversity Crisis www.ck12.org
Anyone can access the BHL website directly or link to it from any EOL species page. When on a species page, scrolldown through the Table of Contents on the left hand side of the page to the "References and More Information" sec-tion and click on "Biodiversity Heritage Library." BHL literature directly related to the species under considerationwill be shown.
The published literature on biological diversity has limited global distribution; much of it is available in only a fewselect libraries in the developed world. These collections are of exceptional value because the domain of systematicbiology depends - more than any other science - upon historic literature. Yet, this wealth of knowledge is availableonly to those few who can gain direct access to significant library collections. Literature about the life that exists indeveloping countries is often not available within their borders. Biologists have long considered that access to thepublished literature is one of the chief impediments to the efficiency of research in the field. Among other results,free global access to digitized versions of the literature would make available information about the Earth’s speciesto all parts of the world. Many of the texts digitized by the BHL have until now only been held in a few Europeanor North American libraries. Now, with this resource, scientists and student in the developing world have access tothem, thereby accelerating biodiversity research.
Since 2009, the BHL has expanded globally. The European Commission’s eContentPlus program has recentlyfunded the BHL-Europe project, with 28 institutions, to assemble the European language literature. Additionally, theChinese Academy of Sciences, the Atlas of Living Australia, Brazil, and the Bibliotheca Alexandrina have createdregional BHL sites. These projects will work together to share content, protocols, services, and digital preservationpractices.
Lesson Summary
• Biodiversity refers to the number of species in an ecosystem or the biosphere as a whole.• Biodiversity has direct economic benefits. It also provides services to entire ecosystems.• Evidence shows that a sixth mass extinction is occurring. The single biggest cause is habitat loss caused by
human actions. There are many steps you can take to help protect biodiversity. For example, you can use lessenergy.
• The Encyclopedia of Life is a free, online collaborative encyclopedia intended to document all of the 1.9+million living species known to science.
Lesson Review Questions
Recall
1. What is biodiversity?
2. List three economic benefits of biodiversity.
3. Identify ecosystem services of biodiversity.
4. How is human overpopulation related to the sixth mass extinction?
Apply Concepts
5. Create a poster that conveys simple tips for protecting biodiversity.
6. Why might the brown tree snake or the peregrine falcon serve as “poster species” for causes of the sixth massextinction?
34
www.ck12.org Chapter 1. Communities and Populations
Think Critically
7. Predict what would happen to other organisms in an ecosystem in which all the decomposers went extinct?
8. Describe a hypothetical example showing how rising sea levels due to global warming might cause extinction.
Points to Consider
All species depend on the environment to provide them with the resources they need. As populations grow, resourcesmay be used up. Just using the resources can create more problems.
• What resources do you depend on?• Does using the resources pollute the environment? Are the resources running out?
35
1.5. Natural Resources and Climate Change www.ck12.org
1.5 Natural Resources and Climate Change
Lesson Objectives
• Distinguish between renewable and nonrenewable resources.• Describe threats to soil and water resources.• Identify the causes and effects of air pollution.• Explain global climate change.
Vocabulary
• acid rain• air pollution• algal bloom• dead zone• global warming• greenhouse effect• natural resource• nonrenewable resource• ozone hole• renewable resource• soil• sustainable use
Introduction
A natural resource is something supplied by nature that helps support life. When you think of natural resources,you may think of minerals and fossil fuels. However, ecosystems and the services they provide are also naturalresources. Biodiversity is a natural resource as well.
Renewable and Nonrenewable Resources
From the human point of view, natural resources can be classified as renewable or nonrenewable.
Renewable Resources
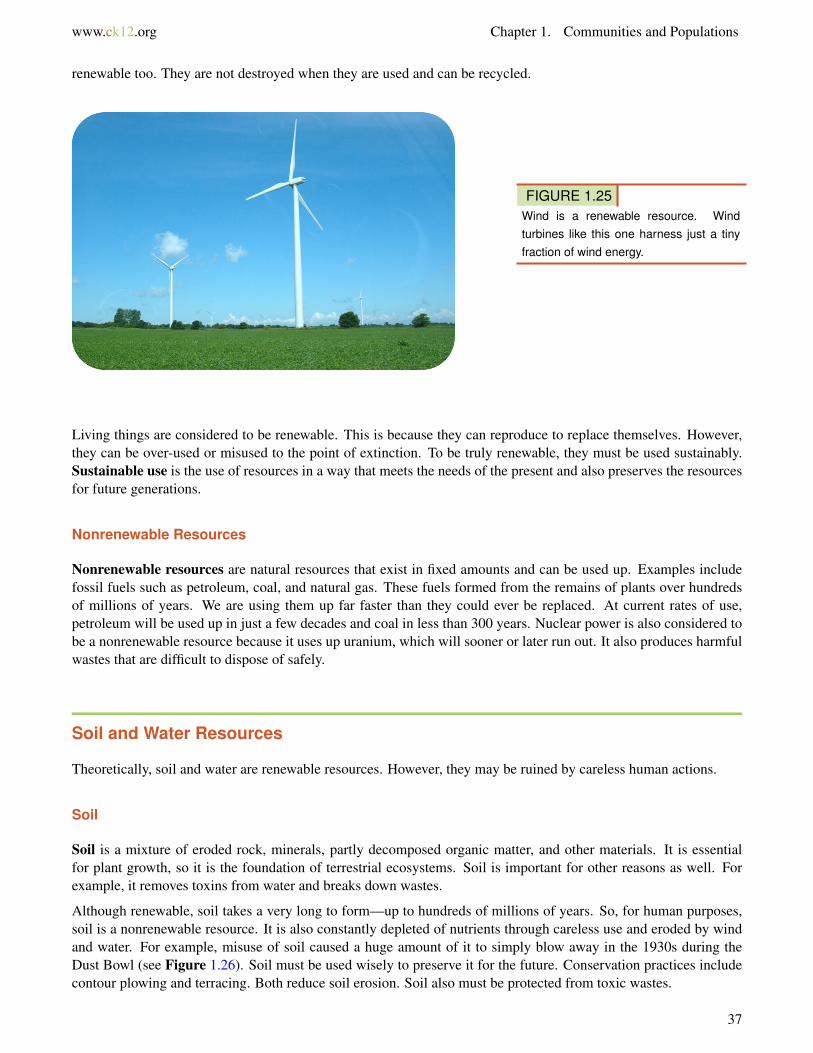
Renewable resources can be replenished by natural processes as quickly as humans use them. Examples includesunlight and wind. They are in no danger of being used up (see Figure 1.25). Metals and other minerals are
36
www.ck12.org Chapter 1. Communities and Populations
renewable too. They are not destroyed when they are used and can be recycled.
FIGURE 1.25Wind is a renewable resource. Windturbines like this one harness just a tinyfraction of wind energy.
Living things are considered to be renewable. This is because they can reproduce to replace themselves. However,they can be over-used or misused to the point of extinction. To be truly renewable, they must be used sustainably.Sustainable use is the use of resources in a way that meets the needs of the present and also preserves the resourcesfor future generations.
Nonrenewable Resources
Nonrenewable resources are natural resources that exist in fixed amounts and can be used up. Examples includefossil fuels such as petroleum, coal, and natural gas. These fuels formed from the remains of plants over hundredsof millions of years. We are using them up far faster than they could ever be replaced. At current rates of use,petroleum will be used up in just a few decades and coal in less than 300 years. Nuclear power is also considered tobe a nonrenewable resource because it uses up uranium, which will sooner or later run out. It also produces harmfulwastes that are difficult to dispose of safely.
Soil and Water Resources
Theoretically, soil and water are renewable resources. However, they may be ruined by careless human actions.
Soil
Soil is a mixture of eroded rock, minerals, partly decomposed organic matter, and other materials. It is essentialfor plant growth, so it is the foundation of terrestrial ecosystems. Soil is important for other reasons as well. Forexample, it removes toxins from water and breaks down wastes.
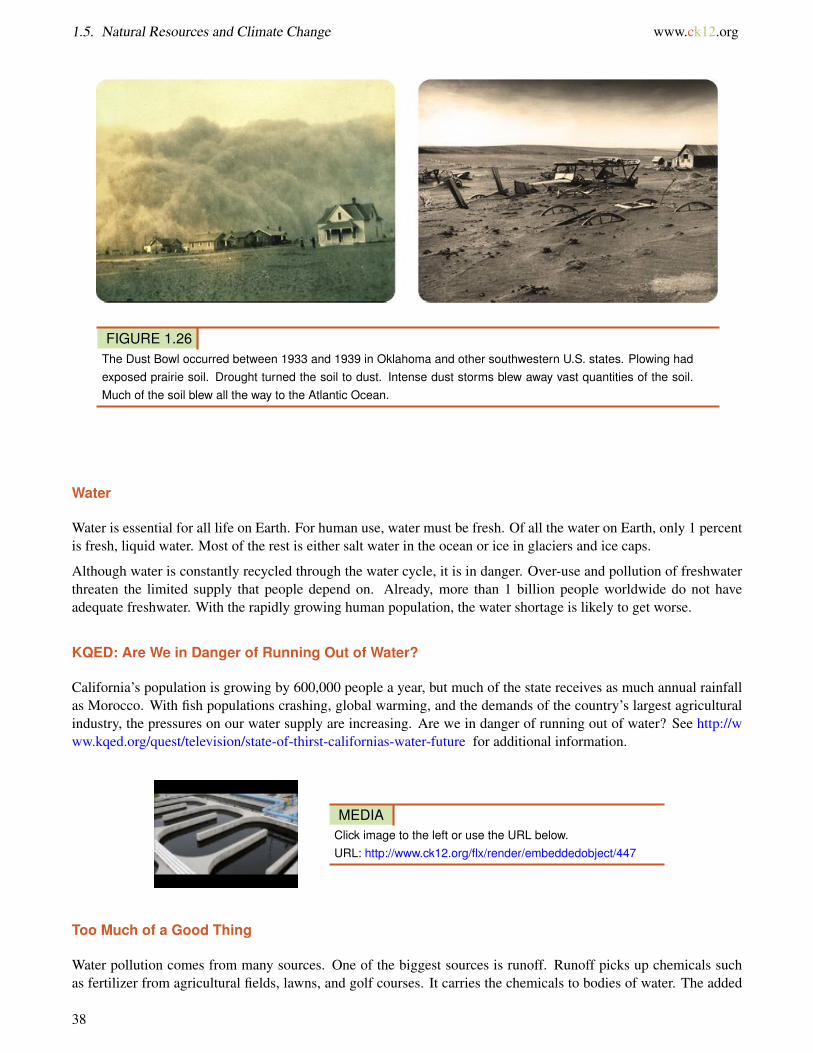
Although renewable, soil takes a very long to form—up to hundreds of millions of years. So, for human purposes,soil is a nonrenewable resource. It is also constantly depleted of nutrients through careless use and eroded by windand water. For example, misuse of soil caused a huge amount of it to simply blow away in the 1930s during theDust Bowl (see Figure 1.26). Soil must be used wisely to preserve it for the future. Conservation practices includecontour plowing and terracing. Both reduce soil erosion. Soil also must be protected from toxic wastes.
37
1.5. Natural Resources and Climate Change www.ck12.org
FIGURE 1.26The Dust Bowl occurred between 1933 and 1939 in Oklahoma and other southwestern U.S. states. Plowing hadexposed prairie soil. Drought turned the soil to dust. Intense dust storms blew away vast quantities of the soil.Much of the soil blew all the way to the Atlantic Ocean.
Water
Water is essential for all life on Earth. For human use, water must be fresh. Of all the water on Earth, only 1 percentis fresh, liquid water. Most of the rest is either salt water in the ocean or ice in glaciers and ice caps.
Although water is constantly recycled through the water cycle, it is in danger. Over-use and pollution of freshwaterthreaten the limited supply that people depend on. Already, more than 1 billion people worldwide do not haveadequate freshwater. With the rapidly growing human population, the water shortage is likely to get worse.
KQED: Are We in Danger of Running Out of Water?
California’s population is growing by 600,000 people a year, but much of the state receives as much annual rainfallas Morocco. With fish populations crashing, global warming, and the demands of the country’s largest agriculturalindustry, the pressures on our water supply are increasing. Are we in danger of running out of water? See http://www.kqed.org/quest/television/state-of-thirst-californias-water-future for additional information.
MEDIAClick image to the left or use the URL below.URL: http://www.ck12.org/flx/render/embeddedobject/447
Too Much of a Good Thing
Water pollution comes from many sources. One of the biggest sources is runoff. Runoff picks up chemicals suchas fertilizer from agricultural fields, lawns, and golf courses. It carries the chemicals to bodies of water. The added
38
www.ck12.org Chapter 1. Communities and Populations
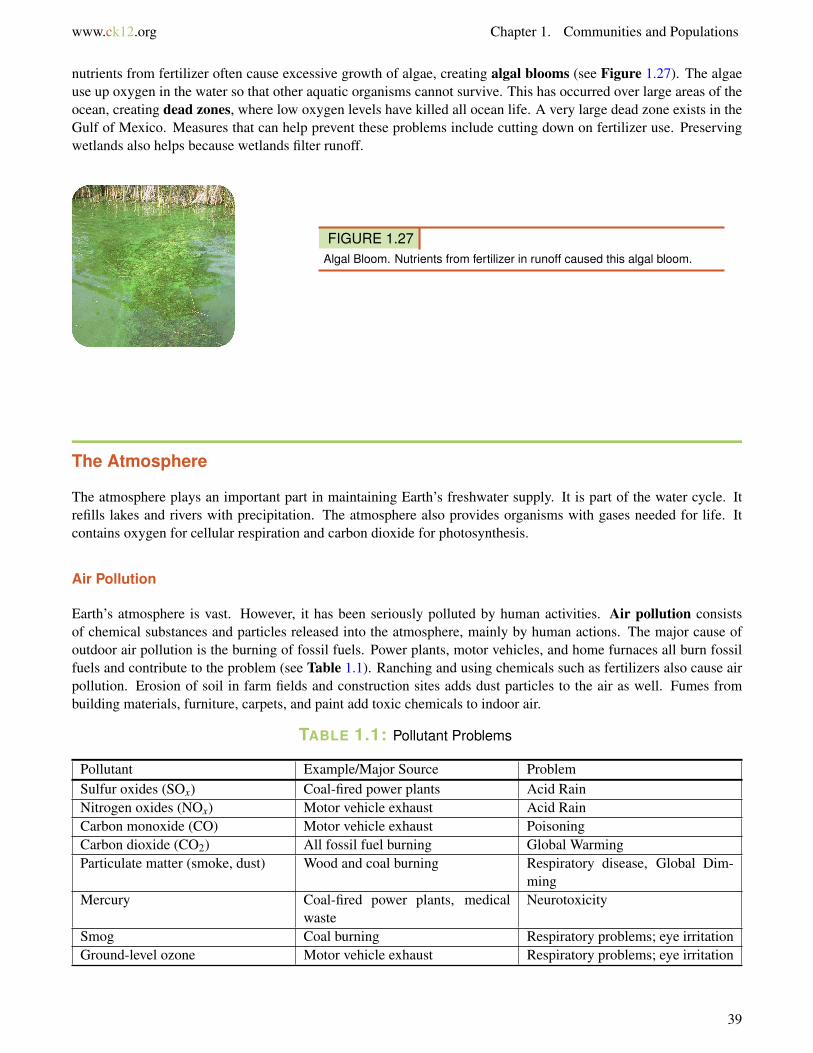
nutrients from fertilizer often cause excessive growth of algae, creating algal blooms (see Figure 1.27). The algaeuse up oxygen in the water so that other aquatic organisms cannot survive. This has occurred over large areas of theocean, creating dead zones, where low oxygen levels have killed all ocean life. A very large dead zone exists in theGulf of Mexico. Measures that can help prevent these problems include cutting down on fertilizer use. Preservingwetlands also helps because wetlands filter runoff.
FIGURE 1.27Algal Bloom. Nutrients from fertilizer in runoff caused this algal bloom.
The Atmosphere
The atmosphere plays an important part in maintaining Earth’s freshwater supply. It is part of the water cycle. Itrefills lakes and rivers with precipitation. The atmosphere also provides organisms with gases needed for life. Itcontains oxygen for cellular respiration and carbon dioxide for photosynthesis.
Air Pollution
Earth’s atmosphere is vast. However, it has been seriously polluted by human activities. Air pollution consistsof chemical substances and particles released into the atmosphere, mainly by human actions. The major cause ofoutdoor air pollution is the burning of fossil fuels. Power plants, motor vehicles, and home furnaces all burn fossilfuels and contribute to the problem (see Table 1.1). Ranching and using chemicals such as fertilizers also cause airpollution. Erosion of soil in farm fields and construction sites adds dust particles to the air as well. Fumes frombuilding materials, furniture, carpets, and paint add toxic chemicals to indoor air.
TABLE 1.1: Pollutant Problems
Pollutant Example/Major Source ProblemSulfur oxides (SOx) Coal-fired power plants Acid RainNitrogen oxides (NOx) Motor vehicle exhaust Acid RainCarbon monoxide (CO) Motor vehicle exhaust PoisoningCarbon dioxide (CO2) All fossil fuel burning Global WarmingParticulate matter (smoke, dust) Wood and coal burning Respiratory disease, Global Dim-
mingMercury Coal-fired power plants, medical
wasteNeurotoxicity
Smog Coal burning Respiratory problems; eye irritationGround-level ozone Motor vehicle exhaust Respiratory problems; eye irritation
39
1.5. Natural Resources and Climate Change www.ck12.org
In humans, air pollution causes respiratory and cardiovascular problems. In fact, more people die each year from airpollution than automobile accidents. Air pollution also affects ecosystems worldwide by causing acid rain, ozonedepletion, and global warming. Ways to reduce air pollution from fossil fuels include switching to nonpollutingenergy sources (such as solar energy) and using less energy. What are some ways you could use less energy?
Acid Rain
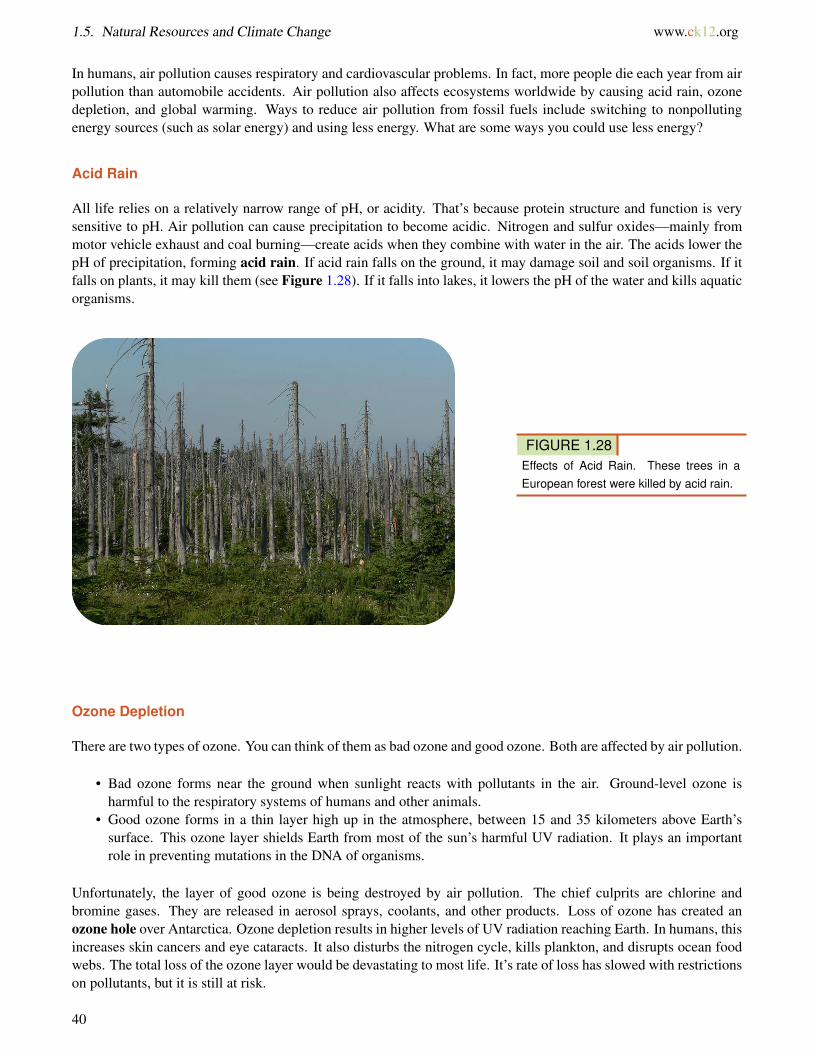
All life relies on a relatively narrow range of pH, or acidity. That’s because protein structure and function is verysensitive to pH. Air pollution can cause precipitation to become acidic. Nitrogen and sulfur oxides—mainly frommotor vehicle exhaust and coal burning—create acids when they combine with water in the air. The acids lower thepH of precipitation, forming acid rain. If acid rain falls on the ground, it may damage soil and soil organisms. If itfalls on plants, it may kill them (see Figure 1.28). If it falls into lakes, it lowers the pH of the water and kills aquaticorganisms.
FIGURE 1.28Effects of Acid Rain. These trees in aEuropean forest were killed by acid rain.
Ozone Depletion
There are two types of ozone. You can think of them as bad ozone and good ozone. Both are affected by air pollution.
• Bad ozone forms near the ground when sunlight reacts with pollutants in the air. Ground-level ozone isharmful to the respiratory systems of humans and other animals.
• Good ozone forms in a thin layer high up in the atmosphere, between 15 and 35 kilometers above Earth’ssurface. This ozone layer shields Earth from most of the sun’s harmful UV radiation. It plays an importantrole in preventing mutations in the DNA of organisms.
Unfortunately, the layer of good ozone is being destroyed by air pollution. The chief culprits are chlorine andbromine gases. They are released in aerosol sprays, coolants, and other products. Loss of ozone has created anozone hole over Antarctica. Ozone depletion results in higher levels of UV radiation reaching Earth. In humans, thisincreases skin cancers and eye cataracts. It also disturbs the nitrogen cycle, kills plankton, and disrupts ocean foodwebs. The total loss of the ozone layer would be devastating to most life. It’s rate of loss has slowed with restrictionson pollutants, but it is still at risk.
40
www.ck12.org Chapter 1. Communities and Populations
Global Climate Change
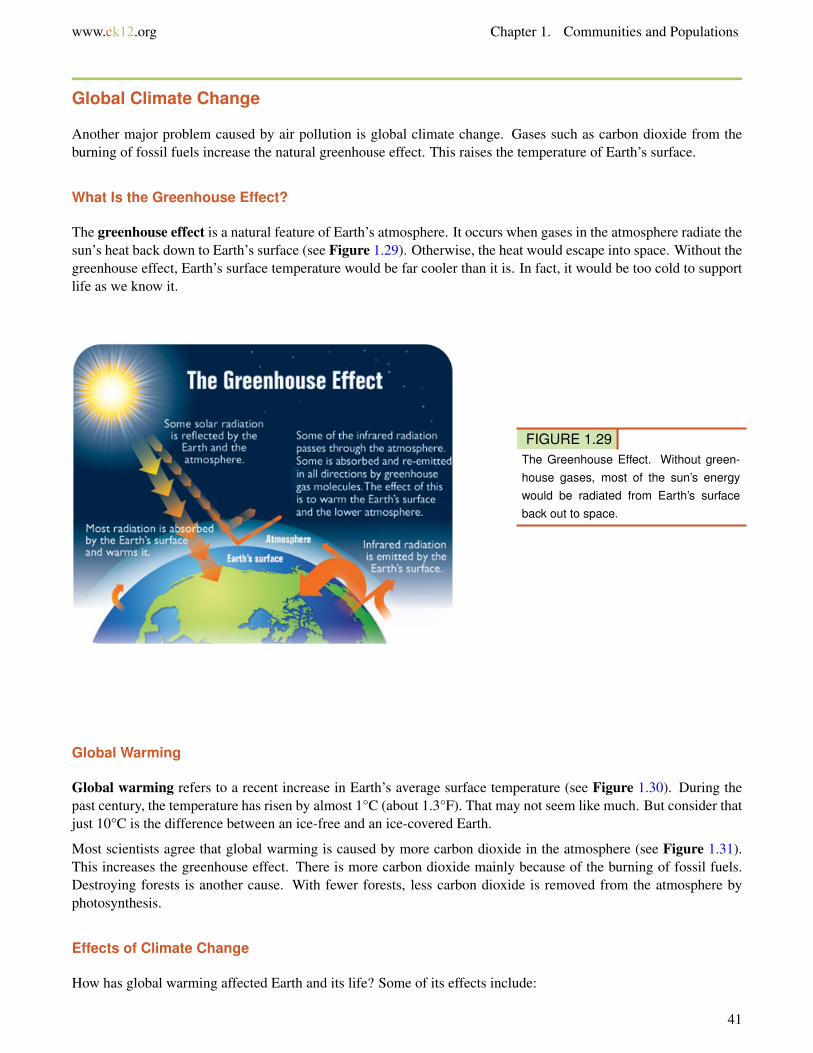
Another major problem caused by air pollution is global climate change. Gases such as carbon dioxide from theburning of fossil fuels increase the natural greenhouse effect. This raises the temperature of Earth’s surface.
What Is the Greenhouse Effect?
The greenhouse effect is a natural feature of Earth’s atmosphere. It occurs when gases in the atmosphere radiate thesun’s heat back down to Earth’s surface (see Figure 1.29). Otherwise, the heat would escape into space. Without thegreenhouse effect, Earth’s surface temperature would be far cooler than it is. In fact, it would be too cold to supportlife as we know it.
FIGURE 1.29The Greenhouse Effect. Without green-house gases, most of the sun’s energywould be radiated from Earth’s surfaceback out to space.
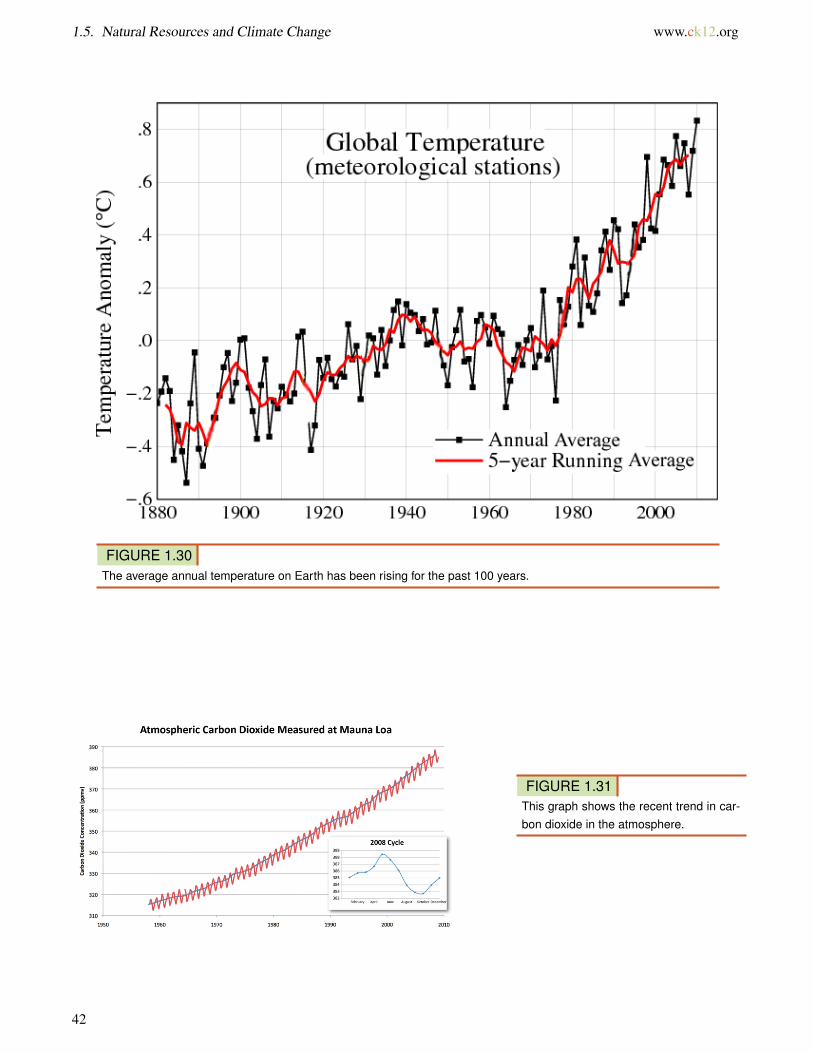
Global Warming
Global warming refers to a recent increase in Earth’s average surface temperature (see Figure 1.30). During thepast century, the temperature has risen by almost 1°C (about 1.3°F). That may not seem like much. But consider thatjust 10°C is the difference between an ice-free and an ice-covered Earth.
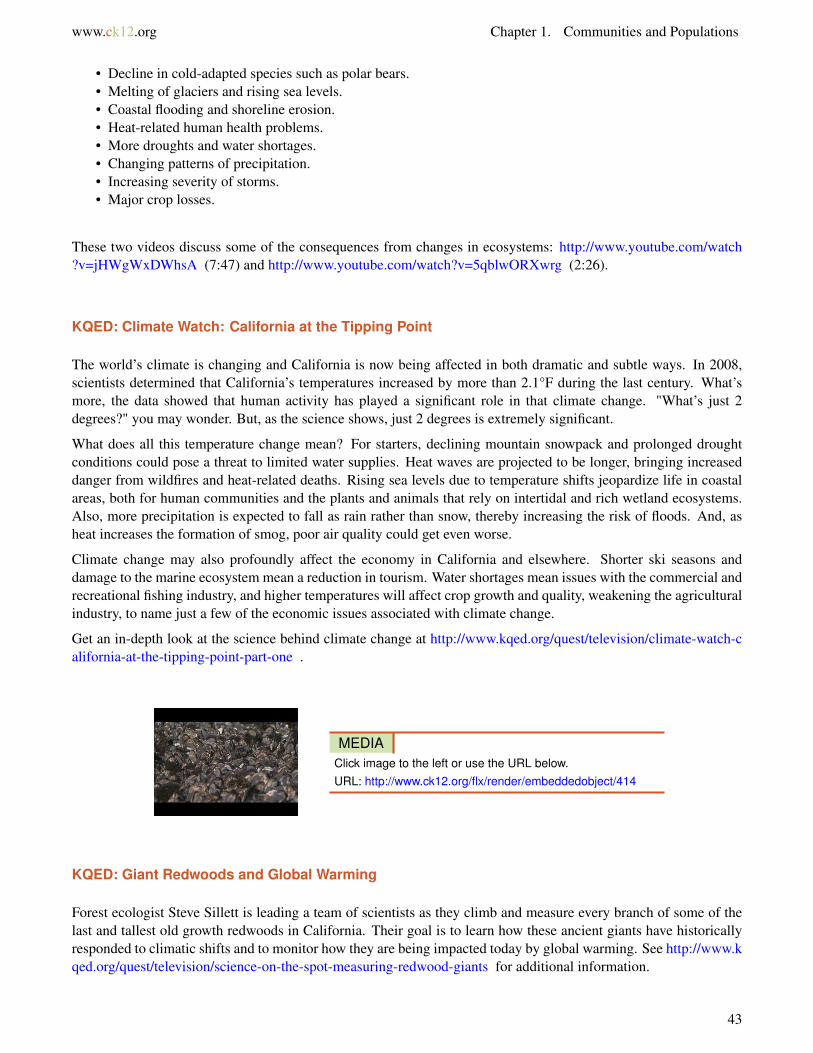
Most scientists agree that global warming is caused by more carbon dioxide in the atmosphere (see Figure 1.31).This increases the greenhouse effect. There is more carbon dioxide mainly because of the burning of fossil fuels.Destroying forests is another cause. With fewer forests, less carbon dioxide is removed from the atmosphere byphotosynthesis.
Effects of Climate Change
How has global warming affected Earth and its life? Some of its effects include:
41
1.5. Natural Resources and Climate Change www.ck12.org
FIGURE 1.30The average annual temperature on Earth has been rising for the past 100 years.
FIGURE 1.31This graph shows the recent trend in car-bon dioxide in the atmosphere.
42
www.ck12.org Chapter 1. Communities and Populations
• Decline in cold-adapted species such as polar bears.• Melting of glaciers and rising sea levels.• Coastal flooding and shoreline erosion.• Heat-related human health problems.• More droughts and water shortages.• Changing patterns of precipitation.• Increasing severity of storms.• Major crop losses.
These two videos discuss some of the consequences from changes in ecosystems: http://www.youtube.com/watch?v=jHWgWxDWhsA (7:47) and http://www.youtube.com/watch?v=5qblwORXwrg (2:26).
KQED: Climate Watch: California at the Tipping Point
The world’s climate is changing and California is now being affected in both dramatic and subtle ways. In 2008,scientists determined that California’s temperatures increased by more than 2.1°F during the last century. What’smore, the data showed that human activity has played a significant role in that climate change. "What’s just 2degrees?" you may wonder. But, as the science shows, just 2 degrees is extremely significant.
What does all this temperature change mean? For starters, declining mountain snowpack and prolonged droughtconditions could pose a threat to limited water supplies. Heat waves are projected to be longer, bringing increaseddanger from wildfires and heat-related deaths. Rising sea levels due to temperature shifts jeopardize life in coastalareas, both for human communities and the plants and animals that rely on intertidal and rich wetland ecosystems.Also, more precipitation is expected to fall as rain rather than snow, thereby increasing the risk of floods. And, asheat increases the formation of smog, poor air quality could get even worse.
Climate change may also profoundly affect the economy in California and elsewhere. Shorter ski seasons anddamage to the marine ecosystem mean a reduction in tourism. Water shortages mean issues with the commercial andrecreational fishing industry, and higher temperatures will affect crop growth and quality, weakening the agriculturalindustry, to name just a few of the economic issues associated with climate change.
Get an in-depth look at the science behind climate change at http://www.kqed.org/quest/television/climate-watch-california-at-the-tipping-point-part-one .
MEDIAClick image to the left or use the URL below.URL: http://www.ck12.org/flx/render/embeddedobject/414
KQED: Giant Redwoods and Global Warming
Forest ecologist Steve Sillett is leading a team of scientists as they climb and measure every branch of some of thelast and tallest old growth redwoods in California. Their goal is to learn how these ancient giants have historicallyresponded to climatic shifts and to monitor how they are being impacted today by global warming. See http://www.kqed.org/quest/television/science-on-the-spot-measuring-redwood-giants for additional information.
43
1.5. Natural Resources and Climate Change www.ck12.org
MEDIAClick image to the left or use the URL below.URL: http://www.ck12.org/flx/render/embeddedobject/415
KQED: Acidic Seas
Melting glaciers, rising temperatures and droughts are all impacts of global warming. But how does global warmingactually affect the oceans? The sea, it turns out, absorbs carbon dioxide emissions. The ocean acts like a giantsponge, absorbing carbon dioxide emissions from the air. And as we add more and more carbon dioxide to air byburning fossil fuels, the ocean is absorbing it. On one level, it’s done us a big favor. Scientists say that we would beexperiencing much more extreme climate change were it not for the ocean’s ability to remove the heat-trapping gas.However, these emissions are causing the oceans to become more acidic. Changing pH levels threaten entire marinefood webs, from coral reefs to salmon. See http://www.kqed.org/quest/radio/acidic-seas for additional information.
MEDIAClick image to the left or use the URL below.URL: http://www.ck12.org/flx/render/embeddedobject/108466
As carbon dioxide levels increase in the atmosphere, the levels also increase in the oceans. What effects does thishave? Can ocean acidification make it difficult for sea life to produce their hard exoskeletons? Find out at http://science.kqed.org/quest/video/your-videos-on-quest-dan-griffin-of-gg-films/ .
MEDIAClick image to the left or use the URL below.URL: http://www.ck12.org/flx/render/embeddedobject/108467
What Can Be Done?
Efforts to reduce future global warming mainly involve energy use. We need to use less energy, for example, bydriving more fuel-efficient cars. We also need to switch to energy sources that produce less carbon dioxide, such assolar and wind energy. At the same time, we can increase the amount of carbon dioxide that is removed from air.We can stop destroying forests and plant new ones.
KQED: Earth Day
Earth Day Network’s mission is to broaden, diversify and activate the environmental movement worldwide, drivingaction year-round through a combination of education, public policy, and consumer campaigns. See http://www.e
44
www.ck12.org Chapter 1. Communities and Populations
arthday.org/ for additional information.
Each year, April 22 marks the anniversary of what many consider the birth of the modern environmental movementin 1970. The idea came to Earth Day founder Gaylord Nelson, then a U.S. Senator from Wisconsin, after witnessingthe ravages of the 1969 massive oil spill in Santa Barbara, California. On the 22nd of April, 20 million Americanstook to the streets, parks, and auditoriums to demonstrate for a healthy, sustainable environment in massive coast-to-coast rallies. Thousands of colleges and universities organized protests against the deterioration of the environment.Groups that had been fighting against oil spills, polluting factories and power plants, raw sewage, toxic dumps,pesticides, freeways, the loss of wilderness, and the extinction of wildlife suddenly realized they shared commonvalues.
As 1990 approached, a group of environmental leaders organized another big campaign. This time, Earth Day wentglobal, mobilizing 200 million people in 141 countries and lifting environmental issues onto the world stage. EarthDay 1990 gave a huge boost to recycling efforts worldwide and helped pave the way for the 1992 United NationsEarth Summit in Rio de Janeiro.
As the year 2000 approached, 5,000 environmental groups in a record 184 countries reached out to hundreds ofmillions of people. Earth Day 2000 used the Internet to organize activists, but also featured a talking drum chainthat traveled from village to village in Gabon, Africa, and hundreds of thousands of people gathered on the NationalMall in Washington, DC. Earth Day 2000 sent world leaders the loud and clear message that citizens around theworld wanted quick and decisive action on clean energy.
In 2010, the Earth Day Network reestablished Earth Day as a powerful focal point around which people coulddemonstrate their commitment. The Earth Day Network brought 225,000 people to the National Mall for a ClimateRally, amassed 40 million environmental service actions toward its 2012 goal of A Billion Acts of Green, launchedan international, 1-million tree planting initiative with Avatar director James Cameron, and tripled its online baseto over 900,000 members. The fight for a clean environment continues in a climate of increasing urgency, as theravages of climate change become more manifest every day.
See http://www.kqed.org/quest/television/earth-day-tv-special-where-weve-been-where-were-headed for more in-formation on California’s environmental movement.
MEDIAClick image to the left or use the URL below.URL: http://www.ck12.org/flx/render/embeddedobject/117459
Lesson Summary
• Renewable resources can be replaced by natural processes as quickly as humans use them. Examples includesunlight and wind. Nonrenewable resources exist in fixed amounts. They can be used up. Examples includefossil fuels such as coal.
• Soil and water are renewable resources but may be ruined by careless human actions. Soil can be depleted ofnutrients. It can also be eroded by wind or water. Over-use and pollution of freshwater threaten the limitedsupply that people depend on.
• Air pollution consists of chemical substances and particles released into the air, mainly by human actions.The major cause of outdoor air pollution is the burning of fossil fuels. Indoor air can also be polluted. Airpollution, in turn, causes acid rain, ozone depletion, and global warming.
• Gases such as carbon dioxide from the burning of fossil fuels increase the natural greenhouse effect. This is
45
1.5. Natural Resources and Climate Change www.ck12.org
raising the temperature of Earth’s surface, and is called global warming.
Lesson Review Questions
Recall
1. Define natural resource.
2. Distinguish between renewable and nonrenewable resources and give examples.
3. Summarize the environmental effects of burning fossil fuels.
4. How does air pollution contribute to global warming?
Apply Concepts
5. How could you create a three-dimensional model of the greenhouse effect? What processes would you demon-strate with your model? What materials would you use?
6. Apply lesson concepts to explain the relationship between the graphs in Figure 1.30 and Figure 1.31
Think Critically
7. Infer factors that determine whether a natural resource is renewable or nonrenewable.
8. Why would you expect a dead zone to start near the mouth of a river, where the river flows into a body of water?
9. Explain how air pollution is related to acid rain and ozone depletion.
Points to Consider
Microorganisms such as bacteria are important living resources in all ecosystems. They recycle nutrients and othermatter.
• What do you know about microorganisms? Besides bacteria, are there other types of microorganisms?• Are viruses microorganisms? Are they living things?
46
www.ck12.org Chapter 1. Communities and Populations
1.6 References
1. Patti Sandoval. http://www.flickr.com/photos/thomson-safaris/8377408989/ . CC BY 2.02. Hana Zavadska. CK-12 Foundation . CC BY-NC 3.03. Crab: Thomas Hubauer; Mantis: Adrian Pingstone; Zebra: Paul Maritz, User:Pharaoh Hound/Wikimedia
Commons, and User:Fir0002/Wikimedia Commons. Crab: http://www.flickr.com/photos/drth80/8754597558/; Mantis: http://en.wikipedia.org/wiki/File:Bristol.zoo.dead.leaf.mantis.arp.jpg; Zebra: http://en.wikipedia.org/wiki/File:Zebra_Botswana_edit02.jpg . Crab: CC BY 2.0; Mantis: Public Domain; Zebra: CC BY 2.5
4. Ground Anole: Flickr:pondhawk; Tree Anole: Jordan Walmsley. Ground Anole: http://www.flickr.com/photos/38686613@N08/4750887836/; Tree Anole: http://www.flickr.com/photos/champofsomething/8658719965/ . CC BY 2.0
5. User:Haplochromis/Wikimedia Commons. http://commons.wikimedia.org/wiki/File:Alpheus_bellulus.JPG .Public Domain
6. Image copyright Carsten Medom Madsen, 2014. http://www.shutterstock.com . Used under license fromShutterstock.com
7. Image copyright E. Glanfield, 2014. http://www.shutterstock.com . Used under license from Shutterstock.com8. Image copyright Pi-Lens, 2014. http://www.shutterstock.com . Used under license from Shutterstock.com9. CK-12 Foundation. CK-12 Foundation . CC BY-NC 3.0
10. Hana Zavadska. CK-12 Foundation . CC BY-NC 3.011. Hana Zavadska. CK-12 Foundation . CC BY-NC 3.012. John Liu. http://www.flickr.com/photos/8047705@N02/5572197407/ . CC BY 2.013. Courtesy of US Geological Survey. http://commons.wikimedia.org/wiki/File:Swainson%27s_hawk_migrati
on_route.jpg . Public Domain14. Hana Zavadska. CK-12 Foundation . CC BY-NC 3.015. Hana Zavadska. CK-12 Foundation . CC BY-NC 3.016. User:Charmed88/Wikipedia and User:NikNaks/Wikimedia Commons. http://commons.wikimedia.org/wik
i/File:Stage5.svg . Public Domain17. Hana Zavadska, based on data from US Census Bureau. CK-12 Foundation . CC BY-NC 3.018. US Census Bureau. http://www.census.gov/ipc/www/idb/country.php . Public Domain19. US Census Bureau. http://www.census.gov/ipc/www/idb/country.php . Public Domain20. US Census Bureau. http://www.census.gov/ipc/www/idb/country.php . Public Domain21. US Census Bureau. http://www.census.gov/ipc/www/idb/country.php . Public Domain22. Barbara Akre and Jin Yu, based on data from http://cnx.org/content/m12174/latest/ and http://en.wikipedia.org/wiki/Biodiversity.
CK-12 Foundation . CC BY-NC 3.023. Flower: User:Ulhaspa/Wikimedia Commons; Fish: J Petersen; Car: CK-12 Foundation. Flower: http://c
ommons.wikimedia.org/wiki/File:Rosy_periwinkle.jpg; Fish: http://commons.wikimedia.org/wiki/File:Ostracion_cubicus.JPG . Flower: CC BY 3.0; Fish: CC BY 2.5; Car: CC BY-NC 3.0
24. Snake image courtesy of National Park Service. http://commons.wikimedia.org/wiki/File:Brown_tree_snake_-Boiga_irregularis_2_USGS_Photograph.jpg . Public Domain
25. Patrick Finnegan. http://www.flickr.com/photos/vax-o-matic/2621902438/ . CC BY 2.026. Left: Courtesy of National Oceanic and Atmospheric Administration; Right: Courtesy of US Department
of Agriculture. Left: http://commons.wikimedia.org/wiki/File:Dust_Storm_Texas_1935.jpg; Right: http://commons.wikimedia.org/wiki/File:Dust_Bowl_-_Dallas,_South_Dakota_1936.jpg . Public Domain
27. Courtesy of Dr. Jennifer L. Graham, US Geological Survey. http://gallery.usgs.gov/photos/06_30_2010_hLc5FSq11Y_06_30_2010_11#.T767jMV62Sp . Public Domain
28. User:Nipik/Wikimedia Commons. http://commons.wikimedia.org/wiki/File:Acid_rain_woods1.JPG . PublicDomain
47

1.6. References www.ck12.org
29. Courtesy of the US Environmental Protection Agency. http://epa.gov/climatechange/indicators/slideshow.html?placeValuesBeforeTB_=savedValues&TB_iframe=true&height=550&width=800 . Public Domain
30. Courtesy of NASA, modified by Zachary Wilson/CK-12 Foundation. http://commons.wikimedia.org/wiki/File:Temperature_global.gif . Public Domain
31. Steven Lai and Zachary Wilson, based on data from Carbon Dioxide Information Analysis Center (http://cdiac.ornl.gov/ftp/trends/co2/maunaloa.co2).CK-12 Foundation . CC BY-NC 3.0
48