communications fraud control association (cfca) · pdf filefor more information please visit:...
TRANSCRIPT

Communications Fraud
Control Association
2013 Global Fraud Loss Survey

Overview
Survey Type & Methodology
Executive Summary
Results Fraud Management Snapshot
Top Fraud Methods & Types
Top Countries Where Fraud Originates & Terminates
Comparison of Fraud Trends
2013 Global Fraud Loss Estimate
2013 Estimated Fraud Losses by Method, Type, CSP Size and Region

Survey Type & Methodology
Panel of Experts Survey:
Surveys taken from fraud and security experts working within
the industry who are directly involved in identifying and
stopping communications fraud
Responses were received from:
93 Communications Service Providers (CSPs) located throughout the
industry and around the globe
CSPs included both Small (<1K employees) and Large (100K+)
CSPs included wireless, wireline, broadband, and narrowband service
providers
CSPs reported providing service in multiple areas including: voice, data,
financial services, and content distribution

Executive Summary Highlights: 2013 Global Fraud Loss Estimate*:
$46.3 Billion (USD) annually—The 15% increase from 2011 is a result of increased fraudulent activity targeting the wireless industry.
Approx. 2.09% of telecom revenues—The 0.21% increase from 2011 is a result of fraud losses growing at a faster pace than global telecom revenues.
94% said global fraud losses had increased or stayed the same–a 4% decrease from 2011.
92% said fraud had trended up or stayed the same within their company—a 3% increase from 2011.
Top 5 Fraud Methods Reported by Surveyed Companies: $5.22 B – Subscription Fraud $4.42 B – PBX Hacking $3.62 B – Account Take Over / Identity
Theft $3.62 B – VoIP Hacking $3.35 B – Dealer Fraud
Top 5 Fraud Types Reported by Surveyed Companies : $6.11 B – Roaming Fraud $5.32 B – Wholesale Fraud $4.73 B – Premium Rate Service $3.55 B – Cable or Satellite Signal
Theft $2.96 B – Hardware Reselling
For more information please visit: www.cfca.org/fraudlosssurvey/
*Note: In 2013 fraud classifications were divided into methods and type categories

2013 CFCA Survey Results

2013 Survey
In which region are you located?
Note: Local, Regional, National and International CSPs participated in the survey
0.0%
5.0%
10.0%
15.0%
20.0%
25.0%
30.0%
35.0%
Asia SouthPacific
Centraland SouthAmerica
NorthAmerica
WesternEurope
EasternEurope
Africa MiddleEast
8.8%
2.2% 2.2%
28.6%
31.9%
11.0%
8.8%
6.6%

2013 Survey
Which services does your company provide?
0%
10%
20%
30%
40%
50%
60%
70%
80%
90%
Pre-paid Mobile Post-paid Mobile Fixed LineServices
Cable & Satellite Wholesale Internet Other
Voice (Examples: Local, Long Distance, & International)
Data (Examples: VoIP & Over-the-Top, and other communication services.)
Financial (Examples: mobile purchase & eCommerce)
Content (Examples: IPTV, Advertising, etc.)
Machine-to-Machine (Examples: Smart Meters, Cars, Sensors...)

2013 Survey
How many employees are in your company?
Note: Small, Medium and Large CSPs responded to the survey
17.9%
36.9% 17.9%
19.0%
3.6% 4.8%
<1,0001,001 to 5,0005,001 to 10,00010,001 to 50,00050,001 to 100,000100,001 +

2013 Survey
How many subscribers does your company have? 6.0%
14.5%
33.7% 18.1%
14.5%
8.4%
4.8%
<10,000
10,001 to 1,000,000
1,000,001 to 10,000,000
10,000,001 to 25,000,000
25,000,001 to 50,000,000
50,000,001 +
Wholesale Only (no enduser subscribers)

2013 Survey
Where is your fraud department situated?
Since 2011 about 8% of Fraud Departments have moved from under Finance to IT &
Security; Other functional areas included Risk Management, Internal Audit, Revenue
Assurance, Customer Care, Network Operations and Routing.
Finance
IT
Operations
Security
0% 10% 20% 30% 40% 50%
45.3%
4.7%
17.2%
32.8%
Finance
IT
Operations
Security

2013 Survey How many are in your Fraud department?
Fraud departments grew by about 2% since 2011. However, larger departments reduced
Fraud Analyst positions by about 5%.
Notes: ‘Other’ category includes staff managers and supervisors. Some CSPs reported
revenue assurance and subpoena compliance personnel in their departments. Some CSPs
also reported as little as one person on staff.
0%
10%
20%
30%
40%
50%
60%
Analysts Investigators Administrative & CaseManagement
Other (please specify)
36%
42%
51% 50%
27% 26% 28%
25%
20%
26%
16%
13% 12%
2% 0%
13%
5% 5% 4%
0%
< 3 3 to 5 6 to 20 21 to 50 51 +

2013 Survey
When is your fraud department staffed?
0% 10% 20% 30% 40% 50% 60% 70% 80% 90% 100%
Weekdays
Weekend
Holidays
65%
42%
44%
47%
50%
44%
32%
41%
44%
11%
17%
15%
Off-Hours Coverage Provided byAnother Organization
Non-Business Hours (24 Hours)
Extended Business Hours
Business Hours
Off-hour coverage on weekends and weekdays grew by about 3% since 2011.

2013 Survey What functions apply to your current role and
responsibilities?
0.0% 10.0% 20.0% 30.0% 40.0% 50.0% 60.0% 70.0% 80.0%
Systems Administrator
Fraud Investigation
Non-Supervisory
Sales/Marketing
Operations
Security/Physical
Investigation
End User
Fraud Detection
Supervisory
Customer Service
Finance/Billing/Revenue Assurance
Legal/Regulatory
Security/Network
Law Enforcement
Vendor/Consultant
10.6%
68.1%
4.3%
8.5%
25.5%
12.8%
40.4%
10.6%
76.6%
38.3%
21.3%
36.2%
12.8%
25.5%
10.6%
2.1%

2013 Survey Are you a member of any other organizations?
Many CSPs reported being a member of more than one organization
CFCA 29%
GSMA FF 33%
FIINA 14%
ETNO 8%
TM Forum (RA) 2%
ATFRA 3%
CINNA 2%
i3 3%
NCFTA 2%
TRMA 3%
DFF 2%
CFCA GSMA FF FIINA ETNO TM Forum (RA) ATFRA CINNA i3 NCFTA TRMA DFF

2013 Survey
How many fraud incidents does your department
handle per month?
Estimated Monthly Case Volumes
< 50, 22.5%
51 to 100, 16.3%
101 to 500, 28.8%
501 to 1,000, 7.5%
1,001 +, 25.0%
On average, fraud departments reported 117% more cases per month since
2011. The majority of these cases were reported by North American and
Western European CSPs.
-
20,000
40,000
60,000
80,000
100,000
120,000
140,000
160,000
180,000
200,000
54,569
13,642 13,642
177,349
197,812
68,211 54,569
40,927
Estimated Cases Annually Per Region
Asia South PacificCentral and South America North AmericaWestern Europe Eastern EuropeAfrica Middle East

2013 Survey
How many cases does your department refer
to law enforcement per YEAR?
< 10; 42.9%
11 to 100; 34.3%
101 +; 11.4%
None; 11.4%
Since 2011, there was no change in the number of CSPs not referring cases to
law enforcement. CSPs that do refer cases reported an 11% increase.

2013 Survey
Why do you think cases are not reported to law
enforcement?
CSPs reported an increase in faith and confidence in law enforcement to pursue cases.
However, many reported continued resource constraints in this area.
0.0%
2.0%
4.0%
6.0%
8.0%
10.0%
12.0%
14.0%
16.0%
18.0%
20.0%
13.6%
4.5%
18.2%
12.1%
18.2%
13.6%
19.7% Debt recovery pursued throughcivil means
No faith in the judicial system toadminister the right punishmentto deter othersNo perceived value to thebusiness
Not referred due to lack ofevidence
Perceived lack of interest by lawenforcement to take the case
Perceived lack of understandingby law enforcement to pursuethe caseLack of resources

2013 Survey
What do you view as the top 5 fraud methods
GLOBALLY?
0% 2% 4% 6% 8% 10% 12% 14%
Roaming Fraud
Wholesale Fraud
Premium Rate Service
Cable or Satellite
Hardware Reselling
13%
11%
10%
8%
6%

2013 Survey
What do you view as the top 5 fraud types
GLOBALLY? 0% 5% 10% 15% 20%
International Revenue Share Fraud (IRSF)
Roaming Fraud
Premium Rate Service
Interconnect Bypass (e.g. SIM box)
Payment Fraud
16%
11%
10%
9%
7%
In 2011, the top 5 fraud types were: PBX/VM Fraud, International Revenue
Share Fraud, Subscription Fraud, Bypass Fraud and Roaming Fraud.

2013 Survey What do you view as the top 5 fraud methods
at YOUR COMPANY? 0% 2% 4% 6% 8% 10% 12%
Subscription Fraud
PBX Hacking
Account Takeover / Identity Take Over
VoIP Hacking
Dealer Fraud
11%
10%
8%
8%
7%

2013 Survey
What do you view as the top 5 fraud types at
YOUR COMPANY? 0% 2% 4% 6% 8% 10% 12% 14%
Roaming Fraud
Wholesale Fraud
Premium Rate Service
Cable or Satellite
Hardware Reselling
13%
11%
10%
8%
6%
In 2011, the top 5 fraud types were: PBX/VM Fraud, Subscription Fraud,
International Revenue Share Fraud, Bypass Fraud and Credit Card Fraud.

2013 Survey
What do you view as the top 5 EMERGING
fraud methods GLOBALLY? 0% 2% 4% 6% 8% 10% 12% 14%
PBX Hacking
Subscription Fraud
VoIP Hacking
Dealer Fraud
Account Takeover / Identity Take Over
12%
10%
10%
7%
6%

2013 Survey
What do you view as the top 5 EMERGING
fraud types GLOBALLY? 0% 2% 4% 6% 8% 10% 12% 14%
International Revenue Share Fraud (IRSF)
Roaming Fraud
Interconnect Bypass (e.g. SIM box)
Premium Rate Service
Domestic Revenue Share (DRSF)
14%
10%
9%
8%
8%
% of Total Responses
In 2011, the top 5 fraud types were: PBX/VM Fraud, International Revenue
Share Fraud, Bypass Fraud, Arbitrage and Subscription Fraud.

2013 Survey
0% 2% 4% 6% 8% 10% 12%
Subscription Fraud
PBX Hacking
Account Takeover / Identity Take Over
VoIP Hacking
Dealer Fraud
Abuse of Service Terms & Conditions
Abuse of network, device or configuration weakness-…
Social Engineering
Stolen Credit Cards & Returned or Counterfeit Checks
Voicemail Hacking
Wangiri
Pre-Paid Equipment & Services
Phishing / Pharming (e.g. internet fraud)
SMS Faking or Spoofing
Network/IT Abuse (e.g. Internal fraud/employee theft)
Unauthorized abuse of access (e.g. Customer Care System)
Brand Name / Logo Abuse
Clip-on Fraud
Signalling Manipulation
Mobile Malware
Proxy Fraud
SIM Cloning
11%
10%
8%
8%
7%
6%
5%
4%
4%
4%
4%
4%
4%
3%
3%
3%
2%
2%
2%
2%
2%
1%
Fraud Methods in YOUR COMPANY

2013 Survey
0% 2% 4% 6% 8% 10% 12% 14%
Roaming Fraud
Wholesale Fraud
Premium Rate Service
Cable or Satellite
Hardware Reselling
Service Reselling (e.g: Call Sell)
IMEI Reprogramming
Arbitrage
Theft / Compromise of data (e.g. logins)
Interconnect Bypass (e.g. SIM box)
International Revenue Share Fraud (IRSF)
Payment Fraud
Theft of Content
Denial of Service (DoS) and Distributed Denial of Service (DDoS)
Theft / Stolen Goods
Commissions Fraud
Private Use
Domestic Revenue Share (DRSF)
Spamming
13%
11%
10%
8%
6%
6%
6%
5%
5%
4%
4%
4%
4%
3%
3%
3%
3%
2%
2%
Fraud Types in YOUR COMPANY

2013 Survey
Top 10 Countries That ORIGINATE Fraudulent Calls:
0%
1%
2%
3%
4%
5%
6%
7%
8% 7%
4% 4% 3% 3%
3% 3% 3% 3% 2% %
of
Res
po
nse
s
The top 3 countries remained unchanged from 2011.

2013 Survey
Top 10 Countries Where Fraud TERMINATES:
0%
1%
2%
3%
4%
5%
6%
7%
8%
9%
10%
Latvia Gambia Somalia SierraLeone
Guinea Cuba EastTimor
Lithuania Taiwan UnitedKingdom
10%
8%
7% 6%
6%
4% 4% 4% 4% 4%
% o
f R
esp
on
ses
Cuba was the top response in 2011, showing a shift from Call Sell fraud to
IRSF fraud

2013 Survey
Over the past 12 months, do you think GLOBAL
fraud losses have trended up, trended down, or stayed
the same?
Trended UP Trended DOWN Stayed the SAME
0.0%
10.0%
20.0%
30.0%
40.0%
50.0%
60.0%
70.0%
80.0%
59.0%
20.5% 20.5%
47.2%
15.4%
37.4%
65.2%
2.2%
32.6%
70.5%
6.6%
23.0% % o
f R
esp
on
ses
2005 2008 2011 2013

2013 Survey
Over the past 12 months, has fraud IN YOUR
COMPANY trended up, trended down, or stayed
the same?
Note: In 2013 90+% of CSPs reported fraud had increased or stayed the same.
0.0%
10.0%
20.0%
30.0%
40.0%
50.0%
60.0%
70.0%
Trended UP Trended DOWN Stayed the SAME
40.0%
25.0%
35.0% 35.4%
21.5%
43.1%
64.4%
11.1%
24.4%
52.5%
8.2%
39.3%
% o
f R
es
po
nse
s
2006 2009 2011 2013

2013 Survey
What percentage of bad debt is a result of fraud
in YOUR COMPANY?
0.0%
10.0%
20.0%
30.0%
40.0%
50.0%
60.0%
70.0%
< 10% 10-20% 21-30% 31-40% 41-50% > 50%
63.8%
22.4%
6.9% 5.2%
0.0% 1.7%
% o
f R
es
po
nse
s
In 2013 some CSPs reported >50% bad debt related to fraud

2013 Survey
What percentage of the total GLOBAL telecom
revenue base do you think is fraud?
0%
5%
10%
15%
20%
25%
30%
< 1% 1-2% 2-3% 3-4% 4-5% 5-10% > 10%
12.3%
26.3%
15.8%
17.5%
8.8%
10.5%
8.8%
% o
f R
esp
on
ses
In 2011 27% believed fraud losses were 4-5%, 13% believed they were 5-10%,
and 0% believed they were more than 10%.

2013 Survey
What percentage of YOUR COMPANY’S
revenue base do you think is fraud?
0%
5%
10%
15%
20%
25%
30%
35%
40%
45%
50%
< 1% 1-2% 2-3% 3-4% 4-5% 5-10% > 10%
45.6%
24.6%
12.3%
1.8% 3.5%
10.5%
1.8%
% o
f R
esp
on
ses
In 2011 14% believed fraud losses were 4-5%, 5% believed they were 5-10%,
and 0% believed they were more than 10%.

2013 Survey Comparison Between 2008, 2011 and 2013
Survey Results in YOUR COMPANY
0%
5%
10%
15%
20%
25%
30%
35%
40%
45%
50%
< 1% 1-2% 2-3% 3-4% 4-5% 5-10% > 10%
23%
15% 13%
12% 10%
27%
0%
46%
23%
11%
2%
14%
5%
0%
46%
25%
12%
2% 4%
11%
2%
% o
f R
esp
on
ses
2008 2011 2013

2013 Survey Of the global telecom revenue base, what
percentage do you think is fraud in YOUR COMPANY?
Fraud Losses by Region
0%
2%
4%
6%
8%
10%
12%
14%
16%
Asia SouthPacific
Central andSouth
America
NorthAmerica
WesternEurope
EasternEurope
Africa MiddleEast
% o
f R
esp
on
ses
< 1% 1-2% 2-3% 3-4% 4-5% 5-10% > 10%

2013 Global Fraud Loss Estimate
Of the global telecom revenue base, what
percentage do you think is fraud?
CSPs with 1-10M subscribers reported the most fraud losses. In 2011 CSPs
with 50M+ subscribers reported 34% fewer fraud losses.
0%
2%
4%
6%
8%
10%
12%
14%
16%
18%
< 1% 1-2% 2-3% 3-4% 4-5% 5-10% > 10%
% o
f R
esp
on
ses
<1,000,000 1,000,001 to 10,000,000
10,000,001 to 50,000,000 25,000,001 to 50,000,000
50,000,001 + Wholesale Only (no end user subscribers)
Fraud Losses by Size
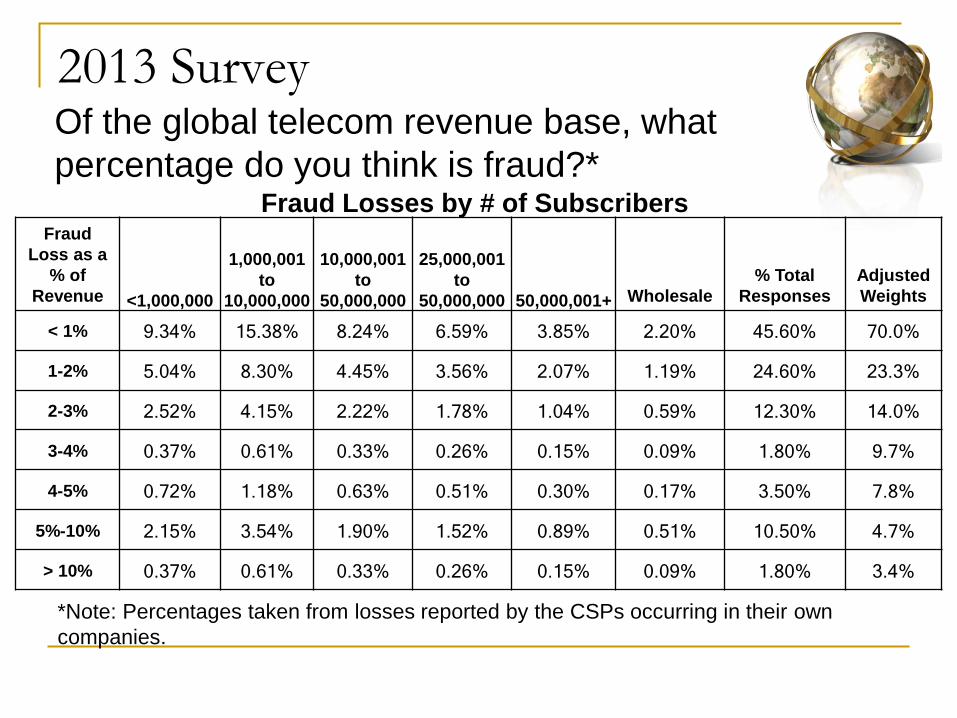
2013 Survey Of the global telecom revenue base, what
percentage do you think is fraud?*
Fraud
Loss as a
% of
Revenue <1,000,000
1,000,001
to
10,000,000
10,000,001
to
50,000,000
25,000,001
to
50,000,000 50,000,001+ Wholesale
% Total
Responses
Adjusted
Weights
< 1% 9.34% 15.38% 8.24% 6.59% 3.85% 2.20% 45.60% 70.0%
1-2% 5.04% 8.30% 4.45% 3.56% 2.07% 1.19% 24.60% 23.3%
2-3% 2.52% 4.15% 2.22% 1.78% 1.04% 0.59% 12.30% 14.0%
3-4% 0.37% 0.61% 0.33% 0.26% 0.15% 0.09% 1.80% 9.7%
4-5% 0.72% 1.18% 0.63% 0.51% 0.30% 0.17% 3.50% 7.8%
5%-10% 2.15% 3.54% 1.90% 1.52% 0.89% 0.51% 10.50% 4.7%
> 10% 0.37% 0.61% 0.33% 0.26% 0.15% 0.09% 1.80% 3.4%
*Note: Percentages taken from losses reported by the CSPs occurring in their own
companies.
Fraud Losses by # of Subscribers

2013 Survey
2013 Estimated Global Telecom Revenues*:
$2.214 Trillion (USD)
2013 Estimated Global Loss:
$46.3 Billion (USD), or 2.09%
Loss Calculation: ∑((CSP Size x % by Group) x Group Midpoint)/100) x
Global Telecom Revenues
Notes:
Fraud loss weights based on CSP size helps avoid bias created when small and large CSP responses are combined.
*Source: The Insight Research Corporation – http://www.insight-corp.com/reports/review13.asp
(Estimate for 2013)

2013 Survey Comparison to Previous Surveys
2005 2008 2011 2013 % Var
Estimated Global
Revenues
$1.2 Trillion
(USD)
$1.7 Trillion
(USD)
$2.1 Trillion
(USD)
$2.2 Trillion
(USD) +3.7%
Estimated Global
Fraud Loss
$61.3 Billion
(USD)
$60.1 Billion
(USD)
$40.1 Billion
(USD)
$46.3 Billion
(USD) +15.4%
% Loss* 5.11% 3.54% 1.88% 2.09% +0.21%
In 2013, growth in global revenue outpaced reported fraud losses. However, as a percent of revenue, fraud is growing at a faster rate than in 2011.
*Note: In 2011 losses were recalculated using a new methodology
$0
$500,000
$1,000,000
$1,500,000
$2,000,000
$2,500,000
2005 2006 2007 2008 2009 2010 2011 2012 2013
Est. Global Telecom Revenues Est. Global Fraud Loss
0%
1%
2%
3%
4%
5%
6%
2005 2008 2011 2013

2013 Global Fraud Loss Estimate 2013 Estimated Fraud Losses by CSP Type
(in $ USD Billions)
$9.92 ; 21%
$11.52 ; 25%
$6.35 ; 14%
$2.64 ; 6%
$5.84 ; 12% $7.25 ; 16%
$2.86 ; 6% Pre-paid Mobile
Post-paid Mobile
Fixed Line Services
Cable & Satellite
Wholesale
Internet
Other

2013 Global Fraud Loss Estimate 2013 Estimated Fraud Losses by Service Type
(in $ USD Billions)
$13.46 ; 29%
$11.80 ; 25%
$6.98 ; 15% $8.14 ; 18%
$5.98 ; 13%
Voice (Examples: Local, LongDistance, & International)
Data (Examples: VoIP & Over-the-Top, other alternate communicationservices...)
Financial (Examples: mobilepurchase & eCommerce)
Content (Examples: IPTV,Advertising, etc.)
Machine-to-Machine (Examples:Smart Meters, Cars, Sensors...)

2013 Survey
Subscription Fraud; $5.2
PBX Hacking; $4.4
Account Takeover / Identity Take Over; $3.6 VoIP Hacking; $3.6
Dealer Fraud; $3.3 Abuse of Service Terms &
Conditions; $2.7
Abuse of network, device or configuration weakness; $2.5
Social Engineering; $2.0
Stolen Credit Cards & Returned or Counterfeit
Checks; $2.0
Voicemail Hacking; $2.0
Wangiri; $2.0
Pre-Paid Equipment & Services; $1.9
Phishing / Pharming (e.g. internet fraud); $1.7
SMS Faking or Spoofing; $1.6
Network/IT Abuse (e.g. Internal fraud/employee theft); $1.3
Unauthorized abuse of access (e.g. Customer
Care System); $1.2
Brand Name / Logo Abuse; $1.1
Clip-on Fraud; $0.9
Signalling Manipulation; $0.9
Mobile Malware; $0.8
Proxy Fraud; $0.8
SIM Cloning; $0.5
2013 Estimated Fraud Losses by Method (in $ USD Billions)

2013 Survey
Roaming Fraud; $6.1
Wholesale Fraud; $5.3
Premium Rate Service; $4.7
Cable or Satellite; $3.5 Hardware Reselling; $3.0
Service Reselling (e.g: Call Sell); $2.8
IMEI Reprogramming; $2.6
Arbitrage; $2.2
Theft / Compromise of data (e.g. logins); $2.2
Interconnect Bypass (e.g. SIM box); $2.0
International Revenue Share Fraud (IRSF); $1.8
Payment Fraud; $1.8 Theft of Content; $1.8
Denial of Service (DoS) and Distributed Denial of Service
(DDoS); $1.4
Theft / Stolen Goods; $1.4
Commissions Fraud; $1.2
Private Use; $1.2
Domestic Revenue
Share (DRSF); $0.8
Spamming; $0.8
2013 Estimated Fraud Losses by Type (in $ USD Billions)

2013 Survey Estimated Fraud Losses by Method by Size
(In Billions $ USD)
Fraud Method <1,000,000
1,000,001 to
10,000,000
10,000,001 to
50,000,000
25,000,001 to
50,000,000 50,000,001 +
Wholesale Only
(no end user subs)
Abuse of network, device or configuration
weakness $0.52 $0.86 $0.46 $0.37 $0.21 $0.12
Abuse of Service Terms & Conditions $0.55 $0.90 $0.48 $0.39 $0.23 $0.13
Account Takeover / Identity Take Over $0.74 $1.22 $0.65 $0.52 $0.30 $0.17
Brand Name / Logo Abuse $0.22 $0.36 $0.19 $0.15 $0.09 $0.05
Clip-on Fraud $0.19 $0.32 $0.17 $0.14 $0.08 $0.05
Dealer Fraud $0.69 $1.13 $0.60 $0.48 $0.28 $0.16
Mobile Malware $0.16 $0.27 $0.15 $0.12 $0.07 $0.04
Network/IT Abuse (e.g. Internal
fraud/employee theft) $0.27 $0.45 $0.24 $0.19 $0.11 $0.06
PBX Hacking $0.91 $1.49 $0.80 $0.64 $0.37 $0.21
Phishing / Pharming (e.g. internet fraud) $0.36 $0.59 $0.31 $0.25 $0.15 $0.08
Pre-Paid Equipment & Services $0.38 $0.63 $0.34 $0.27 $0.16 $0.09
Proxy Fraud $0.16 $0.27 $0.15 $0.12 $0.07 $0.04
Signalling Manipulation $0.19 $0.32 $0.17 $0.14 $0.08 $0.05
SIM Cloning $0.11 $0.18 $0.10 $0.08 $0.05 $0.03
SMS Faking or Spoofing $0.33 $0.54 $0.29 $0.23 $0.14 $0.08
Social Engineering $0.41 $0.68 $0.36 $0.29 $0.17 $0.10
Stolen Credit Cards & Returned or
Counterfeit Checks $0.41 $0.68 $0.36 $0.29 $0.17 $0.10
Subscription Fraud $1.07 $1.76 $0.94 $0.75 $0.44 $0.25
Unauthorized abuse of access (e.g.
Customer Care System) $0.25 $0.41 $0.22 $0.17 $0.10 $0.06
Voicemail Hacking $0.41 $0.68 $0.36 $0.29 $0.17 $0.10
VoIP Hacking $0.74 $1.22 $0.65 $0.52 $0.30 $0.17
Wangiri $0.41 $0.68 $0.36 $0.29 $0.17 $0.10
Total $9.49 $15.63 $8.37 $6.70 $3.91 $2.23

2013 Survey Estimated Fraud Losses by Fraud Type by Size
(In Billions $ USD)
Fraud Type <1,000,000
1,000,001 to
10,000,000
10,000,001 to
50,000,000
25,000,001 to
50,000,000 50,000,001 +
Wholesale Only
(no end user subs)
Arbitrage $0.44 $0.73 $0.39 $0.31 $0.18 $0.10
Cable or Satellite $0.73 $1.20 $0.64 $0.51 $0.30 $0.17
Commissions Fraud $0.24 $0.40 $0.21 $0.17 $0.10 $0.06
Denial of Service (DoS) and
Distributed Denial of Service
(DDoS)
$0.28 $0.47 $0.25 $0.20 $0.12 $0.07
Domestic Revenue Share (DRSF) $0.16 $0.27 $0.14 $0.11 $0.07 $0.04
Hardware Reselling $0.61 $1.00 $0.53 $0.43 $0.25 $0.14
IMEI Reprogramming $0.52 $0.86 $0.46 $0.37 $0.22 $0.12
Interconnect Bypass (e.g. SIM box) $0.40 $0.67 $0.36 $0.29 $0.17 $0.10
International Revenue Share Fraud
(IRSF) $0.36 $0.60 $0.32 $0.26 $0.15 $0.09
Payment Fraud $0.36 $0.60 $0.32 $0.26 $0.15 $0.09
Premium Rate Service $0.97 $1.60 $0.86 $0.68 $0.40 $0.23
Private Use $0.24 $0.40 $0.21 $0.17 $0.10 $0.06
Roaming Fraud $1.25 $2.06 $1.10 $0.88 $0.52 $0.29
Service Reselling (e.g: Call Sell) $0.57 $0.93 $0.50 $0.40 $0.23 $0.13
Spamming $0.16 $0.27 $0.14 $0.11 $0.07 $0.04
Theft / Compromise of data (e.g.
logins) $0.44 $0.73 $0.39 $0.31 $0.18 $0.10
Theft / Stolen Goods $0.28 $0.47 $0.25 $0.20 $0.12 $0.07
Theft of Content $0.36 $0.60 $0.32 $0.26 $0.15 $0.09
Wholesale Fraud $1.09 $1.80 $0.96 $0.77 $0.45 $0.26
Total $9.49 $15.63 $8.37 $6.70 $3.91 $2.23

2013 Survey Estimated Fraud Losses by Method by Region
(In Billions $ USD)
Fraud Method Asia South Pacific
Central and
South America North America
Western
Europe
Eastern
Europe Africa Middle East
Abuse of network, device or
configuration weakness $0.22 $0.06 $0.06 $0.73 $0.81 $0.28 $0.22 $0.17
Abuse of Service Terms & Conditions $0.24 $0.06 $0.06 $0.77 $0.85 $0.29 $0.24 $0.18
Account Takeover / Identity Take Over $0.32 $0.08 $0.08 $1.03 $1.15 $0.40 $0.32 $0.24
Brand Name / Logo Abuse $0.09 $0.02 $0.02 $0.31 $0.34 $0.12 $0.09 $0.07
Clip-on Fraud $0.08 $0.02 $0.02 $0.27 $0.30 $0.10 $0.08 $0.06
Dealer Fraud $0.29 $0.07 $0.07 $0.96 $1.07 $0.37 $0.29 $0.22
Mobile Malware $0.07 $0.02 $0.02 $0.23 $0.26 $0.09 $0.07 $0.05
Network/IT Abuse (e.g. Internal
fraud/employee theft) $0.12 $0.03 $0.03 $0.38 $0.43 $0.15 $0.12 $0.09
PBX Hacking $0.39 $0.10 $0.10 $1.26 $1.41 $0.49 $0.39 $0.29
Phishing / Pharming (e.g. internet
fraud) $0.15 $0.04 $0.04 $0.50 $0.55 $0.19 $0.15 $0.11
Pre-Paid Equipment & Services $0.16 $0.04 $0.04 $0.54 $0.60 $0.21 $0.16 $0.12
Proxy Fraud $0.07 $0.02 $0.02 $0.23 $0.26 $0.09 $0.07 $0.05
Signalling Manipulation $0.08 $0.02 $0.02 $0.27 $0.30 $0.10 $0.08 $0.06
SIM Cloning $0.05 $0.01 $0.01 $0.15 $0.17 $0.06 $0.05 $0.04
SMS Faking or Spoofing $0.14 $0.04 $0.04 $0.46 $0.51 $0.18 $0.14 $0.11
Social Engineering $0.18 $0.04 $0.04 $0.57 $0.64 $0.22 $0.18 $0.13
Stolen Credit Cards & Returned or
Counterfeit Checks $0.18 $0.04 $0.04 $0.57 $0.64 $0.22 $0.18 $0.13
Subscription Fraud $0.46 $0.11 $0.11 $1.49 $1.66 $0.57 $0.46 $0.34
Unauthorized abuse of access (e.g.
Customer Care System) $0.11 $0.03 $0.03 $0.34 $0.38 $0.13 $0.11 $0.08
Voicemail Hacking $0.18 $0.04 $0.04 $0.57 $0.64 $0.22 $0.18 $0.13
VoIP Hacking $0.32 $0.08 $0.08 $1.03 $1.15 $0.40 $0.32 $0.24
Wangiri $0.18 $0.04 $0.04 $0.57 $0.64 $0.22 $0.18 $0.13
Total $4.07 $1.02 $1.02 $13.24 $14.76 $5.09 $4.07 $3.05

2011 Survey Estimated Fraud Losses by Fraud Type by Region
(In Billions $ USD)
Fraud Type Asia South Pacific
Central and
South America North America
Western
Europe
Eastern
Europe Africa Middle East
Arbitrage $0.19 $0.05 $0.05 $0.62 $0.69 $0.24 $0.19 $0.14
Cable or Satellite $0.31 $0.08 $0.08 $1.01 $1.13 $0.39 $0.31 $0.23
Commissions Fraud $0.10 $0.03 $0.03 $0.34 $0.38 $0.13 $0.10 $0.08
Denial of Service (DoS) and
Distributed Denial of Service (DDoS) $0.12 $0.03 $0.03 $0.39 $0.44 $0.15 $0.12 $0.09
Domestic Revenue Share (DRSF) $0.07 $0.02 $0.02 $0.23 $0.25 $0.09 $0.07 $0.05
Hardware Reselling $0.26 $0.06 $0.06 $0.84 $0.94 $0.32 $0.26 $0.19
IMEI Reprogramming $0.23 $0.06 $0.06 $0.73 $0.82 $0.28 $0.23 $0.17
Interconnect Bypass (e.g. SIM box) $0.17 $0.04 $0.04 $0.56 $0.63 $0.22 $0.17 $0.13
International Revenue Share Fraud
(IRSF) $0.16 $0.04 $0.04 $0.51 $0.57 $0.19 $0.16 $0.12
Payment Fraud $0.16 $0.04 $0.04 $0.51 $0.57 $0.19 $0.16 $0.12
Premium Rate Service $0.42 $0.10 $0.10 $1.35 $1.51 $0.52 $0.42 $0.31
Private Use $0.10 $0.03 $0.03 $0.34 $0.38 $0.13 $0.10 $0.08
Roaming Fraud $0.54 $0.13 $0.13 $1.75 $1.95 $0.67 $0.54 $0.40
Service Reselling (e.g: Call Sell) $0.24 $0.06 $0.06 $0.79 $0.88 $0.30 $0.24 $0.18
Spamming $0.07 $0.02 $0.02 $0.23 $0.25 $0.09 $0.07 $0.05
Theft / Compromise of data (e.g.
logins) $0.19 $0.05 $0.05 $0.62 $0.69 $0.24 $0.19 $0.14
Theft / Stolen Goods $0.12 $0.03 $0.03 $0.39 $0.44 $0.15 $0.12 $0.09
Theft of Content $0.16 $0.04 $0.04 $0.51 $0.57 $0.19 $0.16 $0.12
Wholesale Fraud $0.47 $0.12 $0.12 $1.52 $1.70 $0.58 $0.47 $0.35
Total $4.07 $1.02 $1.02 $13.24 $14.76 $5.09 $4.07 $3.05

2013 Survey Fraud Method Definitions: Fraud Method Description
Abuse of network, device or configuration
weakness--Exploitation of a configuration
weakness to gain access to a network or device
Exploitation of a configuration weakness to gain access to a network or device
Abuse of Service Terms & Conditions Violation of the carrier's service terms and conditions or acceptable use policy
Account Takeover / Identity Take Over Use of identity information (real or synthetic ID theft) to obtain a new account or to gain access to an
existing account
Brand Name / Logo Abuse Acquisition and use of a company's logo without permission
Clip-on Fraud Stealing service by attaching wires to another customer's phone equipment
Dealer Fraud All types of fraud conducted by indirect and 3rd party dealers
Mobile Malware Compromised mobile applications
Network/IT Abuse (e.g. Internal fraud/employee
theft) Theft of service or equipment by employees
PBX Hacking Compromised PBX systems used to make calls
Phishing / Pharming (e.g. internet fraud) Stealing bandwidth, hacking, phishing, vishing, etc.
Pre-Paid Equipment & Services All types of fraud and abuse involving pre-paid equipment and services
Proxy Fraud Manipulation of the IP address to hide someone's true origination or identity
Signalling Manipulation Manipulation of the SIP or SS7 signaling message to hide the true origination or identity of a caller
SIM Cloning Duplicated SIM card used to charge phone calls back to the original SIM card
SMS Faking or Spoofing Manipulation of the ANI to hide the true origination or identity of the caller
Social Engineering Manipulation of an employee or customer to unintentionally give out important information
Stolen Credit Cards & Returned or Counterfeit
Checks All types of fraud involving stolen credit cards, returned or counterfeit checks
Subscription Fraud Use of service with no intent to pay
Unauthorized abuse of access (e.g. Customer
Care System) Unauthorized abuse of company's credit and adjustment policy
Voicemail Hacking Compromised Voicemail systems used to make calls
VoIP Hacking Compromised VoIP equipment such as an IP PBX or Modem used to make fraudulent calls
Wangiri Call-back fraud schemes

2013 Survey Fraud Type Definitions:
Fraud Type Description
Arbitrage Exploitation of the differences in rates between different countries
Cable or Satellite Signal theft or retransmission from a cable or satellite provider
Commissions Fraud Schemes used by dealers to collect additional commissions and spiffs
Denial of Service (DoS) and
Distributed Denial of Service
(DDoS)
An explicit attempt to make a machine or network resource unavailable to the users of a service
Domestic Revenue Share
(DRSF)
Abuse of Carrier Interconnect agreements through such things as Traffic Pumping, Switch Access Stimulation,
8yy Dip Pumping & CNAM Revenue pumping schemes
Hardware Reselling Resold handsets or equipment
IMEI Reprogramming Changing the IMEI of a handset to hide the true origination or identity of a caller
Interconnect Bypass (e.g. SIM
box)
Unauthorized insertion of traffic onto another carriers’ network. This includes Interconnect Fraud and GSM
Gateway Fraud or SIM Boxing.
International Revenue Share
Fraud (IRSF) Artificial inflation of traffic terminating to international revenue share providers
Payment Fraud Includes items such as charge-backs, returned checks, card holder not present, etc.
Premium Rate Service Artificial inflation of traffic terminating to premium service providers
Private Use Use of a service neither directly nor indirectly paid for without rendering some kind of financial compensation
Roaming Fraud All types of fraud and abuse involving roaming
Service Reselling (e.g: Call
Sell) Resale of stolen phone service to other people
Spamming Use of electronic messaging systems to send unsolicited bulk messages
Theft / Compromise of data
(e.g. logins) Includes such things as the acquisition of personal information or intellectual property
Theft / Stolen Goods Equipment Theft
Theft of Content Stealing content such as ringtones, games, or applications
Wholesale Fraud Exploitation of wholesale interconnect agreements

About Communications Fraud
Communications fraud is the use of telecommunications products or services with no intention of payment. Fraud negatively impacts everyone, including residential and commercial customers. The losses increase the communications carriers’ operating costs. Although communications operators have increased measures to minimize fraud and reduce their losses, criminals continue to abuse communications networks and services. Therefore, communications operators tend to keep their actual loss figures and their plans for corrective measures confidential. Due to the sensitive nature of this topic, CFCA used a confidential opinion survey of global communications operators to support the global fraud loss study.

About CFCA
CFCA is a not-for-profit global educational association that is working to combat communications fraud. The mission of the CFCA is to be the premier international association for revenue assurance, loss prevention and fraud control through education and information. By promoting a close association among telecommunications fraud security personnel, CFCA serves as a forum and clearinghouse of information pertaining to the fraudulent use of communications services. For more information, visit CFCA at www.CFCA.org.

Communications Fraud Control Association
4 Becker Farm Road 4th Floor
PO BOX 954
Roseland, NJ 07068
+1 973 871 4032 Phone
+1 973 871 4075 Fax
[email protected] email
www.cfca.org website
Roberta Aronoff – Executive Director