commercial and sport fisheries for lake whitefish in
TRANSCRIPT

FISHERIES DIVISION
RESEARCH REPORT
STATE OF MICHIGANDEPARTMENT OF NATURAL RESOURCESDNR
Michigan
Commercial and Sport Fisheries forLake Whitefish in Michigan Waters of
Lake Superior, 1983-96
Richard G. Schorfhaarand
Philip J. Schneeberger
Number 2034 June 30, 1997

MICHIGAN DEPARTMENT OF NATURAL RESOURCESFISHERIES DIVISION
COMMERCIAL AND SPORT FISHERIES FOR LAKE WHITEFISH INMICHIGAN WATERS OF LAKE SUPERIOR, 1983-96
Richard G. Schorfhaarand
Philip J. Schneeberger
The Michigan Department of Natural Resources, (MDNR) provides equal opportunities for employment and for access to Michigan’s natural resources. Stateand Federal laws prohibit discrimination on the basis of race, color, sex, national origin, religion, disability, age, marital status, height and weight. If you believethat you have been discriminated against in any program, activity or facility, please write the MDNR Equal Opportunity Office, P.O. Box 30028, Lansing,MI 48909, or the Michigan Department of Civil Rights, 1200 6th Avenue, Detroit, MI 48226, or the Office of Human Resources, U.S. Fish and Wildlife Service,Washington D.C. 20204.For more information about this publication or the American Disabilities Act (ADA), contact, Michigan Department of Natural Resources, Fisheries Division,Box 30446, Lansing, MI 48909, or call 517-373-1280.
Fisheries Research Report 2034June 30, 1997
Printed under authority of Michigan Department of Natural ResourcesTotal number of copies printed 200 — Total cost $577.98 — Cost per copy $2.80

1
Michigan Department of Natural ResourcesFisheries Research Report No. 2034, 1997
Commercial and Sport Fisheries for Lake Whitefishin Michigan Waters of Lake Superior, 1983-96
Richard G. Schorfhaar
Charlevoix Fisheries Station96 Grant Street
Charlevoix, MI 49721-0117
Philip J. Schneeberger
Marquette Fisheries Station484 Cherry Creek Road
Marquette, Michigan 49855
Abstract.–Lake whitefish were harvested in Michigan waters of Lake Superior by state-licensed commercial trap netters, tribal commercial gill netters, and sport anglers. Catch andeffort statistics were obtained from state summaries, tribal reports, and creel survey estimates.Biological data were analyzed for trap net and sport fisheries. Commercial catches increasedfrom 1983 to 1986, fluctuated between 1987 and 1992, then generally decreased through 1996.Average annual commercial catch was 354,364 kg during 1983-96. Average annual sport catch atKeweenaw Bay, Marquette, and Munising was less than 4,000 fish (~2,000 kg) during 1985-96.Total annual mortality rates were generally below the target maximum rate of 55% at Ontonagon,Big Bay, Marquette, Munising, and Grand Marais. Higher mortality rates were estimated forUpper Entry and Keweenaw Bay stocks. Weight-length regression coefficients and vonBertalanffy growth coefficients were generally similar regardless of fishing area or year.Calculations of total allowable catch did not match actual harvests, mostly because commercialfishing effort was variable and unpredictable from year to year. Annual estimates of mean lengthand mean age of fish in trap-net catches were greater than means for sport-caught fish. Comparedto sport-caught whitefish, those in trap nets were significantly longer for ages near the age ofrecruitment to commercial gear (age 5) at Marquette, and for a broader range of ages at Munising.At Keweenaw Bay there were instances where sport-caught fish were longer at age than those intrap nets. Among like-aged fish from different fishing areas, whitefish from Marquette andMunising were generally longest for commercial fisheries and those from Keweenaw werelongest for sport fisheries. Length-at-age was generally greatest in 1983 and 1984 for lakewhitefish in trap nets, and in 1988 for sport catches. There did not appear to be much conflictbetween sport and commercial trap-net fisheries where they occurred together.
Lake whitefish Coregonus clupeaformis isthe most important commercial species in
Michigan waters of Lake Superior in terms ofvalue per kg and number of kg landed. Annual

2
catch of lake whitefish averaged around 165,000kg between 1929 and 1943 (Baldwin et al.1979), then declined due in part to heavydepredation by sea lamprey Petromyzonmarinus. Following successful efforts to controlsea lamprey, lake whitefish populationsrebounded beginning in the early 1960s. During1976-81, commercial catches averaged about329,000 kg per year for traditionally exploitedstocks, and some additional stocks have beenexploited since the 1980s (Rakoczy 1983).
State-licensed lake whitefish fisheries inLake Superior have been managed bymanipulating seasons, size limits, gear limits(number, dimension, and mesh size), and fishingdepths. As required by a court-ordered consentdecree governing state and tribal fishing, totalallowable catches (TACs) have been calculatedin advance of fishing seasons for fishing areas in1836 treaty-ceded waters, which consist of LakeSuperior waters east of the mouth of theChocolay River near Marquette (Figure 1).TACs have also been calculated for lakewhitefish stocks in waters west of Marquette(1842 Treaty area), not covered by the consentdecree. Regulators have not enforced TACs, butinstead have regarded them as predictions ofcatch to be compared with actual harvests.
Total annual mortality is regarded as anindicator of the health and stability of lakewhitefish stocks. Clark (1984) reviewedavailable literature on lake whitefish stocks thathad been subjected to various levels ofexploitation and concluded that stocks with totalannual mortality rates above 70% suffer severepopulation fluctuations. It was decided that aconservative approach was warranted in settingtarget maximum total annual mortality rates forstocks in treaty waters because Lake Superiorwhitefish populations were prone to widefluctuations in year-class strength. A targetmaximum mortality rate of 55% was chosen, andby reasonable extension, the same targetmaximum was chosen as a benchmark for stocksin all Lake Superior fishing areas consideredherein.
Natural mortality of previously unexploitedlake whitefish populations was calculated tohave been 36% in Grand Traverse Bay, LakeMichigan (Rybicki 1980), and between 80 and85% at Upper Entry, Lake Superior (Peck 1994).
Koziol (1982) determined that total annualmortality (most of which was attributable tonatural mortality) of a lightly exploited whitefishpopulation near Isle Royale was between 51 and56%. Rakoczy (1983) examined various rates ofnatural mortality and judged that yield estimatesusing a natural mortality of 22% (instantaneousnatural mortality rate of 0.25) were mostsatisfactory for exploited Lake Superiorwhitefish populations in Michigan waters.
In Lake Superior (Figure 1), state-licensedcommercial trap-net fisheries currently operateat Keweenaw Bay, Marquette, and Munising,and under research permit at Big Bay. In pastyears, intermittent, exploratory, or permitfisheries have also operated near Ontonagon,Upper Entry, and Grand Marais. State-licensedwhitefish catches have been produced fromsingle trap net operations in each area exceptwhen a second trap netter fished briefly atMunising during the early 1990s. NativeAmerican gill-net fisheries have harvestedwhitefish since the mid-1980s.
State-licensed commercial fishing ispermitted during all months of the year exceptNovember (lake whitefish spawning season).However, ice and weather conditions effectivelyrestrict the fishing season to May throughOctober during most years. Minimum size is setat 432 mm total length (TL), except minimumsize limit was 483 mm for 3-4 years at both BigBay (1983 through 1987) and Upper Entry (1983through July of 1986). Minimum pot mesh sizeis 114-mm (stretched) and nets cannot be fishedat depths greater than 27 m. Fishers are allowedto retain and sell lake whitefish (legal size),white suckers Catostomus commersoni, longnosesuckers C. catostomus, carp Cyprinus carpio,and burbot Lota lota. Beginning in 1996, lakeherring Coregonus artedi could also be retained.All other species are required to be returned tothe water whether dead or alive.
Sport fishers catch lake whitefish by hookand line or spearing through the ice, from boats,and off piers and breakwalls. Currently inMichigan waters, sport anglers may fish for lakewhitefish throughout the year, there are no sizelimits, and the possession limit is 12. Sport andcommercial fisheries for lake whitefish are infairly close proximity to one another at variousGreat Lakes locations.

3
In this report, data were examined todetermine size and age structures of lakewhitefish harvested from different areas of LakeSuperior by commercial and sport fishers. Trap-net data were summarized and tabulated tofacilitate calculations of TACs in each fishingarea. Parameters and statistics were compared inan attempt to discern changes and differences infisheries over time, by fishing location, and byfishing method.
Methods
Catch (dressed kg) and effort (trap-net lifts)were reported monthly by each state-licensedcommercial fisher, and annual totals through1996 were summarized by Michigan Departmentof Natural Resources Fisheries Divisionpersonnel in Lansing, Michigan. Catch per unitof effort (CPE) for legal-sized lake whitefishwas calculated as dressed-weight kg per trap-netlift. Although nets were usually lifted every 4days, effort and CPE were not adjusted whenthere were differences in number of days fishedbetween lifts. In general, Marquette FisheriesStation personnel sampled the fishery in eacharea, one day per week, for 4-6 consecutiveweeks, on an annual basis. On each samplingday, 50-100 net-run legal-size lake whitefishwere measured (TL) and scales were collectedfor age determinations. Weights were obtainedfrom 100 to 403 fish per fishing area duringmost years.
Catch (dressed kg) and fishing effort (gill-net length) were summarized for tribal gill-netfisheries that harvested lake whitefish fromfishing areas near state-licensed trap-netoperations (tribal fisheries also exist in Michiganwaters of Lake Superior both east and west ofthe areas identified in this report). Gill-net datawere obtained from Great Lakes Indian Fish andWildlife Commission Administrative Reports(Ebener et al. 1985, 1989; Ebener and Bronte1986, 1987, 1988, 1990; Mattes et al. 1997) andfrom Tripartite Technical Fisheries ReviewCommittee Reports (TFRC 1985, 1986, 1987,1988, 1989, 1992). Gill-net CPE was defined asdressed-weight kg per 305 m of net. As withtrap-net data, gill net effort and CPE were notadjusted for number of days fished between lifts.
Sport catch and effort data were obtainedfrom on-site random stratified creel surveysconducted under the supervision of theCharlevoix Fisheries Station (Rakoczy andRogers 1987, 1988, 1990, 1991; Rakoczy andLockwood 1988; Rakoczy 1992 a, 1992 b;Rakoczy and Svoboda 1994, 1995; Rakoczypersonal communication 1997). Catch and effortestimates were made for individual ports foreach survey month using standard creel surveyanalysis methods described by Ryckman (1981).Lake whitefish biological data (length, weight,sex, maturity) were recorded and scale sampleswere collected by creel survey clerks.Biological data were collected randomly andwere assumed to have been representative ofsport-caught populations.
Ages of lake whitefish sampled in thecommercial and sport fisheries were determinedfrom scales. Mean length-at-age was used todetermine von Bertalanffy growth coefficientsusing FISHPARM (Prager et al. 1989). Weight-length regression coefficients were calculatedusing natural logs of the dependent andindependent variables. Total annual mortalityrates were approximated using minimum-variance unbiased estimators of survival derivedfrom coded age frequencies (Robson andChapman 1961). Total annual mortalities werepartitioned between fishing and natural mortalitybased on an instantaneous natural mortality of0.25 (Rakoczy 1983). Weight-length regression,von Bertalanffy, and total annual mortalitycalculations were made for fish at each fishingarea using pooled data sets. Data were pooled inan attempt to reduce the effects of variable year-class strength. When possible, data fromcommercial trap-nets were pooled over 3 years.A relative dearth of sport fishery biological datanecessitated pooling over the 1980s and the1990s at each area.
TACs were calculated using the StockAssessment Package One (SAP 1) computermodel developed by Clark and Smith (1985).Model inputs from pooled commercial data setswere von Bertalanffy parameters, weight-lengthregression coefficients, mortality estimates(natural, fishing, target), minimum legal lengthof fish, average weight of individual fish in trap-net catches, and average total weight of annual

4
commercial catches (trap net and gill netcombined).
For each year and each fishing area,calculations were made to determine meanlength and mean age of fish in commercial trapnet and sport catches. Means were examined fortrends over time within areas, and for differencesamong fishing areas and between fishingmethods (commercial trap net and sport).
Length-at-age, and weight-at-age werecalculated and compared each year for fish fromeach fishing area, using trap-net and creel surveybiological data. Creel survey biological datafrom Grand Traverse Bay, Lake Michigan wereincluded in comparisons to provide contrast toLake Superior creel data. The followingcomparisons were made for length-at-age data:area versus area by year by fishing method; yearversus year by area by fishing method; andcommercial trap net versus sport by area by year.Small sample sizes and considerable variabilityof weight data precluded comparisons for thisparameter.
For any given set of parameters,comparisons were made only if confidenceintervals could be calculated (N > 1). Parametervalues were considered significantly different if95% confidence intervals did not overlap.
Results
Commercial Catch Statistics
Ontonagon - Total annual commercial catchof lake whitefish near Ontonagon during 1994-96 ranged from 9,954 to 32,152 kg (average =18,455 kg; Table 1). Overall catch increased33% from 1994 to 1995, then increased 142%from 1995 to 1996. Gill net catches accountedfor 100% of the commercial catch in 1994 and1996, and 72% in 1995. Gill net effort and CPEwere nearly identical in 1994 and 1995, butjumped dramatically in 1996. From 1994 to1996, gill net effort averaged 127,490 m and gillnet CPE averaged 38 kg per 305 m of net.
Upper Entry - Between 1983 and 1996,annual commercial catch ranged from 18,674 to206,161 kg (average = 95,119 kg; Table 1).Catches were largest during 1983-86 and
fluctuated at lower levels thereafter. Lakewhitefish were harvested only in trap nets in1983, only in gill nets in 1990-91 and 1996, andin both gear types during 1984-89 and 1992-95.Trap-net effort averaged 398 lifts per year in the1980s and 212 lifts per year in the 1990s. Trapnet CPEs declined during 1983-89 and fluctuatedfrom 1992 through 1995. Overall trap-net CPEaveraged 155 kg per lift. Annual gill net catch,effort, and CPE fluctuated between 1984 and1996, and averaged 46,156 kg, 396,006 m, and36 kg per 305 m of net.
Keweenaw Bay - Annual catches varied bynearly four fold from 38,412 to 149,233 kg;Table 1. Catches were highest between 1985and 1992 (average = 134,358 kg) andconsiderably lower during 1983-84 and 1993-96(average = 57,648 kg). Catch, effort, and CPEfluctuated without trend for both trap-net andgill-net fisheries. Gill nets were not fished in1983 and 1984, and trap nets were not fishedduring 1988-92 and 1995. Average catch, effortand CPE were 27,118 kg, 200 lifts, and 129 kgper lift for the trap-net fishery, and 100,318 kg,1,224,372 m, and 28 kg per 305 m for the gill-net fishery.
Big Bay - Harvest was relatively low during1983-85 (average = 13,548 kg), peaked at130,183 kg in 1986, fluctuated during 1987-90,then declined through 1996; Table 1. Trap-netcatches generally increased in the 1980s,decreased in the 1990s and averaged 17,931 kgoverall. Trap-net CPEs were highest when effortwas lowest in 1983 and 1996. Average trap-neteffort was 122 lifts per year and average CPEwas 156 kg per lift. Gill-net catch, effort, and toa lesser extent CPE varied widely from year toyear. Gill-net catch ranged from 2,495 to115,214 kg per year (average = 28,648 kg), gillnet effort ranged from 15,555 m to 895,480 m(average = 266,700 m), and gill net CPE rangedfrom 16 to 70 kg per 305 m (average = 34 kg per305 m).
Marquette - Commercial fishing in theMarquette area produced between 15,972 and78,997 kg (average = 40,139 kg) of lakewhitefish per year between 1983 and 1996;Table 1. Trap-net fishers caught 88% of the
5
total over all years. Annual trap-net effort variedfrom 196 to 416 lifts (average = 308 lifts) andtrap-net CPE ranged from 59 to 264 kg per lift(average = 113 kg per lift). Gill-net catch wasfairly consistent at around 11,000 kg from 1986to 1990 even though effort and CPE varied morethan three fold over the same period. Gill-netcatch dropped to 2,252 kg in 1991, rose back to8,734 kg in 1992, then fell to less than 750 kgfrom 1993 to 1995. Gill-net effort and CPEfluctuated considerably in the 1990s.
Munising - Annual lake whitefish catchesgenerally increased from 49,306 to 160,414 kgbetween 1983 and 1990, then the trend reversedand catch fell to 25,375 kg by 1996; Table 1.Trap-net catches (range :13,740 - 117,613 kg;average = 56,819 kg) and trap-net effort (range:284 - 1,157 lifts; average = 728 lifts) mirroredthese trends fairly closely but gill net catches(range: 3,646 - 42,801 kg; average: 20,687 kg)and gill-net effort (range: 109,800 - 734,440 m;average: 495,375 m) less so. Trap-net CPEaveraged 99 kg per lift between 1983 and 1990and was half of that for 1991-96. Gill-net CPEaveraged 12 kg per 305 m of net over all years.
Grand Marais - Only about 1,000 kg of lakewhitefish per year were commercially harvestedduring 1983-84; Table 1. Average trap net effortwas 28 lifts per year and average CPE was 39 kgper lift for the two years.
All areas - Average commercial catch oflake whitefish between 1983 and 1996 was354,364 kg per year for Michigan waters of LakeSuperior between Ontonagon and Grand Marais;Table 1. Trap-net catches and CPEs generallyfollowed a decreasing trend from 1984 to 1996,but gill-net catches and CPEs varied withouttrend. Disregarding extreme high and lowvalues in 1984 and 1996, trap-net effort wasfairly consistent at an average of 1,618 lifts peryear. Gill-net effort varied more than trap-neteffort and averaged 2,078,118 m of net per year.Considering combined trap- and gill-net catches,Ontonagon fisheries contributed 5% of theoverall catch in 1994, 8% in 1995, and 17% in1996. Catches from Upper Entry composed over50% of the commercial total in 1983 and 1984,only 4% in 1990, and 27% overall between 1983
and 1996. Keweenaw Bay fisheries contributedbetween 13 and 37% (average 29%), and BigBay fisheries contributed 3-22% (average =10%). Lake whitefish catches from Marquetterepresented between 6 and 16% (average = 11%)of the total and Munising fisheries contributed13-35% (average = 20%).
Sport catch and CPE
Creel surveys conducted between 1985 and1996 have documented sport catches of lakewhitefish in Lake Michigan, Lake Superior,Lake Huron, and St. Marys River (Appendix 1).Lake whitefish were targeted by sport anglers atproductive sites such as Grand Traverse Bay(including East and West Arms of the bay andElk Rapids - open water and ice fisheries),Keweenaw Bay and Munising (Lake Superior -ice fisheries), Marquette (Lake Superior - openwater/pier fisheries), and St. Marys River (openwater fishery). Sport catches were relatively lowand were incidental at most of the other 32 creelsurvey sites where lake whitefish creel data wereavailable.
East Arm of Grand Traverse Bay - Open-water catch estimates ranged from 861 in 1993to 58,598 in 1985. Minimum and maximumCPE estimates coincided with the same twoyears: 0.0212 fish per angler hour in 1993 and0.3189 fish per angler hour in 1985. Averagecatch was 12,561 fish and average CPE was0.1334 fish per angler hour between 1985 and1996. Estimates of catch during two ice-fishingseasons were 19,974 in 1986 and 3,562 in 1989.CPE during the 1986 ice-fishing season (0.5554fish per angler hour) was higher than for anyother survey site at any time of year.
West Arm of Grand Traverse Bay - Open-water catches ranged between 127 and 31,268fish per season (average = 5,891) during 1985-96. CPEs were 0.0013 - 0.1304 fish per anglerhour (average = 0.0304). Ice fishing in 1986and 1989 resulted in catches of 1,819 and 2,509fish with corresponding CPEs of 0.0453 and0.1045 fish per angler hour.

6
Elk Rapids - Average open-water catchbetween 1986 and 1996 was 1,741 (range: 208 -4,897). Average CPE was 0.0421 fish per anglerhour (range: 0.0049 - 0.1213).
Keweenaw Bay - Incidental catches of lakewhitefish were noted during the 1991 and 1992open-water seasons. Ice fishing produced catchestimates of 10 to 4,902 fish (average = 1,014)for 1988-96. CPEs ranged from 0.0003 to0.0652 fish per angler hour (average = 0.0154).
Marquette - Between 1988 and 1996, open-water sport anglers caught 288-1,385 lakewhitefish (average = 764). CPEs were between0.0051 and 0.0284 fish per angler hour (average= 0.158). Ice fishing produced 2-278 fish duringthe 1990s and average CPE was 0.0101 fish perangler hour.
Munising - Creel surveys running 1987-88and 1991-96 documented open-water catches of90-951 fish ( average = 388) and CPEs of0.0059-0.0296 fish per angler hour (average =0.0145). Ice fishery estimates ranged from 410to 6,805 (average = 3,313). Ice-season CPEswere between 0.0175 and 0.2410 fish per anglerhour (average = 0.1322).
St. Marys River - Only two creel surveyswere conducted, one in 1987 and the other in1991. Estimations from the two years were verydifferent. Catch in 1987 was 21,174 fish with aCPE of 0.1473 fish per angler hour and catch in1991 was 204 fish with a CPE of 0.0003 fish perangler hour.
All areas - Based on combined estimates forall Great Lakes creel survey sites between 1985and 1996, the total number of lake whitefishcaught in sport fisheries was 359,293 (average =29,941 fish per year). By far the mostproductive sites (East and West Arms of GrandTraverse Bay and Elk Rapids) were in GrandTraverse Bay, Lake Michigan, which accountedfor 75% of the grand total. Of the Lake Superiorsites, catches at Munising, Keweenaw Bay, andMarquette represented 8%, 3%, and 2% of thegrand total. Along with catches from the St.Marys River (6% of the grand total), the sitesmentioned above accounted for 94% of the
estimated total of all sport-caught lake whitefishduring 1985-96. Using average weights ofwhitefish in creel surveys at Lake Superior sites,catch numbers translated to about 1,078 kg peryear at Keweenaw Bay, 838 kg per year atMunising, and 269 kg per year at Marquette. Interms of weight, sport catches represented about1% of the annual lake whitefish harvests atKeweenaw Bay, Marquette, and Munising.
Vital Population Statistics
Commercial trap net fishery - Between 1and 12 estimates of total annual mortality,instantaneous fishing mortality, weight-lengthregression coefficients, and von Bertalanffygrowth coefficients were made for lake whitefishin each of seven fishing areas depending on theavailability of appropriate commercial data sets(Tables 2 and 3). Total annual mortalityestimates ranged from a low of 30% for fishfrom Marquette (1994-96) to a high of 78% forfish from Upper Entry (1993-95). Comparingpooled data sets from similar years, mortalityrates generally were higher in western areas thanin eastern areas. Mortality rates fluctuated overtime in all areas for which multiple estimateswere made. The range of ages included inmortality estimates was 6 to 18.
Weight-length regression coefficients andvon Bertalanffy growth coefficients variedwithout trend for whitefish in different fishingareas. Weight-length regression coefficientswere similar among areas.
Sport fishery - Total annual mortalitycalculated from sport fish age frequencies waslower for the 1980s data set than for the 1990sdata set at Keweenaw Bay and Grand TraverseBay (Lake Michigan) (Tables 4 and 5). Theopposite was true at Marquette and Munising.Ages of fish included in mortality estimatesranged from 4 to 15.
Instantaneous fishing mortality rates rangedfrom 0.13 at Keweenaw Bay in the 1980s to 1.07at Marquette in 1988. Weight-length regressioncoefficients were fairly similar in both decadesat all four sites. Growth coefficients from vonBertalanffy equations were variable betweendecades and among sites.

7
TACs - Lake whitefish TACs werecalculated for 3 years (1985-87) at KeweenawBay and 6 years (1985-89 and 1991) at Big Bay,Marquette, and Munising (Table 6).Correspondence between TAC and reportedcatch was closest (97%) at Keweenaw Bay in1985. Reported catch exceeded TACs by 223%at Big Bay in 1989 and by 122% at Marquette in1991. Reported catches were only 21-84% ofTACs for other years in all areas.
Mean length and age in catches
Commercial trap-net fishery - Mean lengthof lake whitefish in catches varied among yearsin all fishing areas, but no trend was evident inany particular area (Table 7). Overall meanlengths (all years combined) were similar forKeweenaw Bay, Big Bay, Marquette, Munising,and Grand Marais, but were slightly smaller forOntonagon and Upper Entry. Mean age data forwhitefish also varied without trend. KeweenawBay fish had the oldest overall mean agefollowed by Big Bay, Munising, Marquette,Ontonagon, Upper Entry, and finally GrandMarais.
Sport fishery - Mean lengths and mean agesof lake whitefish in sport catches fluctuatedwithout trend in each fishing area (Table 7).Among Lake Superior creel survey sites, fishfrom Ontonagon and Keweenaw Bay were largerthan those from Marquette, Munising, and GrandMarais overall. Sport-caught whitefish fromGrand Traverse Bay (Lake Michigan) werelarger and older than those from Lake Superior.Overall mean age for fish in Lake Superior areasranged from 2.9 at Grand Marais to 5.8 atMunising. Overall mean age was 6.1 at GrandTraverse Bay.
Commercial trap-net fishery versus sportfishery - Direct comparisons of mean length andage by year between commercial trap net andsport fisheries were possible for two years atKeweenaw Bay, nine years at Marquette, and tenyears at Munising (Table 7). Whereversignificant differences occurred, commercial fishwere larger and older than sport fish.
Change in minimum size regulation at BigBay - Mean length was 586.9 ± 3.0 mm andmean age was 8.7 ± 0.1 years for lake whitefishunder the 483-mm minimum size regulationbetween 1983 and 1987 (Table 7). Mean lengthand mean age both dropped to 522.7 ± 2.0 mmand 6.8 ± 0.1 years, respectively, during 1988-96when the minimum size regulation was changedto 432 mm.
Length-at-age
Area versus area - commercial trap-netfishery - Lake whitefish at Marquette weresignificantly longer than fish in other LakeSuperior fishing areas over most years and abroad range of ages (Table 8; Appendix 2).Munising fish were also generally longer thanfish in most other areas except Marquette.Conversely, fish at Ontonagon, Upper Entry, andKeweenaw were generally shorter than fish tothe east of these areas. Fish at Big Bay wereintermediate in length-at-age.
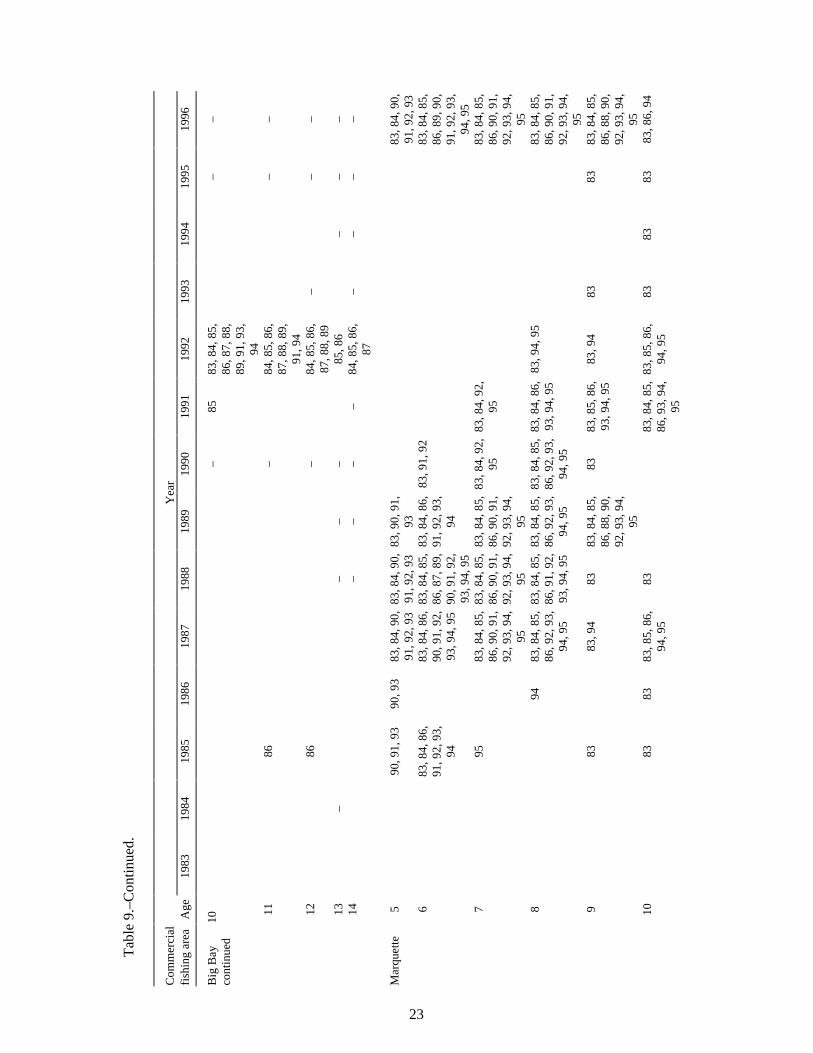
Year versus year - commercial trap-netfishery - Mean length of 6-yr-old fish decreasedbetween 1992 and 1995 at Upper Entry but onlya few comparisons were possible due to limiteddata (Table 9; Appendix 2). At Keweenaw Bay,fish in 1983 (especially), 1984, and 1986 weresignificantly longer than fish in other years overmost ages. Fish in the 1980s were generallylonger than those in the 1990s at comparableages. In general, Big Bay comparisons showedthat 1983 and 1993 were years in which fishwere significantly longer and 1988 and 1992were years in which fish were significantlyshorter. Over the ages compared, Marquette fishcaught from 1983 to 1986 were generallylongest, fish from 1987 to 1992 were shortest,and fish from 1993 to 1996 were intermediate.At Munising, length-at-age was relatively largein 1983 and 1984, diminished during 1985-93,increased during 1994-95, and dropped again in1996.
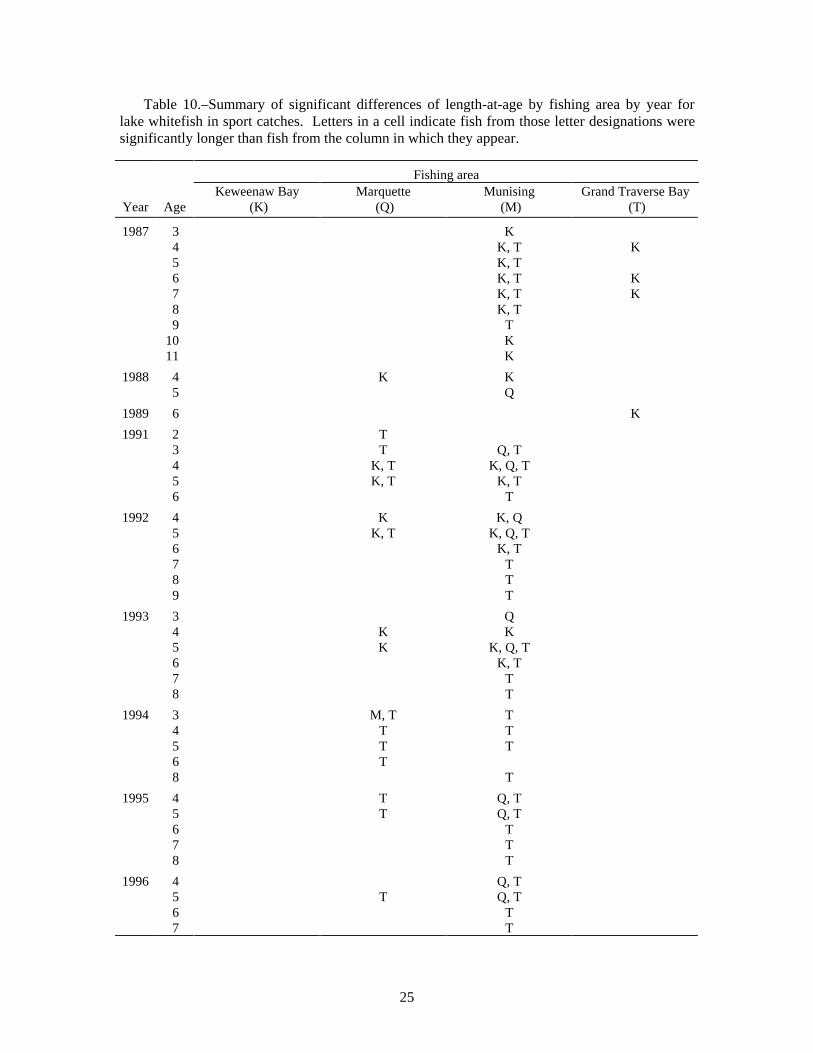
Area versus area - sport fishery - Lakewhitefish caught at Keweenaw Bay weresignificantly longer than those at Marquette for afew ages over four different years, and were

8
more broadly longer than fish caught atMunising (Table 10; Appendix 3). KeweenawBay fish were even longer than Lake Michiganfish (Grand Traverse Bay) over fourcomparisons. Grand Traverse Bay fish weregenerally longer than fish at Marquette andMunising.
Year versus year - sport fishery - Age 4 fishcaught in Keweenaw Bay were sign ificantlylonger during 1987 and 1988 compared to 1992(Table 11). At both Marquette and Munising,fish caught during 1988 were significantlylonger than fish caught during most other yearsover limited age ranges. In general, fish caughtat Grand Traverse Bay, were longest in 1991 and1994 and shortest in 1989 and 1990.
Sport fishery versus commercial trap-netfishery - Comparisons indicated that in instanceswhere significant differences were observed,sport-caught fish were longer than commercialfish at Keweenaw Bay but commercial fish werelonger than sport fish at Marquette and Munising(Table 12; Appendices 2 and 3). The lack ofsignificant differences for most ages during mostyears was noteworthy at Keweenaw Bay andMarquette.
Discussion
Commercial catches of lake whitefishincreased from 1983 to 1986, fluctuated between1987 and 1992, then generally decreased through1996. Trap net and gill net fisheries eachproduced 50% of the 1983-96 total commercialcatch. There was no obvious correlationbetween trap net and gill net catch or CPEstatistics for any given fishing area in any givenyear.
Noteworthy sport catches of lake whitefishoccurred at only a handful of Great Lakes creelsurvey locations. At any given site, year-to-yearfluctuations in catches could have beenattributable to varying stock densities,differences in weather (ice cover and open-waterconditions), and changes in the number and skilllevel of anglers who exploited whitefishfisheries. Sport catches at Grand Traverse Bayand Munising declined from the 1980s to the
1990s, but interpreting trends was confoundedby the lack of data relating to targeted effort.
In general, total annual mortality ratescalculated from pooled Lake Superior trap-netdata sets decreased from west to east. Highesttotal annual mortality estimates at each fishingsite corresponded with years for which the initialage of fish included in calculations wasrelatively high. At Big Bay for example,mortality estimates were above 60% when theinitial age included in calculations was 12, butmortality was 37-58% when initial age incalculations was 9 or less (Table 2). With theRobson-Chapman method of calculatingsurvival/mortality, younger ages areprogressively kicked out of calculations whennumbers-at-age are not deemed to berepresentative (the χ2 test comparing twoindependent estimates of survival is used todetermine appropriateness of age inclusion).Usually, numbers-at-age would not berepresentative if fish of a given age were toosmall to be fully recruited to the fishing gear.But Lake Superior lake whitefish are fullyrecruited to trap nets at age 5 (Rakoczy 1983) sothe expectation would be that ages 5 and abovewould be included in Robson-Chapmanestimates. Weak year-class strength is anotherreason numbers-at-age might not berepresentative, but our practice of pooling dataover 3 years should have tempered this problemunless weak year classes persisted throughseveral successive years. After consideration,we concluded that total annual mortalities wereoverestimated when rates were calculated fromages beginning at 12 and above. Eliminatingsuch rates from consideration, total annualmortality rates were generally well below thetarget maximum rate of 55% for stocks in allfishing areas except Upper Entry and KeweenawBay. The combined pressures of gill- and trap-net fisheries in Upper Entry and Keweenaw Baymay be threatening the stability of these stocks.Compared to mortality rates calculated fromcommercial trap-net fishery data, rates fromsport-fishery data were lower at Keweenaw Bayand Munising, but higher at Marquette. Truemortality rates may lie in between thecommercial- and sport-based estimates.
At Keweenaw Bay, Marquette, or Munising,weight-length regression coefficients and von

9
Bertalanffy growth coefficients were similar forcommercial trap net and sport data sets. Themost obvious dissimilarity was in estimates ofasymptotic length (L∞) at Munising. Theestimate from sport-fishery data wasconsiderably smaller than the commercial-fishery estimate. This could have been due todifferential size selectivities for the sport andcommercial gear, or may have indicated the twofisheries were exploiting separate stocks atMunising. Past evidence for separate stocks wasprovided by Edsall (1960) who documented thatduring the 1950s, lake whitefish in MunisingBay grew slower and matured at smaller sizescompared to commercially caught whitefishoutside the bay.
TACs appeared to be very poor predictors ofactual harvest. Population fluctuations, variableyear-class strength, seasonal fish movements,and weather conditions were some of the factorsthat could have affected harvest and that werenot adequately measured or modeled. Rybickiand Schneeberger (1990) concluded thatcontradictions between calculated catch quotasand reported yields may result from using 3-yraverages for model parameters. But in ourstudy, probably the biggest reason that predictedcatch did not approximate actual catch wasbecause fishing effort was so variable andunpredictable. During any given year in anygiven fishing area, harvests were all from trapnets, all from gill nets, or from somecombination of both gear types. There was alsoconsiderable annual variability in trap-net and/orgill-net effort even during years when use ofeither or both types of fishing gear wasconsistent. We conclude that there is little valuein continuing to calculate TACs for differentfishing areas unless quotas are to be enforced oruntil fishing effort becomes more stabilized.
An examination of mean length and meanage data revealed no trends among fishing areasover time whether for commercial-trap net orsport-caught whitefish. For year-to-yearcomparisons between commercial trap net andsport fisheries, mean length and mean age wereconsistently greater for commercial whitefish,perhaps reflecting spatial and seasonaldifferences both for fish distribution and fishingeffort (commercial versus sport).
The differences in mean length and meanage at Big Bay (1983-87 versus 1988-96)illustrated the effects of manipulating minimumsize limits. Mean age of maturity was found tobe 5 yr for lake whitefish populations in easternLake Superior (W. MacCallum, OntarioMinistry of Natural Resources, 1980,unpublished), but Rakoczy (1983) reported themean age of first maturity was 5.2 yr forwhitefish stocks in Michigan waters of LakeSuperior. Based on studies by Abrosov (1969)and Christie and Regier (1972), Rakoczy (1983)concluded that mean age of harvested LakeSuperior whitefish should range from 6.7 to 7.2yr to allow fish to spawn an average of 1.5 timesduring their lives and to allow the population tomaintain itself. Applying this criterion, averageage of lake whitefish harvested at Big Bay wasunnecessarily high under the 483-mm minimumsize limit (average age = 8.7) and was on targetunder the 432-mm minimum size limit (averageage = 6.8).
Differences in mean sizes of fish caught bycommercial versus sport gears were difficult tointerpret and may not be biologicallymeaningful. Problems include gear biases,harvests occurring at different times of the year(mean lengths were not back-calculated), smallsample sizes of sport caught fish, and thepossibility that the two fisheries were exploitingseparate stocks. Depth contours and differencesin seasonal accessibility tended to separatecommercial and sport fishing activities at bothKeweenaw Bay and Munising. Peck (1994)concluded that differences in age compositionand back-calculated length-at-age wereindications of separate whitefish stocks in northand south areas of Upper Entry.
Lake whitefish lengths-at-age were generallyshorter for comparable areas during 1983-96than what was reported by Dryer (1962) andRakoczy (1983). This may have been due todensity-dependent growth factors because lakewhitefish were more numerous during 1983-96than in the 1960s through the early 1980s. Also,an increase in lake herring biomass since theearly 1980s (Great Lakes Fishery CommissionLake Superior Committee Annual Report 1993,unpublished) may have resulted in greater inter-specific competition between herring andwhitefish.

10
Year-to-year comparisons indicated that1983 and, to a lesser extent, 1984 were years ofgreatest length-at-age over most commercialfishing areas. It is not known what combinationsof weather, food availability, and stockabundance existed to make those two yearsbetter than most other years during this study.For sport fishery year-to-year comparisons, lakewhitefish caught in 1988 were generally largestat Marquette and Munising, and fish caught in1991 were largest at Grand Traverse Bay.
Where they occurred together, there did notappear to be much conflict between sport andcommercial trap net fisheries for lake whitefish.Compared to commercial-caught whitefish,sport-caught fish were generally smaller andyounger and were caught mostly in winter atLake Superior sites. This indicates that, for themost part, sport anglers harvested whitefishbefore they were vulnerable to commercial gear,and sport harvests occurred when little or nocommercial trap-net fishing was taking place.Sport catches were too small to affectcommercial harvests. There were reasons toquestion whether sport and commercial fisherieswere exploiting the same stocks, especially atKeweenaw Bay and Munising, but even if theywere, temporal, spatial, and biological factorstended to segregate the two fisheries.
Recommendations
We should continue to work with tribalfisheries management authorities to ensure thatcombined trap net and gill net harvest does notthreaten stock stability in any fishing area.
We should continue annual monitoring ofthe whitefish stocks to detect trends and changesin total annual mortality and other vitalpopulation statistics. The current samplingregime has been adequate for obtainingwhitefish population parameters, but it would beadvantageous to have monitors from every stateand tribal management entity using comparablesampling methodologies throughout the GreatLakes.
In fishing area where total annual mortalityexceeds 55%, additional sampling should beimplemented during September to monitor pre-spawning fish and to update maturity schedules.
Acknowledgments
Thanks go to commercial fishermen “Sully”Kauppi, Thill Fisheries, VanLandschootFisheries, and Jim Wiita who participated inthese assessments. We appreciate the efforts ofDawn Dupras, Paul Hannuksela, RichardJamsen, Greg Kleaver, Karen Koval andnumerous temporary personnel in collectingassessment data and preparing them for analyses.Edward Baker, James Peck, and Shawn Sitaredited the manuscript and provided many helpfulsuggestions. Alan Sutton prepared the figure.

Gra
nd M
arai
s
Mun
isin
g
Mar
quet
te
Ont
onag
onB
ig B
ay
Kewee
naw B
ayU
pper
Ent
ry
N
Tre
aty
line
Sta
te li
ne
Fig
ure
1.–L
ocat
ion
of s
tate
-lice
nsed
com
mer
cial
fish
erie
s fo
r la
ke w
hite
fish
in M
ichi
gan
wat
ers
of L
ake
Sup
erio
r.
11

12
Table 1.–Lake whitefish catch (dressed kg), effort (trap-net lifts, 305 m of gill net), and catch perunit effort (CPE - kg per trap-net lift, kg per 305 m of gill net) in Lake Superior commercial fisheries,1983-96.
Trap neta Gill netb TotalFishing area Year Catch Effort CPE Catch Effort CPE catch
Ontonagon 1994 9, 9 294 34 9, 91995 3, 7 72 52 9, 5 302 32 13, 21996 32, 1 658 49 32, 1
Upper Entry 1983 170, 8 546 313 170, 81984 172, 1 716 240 34, 0 500 68 206, 11985 67, 9 440 154 112, 9 2, 3 49 180, 81986 47, 4 367 129 114, 8 2, 8 40 162, 21987 34, 6 234 148 27, 0 1, 1 24 61, 71988 24, 5 210 117 50, 8 1, 4 34 75, 41989 19, 7 275 72 35, 4 744 48 55, 21990 18, 6 792 24 18, 61991 24, 0 946 25 24, 01992 62, 5 322 194 53, 1 1, 5 34 115, 61993 39, 1 378 104 50, 9 1, 3 37 90, 11994 51, 9 434 120 20, 3 1, 3 15 72, 21995 40, 6 352 115 25, 9 1, 0 24 66, 51996 31, 8 797 40 31, 8
Keweenaw Bay 1983 43, 5 232 188 43, 51984 51, 4 342 151 51, 41985 39, 3 238 165 103, 5 1, 6 64 142, 81986 17, 6 200 88 131, 5 3, 2 40 149, 21987 9, 7 114 86 118, 0 2, 6 45 127, 81988 111, 9 2, 8 39 111, 91989 137, 0 5, 3 26 137, 01990 140, 8 6, 8 21 140, 81991 124, 6 6, 6 19 124, 61992 140, 3 5, 3 26 140, 31993 19, 2 154 125 68, 2 5, 5 12 87, 41994 17, 7 190 94 39, 9 3, 5 11 57, 71995 38, 4 1, 9 19 38, 41996 18, 0 133 136 49, 0 2, 5 19 67, 1
Big Bay 1983 10, 1 42 241 10, 11984 12, 8 103 125 12, 81985 15, 1 104 146 2, 4 51 49 17, 61986 14, 9 118 127 115, 2 1, 6 70 130, 11987 25, 3 163 156 36, 6 901 41 61, 91988 18, 7 149 126 16, 8 350 48 35, 51989 35, 5 194 183 39, 1 1, 5 25 74, 71990 25, 2 188 134 57, 1 2, 9 19 82, 31991 26, 2 170 154 11, 0 684 16 37, 21992 19, 8 151 131 12, 7 362 35 32, 61993 14, 9 129 116 15, 6 759 21 30, 51994 11, 7 95 123 4, 5 294 16 16, 21995 8, 5 50 172 3, 6 101 36 12, 21996 11, 7 46 256 11, 7

13
Table 1.–Continued.
Trap neta Gill netb TotalFishing area Year Catch Effort CPE Catch Effort CPE catch
Marquette 1983 44, 1 399 111 44, 11984 57, 8 344 168 57, 81985 78, 9 299 264 78, 91986 57, 8 311 186 10, 9 210 52 68, 81987 20, 0 244 82 9, 3 408 23 29, 31988 35, 6 331 108 11, 1 292 38 46, 81989 24, 3 279 87 11, 0 132 84 35, 41990 41, 1 416 99 12, 0 246 49 53, 21991 42, 5 379 112 2, 2 60 38 44, 81992 21, 8 356 61 8, 7 142 62 30, 51993 16, 1 272 59 738 61 12 16, 81994 18, 2 260 70 524 36 15 18, 71995 15, 4 222 69 565 12 47 15, 91996 20, 3 196 104 20, 3
Munising 1983 49, 3 513 96 49, 31984 62, 5 611 102 62, 51985 70, 0 680 103 70, 01986 63, 4 674 94 31, 3 2, 3 13 94, 71987 66, 1 777 85 27, 3 2, 1 13 93, 41988 70, 0 751 93 28, 6 2, 3 12 98, 71989 70, 5 713 100 21, 0 2, 4 9 91, 61990 117, 6 976 121 42, 8 2, 3 19 160, 41991 75, 5 1, 1 65 27, 4 2, 1 13 103, 01992 44, 3 904 49 17, 2 1, 5 11 61, 51993 38, 2 935 41 4, 1 464 9 42, 31994 29, 8 695 43 12, 2 1, 1 10 42, 11995 23, 9 520 46 3, 6 360 10 27, 61996 13, 7 284 48 11, 6 675 17 25, 3
Grand Marais 1983 967 23 42 9671984 1, 2 33 36 1, 2
All 1983 318, 9 1, 7 182 318, 91984 358, 0 2, 1 167 34, 0 500 68 392, 01985 271, 5 1, 7 154 218, 9 3, 9 55 490, 41986 201, 3 1, 6 121 403, 8 10, 3 39 605, 21987 155, 9 1, 5 102 218, 4 7, 1 30 374, 31988 148, 9 1, 4 103 219, 5 7, 3 30 368, 51989 150, 2 1, 4 103 243, 7 10, 1 24 394, 01990 184, 0 1, 5 116 271, 5 13, 1 21 455, 51991 144, 3 1, 7 85 189, 4 10, 4 18 333, 71992 148, 4 1, 7 86 232, 2 8, 9 26 380, 61993 127, 7 1, 8 68 139, 7 8, 1 17 267, 41994 129, 5 1, 6 77 87, 5 6, 7 13 217, 11995 92, 2 1, 2 76 81, 7 3, 8 21 174, 01996 63, 9 659 97 124, 6 4, 7 26 188, 6
a Large-mesh trap nets used by state-licensed fishers.b Large-mesh gill nets used by tribal fishers. Gill-net catch statistics are from Great Lakes Indian Fish and Wildlife
Commission for Upper Entry, Keweenaw Bay, Big Bay, and Marquette. Statistics from Chippewa-Ottawa Treaty FisheryManagement Authority for Munising.

14
Table 2.–Total annual mortality rates of lake whitefish in commercial trap-net catches, with 2SE and ages included in calculations. When possible, data from each Lake Superior fishing areawere pooled over 3-year intervals.
Fishing area Years pooled Mortality 2 SE Ages
Ontonagon 1995 0.47 0.04 6-14
Upper Entry 1992-93 0.59 0.04 7-121992-94 0.63 0.03 7-121993-95 0.78 0.03 7-111994-95 0.77 0.04 7-11
Keweenaw Bay 1983-85 0.32 0.02 7-161984-86 0.67 0.07 12-161985-87 0.73 0.09 12-151986-87 0.43 0.03 8-141993-94 0.71 0.04 7-12
1994 & 1996 0.62 0.03 6-14
Big Bay 1983-85 0.64 0.06 12-171984-86 0.64 0.05 12-171985-87 0.64 0.05 12-171986-88 0.65 0.08 12-151987-89 0.44 0.04 8-151988-90 0.45 0.08 9-151989-91 0.47 0.05 8-161990-92 0.38 0.03 7-161991-93 0.38 0.02 7-161992-94 0.37 0.02 6-161993-94 0.53 0.03 6-16
1994 & 1996 0.58 0.05 7-12
Marquette 1983-85 0.39 0.02 6-151984-86 0.36 0.02 7-151985-87 0.36 0.02 6-161986-88 0.40 0.02 6-161987-89 0.43 0.02 6-161988-90 0.51 0.02 6-151989-91 0.46 0.07 9-151990-92 0.45 0.02 7-161991-93 0.42 0.03 8-171992-94 0.41 0.03 9-171993-95 0.49 0.06 13-171994-96 0.30 0.02 8-17
Munising 1983-85 0.39 0.02 7-181984-86 0.39 0.02 8-181985-87 0.44 0.03 8-171986-88 0.39 0.02 7-171987-89 0.42 0.03 7-161988-90 0.42 0.03 7-171989-91 0.45 0.04 8-161990-92 0.38 0.02 7-171991-93 0.54 0.07 12-171992-94 0.55 0.06 12-171993-95 0.51 0.05 12-171994-96 0.40 0.03 10-17
Grand Marais 1983-84 0.51 0.06 6-13

15
Table 3.–Vital statistics from commercial trap-net data sets (pooled over 3 years when possible)used to generate lake whitefish total allowable catches.
Instantaneous Weight-length Mean dressedYears fishing coefficientsb Von Bertalanffy coefficients weight of fish Catch
Fishing area pooled mortalitya (F) Intercept Slope K L∞ (mm) to in catch (kg) (dressed kg)c
Ontonagon 1995 0.38 -13.00 3.22 0.115 894 -0.108 1.5 13, 26
Upper Entry 1992-93 0.65 -12.67 3.17 0.314 552 -0.004 1.0 102, 911992-94 0.75 -12.05 3.07 0.314 551 -0.005 1.0 92, 691993-95 1.26 -12.02 3.07 0.362 531 -0.002 0.9 76, 321994-95 1.21 -10.74 2.86 0.496 507 -0.001 0.9 56, 87
Keweenaw 1983-85 0.13 - - 0.156 783 -0.004 - 79, 30Bay 1984-86 0.91 -10.52 2.82 0.145 808 -0.005 1.9 114, 53
1985-87 1.05 -10.52 2.82 0.155 782 -0.024 1.9 139, 981986-87 0.32 -10.52 2.82 0.141 824 -0.029 1.9 138, 521993-94 1.00 -13.26 3.27 0.020 800 -0.500 1.0 72, 64
1994 & 96 0.73 -12.69 3.18 0.1286 809 -0.164 1.1 62, 47
Big Bay 1983-85 0.79 - - 0.201 734 -0.035 - 13, 541984-86 0.76 -12.27 3.10 0.178 766 -0.043 1.8 53, 571985-87 0.77 -12.27 3.10 0.186 756 -0.045 1.8 69, 941986-88 0.79 -13.24 3.25 0.183 761 -0.038 1.6 75, 901987-89 0.33 -13.16 3.24 0.203 718 -0.061 1.2 57, 421988-90 0.34 -12.49 3.14 0.210 706 -0.064 1.1 64, 221989-91 0.38 -13.04 3.23 0.225 692 -0.051 1.2 64, 801990-92 0.23 -11.29 2.94 0.277 629 -0.047 1.2 50, 751991-93 0.23 -12.92 3.20 0.358 596 -0.007 1.4 33, 471992-94 0.22 -12.25 3.09 0.365 590 -0.006 1.4 26, 471993-94 0.50 -12.70 3.17 0.272 662 -0.018 1.5 23, 41
1994 & 96 0.61 -12.52 3.14 0.225 680 -0.008 1.4 14, 01
Marquette 1983-85 0.24 -13.54 3.30 0.176 804 -0.001 1.6 60, 331984-86 0.19 -13.34 3.27 0.169 814 -0.010 1.7 68, 551985-87 0.20 -13.49 3.30 0.167 803 -0.014 1.8 59, 051986-88 0.26 -12.10 3.08 0.176 783 -0.078 1.9 48, 341987-89 0.31 -14.22 3.41 0.182 761 -0.084 1.2 37, 211988-90 0.46 -12.80 3.18 0.187 763 -0.073 1.3 45, 161989-91 0.36 -13.48 3.29 0.182 777 -0.080 1.4 44, 481990-92 0.35 -13.90 3.36 0.199 754 -0.072 1.8 42, 851991-93 0.30 -14.67 3.48 0.176 790 -0.040 1.9 30, 731992-94 0.28 -14.44 3.45 0.178 792 -0.026 1.9 22, 041993-95 0.43 -13.59 3.31 0.183 786 -0.020 2.1 17, 191994-96 0.11 -13.51 3.30 0.168 801 -0.022 2.0 18, 35
Munising 1983-85 0.24 - - 0.186 774 -0.072 - 60, 631984-86 0.25 -12.00 3.06 0.169 795 -0.095 1.4 75, 781985-87 0.33 -12.00 3.06 0.159 806 -0.039 1.4 86, 111986-88 0.24 -12.00 3.06 0.172 783 -0.100 1.4 95, 661987-89 0.29 -12.64 3.16 0.177 768 -0.120 1.2 94, 611988-90 0.29 -11.91 3.43 0.175 767 -0.136 1.3 116, 921989-91 0.35 -12.23 3.09 0.231 692 -0.048 1.4 118, 351990-92 0.22 -11.39 2.96 0.231 690 -0.060 1.6 108, 321991-93 0.52 -11.94 3.05 0.202 731 -0.111 1.8 68, 981992-94 0.56 -13.03 3.23 0.212 727 -0.080 2.0 48, 691993-95 0.46 -12.23 3.11 0.219 733 -0.016 2.5 37, 381994-96 0.27 -14.50 3.46 0.201 740 -0.035 2.2 31, 71
Grand Marais 1983-84 0.47 - - 0.201 766 -0.026 - 1, 09
a Instantaneous rate of natural mortality (M) was assumed to be 0.25 (Rakoczy 1983) in all fishing areas.b loge(Weight)=a + b(loge[Length])c Computed from catch data in Table 1.

16
Table 4.–Total annual mortality rates of lake whitefish in sport catches, with 2 SE andages included in calculations. Data from each Lake Superior and Lake Michigan creelsurvey area were pooled over the 1980s and the 1990s.
Fishing area Years pooled Mortality 2 SE Ages included
Keweenaw Bay 1984, 1987-89 0.32 0.05 4-131990-93, 1996 0.56 0.11 5-12
Marquette 1988 0.73 0.13 4-61990-96 0.58 0.05 4-10
Munising 1985, 1987-88 0.36 0.05 5-141991-96 0.32 0.03 5-15
Grand Traverse 1986-89 0.58 0.07 7-111990-96 0.74 0.08 8-13
Table 5.–Vital statistics from creel survey data.
Instantaneous Mean weightYears fishing Weight-length coefficientsb Von Bertalanffy coefficients of fish in
Fishing area pooled mortalitya (F) Intercept Slope K L∞ (mm) to catch (kg)
Keweenaw 1984, 1987-89 0.13 -11.06 2.90 0.170 820 -0.238 1.2Bay 1990-93, 1996 0.58 -12.44 3.14 0.184 795 -0.001 1.2
Marquette 1988 1.07 -12.05 3.04 0.324 545 -0.006 0.51990-96 0.64 -12.90 3.19 0.112 944 -0.186 0.4
Munising 1985, 1987-88 0.19 -12.98 3.20 0.307 438 -0.064 0.31991-96 0.15 -12.33 3.10 0.166 548 -0.305 0.4
Grand 1986-89 0.42 -12.83 3.20 0.172 742 -0.029 1.0Traverse Bay 1990-96 0.91 -14.80 3.49 0.700 530 -0.064 1.1
a Instantaneous rate of natural mortality (M) was assumed to be 0.25 in Lake Superior (Rakoczy (1983) and 0.45 in Lake Michigan;(Rybicki 1980).
b loge(Weight)=a + b(loge[Length])

17
Table 6.–Total allowable catch estimate (TAC) and reported catch of lake whitefish, by LakeSuperior fishing area. TAC and catch in kilograms dressed weight.
Fishing area Year TAC Reported catch Proportion of TAC
Keweenaw Bay 1985 147, 419 142, 883 0.971986 303, 910 149, 233 0.491987 209, 108 127, 823 0.61
Big Bay 1985 73, 029 17, 691 0.241986 73, 029 130, 183 1.781987 265, 808 61, 961 0.231988 171, 913 35, 562 0.211989 33, 566 74, 753 2.231991 44, 163 37, 275 0.84
Marquette 1985 105, 688 78, 997 0.751986 138, 347 68, 804 0.501987 125, 646 29, 373 0.231988 79, 379 46, 844 0.591989 53, 524 35, 421 0.661991 36, 592 44, 810 1.22
Munising 1985 139, 254 70, 065 0.501986 151, 501 94, 773 0.621987 131, 997 93, 499 0.711988 141, 522 98, 736 0.701989 174, 635 91, 618 0.521991 147, 868 103, 023 0.70

18
Table 7.–Mean length and age (with ± factor for 95% confidence intervals) of Lake Superior lakewhitefish in commercial trap net and sport catches. Underlined lengths and ages were significantlylarger than corresponding lengths and ages for the other fishing method.
Commercial catch Sport catchFishing area Year Mean length ± Factor Mean age ± Factor Mean length ± Factor Mean age ± Factor
Ontonagon 1986 463.4 45.3 4.6 1.31987 356.0 – 3.0 –1990 437.0 – 4.0 –1992 480.0 99.4 4.8 1.31995 496.4 6.5 7.0 0.2All 496.4 6.5 7.0 0.2 460.0 35.5 4.5 0.9
Upper Entry 1992 476.8 3.4 6.9 0.11993 473.6 2.5 6.4 0.11994 465.2 2.3 6.5 0.11995 470.8 3.5 6.7 0.11993 478.8 3.4 6.9 0.11994 473.6 3.0 6.2 0.11996 487.5 5.0 6.6 0.2All 471.6 1.5 6.6 0.1
Keweenaw Bay 1983 580.7 8.1 8.0 0.21984 610.4 8.1 10.1 0.3 506.1 107.8 6.4 2.41985 545.3 7.8 8.4 0.21986 595.2 6.2 9.2 0.21987 511.3 5.5 7.5 0.1 503.7 26.2 5.8 0.61988 437.4 40.2 3.8 0.51989 446.6 21.1 4.6 0.41990 584.0 – 7.0 –1991 506.7 38.9 5.2 0.91992 451.2 27.4 5.0 0.51993 486.1 29.5 5.1 0.5All 566.9 3.7 8.6 0.1 483.0 14.6 5.3 0.3
Big Bay 1983 546.4 8.0 6.3 0.21984 585.9 7.3 8.8 0.21985 610.0 5.0 9.8 0.21986 597.2 5.7 8.9 0.21987 546.0 6.2 7.5 0.21988 510.8 5.3 6.8 0.11989 511.2 5.1 6.5 0.21990 509.1 4.8 6.2 0.11991 535.8 5.9 7.0 0.21992 542.0 4.9 9.0 0.21993 542.6 6.5 6.3 0.21994 519.6 5.4 6.5 0.11996 515.9 5.7 6.6 0.2All 550.8 2.0 7.7 0.1

19
Table 7.–Continued.
Commercial catch Sport catchFishing area Year Mean length ± Factor Mean age ± Factor Mean length ± Factor Mean age ± Factor
Marquette 1983 568.8 10.9 6.9 0.21984 560.6 8.7 7.2 0.31985 557.0 7.1 7.3 0.21986 575.0 8.0 7.6 0.21987 538.6 7.0 7.4 0.21988 514.6 5.6 6.7 0.2 391.2 14.7 4.1 0.31989 512.6 5.4 6.3 0.21990 532.4 4.9 6.6 0.1 391.7 33.0 4.5 0.61991 556.7 5.1 7.2 0.2 326.4 15.0 3.6 0.31992 589.0 6.0 8.1 0.2 345.3 12.6 4.1 0.21993 587.7 7.2 8.0 0.2 327.4 23.3 3.7 0.51994 585.0 7.9 7.8 0.2 360.9 33.7 4.6 0.61995 639.6 5.8 9.9 0.2 361.8 18.1 4.4 0.31996 524.4 6.6 7.2 0.2 383.1 42.6 5.0 1.1All 561.4 2.1 7.5 0.1 355.0 7.7 4.1 0.1
Munising 1983 534.2 7.6 6.0 0.21984 591.1 9.2 8.1 0.31985 534.3 5.4 7.2 0.2 313.1 9.8 4.9 0.31986 554.7 7.1 7.7 0.21987 557.8 6.0 7.4 0.2 349.6 13.5 6.1 0.51988 538.2 7.2 7.7 0.2 390.8 17.3 4.6 0.41989 492.9 4.5 5.9 0.11990 528.7 4.8 6.6 0.11991 556.5 5.2 7.7 0.2 349.7 14.5 6.0 0.41992 559.9 7.0 8.7 0.3 354.2 17.6 6.7 0.61993 581.8 7.0 8.3 0.3 323.2 24.5 6.3 0.91994 609.7 6.1 8.7 0.3 373.6 24.7 7.1 1.11995 624.6 5.7 9.1 0.3 316.2 12.2 5.5 0.41996 509.7 5.6 7.5 0.2 347.7 19.5 6.0 0.6All 555.4 1.9 7.6 0.1 338.0 5.4 5.8 0.2
Grand Marais 1983 533.5 14.3 5.9 0.31984 515.9 8.4 6.1 0.21985 306.1 15.6 2.7 0.31986 343.0 13.9 3.0 0.2All 521.4 7.3 6.0 0.2 328.1 10.9 2.9 0.8
Grand Traverse 1986 521.5 22.4 7.0 0.61987 474.4 17.2 6.0 0.31988 451.8 21.0 5.1 0.31989 469.2 8.0 6.3 0.21990 485.1 9.8 6.9 0.41991 507.8 13.0 4.5 0.31992 518.2 10.3 6.9 0.31993 537.5 15.5 6.7 0.41994 509.8 14.0 5.4 0.31995 498.8 19.3 6.6 0.41996 516.2 13.8 6.5 0.3All 495.2 4.5 6.1 0.1

20
Table 8.–Summary of significant differences of length-at-age by fishing area by year for lakewhitefish in commercial catches. Letters in a cell indicate fish from those letter designations weresignificantly longer than fish from the column in which they appear.
Fishing areaOntonagon Upper Entry Keweenaw Big Bay Marquette Munising Grand Marais
Year Age (O) (U) Bay (K) (B) (Q) (M) (G)
1983 6 B, Q, M, G7 Q, M, G G G8 Q, M M9 Q, M, G
11 Q12 M
1984 6 Q Q7 Q, M Q, M, G8 K, Q, M9 Q, M, G M
10 Q, M Q, M11 B, Q12 Q, M Q, M
1985 6 B, Q, M7 B, Q, M Q Q8 Q Q Q9 B, Q Q Q
10 B, Q Q11 B, Q Q12 B, Q Q
1986 6 Q Q7 Q Q Q8 B, Q, M Q Q9 B, Q
10 Q Q11 Q Q12 Q Q
1987 5 B, Q, M6 B, Q, M B, M7 B, Q, M M M8 B, Q, M M9 B, Q, M
10 M
1988 9 Q11 Q
1989 6 Q
1990 8 Q, M9 Q, M

21
Table 8.–Continued.
Fishing areaOntonagon Upper Entry Keweenaw Big Bay Marquette Munising Grand Marais
Year Age (O) (U) Bay (K) (B) (Q) (M) (G)
1991 6 Q7 Q Q8 Q
1992 5 Q M6 B, Q M Q Q7 B, Q M Q Q8 B, Q M Q Q9 B, Q M Q, M Q
10 Q Q, M Q11 Q Q, M Q12 Q M Q, M13 Q, M Q14 Q, M
1993 5 B, Q M B, Q, M6 B, Q M B, Q, M7 B, Q M B, Q, M8 B, Q M B, Q, M Q9 B, Q M B, Q, M
10 B, Q, M
1994 5 M Q, M M M6 K, B, Q M B, Q, M M M7 K, B, Q M B, Q, M Q, M8 B, Q M Q, M Q, M9 B, Q M Q, M Q, M
10 Q Q
1995 5 M M6 Q, M O, Q M7 Q, M O, Q M8 Q, M Q M9 Q, M Q M
13 O O
1996 5 B, M6 B, Q7 B, Q B, Q8 B, Q B, Q9 B, Q, M

Tab
le 9
.–S
umm
ary
of s
igni
fican
t di
ffere
nces
of
leng
th-a
t-ag
e by
yea
r by
fis
hing
are
a fo
r la
ke w
hite
fish
in c
omm
erci
al t
rap-
net
catc
hes.
N
umb
ers
in a
cel
l ind
icat
e fis
h fr
om th
ose
year
des
igna
tions
(19
__)
wer
e si
gnifi
cant
ly la
rger
than
fish
from
the
colu
mn
in w
hich
they
app
ear.
Com
mer
cial
Yea
rfi
shin
g ar
eaA
ge19
8319
8419
8519
8619
8719
8819
8919
9019
9119
9219
9319
9419
9519
96
Upp
er6
––
––
––
––
–93
92,
93,
94–
Ent
ry7
––
––
––
––
–93
, 95
–
Kew
eena
w5
––
––
94,
96–
––
96–
Bay
683
, 84
, 86
,96
83,
86–
––
––
83,
84,
86,
9683
, 84
, 86
,96
–83
, 86
783
, 84
, 86
8383
, 84
, 86
––
––
–83
, 84
, 85
,86
, 87
, 96
83,
84,
86–
83,
84,
86
883
, 84
83,
8483
, 84
, 85
,86
––
––
–83
, 84
, 85
,86
83,
84,
85,
86–
83,
84,
85,
869
8383
8383
, 85
, 86
––
––
–83
, 84
, 85
,86
83,
86–
83,
84,
85,
86,
87,
93,
9410
8383
, 86
8383
––
––
–83
, 84
, 85
,86
, 87
–83
, 84
, 85
,86
, 87
1183
, 86
83,
8683
83–
––
––
–83
, 84
, 86
1286
83,
84,
86–
––
––
––
Big
Bay
583
, 86
, 87
,90
, 91
, 93
83,
9393
83,
9383
, 84
, 86
,87
, 90
, 91
,93
–83
, 93
683
, 93
83,
87,
93,
9483
, 93
83,
84,
85,
86,
87,
89,
90,
91,
93,
94,
96
83,
87,
93,
9483
, 93
83,
9383
, 93
83,
93–
83,
93
783
, 93
83,
9383
, 93
83,
91,
93,
9483
, 84
, 85
,90
, 91
, 93
,94
83,
91,
9383
, 93
83,
9383
, 91
, 93
83,
93–
83,
93
883
, 93
83,
9383
, 93
83,
84,
86,
9383
, 84
, 85
,86
, 93
83,
84,
86,
9383
, 86
, 93
83,
9383
, 84
, 85
,86
, 93
83,
84,
86,
93–
83,
86,
93
9–
9386
, 93
9393
9386
, 93
84, 8
5, 8
6,87
, 91,
93
86, 9
384
, 85,
86,
87, 8
8, 9
1,93
, 96
93–
86,
93
22
Tab
le 9
.–C
ontin
ued.
Com
mer
cial
Yea
rfi
shin
g ar
eaA
ge19
8319
8419
8519
8619
8719
8819
8919
9019
9119
9219
9319
9419
9519
96
Big
Bay
cont
inue
d10
–85
83,
84,
85,
86,
87,
88,
89,
91,
93,
94
––
1186
–84
, 85
, 86
,87
, 88
, 89
,91
, 94
––
1286
–84
, 85
, 86
,87
, 88
, 89
––
–
13–
––
–85
, 86
––
–14
––
––
84,
85,
86,
87–
––
–
Mar
quet
te5
90,
91,
9390
, 93
83,
84,
90,
91,
92,
9383
, 84
, 90
,91
, 92
, 93
83,
90,
91,
9383
, 84
, 90
,91
, 92
, 93
683
, 84
, 86
,91
, 92
, 93
,94
83,
84,
86,
90,
91,
92,
93,
94,
95
83,
84,
85,
86,
87,
89,
90,
91,
92,
93,
94,
95
83,
84,
86,
91,
92,
93,
94
83,
91,
9283
, 84
, 85
,86
, 89
, 90
,91
, 92
, 93
,94
, 95
795
83,
84,
85,
86,
90,
91,
92,
93,
94,
95
83,
84,
85,
86,
90,
91,
92,
93,
94,
95
83,
84,
85,
86,
90,
91,
92,
93,
94,
95
83,
84,
92,
9583
, 84
, 92
,95
83,
84,
85,
86,
90,
91,
92,
93,
94,
958
9483
, 84
, 85
,86
, 92
, 93
,94
, 95
83,
84,
85,
86,
91,
92,
93,
94,
95
83,
84,
85,
86,
92,
93,
94,
95
83,
84,
85,
86,
92,
93,
94,
95
83,
84,
86,
93,
94,
9583
, 94
, 95
83,
84,
85,
86,
90,
91,
92,
93,
94,
959
8383
, 94
8383
, 84
, 85
,86
, 88
, 90
,92
, 93
, 94
,95
8383
, 85
, 86
,93
, 94
, 95
83,
9483
8383
, 84
, 85
,86
, 88
, 90
,92
, 93
, 94
,95
1083
8383
, 85
, 86
,94
, 95
8383
, 84
, 85
,86
, 93
, 94
,95
83,
85,
86,
94,
9583
8383
83,
86,
94
23

Tab
le 9
.–C
ontin
ued.
Com
mer
cial
Yea
rfi
shin
g ar
eaA
ge19
8319
8419
8519
8619
8719
8819
8919
9019
9119
9219
9319
9419
9519
96
Mar
quet
teco
ntin
ued
1183
8383
, 85,
86,
8983
8383
, 85,
86,
88, 8
9, 9
583
8383
, 86,
89
12–
84, 8
6–
–84
, 85
, 86
13–
–84
, 86
–
Mun
isin
g4
–93
93–
––
594
, 95
94,
9583
, 90
, 91
,93
, 94
, 95
83,
90,
91,
93,
94,
9594
, 95
83,
90,
91,
92,
93,
94,
95
83,
90,
91,
92,
93,
94,
95
94,
9594
94,
9594
, 95
94,
95
694
, 95
94,
9583
, 87
, 90
,91
, 93
, 94
,95
83,
84,
87,
90,
91,
93,
94,
95
94,
9583
, 84
, 87
,90
, 91
, 93
,94
, 95
83,
84,
87,
90,
91,
93,
94,
95
83,
87,
91,
93,
94,
9594
, 95
83,
84,
87,
90,
91,
93,
94,
95
94,
9583
, 84
, 87
,90
, 91
, 93
,94
, 95
795
83,
84,
87,
90,
91,
93,
94,
95
83,
84,
87,
90,
91,
93,
94,
95
83,
84,
94,
9583
, 84
, 87
,90
, 91
, 93
,94
, 95
83,
84,
87,
90,
91,
93,
94,
95
83,
84,
94,
9583
, 84
, 94
,95
83,
84,
87,
90,
91,
93,
94,
95
83,
9595
83,
84,
85,
87,
88,
90,
91,
93,
94,
958
8383
, 84
, 94
,95
83,
84,
9583
, 95
83,
84,
85,
86,
87,
90,
93,
94,
95
83,
84,
86,
94,
9583
, 84
, 94
,95
83,
84,
86,
94,
9583
, 84
, 86
,94
, 95
83,
84,
94,
9583
8383
, 84
, 85
,86
, 87
, 88
,89
, 90
, 91
,92
, 93
, 94
,95
983
83,
84,
86,
87,
93,
94,
95
83,
84,
9483
, 84
83,
84,
86,
87,
93,
94,
95
83,
84,
9483
, 84
, 94
,95
83,
84,
86,
87,
93,
94,
95
83,
84,
86,
87,
93,
94,
95
83,
8483
8383
, 84
, 86
,87
, 90
, 91
,92
, 93
, 94
,95
1083
83,
84,
94,
9583
, 95
83,
84,
85,
86,
87,
88,
90,
91,
93,
94,
95
8383
83,
84,
85,
86,
87,
88,
90,
91,
92,
93,
94,
9511
85,
86,
88,
89,
94,
9512
8383
83,
84,
86–
83,
84,
8683
, 84
, 86
83,
84,
8683
, 84
83,
8483
, 84
, 86
13–
––
–86
14–
––
––
8484
–
Gra
nd5
83–
––
––
––
––
––
–M
ara
is7
83–
––
––
––
––
––
–
24
25
Table 10.–Summary of significant differences of length-at-age by fishing area by year forlake whitefish in sport catches. Letters in a cell indicate fish from those letter designations weresignificantly longer than fish from the column in which they appear.
Fishing areaKeweenaw Bay Marquette Munising Grand Traverse Bay
Year Age (K) (Q) (M) (T)
1987 3 K4 K, T K5 K, T6 K, T K7 K, T K8 K, T9 T
10 K11 K
1988 4 K K5 Q
1989 6 K
1991 2 T3 T Q, T4 K, T K, Q, T5 K, T K, T6 T
1992 4 K K, Q5 K, T K, Q, T6 K, T7 T8 T9 T
1993 3 Q4 K K5 K K, Q, T6 K, T7 T8 T
1994 3 M, T T4 T T5 T T6 T8 T
1995 4 T Q, T5 T Q, T6 T7 T8 T
1996 4 Q, T5 T Q, T6 T7 T

Tab
le 1
1. –
Sum
mar
y of
sig
nific
ant
diffe
renc
es o
f le
ngth
-at-
age
by y
ear
by f
ishi
ng a
rea
for
lake
whi
tefis
h in
spo
rt c
atch
es.
Num
bers
in a
cel
lin
dica
te fi
sh fr
om th
ose
year
des
igna
tions
(19
__)
wer
e si
gnifi
cant
ly la
rger
than
fish
from
the
colu
mn
in w
hich
they
app
ear.
Spor
tY
ear
fish
ing
area
Age
1985
1986
1987
1988
1989
1990
1991
1992
1993
1994
1995
1996
Kew
eena
wB
ay4
––
–87
, 88
––
–
Mar
quet
te3
––
––
8888
, 93
, 95
8888
, 91
, 93
,95
4–
––
–88
8888
8888
885
––
––
8888
8888
886
––
––
–90
–
Mun
isin
g3
87,
94–
––
–94
–85
, 87
, 91
,94
488
–88
––
–88
85,
8888
8885
, 88
885
88–
88–
–88
8885
, 88
, 91
8885
, 88
, 91
88
Gra
nd3
––
91,
94–
––
––
91–
–T
rave
rse
Bay
4–
91,
9486
, 88
, 91
,94
, 95
91,
9491
, 94
91–
9191
, 94
91,
94
5–
9191
, 94
91,
9491
, 94
91,
9491
91,
92,
9491
, 94
6–
91,
9491
, 94
91,
9487
, 91
, 92
,93
, 94
, 96
91,
92,
93,
9491
, 94
9191
, 94
91,
94
7–
9687
, 92
, 93
,94
, 95
, 96
87,
92,
93,
94,
95,
96–
93,
94,
9696
8–
94,
96–
94,
9687
, 93
, 94
,95
, 96
–87
, 94
, 96
94,
96
9–
–86
, 87
––
–
26

27
Table 12.–Summary of significant differences between length-at-age for sport- andcommercial trap net-caught lake whitefish in Lake Superior (S = sport-caught fish significantlylonger, C = commercial-caught fish significantly longer).
Significantly greaterFishing area Year Ages length-at-age
Keweenaw 1987 5, 6, 7, 8 S1993 5, 6 S
Marquette 1990 4, 5, 6 C1991 5 C1992 5 C1993 5 C1994 5, 6 C1995 5 C1996 5 C
Munising 1985 5, 6, 7, 8, 9, 11 C1987 4, 5, 6, 7, 8, 9, 10 C1988 4, 5 C1991 4, 5, 6, 7, 9, 11 C1992 4, 5, 6, 7, 8, 9, 10, 12 C1993 4, 5, 6, 7, 8, 9, 10 C1994 5, 8, 9 C1995 5, 6, 7, 8, 9, 10 C1996 5, 6, 9, 11 C

28
References
Abrosov, U. N. 1969. Determination ofcommercial turnover time in natural bodiesof water. Journal of Ichthyology 9: 482-488.
Baldwin, N. S., R. W. Saalfeld, M. A. Ross, andH. J. Buettner. 1979. Commercial fishproduction in the Great Lakes 1867-1977.Great Lakes Fishery Commission TechnicalReport 3.
Clark, R. D., Jr. 1984. A tale of two fisheries:the Boom and Buster and the Green Branch.Michigan Department of Natural Resources,Fisheries Technical Report 84-4, Ann Arbor.
Clark, R. D., Jr., and K. D. Smith. 1985.Methods for determining catch quotas forGreat lakes fish. Michigan Department ofNatural Resources, Fisheries DivisionDingell-Johnson F- 53-R-1 Final ReportStudy 524, Ann Arbor.
Christie, W. J. and H. A. Regier. 1972.Temperature as a major factor influencingreproductive success of fish -- twoexamples. In B. B. Parris (ed.) InternationalSymposium on Stock and Recruitment.
Dryer, W. R. 1962. Age and growth of thewhitefish in Lake Superior. Fishery Bulletin63: 77-95.
Ebener, M. P., C. R. Bronte, and T.R. Busiahn.1985. Biological and commercial catchstatistics from inter-tribal assessment fishingin western Michigan waters, and initialrecommendations for management of thefishery. Great Lakes Indian Fish andWildlife Commission, Odanah, WI.Administrative Report.
Ebener, M. P. and C. R. Bronte. 1986.Biological and commercial catch statisticsfrom inter-tribal fishing in Michigan watersof Lake Superior in 1985. Great LakesIndian Fish and Wildlife Commission,Odanah, WI. Administrative report 86-1.
Ebener, M.P. and C.R. Bronte. 1987.Biological and commercial catch statisticsfrom the inter-tribal fishery in Michiganwaters of Lake Superior, 1986. Great LakesIndian Fish and Wildlife Commission,Odanah, WI. Administrative Report 87-4.
Ebener, M. P. and C. R. Bronte. 1988.Biological and commercial catch statisticsfrom the inter-tribal fishery in Michiganwaters of Lake Superior, 1987. Great LakesIndian Fish and Wildlife Commission,Odanah, WI. Administrative Report 88-6.
Ebener, M. P. and M. Gallinat, and M. Donofrio.1989. Biological and commercial catchstatistics from the inter-tribal fishery inMichigan waters of Lake Superior, 1988.Great Lakes Indian Fish and WildlifeCommission, Odanah, WI. AdministrativeReport 89-6.
Ebener, M. P. and C. R. Bronte. 1990.Biological and commercial catch statisticsfrom the inter-tribal fishery in Michiganwaters of Lake Superior, 1989. Great LakesIndian Fish and Wildlife Commission,Odanah, WI. Administrative Report 90-2.
Edsall, T. A. 1960. Age and growth of thewhitefish, Coregonus clupeaformis, ofMunising Bay, Lake Superior. Transactionsof the American Fisheries Society 89: 323-332.
Koziol, A. M. 1982. Dynamics of lightlyexploited populations of the lake whitefish,Isle Royale vicinity, Lake Superior.Michigan Department of Natural Resources,Fisheries Research Report 1911, Ann Arbor.
Mattes, W. P., M. P. Gallinat, and M. Donofrio.1997. Biological and commercial catchstatistics from the Chippewa inter-tribal gillnet fishery within Michigan waters of LakeSuperior during 1996. Great Lakes IndianFish and Wildlife Commission, Odanah, WI.Administrative Report 97-4.

29
Peck, J. W. 1994. Effects of commercial fishingon an unexploited lake whitefish populationin Michigan’s waters of Lake Superior,1983-1989. Michigan Department ofNatural Resources, Fisheries ResearchReport 2007, Ann Arbor
Prager, M. H., S. B. Saila, and C. W. Recksiek.1989. FISHPARM: a microcomputerprogram for parameter estimation ofnonlinear models in fishery science, secondedition. Old Dominion UniversityOceanography Technical Report 87-10.
Rakoczy, G. P. 1983. Recommended harvestlevels for commercially exploited stocks oflake whitefish in Michigan waters of LakeSuperior. Michigan Department of NaturalResources, Fisheries Research Report 1912,Ann Arbor.
Rakoczy, G. P. 1992a. Sportfishing catch andeffort from the Michigan waters of lakesMichigan, Huron, Superior, and Erie, andtheir important tributary streams, April 1,1990 - March 31, 1991. MichiganDepartment of Natural Resources, FisheriesTechnical Report 92-8, Ann Arbor.
Rakoczy, G. P. 1992b. Sportfishing catch andeffort from the Michigan waters of lakesMichigan, Huron, Erie, and Superior, andtheir important tributary streams, April 1,1991 - March 31, 1992. MichiganDepartment of Natural Resources, FisheriesTechnical Report 92-11, Ann Arbor.
Rakoczy, G. P., and R. N. Lockwood. 1988.Sportfishing catch and effort from theMichigan waters of Lake Michigan and theirimportant tributary streams, January 1, 1985- March 31, 1986 (with Appendices).Michigan Department of Natural Resources,Fisheries Technical Reports 88-11a and 88-11b, Ann Arbor.
Rakoczy, G. P., and R. D. Rogers. 1987.Sportfishing catch and effort from theMichigan waters of lakes Michigan, Huron,Superior, and Erie, and their importanttributary streams, April 1, 1986 - March 31,1987 (with Appendices). MichiganDepartment of Natural Resources, FisheriesTechnical Reports 87-6a and 87-6b, AnnArbor.
Rakoczy, G. P., and R. D. Rogers. 1988.Sportfishing catch and effort from theMichigan waters of lakes Michigan, Huron,Superior, and Erie, and their importanttributary streams, April 1, 1987 - March 31,1988 (with Appendices). MichiganDepartment of Natural Resources, FisheriesTechnical Reports 88-9a and 88-9b, AnnArbor.
Rakoczy, G. P., and R. D. Rogers. 1990.Sportfishing catch and effort from theMichigan waters of lakes Michigan, Huron,Superior, and Erie, and their importanttributary streams, April 1, 1988 - March 31,1989 (with Appendices). MichiganDepartment of Natural Resources, FisheriesTechnical Reports 90-2a and 90-2b, AnnArbor.
Rakoczy, G. P., and R. D. Rogers. 1991.Sportfishing catch and effort from theMichigan waters of lakes Michigan, Huron,Superior, and Erie, and their importanttributary streams, April 1, 1989 - March 31,1990 (with Appendices). MichiganDepartment of Natural Resources, FisheriesTechnical Reports 91-10a, Ann Arbor.
Rakoczy, G. P., and R. F. Svoboda. 1994.Sportfishing catch and effort from theMichigan waters of lakes Michigan, Huron,Erie, and Superior, April 1, 1992 - March31, 1993. Michigan Department of NaturalResources, Fisheries Technical Report 94-6,Ann Arbor.
Rakoczy, G. P., and R. F. Svoboda. 1995.Sportfishing catch and effort from theMichigan waters of lakes Michigan, Huron,Erie, and Superior, April 1, 1993 - March31, 1994. Michigan Department of NaturalResources, Fisheries Technical Report 95-1,Ann Arbor.
Ricker, W. E. 1975. Computation andinterpretation of biological statistics of fishpopulations. Fisheries Research Board ofCanada, Bulletin 191.
Robson, D. S., and D. G. Chapman. 1961.Catch curves and mortality rates.Transactions of the American FisheriesSociety 90:181-189.

30
Rybicki, R. W. 1980. Assessment of lakewhitefish populations in northern LakeMichigan. Michigan Department of NaturalResources. Final Program Report for CFRD(PL 88-309).
Rybicki, R. W. and P. J. Schneeberger. 1990.Recent history and management of the state-licensed commercial fishery for lakewhitefish in the Michigan waters of LakeMichigan. Michigan Department of NaturalResources, Fisheries Research Report 1960,Ann Arbor.
Ryckman, J. R. 1981. Creel census methods ingeneral Appendix VI-A-9 in Manual ofFisheries Survey Methods, J.W. Merna et al.Michigan Department of Natural Resources,Fisheries Management Report 9, Ann Arbor.
Technical Fisheries Review Committee (TFRC).1985. Status of the fishery resource-1985.A report by the Technical Fisheries ReviewCommittee on the assessment of major fishstocks in the treaty-ceded waters of theupper Great Lakes: State of Michigan. U.S.Department of the Interior, State ofMichigan, Chippewa/Ottawa Treaty FisheryManagement Authority, MimeographedReport.
Technical Fisheries Review Committee (TFRC).1986. Status of the fishery resource-1986.A report by the Technical Fisheries ReviewCommittee on the assessment of major fishstocks in the treaty-ceded waters of theupper Great lakes: State of Michigan. U.S.Department of the Interior, State ofMichigan, Chippewa/Ottawa Treaty FisheryManagement Authority, MimeographedReport.
Technical Fisheries Review Committee (TFRC).1987. Status of the fishery resource-1987.A report by the Technical Fisheries ReviewCommittee on the assessment of major fishstocks in the treaty-ceded waters of theupper Great Lakes: State of Michigan. U.S.Department of the Interior, State ofMichigan, Chippewa/Ottawa Treaty FisheryManagement Authority, MimeographedReport.
Technical Fisheries Review Committee (TFRC).1988. Status of the fishery resource-1988.A report by the Technical Fisheries ReviewCommittee on the assessment of major fishstocks in the treaty-ceded waters of theupper Great Lakes: State of Michigan. U.S.Department of the Interior, State ofMichigan, Chippewa/Ottawa Treaty FisheryManagement Authority, MimeographedReport.
Technical Fisheries Review Committee (TFRC).1989. Status of the fishery resource-1989.A report by the Technical Fisheries ReviewCommittee on the assessment of major fishstocks in the treaty-ceded waters of theupper Great Lakes: State of Michigan. U.S.Department of the Interior, State ofMichigan, Chippewa/Ottawa Treaty FisheryManagement Authority, MimeographedReport.
Technical Fisheries Review Committee (TFRC).1992. Status of the fishery resource - 1991.A report by the Technical Fisheries ReviewCommittee on the assessment of lake troutand lake whitefish in waters of the UpperGreat Lakes ceded in the Treaty of 1836.U.S. Department of the Interior, State ofMichigan, Chippewa/Ottawa Treaty FisheryManagement Authority, MimeographedReport.

App
endi
x 1.
–Est
imat
ed n
umbe
rs o
f la
ke w
hite
fish
caug
ht i
n G
reat
Lak
es s
port
fis
herie
s (2
SE
in
pare
nthe
ses)
. A
ll da
ta f
rom
cre
el
surv
eys
cond
ucte
d un
der
D-J
F-5
3-R
Stu
dy 4
27.
Tota
lYe
arLo
catio
nM
ode
catc
h/hr
Jan
Feb
Mar
Apr
May
Jun
Jul
Aug
Sep
Oct
Nov
Seas
on to
tal
1985
Lake
Mic
higa
nal
l0.
0129
467
71,
895
45,5
4510
,097
6,27
89,
074
089
,870
(0.0
038)
(8)
(1,1
26)
(8,4
50)
(23,
124)
(6,2
09)
(3,8
78)
(5,4
39)
(–)
(26,
279)
boat
0.01
530
677
18,1
9545
,545
10,0
976,
278
9,07
40
89,8
66(0
.004
5)(–
)(1
,126
)(8
,450
)(2
3,12
4)(6
,209
)(3
,878
)(5
,439
)(–
)(2
6,27
9)pi
er<0
.000
14
00
00
00
04
(<0.
0001
)(8
)(–
)(–
)(–
)(–
)(–
)(–
)(–
)(8
)St
. Joe
, Ben
ton
Har
bor
all
<0.0
001
40
00
00
00
4(<
0.00
01)
(8)
(–)
(–)
(–)
(–)
(–)
(–)
(–)
(8)
Wes
t Tra
vers
e Ba
yal
l0.
1106
054
65,
851
24,2
7352
20
7631
,268
(0.0
726)
(–)
(1,1
08)
(6,6
05)
(19,
237)
(548
)(–
)(1
60)
(20,
377)
East
Tra
vers
e Ba
yal
l0.
3189
013
112
,344
21,2
729,
575
6,27
88,
998
58,5
98(0
.093
6)(–
)(2
03)
(5,2
70)
(12,
832)
(6,1
85)
(3,8
78)
(5,4
37)
(16,
593)
1986
Wes
t Gra
nd T
rave
rse
Bay
ice
0.04
5347
61,
343
1,81
9(0
.034
8)(5
50)
(1,2
58)
(1,3
73)
East
Gra
nd T
rave
rse
Bay
ice
0.55
546,
040
13,9
3419
,974
(0.2
336)
(2,7
71)
(7,0
99)
(7,6
21)
Lake
Mic
higa
nal
l0.
0082
05,
396
10,7
8022
,462
12,4
7050
22,
418
054
,028
(0.0
023)
(–)
(4,0
91)
(8,0
74)
(9,6
67)
(5,5
66)
(1,0
26)
(1,7
42)
(–)
(14,
507)
boat
0.00
950
5,39
610
,664
22,4
6212
,470
502
2,38
10
53,8
75(0
.002
7)(–
)(4
,094
)(8
,073
)(9
,667
)(5
,566
)(1
,026
)(1
,740
)(–
)(1
4,50
6)pi
er0.
0000
00
00
00
370
37(0
.000
0)(–
)(–
)(–
)(–
)(–
)(–
)(7
5)(–
)(7
5)sh
ore
0.00
070
011
60
00
00
116
(0.0
006)
(–)
(–)
(101
)(–
)(–
)(–
)(–
)(–
)(1
01)
Man
iste
eal
l0.
0001
00
00
00
037
(0.0
002)
(–)
(–)
(–)
(–)
(–)
(–)
(37)
(75)
Wes
t Gra
nd T
rave
rse
Bay
all
0.13
040
274
9,43
15,
357
7,80
30
7522
,865
(0.0
607)
(–)
(275
)(7
,982
)(4
,483
)(4
,830
)(–
)(–
)(1
0,35
4)Ea
st G
rand
Tra
vers
e Ba
yal
l0.
2592
05,
122
1,23
316
,359
4,47
350
22,
381
30,0
70(0
.092
7)(–
)(4
,082
)(1
,208
)(8
,417
)(2
,756
)(1
,026
)(1
,740
)(1
0,03
2)El
k R
apid
sal
l0.
0216
00
074
619
40
094
0(0
.037
0)(–
)(–
)(–
)(1
,585
)(2
40)
(–)
(–)
(1,6
03)
Cha
rlevo
ixal
l0.
0012
011
60
00
011
6(0
.001
1)(–
)(1
01)
(–)
(–)
(–)
(–)
(101
)La
ke H
uron
all
0.00
010
00
572
00
00
572
(0.0
001)
(–)
(–)
(–)
(749
)(–
)(–
)(–
)(–
)(7
49)
St. I
gnac
ebo
at0.
0100
00
572
00
00
572
(0.0
133)
(–)
(–)
(749
)(–
)(–
)(–
)(–
)(7
49)
Au S
able
Riv
eral
l0.
0024
00
00
00
403
040
3(0
.003
9)(–
)(–
)(–
)(–
)(–
)(–
)(6
56)
(–)
(656
)
31

App
endi
x 1.
–C
ontin
ued.
Tota
lYe
arLo
catio
nM
ode
catc
h/hr
Jan
Feb
Mar
Apr
May
Jun
Jul
Aug
Sep
Oct
Nov
Seas
on to
tal
1987
Hur
on B
ayic
e0.
1310
414
770
1,18
4(0
.064
3)(2
73)
(431
)(5
10)
Mun
isin
g Ba
yic
e0.
2410
6458
347
6805
(0.1
208)
(3,0
61)
(267
)(3
,073
)La
ke M
ichi
gan
all
0.00
350
272
1,24
98,
969
7,92
41,
269
183
145
20,0
11(0
.001
3)(–
)(3
04)
(961
)(5
,494
)(4
,819
)(8
94)
(228
)(1
58)
(7,4
36)
boat
0.00
400
272
1,24
98,
969
7,92
41,
269
183
145
20,0
11(0
.001
5)(–
)(3
04)
(961
)(5
,494
)(4
,819
)(8
94)
(228
)(1
58)
(7,4
36)
Wes
t Arm
Gra
nd T
rave
rse
Bay
all
0.06
970
131
6,53
73,
554
577
870
10,8
86(0
.036
9)(–
)(2
69)
(5,0
32)
(2,2
82)
(657
)(1
77)
(–)
(5,5
73)
East
Arm
Gra
nd T
rave
rse
Bay
all
0.09
860
1,11
82,
432
3,11
369
296
145
7,59
6(0
.060
4)(–
)(9
23)
(2,2
06)
(3,8
64)
(606
)(1
44)
(158
)(4
,589
)El
k R
apid
sal
l0.
0299
272
00
1,25
70
00
1,52
9(0
.034
9)(3
04)
(–)
(–)
(1,7
55)
(–)
(–)
(–)
(1,7
81)
Lake
Hur
onal
l0.
0011
05
4,01
394
410
620
4,21
5(0
.002
1)(–
)(1
0)(8
,211
)(1
99)
(91)
(–)
(124
)(–
)(8
,215
)bo
at0.
0013
05
4,01
394
410
04,
153
(0.0
026)
(–)
(10)
(8,2
11)
(199
)(9
1)(–
)(–
)(8
,214
)O
scod
aal
l0.
0004
00
094
00
094
(0.0
009)
(–)
(–)
(–)
(199
)(–
)(–
)(–
)(1
99)
Alpe
naal
l0.
0001
05
00
00
05
(0.0
002)
(–)
(10)
(–)
(–)
(–)
(–)
(–)
(10)
Rog
ers
City
all
0.00
070
00
00
062
62(0
.001
4)(–
)(–
)(–
)(–
)(–
)(–
)(1
24)
(124
)D
etou
ral
l0.
0011
00
041
00
41(0
.002
5)(–
)(–
)(–
)(9
1)(–
)(–
)(9
1)D
rum
mon
d Is
land
all
0.01
200
04,
013
00
00
4,01
3(0
.024
6)(–
)(–
)(8
,211
)(–
)(–
)(–
)(–
)(8
,211
)St
. Mar
ys R
iver
all
0.14
735,
059
9,56
15,
773
391
163
227
21,1
74(0
.050
8)(3
,854
)(4
,041
)(2
,551
)(4
27)
(341
)(1
94)
(6,1
67)
Ont
onag
onal
l0.
0010
019
00
00
19(0
.002
1)(–
)(3
9)(–
)(–
)(–
)(–
)(3
9)Bi
g Ba
yal
l0.
0006
00
20
00
02
(0.0
012)
(–)
(–)
(4)
(–)
(–)
(–)
(–)
(4)
Mun
isin
gal
l0.
0191
239
4811
90
00
00
406
(0.0
154)
(291
)(7
6)(1
24)
(–)
(–)
(–)
(–)
(–)
(325
)19
88Ke
wee
naw
Bay
ice
0.06
524,
590
312
4,90
2(0
.048
1)(3
,534
)(2
68)
(3,5
44)
Hur
on B
ayic
e0.
0881
424
042
4(0
.131
9)(6
08)
(–)
(608
)M
unis
ing
ice
0.14
834,
646
1,26
05,
906
(0.0
568)
(1,9
34)
(967
)(2
,162
)
32

App
endi
x 1.
–C
ontin
ued.
Tota
lYe
arLo
catio
nM
ode
catc
h/hr
Jan
Feb
Mar
Apr
May
Jun
Jul
Aug
Sep
Oct
Nov
Seas
on to
tal
1988
Bay
City
ice
0.00
0422
00
22(0
.000
8)(4
6)(–
)(–
)(4
6)La
ke M
ichi
gan
all
0.00
300
302,
048
6,78
72,
058
392
1,93
31,
485
014
,733
(0.0
010)
(–)
(60)
(2,6
71)
(3,4
89)
(1,6
43)
(838
)(1
,020
)(1
,196
)(–
)(5
,018
)bo
at0.
0033
00
2,04
46,
787
2,05
839
21,
933
1,02
70
14,2
41(0
.001
2)(–
)(–
)(2
,671
)(3
,489
)(1
,643
)(8
38)
(1,0
20)
(998
)(–
)(4
,974
)pi
er0.
0009
030
40
00
043
90
473
(0.0
013)
(–)
(60)
(9)
(–)
(–)
(–)
(–)
(657
)(–
)(6
60)
shor
e0.
0002
00
00
00
190
19(0
.000
5)(–
)(–
)(–
)(–
)(–
)(–
)(4
4)(–
)(4
4)St
. Joe
all
0.00
040
017
10
00
00
171
(0.0
008)
(–)
(–)
(353
)(–
)(–
)(–
)(–
)(–
)(3
53)
Fran
kfor
tal
l0.
0018
304
00
00
439
473
(0.0
025)
(60)
(9)
(–)
(–)
(–)
(–)
(657
)(6
60)
Plat
te B
ayal
l0.
0052
06
8563
00
015
4(0
.005
9)(–
)(1
3)(1
30)
(113
)(–
)(–
)(–
)(1
73)
Lela
ndal
l0.
0020
299
00
299
(0.0
045)
(669
)(–
)(–
)(6
69)
Wes
t Gra
nd T
rave
rse
Bay
all
0.00
560
960
714
00
081
0(0
.005
2)(–
)(1
97)
(–)
(720
)(–
)(–
)(–
)(7
46)
East
Gra
nd T
rave
rse
Bay
all
0.14
410
159
6,40
31,
281
01,
933
1,04
610
,822
(0.0
550)
(–)
(170
)(3
,422
)(1
,473
)(–
)(1
,020
)(9
99)
(3,9
93)
Elk
Rap
ids
all
0.04
570
1,61
20
039
20
02,
004
(0.0
632)
(–)
(2,6
35)
(–)
(–)
(838
)(–
)(–
)(2
,765
)La
ke H
uron
all
0.00
010
00
312
350
034
7(0
.000
1)(–
)(–
)(–
)(2
99)
(73)
(–)
(–)
(308
)bo
at0.
0001
00
031
235
00
347
(0.0
001)
(–)
(–)
(–)
(299
)(7
3)(–
)(–
)(3
08)
Eagl
e Ba
yal
l0.
0001
00
00
350
35(0
.000
2)(–
)(–
)(–
)(–
)(7
3)(–
)(7
3)H
arris
ville
all
0.00
080
013
30
00
133
(0.0
013)
(–)
(–)
(216
)(–
)(–
)(–
)(2
16)
Alpe
naal
l0.
0001
00
07
00
7(0
.000
1)(–
)(–
)(–
)(9
)(–
)(–
)(9
)St
. Ign
ace
boat
0.00
560
017
20
017
2(0
.006
8)(–
)(–
)(2
06)
(–)
(–)
(206
)La
ke S
uper
ior
all
0.01
350
626
809
978
150
02,
428
(0.0
071)
(–)
(476
)(6
05)
(1,0
08)
(29)
(–)
(–)
(1,2
69)
Ont
onag
onal
l0.
0025
053
00
053
(0.0
036)
(–)
(77)
(–)
(–)
(–)
(77)
Hur
on B
aybo
at0.
0191
258
00
00
258
(0.0
239)
(319
)(–
)(–
)(–
)(–
)(3
19)
33

App
endi
x 1.
–C
ontin
ued.
Tota
lYe
arLo
catio
nM
ode
catc
h/hr
Jan
Feb
Mar
Apr
May
Jun
Jul
Aug
Sep
Oct
Nov
Seas
on to
tal
1988
Pres
que
Isle
Har
bor
all
0.02
560
038
877
80
00
1,16
6(0
.024
0)(–
)(–
)(4
71)
(976
)(–
)(–
)(–
)(1
,084
)M
unis
ing
all
0.02
9662
616
314
715
00
951
(0.0
179)
(476
)(2
06)
(239
)(2
9)(–
)(–
)(5
72)
1989
Kew
eena
w B
ayic
e0.
0385
3,18
80
3,18
8(0
.044
1)(3
,572
)(–
)(3
,572
)H
uron
Bay
ice
0.11
1622
755
177
8(0
.075
5)(2
57)
(417
)(4
90)
Wes
t Arm
Gra
nd T
rave
rse
Bay
ice
0.10
452,
509
2,50
9(0
.124
3)(2
,607
)(2
,607
)Ea
st A
rm G
rand
Tra
vers
e Ba
yic
e0.
1993
3,56
23,
562
(0.1
594)
(2,3
56)
(2,3
56)
Lake
Mic
higa
nal
l0.
0049
024
12,
007
297
6,20
02,
682
391
1,98
80
13,8
06(0
.001
9)(–
)(5
08)
(1,7
77)
(287
)(4
,138
)(2
,269
)(4
45)
(756
)(–
)(5
,158
)bo
at0.
0058
024
12,
007
297
6,20
02,
682
391
1,98
80
13,8
06(0
.002
2)(–
)(5
08)
(1,7
77)
(387
)(4
,138
)(2
,269
)(4
45)
(756
)(–
)(5
,158
)El
k R
apid
sal
l0.
0733
01,
767
00
574
092
43,
265
(0.0
496)
(–)
(1,7
60)
(–)
(–)
(1,2
35)
(–)
(341
)(2
,177
)Ea
st G
rand
Tra
vers
e Ba
yal
l0.
1279
241
168
297
5,50
91,
551
391
1,06
49,
221
(0.0
646)
(508
)(2
19)
(387
)(4
,055
)(1
,813
)(4
45)
(675
)(4
,565
)W
est G
rand
Tra
vers
e Ba
yal
l0.
0103
072
069
155
70
01,
320
(0.0
080)
(–)
(105
)(–
)(8
24)
(581
)(–
)(–
)(1
,014
)Tr
aver
se B
aybo
at0.
0024
020
00
020
(0.0
050)
(–)
(41)
(–)
(–)
(–)
(41)
Hur
on B
aybo
at0.
1174
1,43
50
00
01,
435
(0.1
099)
(1,3
18)
(–)
(–)
(–)
(–)
(1,3
18)
1990
Littl
e Ba
y de
Noc
ice
0.00
000
09
9(0
.000
0)(–
)(–
)(1
9)(1
9)Ke
wee
naw
Bay
ice
0.00
9610
610
6(0
.019
4)(2
12)
(212
)La
ke M
ichi
gan
all
0.00
600
01,
207
1,20
91,
356
4,42
932
3,87
50
12,1
08(0
.002
5)(–
)(–
)(9
98)
(1,5
52)
(971
)(3
,036
)(6
6)(3
,220
)(–
)(4
,893
)bo
at0.
0071
00
1,20
71,
120
1,35
64,
429
323,
875
12,0
19(0
.002
9)(–
)(–
)(9
98)
(1,5
41)
(971
)(3
,036
)(6
6)(3
,220
)(4
,889
)sh
ore
0.00
150
089
00
00
089
(0.0
031)
(–)
(–)
(181
)(–
)(–
)(–
)(–
)(–
)(1
81)
Elk
Rap
ids
all
0.06
3419
189
00
02,
219
2,49
9(0
.079
0)(1
04)
(181
)(–
)(–
)(–
)(3
,095
)(3
,102
)Ea
st A
rm G
rand
Tra
vers
e Ba
yal
l0.
1824
985
1,11
488
34,
264
321,
656
8,93
4(0
.079
3)(9
91)
(1,5
41)
(767
)(3
,021
)(6
6)(8
87)
(3,7
23)
Wes
t Arm
Gra
nd T
rave
rse
Bay
all
0.00
740
310
473
165
00
669
(0.0
074)
(–)
(63)
(–)
(596
)(2
97)
(–)
(–)
(669
)
34

App
endi
x 1.
–C
ontin
ued.
Tota
lYe
arLo
catio
nM
ode
catc
h/hr
Jan
Feb
Mar
Apr
May
Jun
Jul
Aug
Sep
Oct
Nov
Seas
on to
tal
1990
St. J
oe/B
ento
n H
arbo
ral
l0.
0000
00
06
00
00
6(0
.000
0)(–
)(–
)(–
)(1
4)(–
)(–
)(–
)(–
)(1
4)La
ke S
uper
ior
all
0.00
6285
200
830
034
871
6(0
.004
9)(1
02)
(365
)(1
62)
(–)
(–)
(390
)(5
67)
Blac
k R
iver
Har
bor
all
0.00
030
00
30
00
3(0
.000
6)0
(–)
(–)
(6)
(–)
(–)
(–)
(6)
Trav
erse
Bay
boat
0.00
1315
00
015
(0.0
018)
(21)
(–)
(–)
(–)
(21)
Pres
que
Isle
Har
bor
all
0.01
0370
200
800
017
367
(0.0
116)
(100
)(3
65)
(162
)(–
)(–
)(3
4)(4
13)
Mar
quet
te L
ower
Har
bor
all
0.02
610
00
00
331
331
(0.0
311)
(–)
(–)
(–)
(–)
(–)
(389
)(3
89)
Rog
ers
City
all
0.00
010
120
012
(0.0
002)
(–)
(25)
(–)
(–)
(25)
1991
Kew
eena
w B
ayic
e0.
0029
218
4926
7(0
.002
6)(2
23)
(70)
(234
)M
arqu
ette
ice
0.00
8044
44(0
.007
0)(3
8)(3
8)M
unis
ing
ice
0.12
831,
738
886
2,62
4(0
.068
2)(1
,207
)(6
52)
(1,3
72)
Lake
Mic
higa
nal
l0.
0046
3813
1,27
220
12,
187
5,35
672
699
10
10,7
84(0
.001
7)(5
9)(2
6)(9
02)
(257
)(1
,494
)(3
,502
)(4
81)
(503
)(–
)(3
,983
)bo
at0.
0054
513
1,27
220
12,
187
5,35
672
699
110
,751
(0.0
020)
(15)
(26)
(902
)(2
57)
(1,4
94)
(3,5
02)
(481
)(5
03)
(3,9
83)
pier
0.00
0133
00
00
00
00
33(0
.000
2)(5
7)(–
)(–
)(–
)(–
)(–
)(–
)(–
)(–
)(5
7)N
ew B
uffa
loal
l0.
0000
50
00
00
05
(0.0
000)
(15)
(–)
(–)
(–)
(–)
(–)
(–)
(15)
St. J
oeal
l0.
0001
330
00
00
00
33(0
.000
2)(5
7)(–
)(–
)(–
)(–
)(–
)(–
)(–
)(5
7)W
est A
rm G
rand
Tra
vers
e Ba
yal
l0.
0058
130
174
452
160
065
5(0
.006
3)(2
6)(–
)(2
51)
(668
)(3
1)(–
)(–
)(7
15)
East
Arm
Gra
nd T
rave
rse
Bay
all
0.12
530
103
271,
735
5,34
017
494
28,
321
(0.0
587)
(–)
(212
)(5
4)(1
,336
)(3
,502
)(2
73)
(490
)(3
,796
)El
k R
apid
sal
l0.
0529
01,
169
00
055
249
1,77
0(0
.029
4)(–
)(8
77)
(–)
(–)
(–)
(396
)(1
12)
(969
)La
ke H
uron
all
0.00
000
00
6711
80
86(0
.000
0)(–
)(–
)(–
)(7
4)(2
5)(1
7)(–
)(8
0)bo
at0.
0000
00
067
118
086
(0.0
000)
(–)
(–)
(–)
(74)
(25)
(17)
(–)
(80)
Rog
ers
City
boat
0.00
010
90
09
(0.0
002)
(–)
(19)
(–)
(–)
(19)
35

App
endi
x 1.
–C
ontin
ued.
Tota
lYe
arLo
catio
nM
ode
catc
h/hr
Jan
Feb
Mar
Apr
May
Jun
Jul
Aug
Sep
Oct
Nov
Seas
on to
tal
1991
Roc
kpor
tal
l0.
0000
00
30
00
3(0
.000
0)(–
)(–
)(7
)(–
)(–
)(–
)(7
)Al
pena
all
0.00
000
00
20
00
2(0
.000
0)(–
)(–
)(–
)(5
)(–
)(–
)(–
)(5
)H
arris
ville
boat
0.00
020
015
00
015
(0.0
005)
(–)
(–)
(34)
(–)
(–)
(–)
(34)
Osc
oda
all
0.00
030
038
08
046
(0.0
004)
(–)
(–)
(62)
(–)
(17)
(–)
(64)
Eagl
e Ba
y to
Har
bor B
each
all
0.00
010
00
011
00
11(0
.000
2)(–
)(–
)(–
)(–
)(2
5)(–
)(–
)(2
5)St
. Mar
ys R
iver
all
0.00
030
019
113
00
204
(0.0
006)
(–)
(–)
(394
)(2
7)(–
)(–
)(3
95)
Saul
t Ste
. Mar
ie to
Nee
bish
Isl.
All
0.00
270
019
113
00
204
(0.0
053)
(–)
(–)
(394
)(2
7)(–
)(–
)(3
95)
Lake
Sup
erio
ral
l0.
0074
267
516
291
170
4339
51,
529
(0.0
034)
(207
)(5
11)
(367
)(3
5)(–
)(8
5)(2
19)
(704
)Ke
wee
naw
Bay
boat
0.03
5311
511
5(0
.031
9)(1
02)
(102
)M
arqu
ette
all
0.00
8310
316
50
170
4339
572
3(0
.003
9)(9
9)(2
12)
(–)
(35)
(–)
(85)
(219
)(3
33)
Mun
isin
gal
l0.
0216
164
236
291
00
069
1(0
.019
2)(1
82)
(454
)(3
67)
(–)
(–)
(–)
(611
)D
ead
Riv
ersh
ore
0.00
610
00
00
5151
(0.0
123)
(–)
(–)
(–)
(–)
(–)
(103
)(1
03)
1992
Kew
eena
w B
ayic
e0.
0100
235
110
345
(0.0
115)
(322
)(2
26)
(393
)M
arqu
ette
win
ter b
oat
0.03
5227
827
8(0
.028
9)(2
25)
(225
)M
unis
ing
ice
0.17
094,
755
1,10
75,
862
(0.0
658)
(1,9
06)
(964
)(2
,136
)La
ke M
ichi
gan
all
0.00
2223
123
307
137
565
3,61
313
220
5,00
1(0
.001
3)(3
4)(1
11)
(418
)(1
61)
(674
)(2
,895
)(2
6)(2
37)
(3,0
18)
boat
0.00
269
123
307
137
565
3,61
313
220
4,98
7(0
.001
6)(1
9)(1
11)
(418
)(1
61)
(674
)(2
,895
)(2
6)(2
37)
(3,0
18)
pier
0.00
0014
00
00
00
014
(0.0
000)
(28)
(–)
(–)
(–)
(–)
(–)
(–)
(–)
(28)
Elk
Rap
ids
all
0.00
650
00
024
00
024
0(0
.013
6)(–
)(–
)(–
)(–
)(5
00)
(–)
(–)
(500
)Ea
st A
rm G
rand
Tra
vers
e Ba
yal
l0.
0849
123
5697
523
3,37
30
220
4,39
2(0
.057
5)(1
11)
(88)
(139
)(6
69)
(2,8
51)
(–)
(237
)(2
,945
)W
est A
rm G
rand
Tra
vers
e Ba
yal
l0.
0037
025
140
420
130
346
(0.0
046)
(–)
(409
)(8
1)(8
4)(–
)(2
6)(–
)(4
26)
36

App
endi
x 1.
–C
ontin
ued.
Tota
lYe
arLo
catio
nM
ode
catc
h/hr
Jan
Feb
Mar
Apr
May
Jun
Jul
Aug
Sep
Oct
Nov
Seas
on to
tal
1992
St. J
oeal
l0.
0001
230
00
00
00
23(0
.000
1)(3
4)(–
)(–
)(–
)(–
)(–
)(–
)(–
)(3
4)La
ke H
uron
all
0.00
000
00
2536
00
61(0
.000
0)(–
)(–
)(–
)(5
5)(7
6)(–
)(–
)(9
4)bo
at0.
0000
00
025
360
061
(0.0
000)
(–)
(–)
(–)
(55)
(76)
(–)
(–)
(94)
Osc
oda
all
0.00
040
025
360
061
(0.0
006)
(–)
(–)
(55)
(76)
(–)
(–)
(94)
Lake
Sup
erio
ral
l0.
0055
306
279
375
120
3790
1,09
9(0
.003
3)(2
93)
(323
)(4
57)
(24)
(–)
(59)
(123
)(6
47)
Ont
onag
onbo
at0.
0060
2617
712
00
215
(0.0
101)
(53)
(356
)(2
4)(–
)(–
)(3
61)
Kew
eena
w B
ayal
l0.
0014
190
00
00
19(0
.001
5)(2
0)(–
)(–
)(–
)(–
)(–
)(2
0)M
arqu
ette
all
0.00
7024
323
40
00
090
567
(0.0
055)
(282
)(3
18)
(–)
(–)
(–)
(–)
(123
)(4
42)
Mun
isin
g Ba
yal
l0.
0113
630
198
00
3729
8(0
.011
6)(8
0)(–
)(2
86)
(–)
(–)
(59)
(303
)19
93Ke
wee
naw
Bay
ice
0.00
6335
846
404
(0.0
038)
(227
)(7
4)(2
39)
Mar
quet
tew
inte
r0.
0032
1111
(0.0
056)
(19)
(19)
Mun
isin
g Ba
yic
e0.
0805
1,34
341
931
12,
073
(0.0
580)
(1,2
27)
(339
)(3
31)
(1,3
15)
Qua
nica
ssee
to S
ebew
aing
0.00
020
06
6(0
.000
4)(–
)(–
)(1
1)(1
1)La
ke M
ichi
gan
all
0.00
100
641
975
624
9518
185
2,53
8(0
.000
5)(–
)(6
75)
(550
)(8
26)
(137
)(3
6)(1
96)
(1,2
24)
boat
0.00
110
641
975
624
9518
185
2,53
8(0
.000
5)(–
)(6
75)
(550
)(8
26)
(137
)(3
6)(1
96)
(1,2
24)
Man
iste
eal
l0.
0002
00
058
00
058
(0.0
004)
(–)
(–)
(–)
(118
)(–
)(–
)(–
)(1
18)
Wes
t Gra
nd T
rave
rse
Bay
all
0.00
850
069
127
00
071
8(0
.005
9)(–
)(–
)(4
91)
(55)
(–)
(–)
(–)
(494
)Ea
st G
rand
Tra
vers
e Ba
yal
l0.
0212
040
521
70
9518
126
861
(0.0
144)
(–)
(490
)(2
07)
(–)
(137
)(3
6)(1
75)
(578
)El
k R
apid
sal
l0.
0190
023
667
539
00
5990
1(0
.020
2)(–
)(4
64)
(137
)(8
16)
(–)
(–)
(89)
(953
)La
ke H
uron
all
0.00
000
00
53
00
8(0
.000
0)(–
)(–
)(–
)(1
0)(7
)(–
)(–
)(1
2)bo
at0.
0000
00
05
30
08
(0.0
000)
(–)
(–)
(–)
(10)
(7)
(–)
(–)
(12)
37

App
endi
x 1.
–C
ontin
ued.
Tota
lYe
arLo
catio
nM
ode
catc
h/hr
Jan
Feb
Mar
Apr
May
Jun
Jul
Aug
Sep
Oct
Nov
Seas
on to
tal
1993
Alpe
naal
l0.
0001
00
05
00
05
(0.0
002)
(–)
(–)
(–)
(10)
(–)
(–)
(–)
(10)
Har
risvi
lleal
l0.
0000
00
30
03
(0.0
000)
(–)
(–)
(7)
(–)
(–)
(7)
Lake
Sup
erio
ral
l0.
0084
135
5015
767
067
1,24
21,
718
(0.0
040)
(158
)(7
3)(1
92)
(156
)(–
)(1
33)
(754
)(8
23)
Ont
onag
onbo
at0.
0019
2040
00
060
(0.0
024)
(41)
(65)
(–)
(–)
(–)
(77)
Trav
erse
Bay
all
0.00
670
067
00
2367
(0.0
159)
(–)
(–)
(156
)(–
)(–
)(5
2)(1
56)
Mar
quet
teal
l0.
0182
6330
290
00
1,24
21,
364
(0.0
103)
(128
)(6
0)(4
3)(–
)(–
)(–
)(7
54)
(768
)M
unis
ing
Bay
all
0.00
6272
088
00
6722
7(0
.006
5)(9
3)(–
)(1
76)
(–)
(–)
(133
)(2
39)
1994
Kew
eena
w B
ayic
e0.
0042
348
537
040
8(0
.003
3)(3
01)
(107
)(1
4)(–
)(3
20)
Mar
quet
teic
e0.
0030
1010
(0.0
054)
(18)
(18)
Mun
isin
g Ba
yic
e0.
0175
282
128
410
(0.0
132)
(225
)(2
06)
(305
)La
ke M
ichi
gan
all
0.00
180
341,
674
1,16
468
169
01,
082
4,19
1(0
.000
6)(–
)(5
1)(8
22)
(958
)(1
08)
(197
)(–
)(5
31)
(1,3
89)
Gra
nd H
aven
all
0.00
000
00
00
05
5(0
.000
0)(–
)(–
)(–
)(–
)(–
)(–
)(1
1)(1
1)M
uske
gon
all
0.00
0216
00
00
00
16(0
.000
4)(3
5)(–
)(–
)(–
)(–
)(–
)(–
)(3
5)M
anis
tee
all
0.00
0118
00
00
00
18(0
.000
2)(3
7)(–
)(–
)(–
)(–
)(–
)(–
)(3
7)W
est A
rm G
rand
Tra
vers
e Ba
yal
l0.
0040
025
30
510
00
304
(0.0
048)
(–)
(350
)(–
)(1
03)
(–)
(–)
(–)
(365
)Ea
st A
rm G
rand
Tra
vers
e Ba
yal
l0.
0633
01,
298
1,07
917
169
01,
077
3,64
0(0
.023
2)(–
)(7
00)
(941
)(3
4)(1
97)
(–)
(531
)(1
,303
)El
k R
apid
sal
l0.
0049
012
385
00
00
208
(0.0
073)
(–)
(252
)(1
78)
(–)
(–)
(–)
(–)
(309
)La
ke H
uron
all
0.00
0028
00
04
00
32(0
.000
0)(4
2)(–
)(–
)(–
)(9
)(–
)(–
)(4
3)Al
pena
all
0.00
002
00
00
00
2(0
.000
0)(5
)(–
)(–
)(–
)(–
)(–
)(–
)(5
)H
arris
ville
all
0.00
000
04
00
4(0
.000
0)(–
)(–
)(9
)(–
)(–
)(9
)Ta
was
all
0.00
016
00
00
00
6(0
.000
2)(1
3)(–
)(–
)(–
)(–
)(–
)(–
)(1
3)
38

App
endi
x 1.
–C
ontin
ued.
Tota
lYe
arLo
catio
nM
ode
catc
h/hr
Jan
Feb
Mar
Apr
May
Jun
Jul
Aug
Sep
Oct
Nov
Seas
on to
tal
1994
Au G
res
all
0.00
0120
00
00
00
20(0
.000
2)(4
0)(–
)(–
)(–
)(–
)(–
)(–
)(4
0)La
ke S
uper
ior
all
0.00
6828
654
32
00
010
493
5(0
.003
6)(2
05)
(442
)(5
)(–
)(–
)(–
)(7
3)(4
93)
Blac
k R
iver
Har
bor
all
0.00
350
170
00
00
17(0
.007
2)(–
)(3
5)(–
)(–
)(–
)(–
)(–
)(3
5)M
arqu
ette
all
0.01
2917
440
82
00
010
468
8(0
.008
3)(1
54)
(408
)(5
)(–
)(–
)(–
)(7
3)(4
42)
Mun
isin
gal
l0.
0123
112
118
00
00
230
(0.0
116)
(136
)(1
66)
(–)
(–)
(–)
(–)
(215
)19
95Ke
wee
naw
Bay
ice
0.00
030
100
10(0
.000
6)(–
)(2
1)(–
)(2
1)M
unis
ing
Bay
ice
0.23
552,
371
379
02,
750
2,75
0(0
.153
6)(1
,688
)(3
28)
(–)
(1,7
20)
(1,7
20)
Lake
Mic
higa
nal
l0.
0022
167
482
2,00
129
51,
507
113
1731
4,61
3(0
.000
9)(1
90)
(598
)(1
,167
)(2
88)
(1,1
85)
(126
)(3
4)(3
9)(1
,806
)St
. Joe
seph
-Ben
ton
Har
bor
all
0.00
0816
70
00
00
00
167
(0.0
009)
(190
)(–
)(–
)(–
)(–
)(–
)(–
)(–
)(1
90)
Sout
h H
aven
all
0.00
000
00
00
08
8(0
.000
0)(–
)(–
)(–
)(–
)(–
)(–
)(1
6)(1
6)W
est A
rm G
rand
Tra
vers
e Ba
yal
l0.
0076
426
00
243
530
072
2(0
.008
2)(5
90)
(–)
(–)
(490
)(1
07)
(–)
(–)
(774
)Ea
st A
rm G
rand
Tra
vers
e Ba
yal
l0.
0515
562,
001
292
370
5317
232,
812
(0.0
245)
(94)
(1,1
67)
(288
)(5
18)
(65)
(34)
(36)
(1,3
15)
Elk
Rap
ids
all
0.02
430
00
894
00
089
4(0
.025
9)(–
)(–
)(–
)(9
46)
(–)
(–)
(–)
(946
)Pe
tosk
eyal
l0.
0004
03
07
010
(0.0
006)
(–)
(6)
(–)
(14)
(–)
(15)
Lake
Hur
onal
l0.
0000
019
024
1717
077
(0.0
000)
(–)
(39)
(–)
(32)
(29)
(27)
(–)
(64)
Rog
ers
City
all
0.00
010
013
20
15(0
.000
2)(–
)(–
)(2
6)(4
)(–
)(2
6)R
ockp
ort
all
0.00
020
00
150
15(0
.000
4)(–
)(–
)(–
)(2
9)(–
)(2
9)Al
pena
all
0.00
000
00
20
00
2(0
.000
0)(–
)(–
)(–
)(4
)(–
)(–
)(–
)(4
)H
arris
ville
all
0.00
010
09
00
09
(0.0
002)
(–)
(–)
(19)
(–)
(–)
(–)
(19)
Osc
oda
all
0.00
0219
00
017
036
(0.0
003)
(39)
(–)
(–)
(–)
(27)
(–)
(47)
Lake
Sup
erio
ral
l0.
0111
376
273
00
06
820
1,47
5(0
.004
1)(2
98)
(294
)(–
)(–
)(–
)(1
1)(3
33)
(535
)
39

App
endi
x 1.
–C
ontin
ued.
Tota
lYe
arLo
catio
nM
ode
catc
h/hr
Jan
Feb
Mar
Apr
May
Jun
Jul
Aug
Sep
Oct
Nov
Seas
on to
tal
1995
Mar
quet
teal
l0.
0284
376
189
00
00
820
1,38
5(0
.010
5)(2
98)
(239
)(–
)(–
)(–
)(–
)(3
33)
(507
)M
unis
ing
Bay
all
0.00
590
840
00
690
(0.0
112)
(–)
(171
)(–
)(–
)(–
)(1
1)(1
71)
1996
Littl
e Ba
y de
Noc
ice
0.00
020
027
27(0
.000
3)(–
)(–
)(4
1)(4
1)Ke
wee
naw
Bay
ice
0.00
1697
00
97(0
.002
3)(1
37)
(–)
(–)
(137
)M
arqu
ette
ice
0.00
092
2(0
.001
8)(4
)(4
)M
unis
ing
Bay
ice
0.03
5637
932
470
3(0
.019
7)(2
91)
(249
)(3
83)
Lake
Mic
higa
nal
l0.
0049
251
339
474
4,99
61,
243
00
3,86
011
,163
(0.0
019)
(165
)(2
19)
(427
)(3
,559
)(1
,548
)(–
)(–
)(1
,529
)(4
,202
)St
. Jos
eph-
Bent
on H
arbo
ral
l0.
0032
251
326
00
00
00
577
(0.0
016)
(165
)(2
17)
(–)
(–)
(–)
(–)
(–)
(–)
(273
)G
rand
Hav
enal
l0.
0000
00
00
00
33
(0.0
000)
(–)
(–)
(–)
(–)
(–)
(–)
(7)
(7)
Ludi
ngto
nal
l0.
0004
00
00
00
9393
(0.0
008)
(–)
(–)
(–)
(–)
(–)
(–)
(190
)(1
90)
Elk
Rap
ids
all
0.12
130
00
1,13
30
03,
764
4,89
7(0
.054
7)(–
)(–
)(–
)(1
,539
)(–
)(–
)(1
,517
)(2
,161
)Ea
st G
rand
Tra
vers
e Ba
yal
l0.
1234
043
54,
996
350
00
5,46
6(0
.082
2)(–
)(4
20)
(3,5
59)
(72)
(–)
(–)
(–)
(3,5
84)
Wes
t Gra
nd T
rave
rse
Bay
all
0.00
1313
390
750
00
127
(0.0
018)
(27)
(79)
(–)
(152
)(–
)(–
)(–
)(1
73)
Lake
Sup
erio
ral
l0.
0032
5276
132
260
021
349
9(0
.002
0)(4
1)(8
6)(2
65)
(56)
(–)
(–)
(123
)(3
12)
Mar
quet
teal
l0.
0051
2722
026
00
213
288
(0.0
026)
(30)
(38)
(–)
(56)
(–)
(–)
(123
)(1
44)
Mun
isin
gal
l0.
0098
2554
132
00
021
1(0
.012
9)(2
8)(7
7)(2
65)
(–)
(–)
(–)
(277
)La
ke H
uron
all
0.00
012
016
4881
2018
185
(0.0
001)
(4)
(–)
(25)
(61)
(159
)(4
1)(3
7)(1
81)
Har
bor B
each
all
0.00
020
00
020
020
(0.0
004)
(–)
(–)
(–)
(–)
(41)
(–)
(41)
Sagi
naw
Bay
all
0.00
000
00
00
018
18(0
.000
0)(–
)(–
)(–
)(–
)(–
)(–
)(3
7)(3
7)Au
Gre
sal
l0.
0000
00
00
00
1818
(0.0
000)
(–)
(–)
(–)
(–)
(–)
(–)
(37)
(37)
Osc
oda
all
0.00
070
036
810
011
7(0
.001
0)(–
)(–
)(5
8)(1
59)
(–)
(–)
(169
)
40
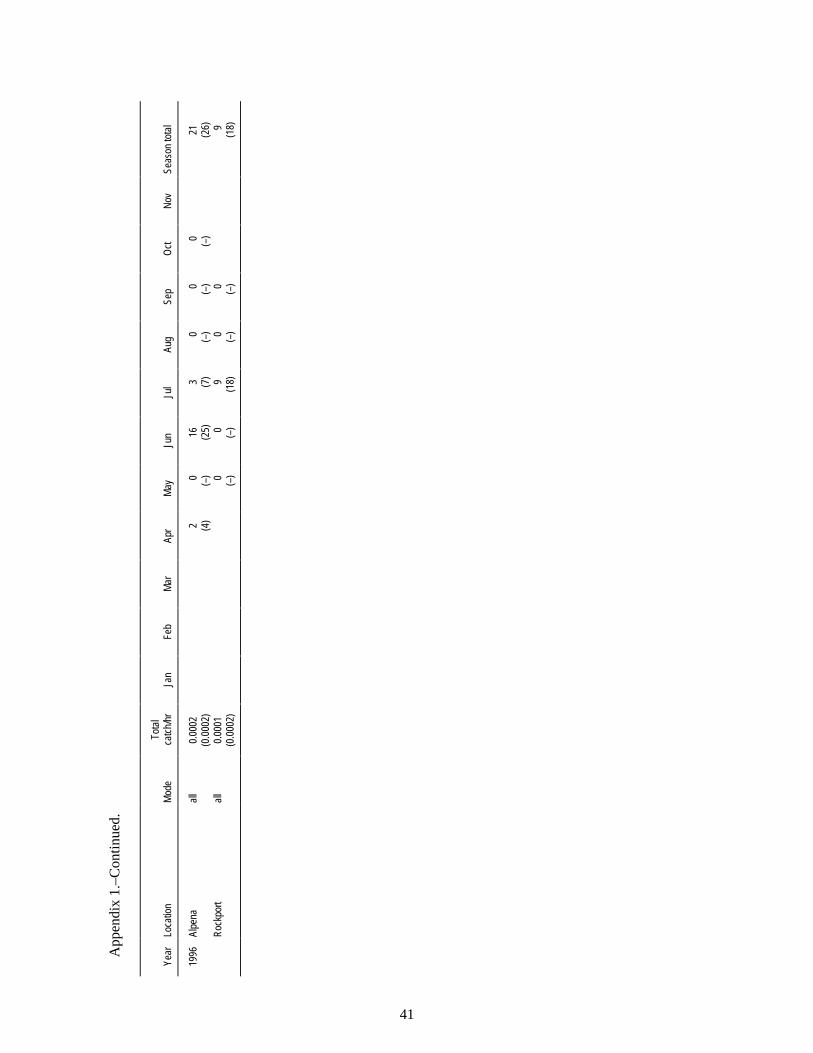
App
endi
x 1.
–C
ontin
ued.
Tota
lYe
arLo
catio
nM
ode
catc
h/hr
Jan
Feb
Mar
Apr
May
Jun
Jul
Aug
Sep
Oct
Nov
Seas
on to
tal
1996
Alpe
naal
l0.
0002
20
163
00
021
(0.0
002)
(4)
(–)
(25)
(7)
(–)
(–)
(–)
(26)
Roc
kpor
tal
l0.
0001
00
90
09
(0.0
002)
(–)
(–)
(18)
(–)
(–)
(18)
41

42
Appendix 2.–Age frequency and size-at-age (with ± Factor for 95% confidence interval) of lakewhitefish sampled from commercial trap nets in Lake Superior, 1983-96.
Total length (mm) Dressed weight (gm)Fishing area Year Age N Mean ± Factor N Mean ± Factor
Keweenaw Bay 1983 5 1 406 06 18 499 11 07 55 544 8 08 70 582 8 09 34 617 7 0
10 5 672 34 011 14 691 11 012 3 696 22 0
1984 5 1 485 06 9 495 14 07 14 534 12 08 22 579 11 09 17 574 12 0
10 44 604 10 011 50 625 11 012 25 666 10 013 9 700 26 014 8 709 18 016 1 719 0
1985 5 2 479 178 06 46 463 5 07 98 500 6 08 35 555 11 09 34 577 9 0
10 27 596 16 011 23 614 12 012 20 631 17 013 10 688 13 014 5 681 32 015 1 744 0
1986 5 1 412 06 9 516 29 07 65 522 8 11 1,365 2,1398 91 554 7 24 1,603 1,1609 67 592 8 20 1,709 1,264
10 65 621 7 18 2,073 1,72211 61 662 7 21 2,478 1,60512 36 688 9 6 2,748 7,08013 4 688 41 014 1 711 0

43
Appendix 2.–Continued.
Total length (mm) Dressed weight (gm)Fishing area Year Age N Mean ± Factor N Mean ± Factor
Keweenaw Bay 1987 4 1 406 05 10 434 8 06 45 470 11 07 86 496 6 08 103 524 7 09 33 553 12 0
10 8 590 32 011 5 630 44 012 1 630 0
1993 5 27 444 11 6 654 1,4166 91 461 4 25 857 5917 206 476 4 54 972 4538 52 514 9 11 1,269 1,7499 20 531 10 3 1,299 9,428
10 2 533 6 012 2 551 191 1 2,086
1994 4 1 446 05 39 457 6 11 847 9546 263 468 3 63 947 4317 62 487 9 15 1,126 1,1488 28 507 16 9 1,154 1,3729 6 543 34 1 1,552
10 1 515 1 1,229
1996 4 1 446 05 45 462 6 20 909 4926 132 478 6 48 1,090 4297 62 493 11 16 1,435 1,3478 40 512 13 10 1,395 1,8449 5 496 11 0
10 8 517 37 4 1,244 2,29911 2 589 19 012 3 624 106 1 2,47114 1 766 1 3,993
Marquette 1983 4 1 439 05 28 486 9 06 68 529 7 07 41 569 11 08 21 620 18 09 12 677 29 0
10 11 699 24 011 8 732 21 0

44
Appendix 2.–Continued.
Total length (mm) Dressed weight (gm)Fishing area Year Age N Mean ± Factor N Mean ± Factor
Marquette 1984 5 35 482 7 11 939 9826 152 522 4 58 1,181 4077 37 575 15 6 1,558 4,0838 23 610 21 6 2,096 4,1119 12 629 22 5 1,940 3,207
10 7 667 28 1 2,92511 9 686 33 7 2,836 1,57312 5 720 18 013 10 733 16 014 9 715 16 4 3,256 6,69215 2 762 229 2 3,925 0
1985 4 1 434 05 90 475 4 21 878 7446 93 507 5 25 1,104 7717 121 556 6 24 1,376 1,1998 34 596 14 6 2,257 5,6129 33 624 10 7 2,603 5,037
10 29 654 9 6 2,518 5,69111 17 688 9 2 2,950 102,67312 8 713 19 3 3,363 13,25013 6 712 46 3 3,370 10,35214 4 725 46 2 3,475 44,33415 4 746 42 1 3,950
1986 5 22 474 6 4 894 3,4866 129 520 4 33 1,307 8087 57 560 9 19 1,609 1,1388 59 598 7 21 2,058 1,3009 26 632 20 3 1,847 15,602
10 13 656 9 3 2,825 15,70111 19 693 10 7 3,384 4,45012 10 721 21 5 3,823 5,32113 11 744 22 3 4,578 22,79914 4 757 33 0
1987 4 3 449 29 05 45 467 5 06 130 499 5 07 109 526 6 08 34 557 13 09 21 597 20 0
10 18 629 15 011 16 645 27 012 12 669 25 0

45
Appendix 2.–Continued.
Total length (mm) Dressed weight (gm)Fishing area Year Age N Mean ± Factor N Mean ± Factor
Marquette 1987 13 7 714 21 014 9 715 19 015 2 701 64 016 1 739 0
1988 4 2 460 64 05 88 469 4 06 170 489 4 07 93 518 7 08 48 551 12 09 21 620 19 0
10 9 617 48 011 11 685 19 012 4 692 45 013 4 686 41 0
1989 4 6 454 11 05 142 472 4 37 874 5026 106 509 5 30 1,139 6937 83 527 7 25 1,362 8848 42 565 13 8 1,557 2,8979 10 556 31 1 1,990
10 5 633 48 011 6 707 23 013 3 749 55 1 4,23115 1 695 0
1990 4 6 466 15 05 39 495 10 10 1,085 1,4026 218 514 4 55 1,193 5657 78 545 7 23 1,460 1,0108 39 566 9 11 1,690 1,9129 14 620 21 7 2,143 2,147
10 8 655 48 4 2,468 4,59811 3 685 72 012 1 684 013 3 713 82 014 1 730 0
1991 5 16 491 11 1 9506 56 529 8 18 1,353 1,0137 144 551 4 54 1,550 5558 42 578 10 12 2,100 2,2109 15 591 18 8 1,848 1,566
10 11 613 23 2 1,776 48,047

46
Appendix 2.–Continued.
Total length (mm) Dressed weight (gm)Fishing area Year Age N Mean ± Factor N Mean ± Factor
Marquette 1991 11 6 662 22 2 3,005 54,35512 2 738 534 1 3,90013 1 701 014 1 725 0
1992 4 1 475 05 22 491 16 4 1,295 5,1226 54 531 9 6 1,503 4,8987 74 568 7 15 1,895 2,1618 130 589 5 48 2,091 8139 41 616 8 8 2,538 4,631
10 26 627 14 10 2,780 2,70311 22 646 18 2 3,320 133,66112 12 682 23 2 3,900 111,27013 9 723 35 5 4,156 5,18414 4 750 30 1 5,32015 1 702 016 3 785 17 0
1993 4 1 516 05 22 499 15 4 1,020 4,0006 103 524 8 27 1,103 7567 65 555 11 22 1,503 9698 46 605 11 9 1,776 2,9589 87 625 10 22 2,241 1,761
10 30 651 11 4 2,495 11,68911 14 681 25 3 3,140 18,55612 13 671 39 4 2,665 7,37513 7 703 21 1 3,10014 3 759 34 1 4,28015 4 752 29 1 4,00016 2 698 210 017 1 757 0
1994 4 1 498 05 33 480 11 9 1,010 1,3486 119 521 6 39 1,232 5857 77 561 9 26 1,626 9508 31 621 15 9 2,054 2,6299 33 646 14 6 2,470 6,088
10 44 663 9 4 2,688 15,62711 31 675 14 3 2,187 20,38012 13 691 25 1 2,94513 11 722 23 014 2 735 591 1 3,632

47
Appendix 2.–Continued.
Total length (mm) Dressed weight (gm)Fishing area Year Age N Mean ± Factor N Mean ± Factor
Marquette 1994 15 1 719 1 4,14516 2 759 292 2 5,217 4,034
1995 5 8 464 32 1 9136 17 534 24 2 1,638 56,9827 71 573 8 6 1,660 6,2818 107 611 6 13 2,158 3,6669 56 623 13 10 2,721 4,425
10 38 657 12 6 2,962 7,88811 67 672 7 27 2,859 1,41112 52 683 7 12 2,973 3,61313 35 698 13 9 3,384 4,71614 26 720 9 6 3,632 7,66615 15 737 13 7 3,826 4,27816 6 756 47 1 5,05817 4 772 70 0
1996 5 22 463 10 6 791 1,4876 95 495 6 23 1,014 7977 91 518 7 22 1,281 1,0398 53 547 9 29 1,523 5439 21 564 20 9 1,636 1,581
10 3 575 70 2 1,593 14,76011 2 655 165 1 2,99612 5 699 40 3 2,853 7,11713 1 721 1 2,79414 2 728 349 1 2,71515 1 65716 3 755 48 3 4,028 2,234
Munising 1983 4 23 463 8 05 142 488 5 06 114 526 7 07 44 584 13 08 24 645 15 09 10 706 33 0
10 7 705 52 011 3 705 103 012 4 768 40 0
1984 4 1 434 05 27 481 8 06 49 516 10 07 94 567 6 08 26 606 16 0

48
Appendix 2.–Continued.
Total length (mm) Dressed weight (gm)Fishing area Year Age N Mean ± Factor N Mean ± Factor
Munising 1984 9 37 642 9 010 24 657 16 011 6 650 41 012 4 721 20 013 3 715 54 014 11 749 24 015 6 733 49 016 6 736 21 017 1 790 018 2 760 70 0
1985 4 2 455 260 05 125 474 4 06 124 501 5 07 112 520 7 08 142 562 7 09 32 577 20 0
10 28 626 22 011 17 648 32 012 10 660 51 014 4 722 31 015 5 738 59 016 2 735 32 017 1 762 0
1986 4 3 445 14 05 39 472 7 10 815 1,0496 131 499 6 77 982 1927 99 513 9 50 993 2918 84 579 10 16 1,444 1,6529 80 609 10 27 2,055 1,181
10 16 654 28 4 2,648 8,43111 19 666 23 6 2,619 4,53912 7 711 20 1 3,19413 9 724 23 5 3,223 4,01614 6 704 31 2 3,491 62,74915 5 755 43 1 3,85216 1 719 1 3,12017 1 754 0
1987 4 2 443 51 05 15 480 19 06 130 520 5 07 120 545 7 08 40 575 16 0

49
Appendix 2.–Continued.
Total length (mm) Dressed weight (gm)Fishing area Year Age N Mean ± Factor N Mean ± Factor
Munising 1987 9 48 614 13 010 23 644 19 011 12 638 33 012 11 672 47 014 1 770 0
1988 4 4 452 13 2 763 9,7215 51 469 6 12 965 1,1596 89 490 7 18 1,033 1,0567 94 519 6 20 1,316 1,2208 65 540 9 24 1,358 7769 19 571 24 6 1,379 2,352
10 34 621 12 7 2,221 4,37111 19 639 20 6 2,375 4,02912 8 661 20 1 2,90013 5 703 27 1 3,35014 5 715 35 1 3,02515 4 714 55 2 3,175 40,55216 4 760 50 1 3,15020 1 779 0
1989 4 9 468 14 6 812 6695 124 471 4 38 881 4476 100 491 6 29 963 5877 45 516 10 21 1,267 6478 15 545 20 6 1,411 2,0049 6 549 65 2 1,374 25,585
10 2 606 76 011 3 660 44 013 1 639 0
1990 4 7 460 13 05 47 493 7 5 1,035 4,1676 230 510 3 50 1,189 6517 65 540 10 14 1,668 1,9168 42 569 12 11 1,904 2,2729 20 592 19 10 1,890 1,437
10 14 642 44 6 2,478 3,33611 5 636 84 2 2,560 39,83812 2 671 184 1 2,36713 2 735 89 1 2,882
1991 4 5 476 39 3 1,107 2,8285 13 494 13 2 1,068 31,8126 48 524 8 12 1,300 1,498

50
Appendix 2.–Continued.
Total length (mm) Dressed weight (gm)Fishing area Year Age N Mean ± Factor N Mean ± Factor
Munising 1991 7 186 541 4 43 1,457 8328 57 555 9 11 1,512 2,1949 34 583 14 10 2,016 2,374
10 29 622 22 8 2,066 3,01311 15 630 26 3 2,757 16,78512 8 642 46 2 2,555 56,82313 4 694 36 1 3,06214 1 744 1 3,36415 1 762 1 3,95816 1 800 1 4,265
1992 4 2 463 32 2 935 8265 29 485 7 14 946 5966 59 494 10 11 1,015 1,5067 35 515 11 10 1,156 1,3868 43 553 11 20 1,455 7769 64 575 9 15 1,502 1,575
10 49 586 10 17 1,808 1,33711 31 596 19 7 1,901 3,61412 20 645 28 6 2,272 4,06713 15 662 19 5 2,268 4,45614 5 705 50 015 1 671 016 2 718 159 017 2 753 292 1 3,490
1993 4 2 483 13 05 38 494 7 5 1,057 3,7766 121 526 5 25 1,375 1,1407 23 548 16 7 1,808 2,7808 27 568 15 2 1,775 79,8029 65 614 8 21 2,290 1,579
10 36 639 11 10 2,529 3,09211 26 637 26 13 2,855 1,83412 36 665 14 9 3,083 4,37413 12 681 25 4 2,949 7,67614 10 695 33 2 3,643 92,60815 2 740 388 1 5,10316 2 731 76 1 4,300
1994 3 1 446 1 7304 1 455 1 8705 17 526 8 06 60 549 7 10 1,702 2,8817 80 569 8 17 1,581 1,630

51
Appendix 2.–Continued.
Total length (mm) Dressed weight (gm)Fishing area Year Age N Mean ± Factor N Mean ± Factor
Munising 1994 8 28 601 13 9 2,411 2,8689 32 634 12 10 2,637 2,961
10 70 643 6 26 2,712 1,46811 23 655 10 7 2,856 4,33212 33 681 11 12 3,319 2,93213 19 689 17 4 3,575 12,75414 8 688 26 2 3,155 69,55615 1 701 017 1 679 1 3,070
1995 4 1 473 05 23 518 13 06 29 558 12 5 1,726 5,2657 73 584 6 17 2,004 1,9378 85 615 6 21 2,363 1,9349 32 624 11 7 2,516 4,756
10 39 655 10 9 2,802 4,18511 47 660 10 18 3,010 1,96812 27 684 11 9 3,180 3,68513 13 689 21 6 3,243 4,05914 20 707 14 11 3,806 2,45315 9 714 16 4 3,887 7,99216 5 720 29 2 3,945 61,50720 1 725 1 4,272
1996 5 20 482 13 7 999 1,3696 58 492 9 20 1,060 7197 86 499 7 32 1,064 5138 72 508 10 21 1,091 8069 31 543 19 11 1,351 1,322
10 22 535 25 5 1,455 3,85511 2 500 464 1 1,20512 6 585 92 1 2,69413 2 679 38 1 4,09715 1 748 1 3,826
Big Bay 1983 4 5 488 46 05 27 503 10 06 60 535 7 07 37 562 10 08 18 607 17 0
10 3 720 138 0
1984 5 4 486 15 06 30 507 12 0

52
Appendix 2.–Continued.
Total length (mm) Dressed weight (gm)Fishing area Year Age N Mean ± Factor N Mean ± Factor
Big Bay 1984 7 58 532 6 08 60 560 7 09 33 595 12 0
10 51 615 12 011 44 656 11 012 18 673 16 013 1 724 014 6 730 38 0
1985 5 1 475 06 20 513 15 07 87 529 5 08 84 559 7 09 106 593 6 0
10 106 630 8 011 99 645 8 012 93 667 8 013 30 685 14 014 14 713 15 015 4 706 56 016 1 739 017 1 643 0
1986 5 7 495 21 1 9556 48 502 6 12 1,035 1,1917 87 529 7 18 1,331 1,3428 118 570 6 28 1,497 1,0659 98 608 6 18 1,933 2,090
10 59 629 8 9 2,184 4,20711 66 669 7 9 2,637 5,41412 38 687 9 4 3,079 16,49713 17 706 18 1 3,25014 9 725 20 015 2 764 337 0
1987 5 10 495 23 06 126 516 5 07 87 520 7 08 37 542 10 09 38 605 14 0
10 22 616 30 011 7 635 40 012 14 659 27 013 3 671 116 014 3 682 71 0

53
Appendix 2.–Continued.
Total length (mm) Dressed weight (gm)Fishing area Year Age N Mean ± Factor N Mean ± Factor
Big Bay 1988 4 1 452 05 46 466 5 15 801 6626 123 488 5 24 916 8077 138 516 6 32 1,220 8218 45 531 13 16 1,147 8609 12 584 28 7 1,610 1,432
10 3 605 24 011 6 654 30 4 2,478 3,30112 7 700 26 2 3,368 67,675
1989 4 7 448 14 2 760 15,2915 108 470 5 31 850 5026 126 501 5 32 1,024 6457 92 525 6 21 1,279 1,1018 36 540 12 9 1,406 2,0079 14 569 25 5 2,101 4,011
10 8 617 30 011 6 663 26 1 2,10312 5 686 45 013 1 720 015 1 672 1 2,797
1990 4 6 464 45 2 780 14,1125 60 484 9 21 886 5696 151 506 5 46 1,050 4837 39 536 13 8 1,349 2,4088 22 540 16 7 1,194 1,7699 7 528 38 5 1,307 1,206
10 1 587 011 1 628 014 1 746 0
1991 4 3 473 63 2 1,021 9,1745 31 483 9 13 964 7266 84 511 7 30 1,091 5617 119 538 6 35 1,286 7068 28 558 16 13 1,686 1,1889 13 585 14 1 1,691
10 7 604 17 2 1,995 40,14111 7 639 41 012 2 707 152 1 3,67313 2 687 597 1 4,24114 1 726 1 3,37815 1 726 1 4,05916 1 715 0

54
Appendix 2.–Continued.
Total length (mm) Dressed weight (gm)Fishing area Year Age N Mean ± Factor N Mean ± Factor
Big Bay 1992 5 3 456 78 1 1,0966 30 506 13 11 1,024 9547 34 517 13 21 1,225 4758 58 539 10 27 1,322 5809 61 543 9 21 1,321 864
10 46 552 10 11 1,430 1,80911 37 558 12 6 1,457 3,82412 24 573 15 2 1,738 73,37513 5 570 45 014 2 546 0 015 1 668 022 1 762 0
1993 4 11 464 20 7 810 6175 88 509 8 28 1,177 6946 111 532 7 33 1,257 7087 47 562 12 20 1,851 1,0738 16 610 27 4 2,008 6,4669 18 632 12 4 2,499 8,628
10 4 628 33 3 2,193 3,88511 2 670 102 1 2,71212 1 688 013 2 711 254 1 4,30216 1 770 0
1994 4 2 504 368 1 1,2325 80 464 6 8 913 2,4516 168 517 6 58 1,374 5077 86 539 10 35 1,557 6658 35 533 19 13 1,567 1,3049 10 579 32 4 1,795 4,141
10 8 621 26 4 2,225 4,12811 6 645 29 1 2,43212 3 618 124 015 1 760 0
1996 4 1 438 1 6575 30 480 10 11 945 8866 79 503 8 35 1,176 4747 48 530 9 27 1,369 4988 31 544 12 15 1,491 9009 8 574 17 7 1,798 708
10 1 630 011 1 578 1 1,857

55
Appendix 2.–Continued.
Total length (mm) Dressed weight (gm)Fishing area Year Age N Mean ± Factor N Mean ± Factor
Grand Marais 1983 4 6 475 32 05 37 498 9 06 29 522 10 07 8 608 22 08 3 638 63 09 4 706 32 0
10 1 683 012 1 790 0
1984 4 22 453 4 05 57 479 6 06 46 507 9 07 44 552 11 08 16 574 22 09 3 658 52 0
10 1 622 012 1 732 013 3 729 54 0
Upper Entry 1992 5 7 443 17 4 682 1,0986 213 464 3 91 885 2167 86 473 5 48 982 2618 47 486 9 27 1,035 3749 30 510 12 17 1,185 572
10 14 543 34 8 1,548 1,27311 7 541 63 2 2,600 52,51912 4 539 56 2 1,730 22,05316 1 690 1 2,810
1993 4 1 447 05 48 451 6 1 7546 189 468 3 49 903 4457 133 482 4 34 969 5918 18 498 9 11 1,183 6739 11 532 24 5 1,557 2,411
1994 5 5 455 52 1 8406 247 461 2 51 911 5097 107 468 5 36 903 4398 36 487 9 9 1,047 1,4829 6 485 30 2 868 15,592
1995 5 4 469 100 06 180 454 3 48 872 426

56
Appendix 2.–Continued.
Total length (mm) Dressed weight (gm)Fishing area Year Age N Mean ± Factor N Mean ± Factor
Upper Entry 1995 7 175 479 5 43 942 5188 29 495 16 9 967 1,1809 11 541 26 0
10 2 534 273 011 1 489 013 1 586 0
Ontonagon 1995 5 31 449 6 8 915 1,3886 178 466 3 33 948 7207 125 494 5 28 1,137 8428 30 519 16 6 1,339 3,0969 9 513 27 2 1,541 36,779
10 8 618 52 6 2,320 1,79511 7 591 76 2 1,900 38,26312 5 716 33 3 3,751 9,51813 9 738 25 5 4,116 5,15714 7 706 47 6 3,498 1,98216 1 605 0

57
Appendix 3.–Age frequency and size-at-age (with ± Factor for 95% confidence interval) of lakewhitefish sampled from sport fisheries in Lake Superior, and Grand Traverse Bay, Lake Michigan.
Total length (mm) Dressed weight (gm)Fishing area Year Age N Mean ± Factor N Mean ± Factor
Keweenaw Bay 1984 3 1 378 1 4544 1 401 1 6355 1 437 1 6806 1 465 1 9077 1 521 1 1,3159 1 612 1 2,041
11 1 729 1 3,538
1987 1 1 241 1 1812 9 309 29 9 363 1103 7 377 46 7 480 1594 14 446 7 14 784 515 15 470 17 15 904 876 9 522 15 9 1,280 1077 10 588 24 10 1,737 2378 10 608 17 10 2,041 1659 1 622 1 2,268
10 3 661 49 3 2,479 13111 2 686 165 2 2,858 4,03412 3 725 69 3 3,296 72513 2 779 172 2 4,309 2,884
1988 3 1 376 1 4084 4 453 21 4 669 246
1989 3 6 368 53 6 378 2214 12 428 25 12 658 1285 6 477 31 6 915 1796 7 499 25 7 1,095 1847 2 524 159 2 1,202 2,020
1991 3 1 338 1 3184 6 480 64 6 1,073 4055 7 513 46 7 1,309 3286 2 516 388 2 1,339 3,1708 1 589 1 1,996
11 1 693 1 3,720
1992 4 16 393 26 16 1,097 1,0765 11 467 29 11 990 2176 5 509 34 5 1,297 2177 2 564 191 2 1,837 1,436
12 1 701 1 3,402

58
Appendix 3.–Continued.
Total length (mm) Dressed weight (gm)Fishing area Year Age N Mean ± Factor N Mean ± Factor
Keweenaw Bay 1993 4 5 410 53 5 581 2595 14 481 16 14 1,047 1226 2 554 64 2 1,679 5787 1 627 1 2,4049 1 663 1 2,495
Marquette 1988 3 7 331 14 7 279 664 26 387 11 26 440 435 4 476 38 4 828 2916 4 444 43 4 624 253
1990 2 7 255 4 7 97 163 2 286 241 2 159 2864 8 375 33 8 408 1115 6 422 51 6 597 2386 7 490 19 7 991 1627 4 500 40 4 1,077 355
1991 1 1 330 1 2722 8 252 9 8 108 193 33 289 7 33 177 144 26 354 16 26 351 475 6 378 80 6 491 3036 3 483 120 3 953 7397 2 502 438 2 1,111 2,592
1992 1 1 208 1 912 2 290 133 2 2273 11 273 16 11 136 304 41 339 8 41 288 325 21 393 22 21 458 846 3 451 177 3 726 1,075
1993 2 1 244 1 1363 17 300 9 17 213 164 7 327 24 7 259 685 4 388 23 4 443 376 1 358 1 3639 1 610 1 2,177
1994 2 1 229 1 1363 8 271 8 8 164 194 11 335 25 11 281 565 8 384 31 8 471 120

59
Appendix 3.–Continued.
Total length (mm) Dressed weight (gm)Fishing area Year Age N Mean ± Factor N Mean ± Factor
Marquette 1994 6 4 376 31 4 476 1387 2 490 546 2 1,089 3,4629 1 686 1 3,084
10 1 665 1 3,856
1995 3 6 309 19 6 250 264 24 342 11 24 321 315 11 385 22 11 458 806 2 414 165 2 522 8647 1 572 1 1,8149 1 589 1 1,769
1996 3 3 295 23 3 197 1314 7 341 25 7 311 825 10 386 26 10 454 1046 1 404 1 4547 1 500 1 1,043
16 1 780 1 4,309
Munising 1985 2 8 233 20 7 104 2143 41 253 5 36 125 754 25 296 9 24 210 655 23 329 12 23 278 396 10 334 14 10 268 427 23 372 12 23 404 478 8 369 16 7 350 3169 6 436 23 6 574 119
11 3 447 52 3 741 172
1987 3 13 283 23 13 175 614 16 293 21 16 207 575 20 318 16 20 245 636 17 355 19 16 357 1317 11 403 27 11 536 1418 8 393 28 8 499 1549 5 403 29 5 535 108
10 4 450 133 4 1,032 45411 2 434 0 2 635 012 1 422 1 49913 1 511 1 1,13414 2 510 400 2 1,089 2,878
1988 3 1 345 1 3634 15 378 17 14 434 1605 7 390 27 7 473 130

60
Appendix 3.–Continued.
Total length (mm) Dressed weight (gm)Fishing area Year Age N Mean ± Factor N Mean ± Factor
Munising 1988 6 3 441 200 3 801 1,1948 1 485 1 907
1991 2 2 210 210 2 45 03 5 259 13 5 118 314 18 283 27 18 187 815 25 327 13 25 259 356 21 359 22 21 378 997 18 383 22 18 469 1078 1 452 0 1 862 09 4 440 16 4 692 91
10 2 484 1080 2 1,111 7,20411 5 461 63 5 771 33612 3 489 160 3 983 958
1992 1 1 201 1 453 1 267 1 1364 8 268 14 8 136 355 5 307 43 5 200 956 19 347 21 19 327 777 10 379 32 10 458 1338 6 405 73 5 662 9119 3 366 129 3 423 508
10 3 432 101 3 650 56811 1 472 1 86212 4 446 69 4 726 295
1993 2 4 209 36 4 68 423 9 231 14 9 81 234 10 271 37 9 156 1135 7 291 17 7 175 386 6 318 43 6 250 1037 6 353 31 6 333 728 3 353 110 3 363 4069 3 369 92 3 424 131
10 3 438 37 3 680 11311 3 498 267 3 1,074 1,78312 1 406 1 49913 1 508 1 1,13414 2 522 407 2 1,225 1,72815 1 452 1 771
1994 3 6 313 32 6 257 784 4 292 50 4 193 1375 4 325 33 4 273 84

61
Appendix 3.–Continued.
Total length (mm) Dressed weight (gm)Fishing area Year Age N Mean ± Factor N Mean ± Factor
Munising 1994 6 2 374 324 2 477 1,4428 6 393 43 6 416 979 6 413 35 6 582 216
10 1 358 1 36311 1 401 1 49912 2 488 515 2 907 4,61213 1 503 1 90714 1 541 1 1,270
1995 3 2 246 146 2 182 5784 30 274 11 30 205 285 32 300 7 32 254 176 9 326 28 9 318 807 6 360 40 6 431 1238 4 405 108 4 601 5259 7 411 39 7 641 170
10 3 443 9 3 680 012 1 488 1 1,134
1996 2 1 218 1 913 5 263 22 5 163 1024 8 280 20 8 221 325 17 316 24 17 291 766 15 375 32 15 472 1507 6 419 113 6 522 2708 1 330 1 3189 3 398 75 3 635 406
10 2 471 178 2 748 86411 4 422 60 4 624 34515 1 470 1 771
Grand Traverse Bay 1986 4 4 411 18 4 612 935 5 469 42 5 980 3516 6 492 42 6 1,142 3957 7 522 32 7 1,361 2638 6 542 24 6 1,527 2239 6 592 36 6 1,897 433
10 3 633 4 3 2,540 739
1987 3 5 305 54 5 263 2014 14 352 22 14 392 835 28 440 25 28 778 1126 29 489 11 29 1,120 1007 10 522 15 10 1,347 1308 14 576 25 14 1,827 249

62
Appendix 3.–Continued.
Total length (mm) Dressed weight (gm)Fishing area Year Age N Mean ± Factor N Mean ± Factor
Grand Traverse Bay 1987 9 8 580 24 8 1,877 31010 1 665 1 2,72211 1 645 1 2,495
1988 3 1 297 1 2274 10 411 24 10 581 1225 13 442 33 13 778 2156 12 501 33 12 1,157 2367 2 504 407 2 1,157 3,170
1989 4 10 393 23 10 504 765 25 441 18 25 775 1076 60 459 10 60 876 737 51 484 10 51 1,039 848 12 535 31 12 1,440 3009 3 532 23 3 1,316 299
10 3 583 219 3 1,996 1,994
1990 4 4 415 48 4 465 3085 3 417 49 3 438 2346 24 472 9 24 722 707 20 486 8 20 887 738 11 510 16 11 1,072 1619 4 540 42 4 1,338 292
11 2 573 178 2 1,543 57813 1 602 1 1,769
1991 1 2 347 756 2 454 2,8782 6 398 78 6 491 2813 8 459 21 8 737 1774 24 491 7 24 935 755 27 526 10 27 1181 1166 19 568 13 19 1,545 1957 1 650 1 2,041
1992 3 1 310 0 1 136 05 7 492 44 7 985 3766 25 496 13 25 1,000 1197 34 520 9 34 1,138 838 14 535 10 14 1,299 1269 6 599 70 6 1,754 286
10 1 643 1 2,72211 1 587 1 2,359

63
Appendix 3.–Continued.
Total length (mm) Dressed weight (gm)Fishing area Year Age N Mean ± Factor N Mean ± Factor
Grand Traverse Bay 1993 3 1 419 1 6804 2 442 191 2 726 1,1505 2 483 95 2 839 2926 10 535 51 10 1,220 1947 21 545 10 21 1,471 1148 7 566 38 7 1,555 2529 2 583 432 2 1,747 4,326
1994 3 8 391 23 8 442 884 22 462 15 22 796 1285 4 507 2 4 987 696 32 541 6 32 1,368 797 6 561 25 6 1,376 2588 8 599 10 8 1,985 83
1995 4 6 399 17 6 446 705 6 424 16 6 560 1266 12 476 11 12 877 957 4 521 17 4 1,112 2098 18 546 11 18 1,273 1109 3 629 202 3 2,147 2,158
1996 4 4 388 22 4 431 1255 12 456 16 12 688 866 20 487 11 20 860 877 22 552 12 22 1,342 1128 15 580 12 15 1,554 1309 1 597 1 1,814