whitefish lake final 2004-2005 - wisconsin department of...
TRANSCRIPT

1
Whitefish (Bardon) Lake - Fishery Survey Report Douglas County, Wisconsin, 2004-2005
WBIC Code: 2694000
Paul J Riordan and Cordell H. Manz
Fisheries Technician Wisconsin Department of Natural Resources
Northern Region – Brule April, 2008

2
Executive Summary
The fisheries of Whitefish (Bardon) Lake (Douglas County) were surveyed during
2004-2005. Results indicated adult walleye abundance (≥ 15.0 in and all sexable fish)
was 1.1 fish/acre, lower than previous surveys on Whitefish Lake and the average adult
fish/acre for Bayfield and Douglas County lakes, but similar to other oligotrophic lakes in
Bayfield County. Recruitment of walleye was sustained entirely by natural reproduction
since stocking was discontinued after 1993. Northern pike were present in low
abundance. Largemouth and smallmouth bass densities were 0.16 and 0.18 fish/acre
respectively and were considered low. Trout and cisco were not sampled in this survey.
Management recommendations include: 1) Continue fall shocking to access year class
strength of walleye along with a comprehensive evaluation of adult walleye after a period
of 6 years, 2) Discontinue population estimates of largemouth and smallmouth bass due
to sampling difficulties and monitor changes in relative abundance from the first and
second electroshocking runs, 3) Maintain existing regulation on northern pike, 4) Further
evaluate the adult panfish community with a panfish netting survey and the panfish
community as a whole with a creel survey, along with considering a 10 panfish/day
regulation change if overharvest is occurring, 5) Continue every third year stocking of
brown trout and include questions regarding anglers attitude towards a continued trout
stocking program in the creel survey, 6) Initiate a sampling protocol at the same
frequency interval as walleye to provide important information on the presence and
potential relative abundance of cisco, and 7) Work with local residents, associations and
groups to incorporate this information into the lake management plan that addresses
fisheries management goals, habitat protection and rehabilitation as well as education of
users and riparian residents.

3
Introduction
Whitefish Lake, also known as Bardon Lake, is an 832-acre seepage lake with
very clear, soft water and excellent water clarity. It has been designated as an
“Outstanding Resource Water” under Natural Resources Administrative Code 102 and is
the deepest inland lake in Douglas County, with a maximum depth of 102 feet and a
mean depth of 30 feet. The mean summer secchi disk depth (TSI) value on Whitefish
Lake between 1995 and 2005 was 30.1 (SD = 2.71, n = 83). Average summer
chlorophyll-a and total phosphorus TSI values were 36.2 (SD = 3.27, n = 20) and 42.7
(SD = 1.21, n = 22) respectively, over the same time period. [Trophic state index (TSI)
values were calculated for water clarity (secchi disk measurements), chlorophyll-a, and
total phosphorus values on Whitefish Lake from 1995 to 2005. TSI is an index for
evaluating the trophic state or nutrient condition of lakes and represents a continuum
ranging from very clear, nutrient poor water (low TSI’s) to extremely productive, nutrient
rich water (high TSI’s).] Overall, data from Whitefish Lake indicates that it is
oligotrophic, with low primary productivity, when considering secchi disc and
chlorophyll-a values and it is slightly mesotrophic when considering total phosphorus
TSI values.
As a result of limited nutrient availability characteristic of oligotrophic lakes,
density of aquatic vegetation is low to moderate in Whitefish Lake. Aquatic plant
diversity in Whitefish Lake is also relatively average for northern Wisconsin Lakes
(Toshner 2004). A “Sensitive Area Designation Survey” of Whitefish Lake in 2003
identified a total of twenty different aquatic plant species (Table 1) occurring within
sensitive areas, and no exotic species (Toshner 2004).
Whitefish Lake has no tributaries or natural surface water inlets or outlets, with
water levels being maintained as a result of the water table. Topographically, the lake
consists of two deep basins connected by a narrows section. Littoral substrates are over
ninety-five percent sand (Weiher 1967), but some soft detrital sediments overlay sand in
areas of greater depths outward of two to five feet. The shoreline of Whitefish Lake is
highly developed, with over 85 cottages and permanent homes. The upland shoreline
area is dominated by oak (Quercus sp.), aspen (Populus sp.), jack pine (Pinus banksiana)

4
and red pine (P. resinosa). Adequate public access is limited to a boat landing with
parking located at the southwest end of the lake off of Whitefish Lake Road.
Whitefish Lake has a history of fish stocking dating back to 1934 (Table 2). Prior
to 1949, only walleye (Sander vitreus) and largemouth bass (Micropterous salmoides)
were stocked. From 1949 to 1952, smallmouth bass (M. dolomieui) and northern pike
(Esox lucius) were stocked in addition to walleye and largemouth bass. In 1958,
Kamloops strain rainbow trout (Oncorhynchus mykiss) were introduced, and continuing
through 1977 the lake was managed for salmonids in addition to warm water fish.
During that time period it was stocked mostly with rainbow trout and brown trout (Salmo
trutta), but also with brook trout (Salvelinus fontinalis) from 1962 - 1965, lake trout (S.
namaycush) in 1964, and coho salmon (O. kisutch) in 1970-71. The main factors
contributing to the initiation of this two-story management plan were Whitefish Lake’s
cold water temperatures, the large numbers of cisco (Coregonus artedii) present, and the
abundant volume of deep water (Schram 1979). Although minor numbers of trout have
been sampled during fishery surveys in 1959, 1961, 1967, and 1977, no evidence of
natural reproduction has been found to occur to date for any salmonids stocked in
Whitefish Lake.
After a variety of fishery surveys were performed in 1977, recommendations were
to stock walleye in order to diversify the fishery and provide additional predation on
bluegill (Schram 1979). Since 1978, Whitefish Lake has continued to be managed as a
two-story fishery for both warm and coldwater fish species, with management primarily
directed towards walleye, largemouth and smallmouth bass, northern pike, brown trout
and rainbow trout, and panfish species; including, bluegill (Lepomis macrochirus), black
crappie (Pomoxis nigromaculatus), and yellow perch (Perca flavescens). Trout stocking
was to be done every third year under this management plan (Kampa 1988). Almost
397,000 walleye fingerlings were stocked from 1978 – 1993; however, walleye stocking
was discontinued after 1993 because natural reproduction was sufficiently maintaining
the fishery (it was also thought they were drastically reducing abundance of panfish
populations). Although it was recommended by Kampa (1988) that yearling rainbow
trout be stocked every third year because there was evidence of some year-to-year carry-
over, stocking of rainbows was discontinued after 1991 in hopes that brown trout would

5
survive better because of less stringent habitat requirements (Sand 1991). Brown trout
have continued to be stocked approximately every third year thereafter.
Other fish species documented as present from past surveys of Whitefish Lake
include: pumpkinseed (L. gibbosus) and green sunfish (L. cyanellus); warmouth (L.
gulosus) and rock bass (Ambloplites rupestris); yellow (Ictalurus natalis) and black
bullhead (I. melas); white sucker (Catostomus commersoni) and shorthead redhorse
(Moxostoma macrolepidotum); banded killifish (Fundulus diaphanus); johnny
(Etheostoma nigrum) and Iowa darter (E. exile); creek chub (Semotilus atromaculatus);
bluntnose (Pimephales notatus) and fathead minnow (P. promelas); and golden
(Notemigonus crysoleucas), common (Notropis cornutus), spottail (N. hudsonius), mimic
(N. volucellus), and blacknose shiner (N. heterolepis). Through personnel
communication with lake residents it has also been suspected that channel catfish (I.
punctatus) have been present in the past.
Fishing regulations for walleye have changed over time in Whitefish Lake. Until
1989 these changes had been in concurrence with statewide bag and length limit changes.
This included a minimum length of 13 in from 1966 through 1974 and a change back to
no minimum length for walleye from 1974 through 1989. In 1990, the length limit for
walleye was again changed to the present statewide minimum length of 15 in. Recent
management has included walleye bag limits that have had to be adjusted annually (to
two or three fish daily bag limit) since tribal harvest began on Whitefish Lake in 1987.
Starting in 2003, trout regulations on Whitefish Lake have been category 2, with a
bag limit of five in total and a 7 in minimum length. Prior to 2003, regulations were
category 1, with a bag limit of ten trout in all, and minimum length of 7 in. Northern
pike, bass, and panfish regulations on Whitefish Lake have followed that of statewide bag
and length limits in place at the time.
The most recent fishery surveys of Whitefish Lake prior to 2005 were in 2004,
when four miles of shoreline was sampled by electrofishing gear in September and mini-
fyke netting (eight net lifts) was conducted in August as part of the WDNR’s statewide
lake baseline monitoring program to investigate the health of lake ecosystems by
sampling their fish communities. Recent management has also included fall
electrofishing surveys nearly every year since 1991 to assess year-class strength of

6
young-of-the-year (YOY) and yearling walleye. The last comprehensive fisheries
surveys conducted by Wisconsin DNR personnel took place in 1988 and 1991, with adult
walleye population estimates performed those years using methods as outlined by Staggs
(Intradepartmental Memo, April 12, 1989) for Treaty Assessment work. Creel surveys to
assess fishing pressure and harvest were also performed in those years. In addition, the
Great Lakes Indian Fish and Wildlife Commission (GLIFWC) performed a walleye
population estimate in 2001. Data collected from baseline surveys performed in 2004
showed more comprehensive fisheries data was again needed from Whitefish Lake to
provide more reliable information on existing fish populations which would allow for
better future management decisions (Manz 2004).
The objective of the 2005 survey of Whitefish Lake was to determine the present
status of walleye, largemouth and smallmouth bass, and northern pike populations;
specifically, to determine population densities, growth, and size structure of walleye and
bass in order to update safe harvest levels and evaluate current harvest regulation
strategies. In addition, we hoped to determine some population parameters for northern
pike and panfish in Whitefish Lake.
Methods
Whitefish Lake was sampled during 2005 following the Wisconsin Department of
Natural Resources treaty assessment protocol (Hennessy 2002). Comprehensive
sampling included: spring fyke netting (4 x 6 ft frames, 0.5 in bar mesh) and
electroshocking (A.C. boomshocker) to estimate walleye and bass abundance, and fall
electroshocking to estimate year class strength of YOY walleye. Fall electroshocking
surveys followed protocols given by Stewart (2001) for Wisconsin’s statewide baseline
monitoring program. Mini-fyke netting in 2004 was conducted following the Wisconsin
Department of Natural Resources baseline lakes field sampling protocol (Simonson
2004).
Walleye were captured for marking in the spring immediately after ice out on
Whitefish Lake using fyke nets. Each fish was measured to the nearest one-tenth inch
total length (TL), sexed, fin clipped, and observed for other marks. For aging purposes,
the second or third dorsal spine was removed from ten walleye per inch group and sex.

7
Adult (mature) walleyes were defined as any fish for which sex could be determined, or
any walleye fifteen inches or greater. Walleyes of unknown sex less than fifteen inches
in length were classified as juveniles (immature) and were marked with a secondary fin
clip, rather than the primary fin clip given to adults. Marking effort for walleyes was
based on a goal of marking 10% of the anticipated spawning population estimate.
To estimate walleye abundance, walleyes were recaptured during two
electrofishing runs. The first run (to estimate adult abundance) occurred one day after
fyke netting was complete, and a second recapture run (required to estimate total walleye
abundance) took place on May 16, 2005, twenty-six days after the first. Because of the
short interval between marking and recapture events, the entire shoreline was sampled to
ensure equal vulnerability for capturing both marked and unmarked walleyes. All
walleyes collected during recapture runs were measured and examined for marks.
Unmarked walleyes were given the appropriate mark so that a total population estimate
could be calculated upon completion of the second electrofishing run. Population
estimates (for walleye ≥7.0 in) were calculated with the Chapman version of the Petersen
formula (Ricker 1975). Abundance and variance were estimated by individual length
groups of walleye (7.0 -11.9, 12.0 -14.9, 15.0 -19.9, and ≥20.0 in.) and then summed to
estimate total adult walleye abundance and variance. Variance (of a proportion) for the
abundance estimates for these length groups was calculated using the formula:
var (p · pe) = p² · var (pe) + pe² · var (p) – var (p) · var (pe), where
var = variance,
p = the proportion of fish sampled in a specific length group,
pe = the population estimate for fish > 7.0 in.
Age and growth of walleye was determined from dorsal spine cross sections viewed
microscopically at 100 X (Margenau 1982). Growth rates of male and female walleye
were compared separately to Douglas County averages obtained from the Spooner, WI
Treaty Assessment Unit.
Largemouth and smallmouth bass were collected, measured, and marked during
fyke netting and subsequent electrofishing runs for walleye. Scales were also taken for
age interpretation. Bass ≥12.0 in were given the same primary (adult) fin-clip given to
walleye for that lake. Bass 8.0 -11.9 in were given the secondary (juvenile) fin-clip for

8
the lake. Bass were also marked on a third electrofishing run on May 24th and recaptured
on a final electrofishing run conducted on June 1, 2005, following the second recapture
run for walleye. Bass populations were estimated after both the third and fourth runs
using the Chapman version of the Petersen estimate (Ricker 1975). Estimates were made
for each species in three length classes: 8.0- 13.9, 14.0- 17.9, and ≥18.0 in. The recapture
run yielding the lowest coefficient of variation was the population estimate reported. Age
and growth for bass and other fish species (northern pike and panfish) were determined
by viewing acetate scale impressions under a 30 X microfilm projector. Growth rates
were compared to northern region averages obtained from the WDNR statewide fisheries
database. Length distributions were summarized using proportional (PSD) and relative
stock (RSD) densities (Anderson and Gutreuter 1983). The PSD and RSD value for a
species is the number of fish of a specified length and longer divided by the number of
fish of stock length or longer, the result multiplied by 100 (Table 3).
Results
Total survey effort in 2005 included fifty-eight fyke net lifts targeting spawning
gamefish (April 13 - 19), four spring electrofishing surveys of the entire shoreline (April
20, May 16 and 24, and June 1) totaling 10.9 hrs, and one fall electrofishing survey
(October 27) totaling 2.7 hrs. Total survey effort in 2004 included 8 net lifts targeting
juvenile panfish and non-game fish (August 16-17) and one fall electrofishing survey
(September 14) totaling 1.59 hrs. Over 2,400 fish representing thirteen different species
were captured, using various gear types for all sampling events. However, if sampling
from 2004 is included a total of 4,581 fish have been sampled in 2004-2005 combined,
representing sixteen different fish species (Table 4). Non-game fish species accounted
for a majority of the diversity with nine different species sampled in 2004-2005, whereas
gamefish and panfish species were most abundant overall, making up approximately 92%
of the total number of fish sampled.
Adult gamefish sampled in order of abundance in 2005 were walleye, smallmouth
bass, largemouth bass, and northern pike. Yellow perch were the most frequently
collected panfish, followed by bluegills and rock bass. However, if mini-fyke netting
data from 2004 is included, bluegills appear to be more abundant than yellow perch

9
because of the high numbers of YOY and juvenile bluegills sampled while mini-fyke
netting. White sucker, bluntnose minnow, spottail shiner, and mimic shiners were the
most common non-game fish species found in 2004-2005, and along with bluegill and
yellow perch (and possibly cisco) may comprise the bulk of the forage base in Whitefish
Lake. Fish species found in past investigations, but not found in 2004-2005, include:
black crappie, pumpkinseed, green sunfish, warmouth, black bullhead, shorthead
redhorse, banded killifish, fathead minnow, and golden and blacknose shiners. No cisco
or trout were sampled in 2004-2005.
Walleye. Walleye were the most abundant gamefish sampled in 2005 with a
combined total of 1,224 collected for all gear types and sampling events. A total of 378
adult walleye, and 407 walleye in all ≥ 7.0 in were marked while fyke netting after ice-
out. Adult walleye abundance (≥ 15.0 in and all sexable fish) was 880 (95% C.I. =
637<N<1107; CV = 0.14) or 1.1 fish/acre. Total walleye abundance ≥ 7.0 in was 3,245
(95% C.I. = 1,056<N<5,434; CV = 0.34), or 3.9 fish/acre.
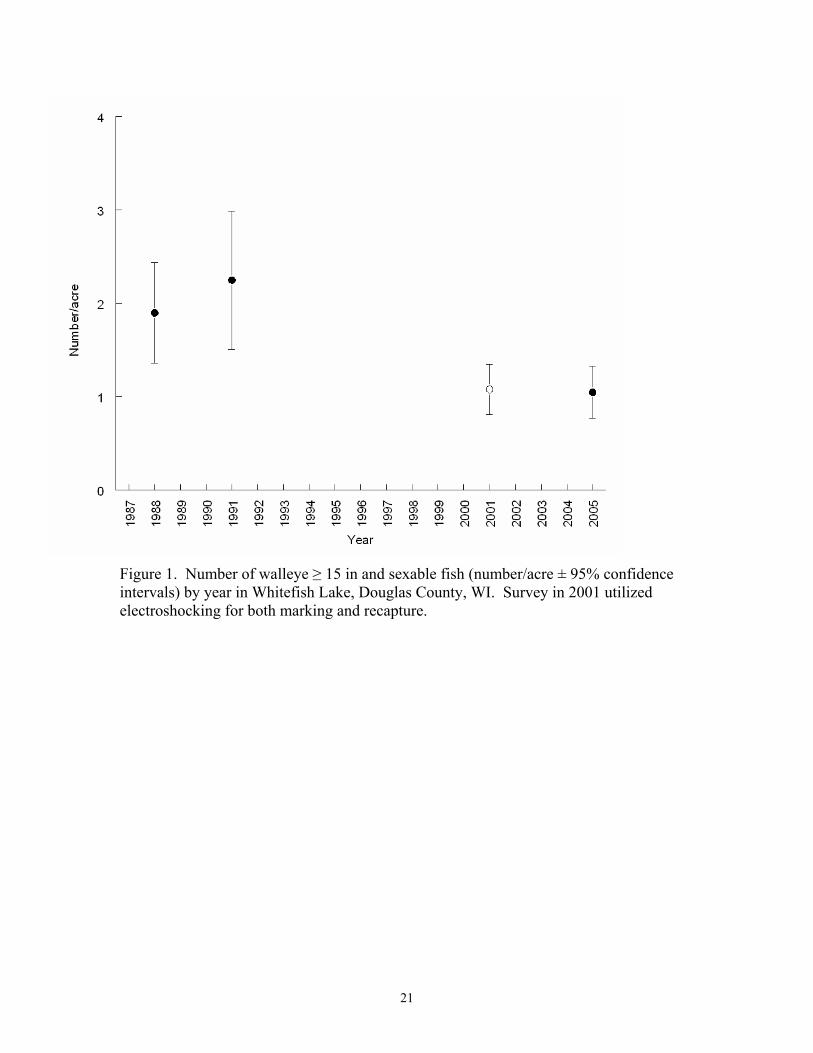
An adult walleye population estimate of 1.1 fish/acre in 2005 is lower than
population estimates performed by the WDNR in 1988 and 1991 when the spawning
walleye population was estimated at 1.9 adult fish/acre (95% C.I. = 1,170<N<2,060) and
2.3 adult fish/acre (95% C.I. = 1,260<N<2,490), respectively. The estimate in 2005 was
however, similar to the population estimate done by GLIFWC in 2001, which was 974
± 232, or 1.2 adult fish/acre (Figure 1).
Size structure of walleye sampled in 2005 was good based on PSD and RSD
values. Mean length for all walleye >10.0 in collected while spring fyke netting was 15.7
in (SD = 2.44, N = 404). Males averaged 16.0 in (SD = 2.05, N = 337, length range =
11.2 – 20.6 in) and females averaged 19.4 in (SD = 2.78, N = 34, length range = 15.0 –
27.9 in) in 2005. Proportional stock density (PSD) and relative stock density (RSD-20)
for all fish was 55 and 4, respectively.
Overall size structure in 2005 appears roughly similar to walleye sampled in
1988, but somewhat better than in 1991 (Figure 2). Specifically, by size class there has
been an increase in the proportion of walleyes in the 15.0 – 19.9 in length range since
1991 that is comparable with 1988 percentages. In 1988, PSD was 61 and RSD-20 was

10
4. Values in 1991 were lower than 1988 and 2005, with a PSD of 42 and an RSD-20 of
3.
Age of adult walleye ranged from III to XIV. Male and female walleye first
reached maturity at III and IV, respectively. Age IV walleye represented 40% of the
aged adult population. Age distribution data from 1988, 1991, and 2005 shows consistent
natural reproduced year classes (Figure 3). In the 2005 survey growth rates for male and
female were dimorphic with males reaching 15 inches between ages IV and VI and
females between the ages IV and V. Growth rates in 1988, 1991, and 2005 were similar
to Douglas County averages through age VIII when they fall below the county average
(Figure 4).
Relative abundance of Young of Year (YOY) walleye in Whitefish Lake in 2005
was 26.5 fish/mile (67.8 fish/hour). The average YOY/mile was 30.4 (SD = 22.1, N =
15) for surveys completed from 1986-2006. However, fingerling relative abundance has
been highly variable from 1986 to 2006 with a range of 4.3 fish/ mile to 92.2 fish/mile
(14.3 fish/hour to 227.1 fish/hour; Figure 5).
Northern Pike. Relative abundance (the number of fish caught with each fyke net
lift) of northern pike was 0.3, 0.2 and 0.4 fish/net in 1988, 1991 and 2005 survey years.
There was not an adequate number of northern pike marked to estimate abundance;
however, the density of northern pike appeared low. Mean length for northern pike (fyke
net samples) decreased then increased from 23.7 (SD = 5.13, N = 28) to 13.8 (SD = 7.05,
N = 11) to 19.1 (SD = 9.21, N = 45) inches from 1988 to 1991 to 2005. PSD for spring
fyke net samples was 100, 40 and 78 for 1988, 1991 and 2005. RSD-28 for spring fyke
net samples was 22, 0 and 26 for the same time period. The largest northern pike caught
during the 2005 fyke net survey was 40.5 in.
Largemouth and Smallmouth Bass. In 2005, largemouth bass represented 45%
and smallmouth bass 55% of the total number of bass surveyed (N = 149). Largemouth
bass abundance (≥ 14 in) in Whitefish Lake was 136 (CV = 33; 0.16 fish/acre) for 2005.
Relative abundance for largemouth bass for the third and forth electroshocking surveys
was 10.4 fish/hour for 2005. Size structure for the 2005 survey was excellent with a
mean length of 15.2 in (SD = 1.62; N = 66) and PSD and RSD-15 values of 97 and 55,
respectively (Figure 6).
11
Smallmouth bass abundance (≥ 12 in) in Whitefish Lake was 150 (CV = 28; 0.18
fish/acre) for 2005. Relative abundance for smallmouth bass for the third and fourth
electroshocking surveys was 13.8 fish/hour for 2005. Size structure was excellent, mean
length of smallmouth bass for the 2005 survey was 14.2 in (SD = 2.22; N = 82) and had a
PSD and RSD-14 values of 90 and 54, respectively (Figure 7).
Panfish. Yellow Perch were the most abundant panfish species (N = 550)
sampled in Whitefish Lake during the fyke netting survey of 2005. PSD and RSD-10
values of 0 and 0 indicate a poor size structure for yellow perch. Bluegills were the
second most abundant panfish species sampled (N = 130). PSD and RSD-8 values of 20
and 3 indicate poor size structure for bluegills. Rock Bass were the third most abundant
panfish species sampled (N = 10).
Discussion
Whitefish Lake has supported, and continues to support a diverse fish community
and popular sport fishery. With the exception of brown trout, good to excellent natural
reproduction supports all fish species.
Results from the 2005 survey suggest that since walleye stocking ended in 1993
natural reproduction has sustained the fishery. Fall electrofishing surveys to assess year
class strength of YOY walleyes have demonstrated that good natural reproduction is
occurring in Whitefish Lake including the 2002 year class that is responsible for 40% of
the walleye from the 2005 survey. Although adult walleye abundance was lower in 2005
than previous estimates in 1988 and 1991, size structure of adult walleye has improved.
Adult walleye abundance in Whitefish Lake is similar to other oligotrophic lakes in
Bayfield county including Diamond Lake (1.15 fish/acre in 2006), Lake Owen (1.13
fish/acre in 2007), Upper Eau Claire Lake (2.0 fish/acre in 2004), but is below the 3.7
adult fish/acre average for Bayfield and Douglas county walleye lakes.
Northern Pike relative abundance has remained low.. Natural reproduction is
providing consistent recruitment of northern pike into the lakes ecosystem. Although
there has not been an adequate sample size to have a population estimate of northern pike
in Whitefish Lake, they do represent a portion of the lakes diversity and offer anglers a
potential for a trophy fish.

12
Largemouth and smallmouth bass densities were low compared to western ceded
territory county averages which are 4.6 fish/acre (SD = 5.06, N = 10) and 1.2 fish/acre
(SD = 1.30, N = 9) respectively. However, size structure for both largemouth and
smallmouth bass was excellent. The 2005 largemouth and smallmouth population
estimates were the first completed on Whitefish Lake and were complicated by the
inefficiency of the sampling gear on the large sand flats and sharp drop offs that are
characteristic of Whitefish Lake. Historic surveys provide no accurate comparisons due
to the lack of largemouth and smallmouth that were sampled. The inability to effectively
sample bass in Whitefish Lake makes future population estimates of limited value.
The panfish community was not targeted in the survey completed in 2005.
However, in the 2004 survey juvenile panfish were targeted with mini-fyke nets. When
combining the data from 2004 mini-fyke netting and 2005 fyke netting bluegills were the
most abundant panfish followed by yellow perch and rock bass. Size structure and
relative abundance of panfish in Whitefish Lake appears to be relatively low. The
introduction of walleye into Whitefish Lake to reduce the over-abundant bluegill
population through predation appears to have been successful based on large numbers of
YOY bluegills present in the mini-fyke net survey and adults not being sampled in large
numbers during walleye netting. However, without specifically targeting adult bluegills
it is difficult to discern their true abundance, therefore, future creel surveys or panfish
netting surveys would provide more accurate information on adult bluegill abundance
and impacts of walleye predation.
Ciscoes were found in Whitefish Lake during the 1967, 1971, 1977, 1982 and
1983 surveys. These pelagic prey fish were captured in the open water with gillnets in
2006 and 2007 and their densities were found to be within the range expected for an
oligotrophic lake (Hrabik 2007).
Summary and Management Recommendations
1. Walleye abundance in Whitefish Lake was below statewide goals and regional
averages. Continued fall shocking to access year class strength should continue along
with a comprehensive evaluation of the adult walleye after a period of 6 years.

13
2. Largemouth and smallmouth bass were difficult to sample in Whitefish Lake. Future
population estimates should not be performed. Due to low capture and recapture rates
these estimates produce high variance and robust estimates. Relative abundance from the
first and second electroshocking runs should provide enough information to detect
changes in abundance. In addition, creel surveys would also provide further information
on the bass fishery.
3. Northern Pike abundance in Whitefish Lake was low. No regulation changes are
recommended at this time.
4. Panfish size and numbers in Whitefish Lake are low. Panfish netting should be
considered to obtain accurate adult abundance information. If a future creel survey
suggests overharvest of panfish by anglers, a regulation change of 10 panfish/day should
be considered.
5. Continue every third year stockings of brown trout to continue the two-story fishery.
Anglers should be asked the following questions during a future creel survey to evaluate
the attitude towards a continued trout stocking program: 1) Have you ever caught a
trout? 2) If so, when? 3) Would you like to see trout stocking continued?
6. Initiate a sampling protocol at the same frequency interval as walleye to provide
important information on the presence and potential relative abundance of cisco.
7. Work with local residents, the Whitefish Lake Conservation Organization Inc. and the
WDNR lake grants program to create and adopt a lake management plan that would: 1)
develop management objectives for fisheries including goals for densities and size
structures for the various fish species found in the lake, 2) develop strategies for
protecting and enhancing sensitive aquatic and shoreline habitats, 3) formally establish
exotic species survey and control programs targeting satellite infestations, 4) provide
educational and participation forum for environmentally sensitive shoreline living, 5)

14
identify uses and user groups to facilitate all recreational uses on the lake, 6) continue
water quality monitoring through the citizen lake monitoring network.
No amount of regulation or voluntary catch and release practices will change the need
for healthy aquatic environments. Although water quality remains high, habitat loss,
declining shoreline aesthetics, and exotic introductions are warning signs of cultural
disturbances that are degrading ecosystem health. To preserve and enhance the
ecosystem, vigilance for exotic species must continue and shoreline restoration projects
in areas that are currently lacking buffers should be explored. Preventing the spread of
exotics and enhancing habitat through restoration projects, as well as preserving the
existing habitat will be far more beneficial than losing what is currently present and
relying on stocking and artificial habitat improvements to maintain the fishery and
ecosystem as a whole.
Acknowledgements
I would like to thank Fred and Sandy Anderson and all other volunteers for the Self-Help
Lake Monitoring Program that gathered the water quality data presented in this report. I
would also like to thank the biologists and technicians of the Wisconsin Department of
Natural Resources who assisted with field collection of data as well as the WDNR treaty
assessment unit for data collection and data entry. Special thanks to Terry Margenau
who provided a critical review of the manuscript.

15
References
Anderson, R. O., and S. J. Gutreuter. 1983. Length, weight, and associated structural indicies. Pages 283-300 in L. Nielson and D. Johnson, editors. Fisheries Techniques. American Fisheries Society, Bethesda, Maryland.
Hennessy, J. 2002. Ceded territory fishery assessment report. Wisconsin Department of Natural Resources. Administrative Report 55, Madison, Wisconsin. Hrabik, T.R. 2007. Acoustic assessment of Whitefish Lake pelagic fish populations. University of Minnesota, Duluth Campus. Kampa, J. 1988. Whitefish Lake Survey - 1988. WDNR, Brule Office. Manz, C.H. 2004. Fisheries Information Summary, Whitefish Lake, Douglas County. WDNR, Brule Office. Margenau, T.L. 1982. Modified procedure for aging walleye by dorsal spine sections. Progressive Fish Culturist 44: 204. Ricker, W.E. 1975. Computation and interpretation of biological statistics of fish populations. Fisheries Research Board of Canada, Bulletin 191. Sand, C. 1991. Summary and Management Recommendations. Whitefish Lake File,
WDNR, Brule Office. Schram, S. 1979. Basic Inventory Bardon Lake, Douglas County. WDNR, Brule Office. Simonson, T. 2004. Lakes Sampling Procedures. Unpublished Guidance Document,
Wisconsin Department of Natural Resources. Madison. Wisconsin. Stewart, S. 2001. Baseline Lakes Protocol. Unpublished Guidance Document, Wisconsin Department of Natural Resources, Madison, Wisconsin. Toshner, P. J. 2004. 2003 Whitefish (Bardon) Lake, Douglas County, Sensitive Area Designation Survey and Management Guidelines. WDNR, Superior Office. Weiher, W. 1967. Lake Survey – Bardon Lake, Douglas County. WDNR, Brule Office.

16
Table 1. Aquatic plants identified in Whitefish Lake, Douglas County, Wisconsin during a 2003 Sensitive Area Designation Survey (Toshner 2004).
Aquatic Vegetation Category Scientific Name Common Name (s)
Emergents Scirpus americanis Three-square, chairmakers rush Eleocharis acicularis Needle spikerush, hairgrass Eleocharis palustris Creeping spikerush Submersed plants Vallisneria americana Wild celery, eelgrass, tapegrass Najas flexilis Slender naiad, bushy pondweed Elodea canadensis Common waterweed, elodea Pondweeds Potamogeton gramineus Variable or grass-leaf pondweed Potamogeton robbinsii Fern or robbins pondweed Potamogeton praelongus White-stem pondweed Potamogeton amplifolius Large-leaf pondweed, bass weed Potamogeton spirallis Spiral-fruited pondweed Turf formers/rosettes Isoetes spp. Quillworts Lobelia dortmanna Water lobelia Eriocaulon aquaticum Pipewort Juncus pelocarpus Brown-fruited rush
Sagittaria latifolia Common or broad-leaf arrowhead, duck potato, wapato
Sagittaria graminea Grass-leafed or slender arrowhead Ranunculus flammula Creeping spearwort Myriophyllum tennellum Dwarf water milfoil Algae Nitella spp. Nitellas, stoneworts Chara spp. Musgrasses, stoneworts, charas

17
Table 2. Stocking history of Whitefish Lake, Douglas County, Wisconsin. Year Species Number Stocked Size 1934 Walleye 150,588 - 1938 Largemouth Bass 16,086 Fry 1939 Largemouth Bass 1,000 Fingerling 1940 Walleye 600,000 Fry
Largemouth Bass 4,000 Fry 1941 Walleye 500,000 Fry 1942 Walleye 800,000 Fry 1943 Walleye 800,000 Fry 1944 Largemouth Bass 1,000 Fingerling 1945 Largemouth Bass 1,320 Fingerling 1947 Largemouth Bass 4,170 Fingerling 1948 Largemouth Bass 8,360 Fingerling 1949 Largemouth Bass 650 Fingerling
Northern Pike 170,000 Fry Smallmouth Bass 300 Fingerling
1950 Northern Pike 180,000 Fry 1952 Northern Pike 159,000 Fry 1958 Kamloop Trout 20,820 Fingerling 1961 Rainbow Trout 10,000 Legal
Brown Trout 1,500 Fingerling Brown Trout 1,200 Legal
1962 Rainbow Trout 5,00 8-10 in Legal Brook Trout 210 Adult
1963 Rainbow Trout 10,000 6-8 in Yearling Brook Trout 210 Adult
1964 Rainbow Trout 3,464 7-10 in Yearling Lake Trout 25,000 5-6 in Fingerling Brook Trout 250 Yearling
1965 Rainbow Trout 2,500 7-9 in Legal Brown Trout 5,000 Fingerling Brook Trout 500 Legal
1966 Rainbow Trout 2,500 Yearling Brown Trout 4,000 Yearling
1967 Rainbow Trout 2,500 Yearling 1968 Rainbow Trout 5,000 9 in Yearling 1969 Brown Trout 2,500 7 in Yearling 1970 Coho Salmon 10,960 5-7 in Yearling
Brown Trout 3,000 7 in Yearling 1971 Coho Salmon 4,000 7 in Yearling
Brown Trout 3,000 7 in Yearling Brown Trout 6,000 5-7 in Yearling
1972 Brown Trout 3,000 7 in Yearling

18
Table 2. Whitefish Lake stocking history, continued.
Year Species Number Stocked Size 1973 Rainbow Trout 3,000 9 in Yearling 1974 Rainbow Trout 3,000 9 in Yearling 1975 Rainbow Trout 3,000 9 in Yearling 1976 Rainbow Trout 1,200 7 in Yearling
Rainbow Trout 1,800 9 in Yearling 1977 Rainbow Trout 3,000 9 in Yearling 1978 Walleye 80,111 2 in Fingerling
Rainbow Trout 529 Adult Brown Trout 104 Adult
1979 Walleye 80,068 Fingerling 1980 Walleye 59,825 Fingerling 1981 Walleye 80,135 Fingerling 1983 Brown Trout 3,000 7 in Yearling 1984 Walleye 79,892 Fingerling 1987 Rainbow Trout 3,000 9 in Yearling 1988 Rainbow Trout 2,500 9 in Yearling
Walleye 41,064 3 in Fingerling 1990 Walleye 14,365 3 in Fingerling 1991 Rainbow Trout 2,500 8.9 in Yearling 1993 Walleye 41,606 3.1 in Fingerling 1994 Brown Trout 2,500 7.1 in Yearling 1995 Brown Trout 2,500 7.1 in Yearling 1997 Brown Trout 2,500 6.3-7.4 in Yearling 2003 Brown Trout 2,545 7.3 in Yearling
Brown Trout 14,998 2.8 in Fingerling 2005 Brown Trout 4,175 4.6 in Fingerling

19
Table 3. Proportional and relative stock density values. Species Stock Size (In.) Quality Size (In.) Preferred Size (In.)
Bluegill 3 6 8 Largemouth Bass 8 12 15 Northern Pike 14 21 28 Smallmouth Bass 7 11 14 Walleye 10 15 20 Yellow Perch 5 8 10

20
Table 4. Species composition of the fish community in Whitefish Lake, Douglas County, Wisconsin.
Common Name Scientific Name Fyke
Netting 2005
Spring Shocking
2005
Fall Shocking
2005 (Walleye)
Mini-fyke
Netting 2004
Fall Shocking
2004 (Baseline)
Total Sampled
Gamefish Walleye Sander vitreus 407 623 194 0 95 1,319Largemouth Bass Micropterus salmoides 2 76 574 6 658Smallmouth Bass Micropterus dolomieui 0 93 91 5 189Northern Pike Esox lucius 38 10 0 3 51Panfish Yellow Perch Perca flavescens 550 64 50 664Bluegill Lepomis macrochirus 130 1,137 47 1,314Rock Bass Ambloplites rupestris 10 5 3 18Non-game fish
White Sucker Catostomus commersoni 223 1 0 224
Yellow Bullhead Ictalurus natalis 1 0 0 1Common Shiner Notropis cornutus 2 0 0 2Spottail Shiner Notropis hudsonius 41 0 0 41Mimic Shiner Notropis volucellus 2 5 27 34Bluntnose Minnow Pimephales notatus 0 49 0 49
Creek Chub Semotilus atromaculatus 2 0 0 2
Iowa Darter Etheostoma exile 0 8 0 14Johnny Darter Etheostoma nigrum 0 0 1 1Total sampled 16 Species 1,408 802 194 1,934 237 4,581
21
Figure 1. Number of walleye ≥ 15 in and sexable fish (number/acre ± 95% confidence intervals) by year in Whitefish Lake, Douglas County, WI. Survey in 2001 utilized electroshocking for both marking and recapture.

22
Figure 2. Percentage length frequency of fyke net catches for walleye by length interval in Whitefish Lake, Douglas County, WI.

23
Figure 3. Percent distribution by age of walleye in Whitefish Lake, Bayfield County, Wisconsin.

24
Figure 4. Age at length of walleye in Whitefish Lake, Douglas County, Wisconsin.

25
Figure 5. Young of the year walleye relative abundance determined by fall electroshocking in Whitefish Lake, Douglas County, Wisconsin. Surveys were not completed in 1989, 1993, 1994 and 1996. Vertical line represents termination of walleye stocking.

26
Figure 6. Largemouth bass length frequency, 2005, Whitefish Lake, Douglas County, Wisconsin (N = 66).

27
Figure 7. Smallmouth bass length frequency, 2005, Whitefish Lake, Douglas County, Wisconsin (N = 82).