colorado climate - colorado state universityclimate.colostate.edu/pdfs/winter99.pdfcolorado climate...
TRANSCRIPT

Colorado ClimateWinter 1999/2000 Vol. 1, No. 1
Inside:What Is Climate?1999 Water Year ReviewClimate on the WebDrought in Colorado
Colorado Climate CenterAtmospheric ScienceDepartmentColorado State UniversityFort Collins, CO 80523-1371
Table of ContentsWelcome ..................................................................................................................................................... 1
What Is Climate? ....................................................................................................................................... 1
Is Our Weather Today “Normal”? ............................................................................................................ 3
Climate on the WEB .................................................................................................................................. 3
A Review of the 1999 Water Year ............................................................................................................ 4
July 1999 .................................................................................................................................................... 7
August 1999 ............................................................................................................................................... 8
September 1999 ......................................................................................................................................... 9
What Lies Ahead? .................................................................................................................................... 10
Folklore Anyone? .................................................................................................................................... 12
Climate Memories ................................................................................................................................... 12
Drought in Colorado ................................................................................................................................ 13
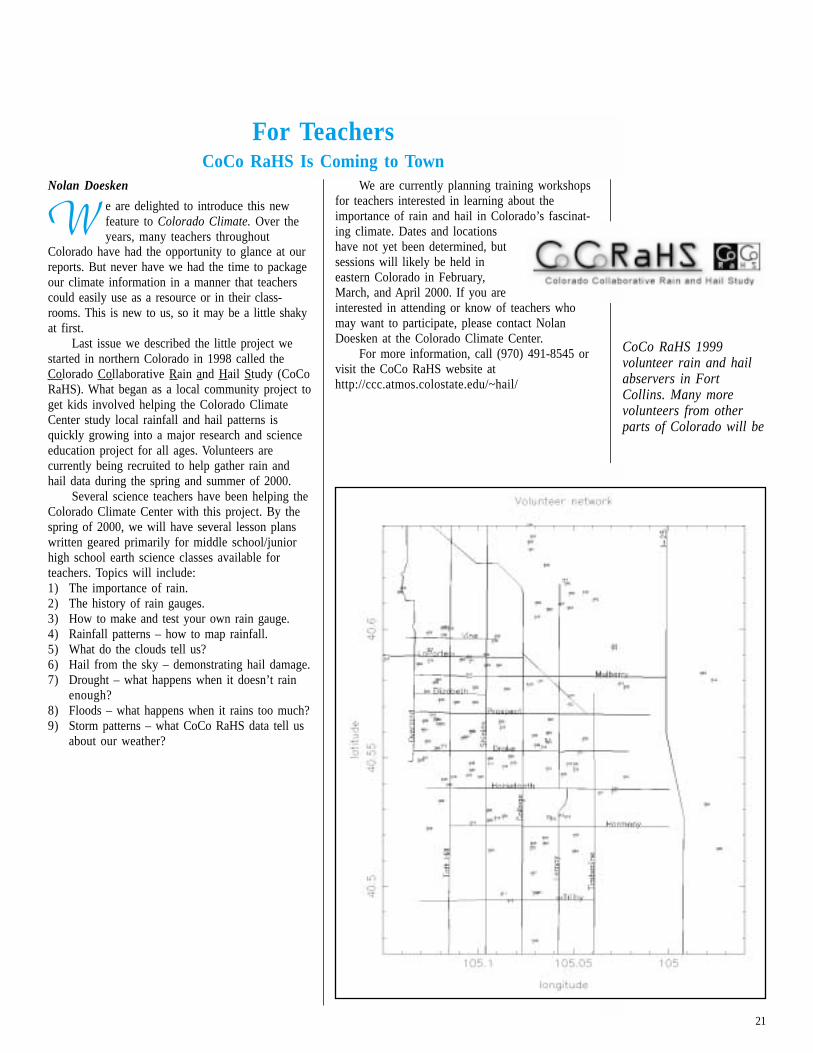
For Teachers – CoCo RaHS Is Coming to Town .................................................................................. 21
Cover Photo: The combination of fresh snow, steep mountains, rich evergreen forests, deep blue skies,and ever-changing cloud patterns is the unforgettable Colorado trademark that captures the essence ofColorado’s climate. (Photo taken near Breckenridge, Colorado, by Nolan Doesken.)
If you have a photo that you would like us to consider for the cover of Colorado Climate, please submitit to:
Colorado Climate CenterDepartment of Atmospheric ScienceColorado State UniversityFort Collins, CO 80523-1371
Enclose a note describing the contents and circumstances of the photo including the location and thedate it was taken. Digital photographs can also be considered. Submit digital imagery via attached files to:
Unless arranged in advance, photos will not be returned.
An early publication with thesame name, “ColoradoClimate,” was publishedmonthly from 1977 through1996 with the support of theColorado AgriculturalExperiment Station and theColorado State UniversityCollege of Engineering.
This is the first issue of thenew quarterly publication,“Colorado Climate.”
The Colorado ClimateCenter is supported by theColorado AgriculturalExperiment Station.
Subscription price is $15.00for four issues. Single issueprice is $7.50.

1
Welcomes Colorado State Climatologist andColorado Assistant State Climatologist,we welcome you to the first edition of
definition, which includes land-surface processes,such as vegetation growth and soil moisture.
This issue also contains the completion of thethree part series on drought that we started fiveyears ago (what a relief). You will also find ourtraditional descriptions of monthly climate patternsand water-year wrap-ups.
In each issue we will address climate-relatedtopics of interest to the citizens of Colorado. Wealready have a long list we want to write about.However, if you have suggestions for topics thatyou think are important, please let us know. Wemay be able to fit them in.
We look forward to providing you with climateinformation in this new format.
Dr. Roger A. Pielke, Sr. Nolan J. DoeskenProfessor and State Assistant StateClimatologist Climatologist
the Colorado Climate summary! This new publica-tion will appear four times per year. Our goal is tosummarize recent Colorado weather, as well asdiscuss a wide variety of climate topics.
As you can see, we are working towardsimproving the appearance of Colorado Climate. Nomore 2-cent copies on the cheapest paper available.But color and the quality of paper don’t guaranteesuccess. We will strive to improve the content aswell as the appearance.
In our first issue, we discuss what is normalColorado weather. We often have particularly warmor cold days for the season, but are they normal?The term “climate” is defined. While it has beenused to mean long-term weather statistics, at theColorado Climate Center we adopt a more general
A
What Is Climate?Roger A. Pielke, Sr.
30 years) to calculate the observed statistics ofweather. The Colorado Climate Center (http://ccc.atmos.colostate.edu), the Western RegionalClimate Center (http://www.wrcc.dri.edu), and theNational Climatic Data Center (http://www.ncdc.noaa.gov) are examples of web sites thatroutinely provide this information.
However, there is a broader definition ofclimate in which earth surface conditions are asimportant as atmospheric conditions. This defini-tion recognizes that the atmosphere and landsurface interact with each other. Because of this,data must be collected for both the atmosphere andthe land surface in order to adequately describeclimate.
To illustrate this for a portion of Colorado, thefigure on the following page shows the variation ofthe greenness of the ground in the central UnitedStates during the early growing season of 1988.The greenness means that photosynthesis is takingplace and vegetation is actively transpiring watervapor into the air during the day. The greenness ofthe surface will directly affect the amount of watertranspired to the atmosphere. Long-term weatherdata over eastern Colorado illustrate the large
T here is more than one definition ofclimate. One definition is that we averageweather conditions over many years (say
(continued on page 2)
Composite of GOES derived surfacetemperature at 1300 LST for the period1 August 1986 to 15 August 1986 for(a) northeast Colorado (FT = Fort Collins;FM = Fort Morgan; GR = Greeley) and(b) San Luis Valley in Colorado (AL =Alamosa; AN = Antonito; DN = Del Norte;SA = Saguache). The lower valley isoutlined by a dark line separating it fromsignificant elevated terrain. Irrigated areasare shaded. From M. Segal et al., 1988,“Evaluation of vegetation effects on thegeneration and modification of mesoscalecirculations.” J. Atmos. Sci., 45, pp 2287.

2
What Is Climate? (continued from page 1)
Greenness in the central U.S. during 1988growing season. Green corresponds to higheramounts of transpiring vegetation, with whitecorresponding to no transpiration. (Figurecourtesy of the EROS Data Center, SiouxFalls, South Dakota, and Tim Kittel, NCAR,Boulder, Colorado.)
variations in time and space between even close bylocations.
We can telescope into Colorado to see how thegreenness of the surface affects temperature. Thefigures on the previous page show the temperatureof the surface of the earth at 1 p.m. in the afternoonaveraged over two weeks in early August 1986. Thestipled areas correspond to irrigated crops, whilethe white area corresponds to all other areas. Theskin temperature is not the air temperature even afew feet above the surface, but it does show that theirrigated areas are decidedly cooler than otherareas. This would also occur with the air tempera-ture and, indeed, the cooling extends over athousand feet above the surface!
There are additional variations in the skintemperatures in the two regimes shown in thefigure. Recent research has shown that much of thisvariation is due to the specific landscape (such as aponderosa forest in the foothills of the mountainsversus a short grass prairie in the lower elevations),as well as where it rained most recently so thatevaporation from the soils can cool the surface.
Since the landscape varies across the state ofColorado, it should therefore be expected that thereare variations in weather and climate that results.
In future issues, we plan to start summarizingthe variation of greenness across the state ofColorado.

3
Is Our Weather Today “Normal”? Roger A. Pielke, Sr.
his question is often asked and com-mented on by TV and radio weathercasters. If it is a warmer than average day,
it is often stated that “the temperature today wasabove normal.” Is this really true?
This article suggests that we can have a daywith above average temperatures, yet the warmweather is quite normal! Statisticians use theconcept of standard deviation to express the rangeof data around a mean. If the distribution oftemperature follows the so-called “bell curve,”there is an equal likelihood of values above andbelow the average value of the data. With a bellcurve, 67 percent of the temperatures fall withinone standard deviation of the mean.
We can use the bell curve to describe whethera day is warmer or colder than average, but is it still“normal” weather for the date. Only if the tempera-ture were beyond the limits of most of the bellcurve would a day be described as above or belownormal. Such days are “abnormal.”
We can use weather data for Denver toillustrate cold and warm (but normal) days. Thetable presents the average maximum and minimumtemperatures for January and July, along with theobserved standard deviations. If the temperaturereaches 63°F during the day in January, the day iswarmer than average, but the temperature is notabnormal. Similarly, in July, a temperature of 100°Fis hot, but is quite normal for Denver.
T
Maximum and Minimum Temperatures for DenverJanuary July
(°F) (°F)
Daily average maximum temperature = Tmax43.0 87.9
Daily average minimum temperature = Tmin16.0 58.8
One standard deviation above Tmax62.8 97.9
One standard deviation below Tmax23.2 77.9
One standard deviation above Tmin33.3 68.6
One standard deviation below Tmin-1.3 49.0
Climate on the WEBNolan Doesken
ome of you have reached that stage in yourlife when you actually have time tocontemplate the marvels of nature and
time to surf the Net (younger than 26, older than55, single, unemployed, etc.). There is moreweather and climate stuff on the World Wide Webthan you can shake the proverbial stick at. In thissection we will bring to your attention some of thefavorite websites of climatologists. I will notcomment much about these sites, but just let youexplore them for yourselves.
For a wide assortment of current and historicclimatic information for the western United States,I highly recommend the Western Regional ClimateCenter’s website. WRCC is a part of the DesertResearch Institute at the University of Nevada atReno. Dr. Kelly Redmond is the Regional Clima-tologist for the WRCC and was largely responsiblefor developing this website. It will lead you tomany and varied sources of valuable weather andclimate data and information:
http://www.wrcc.dri.edu/Also, feel free to visit the Colorado Climate
Center website at:http://ccc.atmos.colostate.edu
S
Normal “bell-curve” statistical distribution
Standard Normal Distribution

4
A Review of the 1999 Water Year1999 Winter Season
Winter got off to a quick start with heavymountain snows in October and early November,especially over southwestern Colorado, andabundant low-elevation rains and wet snow. Thenin mid November, the weather patterns shifted anddry weather became the rule. Finally, just beforeChristmas, a week-long blast of frigid sub-zerotemperatures accompanied by several inches ofsnow renewed the winter spirit and again raisedfears that we were in for a long, cold winter.Immediately, weather patterns shifted again. FromChristmas Day through March, the entire stateenjoyed unusually warm temperatures with no moreblasts of arctic air. The storms that crashedcontinuously into the Pacific Northwest did nickColorado and left our northern and central moun-tains with heavy snows in January and a few morestorms in February. Eastern and southern Coloradoremained very dry. The entire state was very dryand unusually warm in March.
A significant and annoying feature of the 1999winter was wind. Strong westerly and northwest-erly winds seemed to blow incessantly from lateDecember into mid April. For Colorado’s FrontRange, it was the windiest winter in many years.February was particularly brutal with some FrontRange foothills locations experiencing wind gustover 40 mph on at least 18 separate days inFebruary. A ferocious windstorm April 8-10 wasresponsible for approximately $20 million indamages along the Front Range. Historically, strongwinter and spring winds are a normal part of theclimate from the crest of the Colorado mountainseastward to the plains. However, except foroccasional episodes of very strong winds, theColorado Front Range has been enjoying lighterwinds since the mid 1980s. During the 1970s andas recently as 1982 windstorms were much morecommon and did considerable property damage.
By the end of March, precipitation totals forthe first six months of the 1999 water year werenear or below average over many parts of Colo-rado. Statewide snowpack was 89 percent ofaverage on April 1, but conditions appeared muchworse. The combination of strong winds and muchabove average temperatures had melted or evapo-rated much of the snows that had fallen earlier inthe winter except in protected or north facinglocations. Numerous wildfires were ignited andspread out of control in March. Concerns over anearly forest fire season and reduced water suppliesincreased daily.
Then came the storms of late April (describedin a special feature in the last issue of Colorado
Growing season (May-Sept. 1999) precipitationas a percent of the 1961-1990 average
Significant Features
The 1999 water year in Colorado was anotheryear of climate frenzy as La Nina conditions(colder than average sea surface temperatures in thetropical Pacific Ocean) led many climate forecast-ers across the U.S. to anticipate a dry winter insouthern Colorado with more abundant snowfall inColorado’s northern mountains. Forecasters alsoanticipated a good chance that spring and earlysummer would be drier than average over easternColorado. Some of the La Nina forecast came truefor the Western U.S. as the coastal Pacific North-west experienced exceptional precipitation andrecord mountain snowfall while the Southwest wasdry during winter and spring. For Colorado,however, which lies in the “gray area” between themore predictable Pacific Northwest and theSouthwest, the forecast was less than stellar.
When it was all said and done, the 1999 wateryear ended up much wetter than average statewide.Stormy weather in October and early November1998, flooding spring rains along the Front Range,and frequent and locally excessive summer stormsmore than made up for dry and exceptionally mildwinter weather. Late April - early May flooding onthe Poudre River, Arkansas River, Fountain Creek,and other tributaries did millions of dollars instructural damage and resulted in a Federal disasterdeclaration. Local flash floods were unusuallynumerous in the mountains in July and August.

5
Climate). In just a matter of days, the moisturedeficits were wiped out and replaced by floodemergencies on the Arkansas River and severalother rivers. This appears to have been one of theearliest major flooding events from widespreadheavy rains in recorded history. Such events aremost likely to occur in May or June. This was thebeginning of what became a very wet growingseason for most of Colorado.
1999 Growing Season
The 1999 growing season in Colorado wascharacterized by frequent and locally heavyprecipitation, high humidity (not compared to theEast, South, or Midwest, but compared to what wetypically experience in Colorado), and comfortabletemperatures. July and August were the onlymonths that were warmer than average, but this wasmostly the result of unusually warm nighttimetemperatures. There were fewer days than averagewith temperatures above 90 degrees F, and only ahandful of days with temperatures at or above the100-degree mark, even in the normally sizzlingvalleys of southeastern and west central Colorado.Lush, green vegetation from the heavy spring andsummer rains contributed to the warmer nights butcooler days.
Summer-like weather continued well intoSeptember, with periodic active thunderstorms andwarm temperatures. Humidity decreased dramati-cally, however, and the normal autumn deep blueskies appeared again. Before September ended, anearly winter storm hit parts of the mountains andnortheastern plains bringing wet snow, freezingtemperatures, and ending the 1999 growing seasonslightly prematurely.
Growing season (May-September) precipita-tion totals were above average over almost all ofColorado (see map on page 4). Precipitationexceeded 150 percent of average over large areas ofsouthwestern Colorado and over portions of theEastern Plains. The majority of Colorado receivedbetween 100 and 150 percent of average for thegrowing season. A few local areas fell slightly shortof average. For example, Kremmling measured 76percent, Yuma received 82 percent, Castle Rockreported 93 percent, and Yampa ended up with 95percent of the 1961-1990 average.
Temperature Summary
The key features of the 1999 water year werethe exceptionally warm late winter months(January-March) and the remarkable consistency indepartures from average throughout the year acrossall of Colorado. It is the exception, not the rule, forthe entire state to be above average or below
average at the same time, but this has been the casenow since the spring of 1997. Colorado has notexperienced a colder than average winter since1992-93.
For the year as a whole, temperatures ended upabout 1.4 deg. F warmer than average over theEastern Plains increasing to 1.8 deg. F aboveaverage in the foothills and mountains. Over thecourse of the year there were few new record dailymaximum temperatures and almost no new recordlow temperatures. However, there were manyunusually warm nights. A number of new recordsfor warmest overnight temperatures were estab-lished.
Regional temperaturedepartures from 1961-1990 average for Oct.-Sept.
Water year precipitationas a percent of the 1961-1990 average
1999 Water Year

6
As usual, there were a few locations thatmissed out on the abundant precipitation. Forexample, the upper valley of the Colorado Rivernear Kremmling received less precipitation thanaverage. There were also a few locations innortheastern Colorado slightly drier than averagefor the year. Of the more than 200 National WeatherService cooperative weather stations with completerecords for the year, only 3 stations received 90percent or less of the annual average. A total of 12stations (5 percent of all cooperative sites withcomplete data for the year) received less than 100percent, and most of these were just slightly belowaverage. More than half received in excess of 130percent of average. All other reporting stations wereabove average for the year with 15 official weatherstations reporting more than 170 percent of averagefor the year.
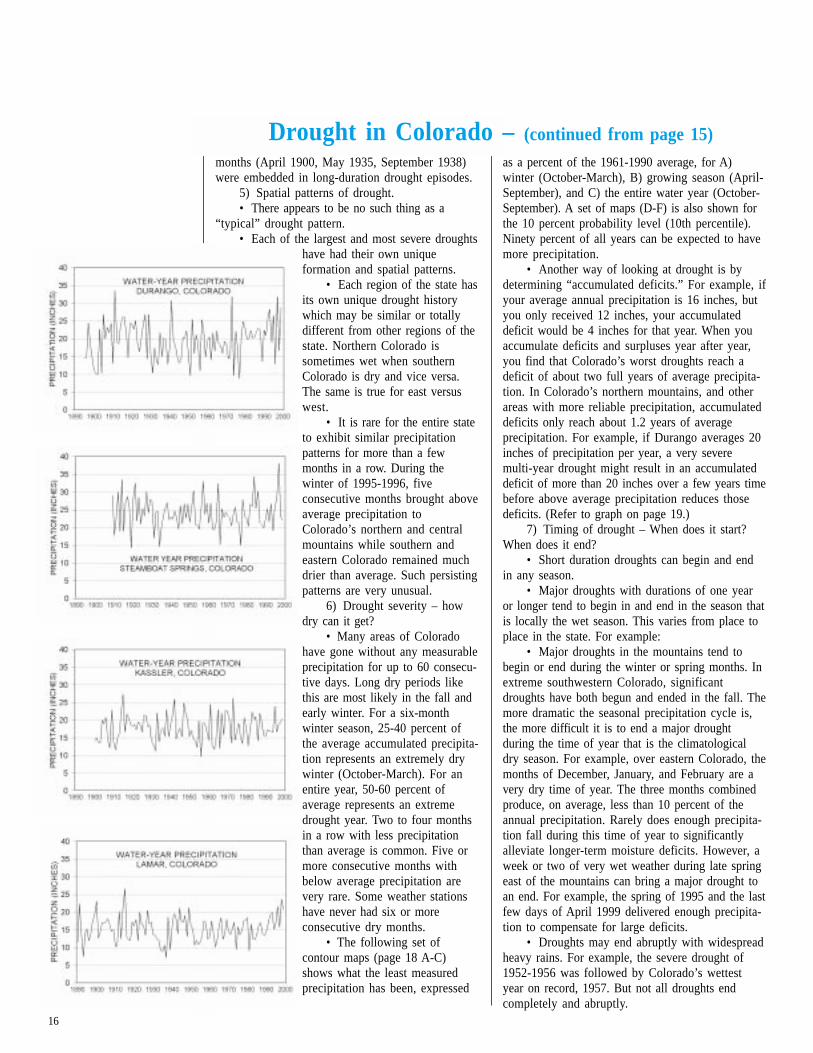
The regional graphs of daily precipitation (left)describe the year very well. The April - early Mayprecipitation onslaught was largely responsible forthe excessive annual totals. However, rains fellalmost every day in July and August to contributeto the large annual totals. Winter precipitation wasvery sparse. Colorado’s typical late June - earlyJuly dry spell was right on schedule over centraland western portions of the state.
The Front Range rainfall at the end of Aprilrepresented one of the heaviest widespreadprecipitation events in years with a regionalaverage of nearly 3 inches over a 3-day period with1.34" in a single day.
With another wet year, Colorado’s wet spell,that has prevailed most years since 1982, continues.To put this in perspective please read this issue’sspecial feature on Colorado’s drought historybeginning on page 13.
Precipitation Summary
Statewide precipitation for the 1999 water year(map on page 5) ended up 134 percent of the 1961-1990 average placing this in the top 12 wettestyears on record for the state as a whole. Thesoutheast quarter of Colorado was the wettest, withrespect to average, with many areas receiving morethan 150 percent of average. For some locations insoutheastern Colorado, this was the wettest year inrecorded history. Colorado Springs totaled 26.79"of precipitation for the water year, their wettest inrecorded history exceeding such notable wet yearsas 1921, 1965, and 1995. Rocky Ford received22.75" for the year, an amazing 209 percent of theiraverage. This surpassed their previous record bynearly 2.50 inches.
Regional graphs of dailyprecipitation
Western Valleys (WV)
Mountains/Interior Valleys (M/IV)
Foothills/Adjacent Plains (F/AP)
Eastern Plains (EP)

7
July 1999Climate in Perspective:
Colorado experienced hot summer weather inJuly with frequent thunderstorms. A steady flow oftropical moisture reached southwestern Colorado (awind circulation known as the North American orSouthwest monsoon) producing unusually heavyprecipitation and several flash floods in themountains.
Precipitation:
July precipitation was highly variable rangingfrom over five inches at many locations inColorado’s southwestern mountains (7.84" was thestate high at Wolf Creek Pass 1E) to less than 0.50"at a few stations in northeastern Colorado (just0.44" at Holyoke for the entire month, compared toa July average of 2.75"). A few locations in easternColorado were also soaked. Rocky Ford 2SEtotaled 6.79" for the month thanks to a 4.50"downpour on the night of July 16. Overall, most ofColorado was significantly wetter than averagewith many stations in southwestern Colorado over200 percent of average. There were isolated dryspots statewide, but the driest area was extremeeastern Colorado plus some locations east andsouth of Denver. Some of these areas received lessthan 50 percent of the July average.
Temperatures:
Temperatures for the month as a whole werewarmer than average over most of Colorado. Mostlocations ended the month about one degreeFahrenheit warmer than the 1961-1990 Julyaverage. North central Colorado was the warmestregion of the state, compared to average, whileportions of southern and west central Coloradowere slightly below average. Daytime temperatureswere actually a bit cooler than average over muchof the state, but nighttime readings were quitewarm.
Daily Highlights:
1-7 A modest heat wave. Some low elevationtemperatures reaching the 100 degree mark.Las Animas hit 106 degrees on July 2nd, thewarmest temperature of the year. Tempera-tures in the mountains reached close to 80degrees. This was a dry period for northernColorado with only a few isolated thunder-showers. More storms developed in southernColorado, however. Durango reported 0.66"on the 3rd. Blanca recorded 0.98" on the 6th.2.10" of rain was measured at Trinidad onthe 6th. The entire state enjoyed a seasonallyhot but comfortably dry 4th of July.
July 1999 precipitationas a percent of 1961-1990 average
July 1999 temperaturedepartures from 1961-1990 average (°F)
(EP) (F/AP) (M/IV) (WV)

8
8-11 A disturbance crossed Colorado on the 8thwith fairly numerous showers. Becomingsunny, cooler and very comfortable 9-10th,with increasing clouds but still comfortableon the 11th.
12-14 Quite hot and fairly humid with a fewscattered thundershowers.
15-17 Cooler with increasing clouds and moisture.Numerous storms on the 16th especially eastof the mountains, with locally heavy rains.2.60" of rain reported at New Raymer 21N.4.50" late on the 16th at Rocky Ford.
18-31 Stagnant weather pattern. Hot and humid (forColorado) with thunderstorm developmentevery day. Mountain clouds and storms eachday as a steady flow of tropical moisturemoved into Colorado from the south-
southwest. Several locally heavy stormsproduced a series of high elevation flashfloods and debris flows. For example, alocalized but very heavy rain caused floodingon Saguache Creek and Middle Creek (southcentral Colorado) on July 26. On the 28th,high elevation downpours resulted in a hugedebris flow west of Georgetown that closedI-70. On July 30-31, very heavy rain fell insouthwest Colorado. Major floodingoccurred on Dallas Creek. Placervillereported 3.13" of rain on the 30th. Briefheavy rains at high elevations are normal, butsome of these rains at elevations above 8,000feet represent some of the heavier rains ofrecord in Colorado’s mountains. OfficialNational Weather Service rain gauges werenot near the center of these storms. Exactrainfall is unknown, but is under investiga-tion.
August 1999Climate in Perspective:
The warm, humid and stormy weather patternthat began in July continued into August withthunderstorm development almost every day,especially in and near the mountains. With highhumidity and frequent rains, there were few forestfire problems in Colorado. Rains and high humidityalso helped dryland agriculture but led to increaseddiseases in irrigated crops in normally dry areas ofColorado such as the San Luis Valley.
Precipitation:
August was an exceptionally wet month inColorado. Many locations in the state received wellover double the average rainfall. Several weatherstations in southwestern and eastern Coloradoreceived in excess of seven inches of rainfall.Vallecito Dam measured in excess of 0.50" ofrainfall on nine separate days, and their August
August 1999precipitation as a percentof 1961-1990 average
August 1999 temperaturedepartures from 1961-1990 average (°F)
(EP) (F/AP) (M/IV) (WV)

9
rainfall total was a remarkable 9.27". Runoff fromAugust rains helped refill reservoirs in southwest-ern Colorado that are normally only filled withsnowmelt runoff. Grasses grew tall and lush overeastern Colorado
Temperatures:
August temperatures ended up near to slightlyabove average statewide. Only southwestern andextreme northeastern Colorado were a bit belowaverage. Daily maximum temperatures weresubstantially cooler than average due to cloudcover, frequent showers, and unusually greensummer vegetation. The number of days withtemperatures of 90° or above was much lower thanusual. The nights made up for this, however. Withunusually high humidity, temperatures did not cooloff as much at night as usual.
Daily Highlights:
1-5 A cool, cloudy, and very wet start to themonth. Widespread and locally heavy rainsfell each day. Colorado Springs totaled 3.98"on the 4th, and a 3-day total of 6.01" 3-5th.Many locations had one-day rains during thisperiod in excess of one inch. High tempera-tures each day only reached in the 60s and70s in the mountains and across the easternplains.
6-11 Warmer but still humid with scattered stormseach day. Widespread and again locallyheavy rains over western Colorado 10-11th.Grand Junction received 1.02" on the 10th.
12-14 Much drier air briefly moved into Coloradowith lots of sunshine and with cool, crispnights. Fraser reported a morning lowtemperature of 31°F on the 13th.
15-22 Warm and humid again with scattered stormseach afternoon and evening, most numerousover western Colorado. A powerful stormbrought hail and heavy rain to northeastColorado on the evening of the 17th. Aveteran observer, Layton Munson, 5 milessouth of Sedgwick, recorded 3.43" of rain.
23-26 Hot and fairly dry. This was the onlysustained period with low elevation tempera-tures in the 90s all month. Moisture movedback into southwestern Colorado on the 26thwith increasing showers.
27-31 Summerlike weather continued withscattered afternoon thunderstorms.
September 1999Climate in Perspective:
The stagnant weather patterns of summer gaveway to more changeable weather in September.Tropical moisture still reached southwesternColorado but retreated by the end of the month. Bymonth’s end, a lively early-winter storm broughtthe first snow and hard freeze of the fall to portionsof northeastern Colorado.
Precipitation:
For the first time in several months, themajority of Colorado received less precipitationthan average with a few areas of western andsoutheastern Colorado getting less than 50 percentof average. Scattered areas of the state were wetter
September 1999precipitation as a percentof 1961-1990 average
September 1999temperature departuresfrom 1961-1990 average(°F)

10
than average. Wolf Creek Pass was again remark-ably wet with a monthly total of 7.72" bringingthere July-September total to 24.45". NortheasternColorado was also much wetter than average. NewRaymer received 5.39" including 6.5" of Septembersnow.
Temperatures:
September got off to a warm, summery, start.However, three strong cold fronts, each strongerthan the next, progressively dropped temperatureseach of the last three weeks of the month culminat-ing in subfreezing temperatures in many areas latein the month. Fraser, for example, dipped to 11°Fon the 29th and 30th. As a result, Septembertemperatures ended up below average statewide. Inparts of northeastern Colorado where snow fell,temperatures were as much as three degrees belowaverage for the month.
Daily Highlights:
1-4 Warm weather with very lively thunder-storms each day moving up from the
southwest. Storms were most numerous overthe mountains and northeastern plains ofColorado. Severe weather with somedamaging hail in the Fort Collins, Greeley,and Longmont areas 1-3rd. Fort Morganreceived 1.50" of rain on the 3rd.
5-10 The first period with widespread dry weatherin many weeks. Hot 6-7 and 9-10. Someshowers on the 10th in advance of anapproaching cold front.
11-12 The first strong cold front of the seasoncrossed Colorado accompanied by scatteredthundershowers. High temperatures onlyclimbed into the 50s over portions of easternColorado on the 12th.
13-18 Pleasant temperatures statewide. Tropicalmoisture lingered over southern Coloradowith daily shower activity.
19-21 Another strong cold front crossed Coloradowith an early dose of snow for the mountainsabove 9,000 ft. Significant rains fell overparts of central and northeastern Coloradowith local patches of fog. Crested Buttetotaled 1.25" of rain. Skies cleared on the21st and temperatures dropped to the lowestlevels so far this fall.
22-25 Lovely, warm fall weather but with a fewscattered showers in southwestern Colorado.
26-28 Two storms in rapid succession broughtcooler weather statewide and significantprecipitation and the first snow of the seasonto portions of northeastern Colorado.Boulder recorded 1.21" of precipitation onthe 28th. New Raymer had a 3-day total of1.78" of water including 6.5" of heavy, wetsnow.
29-30 Clear – cool days with very chilly nights.Fraser temperatures dipped to +11°F.
What Lies Ahead?Nolan Doesken snowfalls, or probabilities of precipitation. It’s fun
– at least for some of us.Now that our publication comes out quarterly
(every three months), that old format won’t work.But let’s try something similar. Beginning with thisissue, we will outline a few highlights of thecoming months. It is not a forecast in the true sense.It is simply a description of what we have found tobe the typical seasonal progression of Coloradoclimate. Some years we will be way off, but mostof the time, we’ll offer some useful insights to helpyou plan ahead.
ears ago, we used to write a briefdescription of what to expect for thecoming month. It was very popular
among readers. In fact, many people thought wewere bold and successful weather forecasters with acrystal ball that allowed us to see the future. Littledid they know that all we were doing was studyingthe climate of the past and describing what usuallyhappens. This isn’t too hard to do, since climatolo-gists love to study climate data from the past todetermine things like average temperatures, record
Y
(continued on page 11)
(EP) (F/AP) (M/IV) (WV)

11
Colorado Climate, January-March
January is Colorado’s coldest month of theyear with the greatest likelihood of experiencingsubzero (Fahrenheit) temperatures. Storm systemstend to zip across Colorado every few days withepisodes of light to moderate mountain snows mostnumerous in the northern and central mountains.Little of this Pacific moisture ever falls east of themountains. There is usually one major multi-daystorm during the month that brings moisture intoColorado from the southwest and drops very heavysnows in the mountains of southwestern Colorado.These storms can sometimes bring snow east of themountains. Rain in January is traditionally rareexcept at the lowest elevations of western Coloradowhere some of the Pacific storms begin as rainbefore changing to snow. Colorado can also expecta siege of several days in a row with strongnorthwesterly winds aloft and heavy snow accumu-lations on the upwind side of the exposed mountainbarriers. Large snow accumulations in January arecommon near Steamboat Springs and other similarexposures. East of the mountains, January normallybrings dry, lip-chapping weather with cold nightsbut many sunny days. There is usually at least oneburst of bone-chilling arctic air out on the plainsthat drops temperatures well below zero. Thesecold fronts may bring a few inches of dry, fluffysnow that are eventually whipped into drifts whenthe winds inevitably pick up during or after thestorm passes. For the eastern foothills, January isalso a month of strong winds. With the jet streamoften overhead, many days of strong winds shouldbe expected from the crest of the mountainseastward to the base of the Front Range foothills.Winds may reach 100 mph in local wind-pronelocations.
February is much like January except that theday length begins to become noticeably longer.Very cold weather is still possible, especially earlyin the month. Some of Colorado’s coldest tempera-tures of all time, including the record low of –61°Fat Maybell, have occurred in early February. Thereare often several consecutive days in February withbright sunshine. Despite occasional strong windsand doses of snow, February has gained thereputation for providing “the best spring weather ofthe year” east of the mountains.
The frequency of Pacific storm systemsreaching Colorado decreases in March. However, astemperatures begin to warm a bit, more water vaporis available. More storms form and linger in theGreat Basin area before moving eastward, so thereis more time for Gulf of Mexico moisture to movenorth and westward into eastern Colorado. As aresult, March has a reputation for heavy snows bothin and east of the mountains. For some of the Front
Range and central mountains, March is often thesnowiest month of the year. There is always a threatof dangerous blizzards on the high plains, sotravelers must be cautious. March is also a monthfor dramatic changes. Weather conditions rarelystay the same for long. Temperatures can climb intothe 70s quite easily at lower elevations, but theycan easily drop 40-50 degrees when a strong coldfront arrives. Mountain top winds begin to diminisha bit, while winds out on the eastern plains growstronger. As the sun appears higher in the sky eachday, it warms the air quickly near the ground. Thisair then rises and mixes with the faster-movingwinds aloft which easily sweep down to groundlevel. By comparison, there are many days in midwinter with strong winds at mountain top level butwith nearly calm stable air in the mountain valleysand across the plains.
The months of January, February, and Marchrepresent critical months in Colorado’s highcountry for snow accumulation. By the end ofMarch, the majority of the snowpack is normally inplace that provides the runoff to fill streams,reservoirs and irrigation canals throughout thespring and summer. Water resource managers don’tcare when it snows so long as a deep snowpack is
in place by April. It may be beneficial, in fact, formost of the snow to fall in late winter and springwhen storms are more widespread and when thereis less opportunity for the snow to melt or evapo-rate before the spring snowmelt. Skiers, on theother hand, appreciate frequent snows spread outthroughout the winter. In reality, the timing andquantity of snow varies greatly from one year to thenext and remains difficult to forecast accuratelywell in advance.
Loveland, Colo.,March 6-7, 1990. Photoby Joel Radtke, LovelandReporter Herald, fromthe Snow Booklet.

12
Folklore Anyone?Nolan Doesken
ong before anyone knew what a meteo-rologist or climatologist was – long beforethermometers or rain gauges were
invented – long before anyone knew of the NewWorld, weather wisdom and folklore were alive andwell and passing on from generation to generation.European settlers brought their home countryfolklore to the New World, for better or worse. TheNative Americans already had their own refinedand cherished weather wisdom.
The last 50 years have been hard on folklore.Dispersion of families after World War II and massexodus from farms to cities has taken a toll on thewealth of weather wisdom. Much of the NativeAmerican folklore was not written down. Meteoro-logical technology and verifiable improvements inweather forecasting as a science, not an art, hasplaced weather folklore in the closet.
Some might argue that a scientific publicationis no place for folklore. Science, afterall, should
rise above the lore and myths of common Man,should it not? For many centuries, however,weather folklore was the science. The wise loristswho applied their trade (usually to farming,hunting, or sailing) were respected by all.
In future issues we will present tidbits ofweather folklore that have made their way toColorado or developed here over time and observa-tion. We will not pass harsh judgement on these bitsof folklore but will attempt to keep alive for at leastone more generation some of the wisdom thathelped early settlers prepare for and survive thechallenges that a variable climate provides.
If you have favorite folklore that you wouldlike to share, please submit it in writing (mail ore-mail) to me at the Colorado Climate Center,e-mail address: [email protected] have been collecting Colorado weather lore fornearly 20 years, but there is much that has remainedungathered.
L
Climate MemoriesNolan Doesken
conditions each and every day. Without thesededicated people, we climatologists wouldn’t havemuch to write about.
100 Years Ago – January 1900
The views from the high ground near Limonsouthwest towards Pikes Peak and northwest
towards Denver are littlechanged today from what theywere 100 years ago. But formany parts of Colorado,particularly the transportationcorridors through the mountains,the river valleys, and, of course,the Front Range, old-timers fromthe last turn of the century wouldscarcely recognize our state. Yetwith so many changes, theclimate keeps marching along –always dynamic and dramaticyet always familiar and recog-nizable to the careful onlooker.
Back in January 1900, Colorado was in thethrows of drought. Snowpack in the mountains wasmarginal, at best. South-facing slopes were bare aswere most of the areas above tree line. Precipitationtotals were below average statewide, with themountains particularly dry when compared toaverage. Breckenridge totaled just 0.35 inches ofsnow water content for the month. At mostlocations, only two storm systems droppedmeasurable precipitation all month. Sunshine andwarm temperatures were the rule. January 1900temperatures were above average all across thestate. Of approximately 50 official weather stationsoperating that year, most ended the month 5-6degrees above their average. In the San Luis Valley,temperatures soared to nearly 10 degrees warmerthan the average that had been established fromweather records dating back just a few years. Therewere no subzero arctic airmasses east of themountains all month until a brief cold spell hit latein the month dropping nighttime temperatures justbelow zero. More than likely, few complainedabout the warm, dry weather. That meant lessfirewood to carry and less coal to shovel. Butresidents also knew that the bare mountains couldspell trouble for the coming summer water supplies.
T his section is dedicated to all the Coloradoweather watchers of the past who havehelped measure and record weather

13
Drought in ColoradoNolan Doesken and Tom McKee different indexes and analysis tools in hopes of
finding a simple, descriptive, and consistent way todisplay and discuss drought. After five more yearsof study, we have made great progress but we havenot figured everything out. The hydrologic cyclethat delivers and removes water is remarkablysimple and yet so complex. The variables that wemeasure – precipitation, snow pack, and streamflow – don’t always tell the same story. We’ll neverunderstand everything, but here are some of thethings we have learned.
What We Have Learned about Droughtin Colorado
Climate factors1) Colorado, due to its interior continental
location, is far removed from sources of atmo-spheric moisture. There are three sources ofmoisture that are responsible for most of Colorado’sprecipitation (as shown on map on page 14):
• Winter storm systems with strong westerlywinds aloft bring Pacific moisture into westernColorado and usually drop significant snow onColorado’s mountains.
• Spring storms originate in the Pacific Oceanor form in the Western U.S. Some are large andstrong enough and slow moving such that moisturefrom the Gulf of Mexico is drawn northwestward.These storms can bring widespread and heavyprecipitation from Colorado’s Front Rangeeastward across the high plains.
• During mid and late summer, tropicalmoisture drifts slowly and episodically northward
(continued on page 14)
Horsetooth Reservoirnear Fort Collins, Colo.,December 1977 (photoby Nolan Doesken).Many of Colorado’slarge reservoirs have notbeen drawn down to suchlow levels since the late1970s.
t long last, here is the conclusion to our3-part story on drought that we startedback in 1994. (Refer to February and
March 1994 issues of Colorado Climate for Parts Iand II)
Introductory Comments
Let’s begin by refreshing our memory on whatwe mean by drought. Five years ago we wroteabout the difficulty of defining drought. That is stillthe case today. There is no single quantitativedefinition that satisfies everyone. One can simplythink of drought as periods when water supplies fallshort of the demand. Another way to look at it iswith respect to historical averages. Drought occurswhen precipitation, snow pack, soil moisture,stream flow, reservoir levels, or other measures ofwater supply drop below the expected average farenough and stay below long enough to causeproblems or pose a threat to “normal activities”(whatever that may mean).
Each day without rain or snow may meananother great day for work, recreation, or travel. Itmay also mean the beginning or continuation of adrought. As such, drought may well be one of thetoughest natural disasters that we face. Otherdisasters like tornadoes, hail storms, earth quakes,and floods strike swiftly. They damage ourpossessions, interrupt communication, and destroyinfrastructure. They leave a trail of ruin thatemergency managers and response teams aretrained and capable to deal with. We have learnedto mobilize swift and focused reactions andresponse. Drought, on the other hand, is a non-event. It does not destroy structures or interruptcommunications. It is more about what isn’thappening and what isn’t growing or flowing. It is anon-event. It creeps up on us, disguised as a longperiod of fine weather. Then it nags us withinconvenience or screams at us by way of frustra-tion and lost revenue. We don’t know exactly whenit began and we’re not sure when it’s over. Evenwhen we do recognize it, it often only affectscertain sectors of a community. One person’sdrought is another’s good weather. But eventually,if it lasts long enough and spreads far enough,many share in the misery of not having enoughwater to meet all needs.
For the past several years, we have continuedto analyze historical data. We have looked atprecipitation patterns. We have studied snowaccumulation. Stream flow records have beenexamined. We have continued to develop and test
A

14
into Colorado by way of Mexico. This moisturefuels the afternoon and evening thunderstorms thatcharacterize the summer climate in the mountains.In September and early October, tropical moisturecan also reach Colorado from dissipated Pacifichurricanes.
2) The combination of storm systems andtopography result in precipitation magnitudes thatvary greatly from one part of the state to another.Weather patterns that are favorable to precipitationfor one part of the state are often unfavorable for
year. As a result, the presence or absence of just ahandful of stormy days during the year may be thedifference between drought and generous moisture.
4) Precipitation is more likely to contribute tosoil moisture recharge and runoff at certain times ofyear. Most summer precipitation is quicklyevaporated. Winter precipitation in the mountains ismost often converted to stream flow. Spring storms,and a few autumn storms, provide the mostbeneficial moisture contributing to both soilmoisture and runoff. These storms tend to be largein area, long in duration, and light to moderate inintensity accompanied by cool temperatures andhigh humidity. As a result, they contribute veryeffectively to water supplies.
5) Statistically, precipitation is not “normally”distributed. Since it is zero-bounded, and since non-precipitation days outnumber precipitation days,precipitation distributions are skewed. A few largeevents tend to make “average” precipitation for aday, week, or month higher than the median(midpoint of the distribution) value. This means weare drier than average more often than we arewetter than average.
6) The large variations in dry and wet seasonsin different areas of Colorado, the large variationsin elevation, the effects of elevation on the quantityand seasonality of precipitation, and the fact thatthe fraction of precipitation that falls as snow variesdramatically with elevation (not to mention largedifferences in how much precipitation evaporates,sinks into the ground or runs off into river) resultsin a remarkable picture in which measurements ofprecipitation, high elevation snowpack, and full-basin streamflow don’t always tell a consistentstory. You can’t just look at one element tounderstand drought.
Drought Analysis
1) Some of the most common questions aboutdrought come in the following forms:
• How dry is it now (percent of average,magnitude of precipitation deficit)?
• How large are the areas affected?• When is the last time we were this dry?• How often does it get this dry – what are the
probabilities?• What are our chances of getting better?
Worse?• What is the driest we have ever been?• How long can we stay that dry?• What are the chances of having two or more
very dry years in a row?• Are there predictable drought cycles?2) Precipitation and snowpack analysis with
Drought in Colorado (continued from page 13)
other areas. Highly variable precipitation patternsare not unusual – they are the norm. The time ofyear (seasonality) of precipitation also differsgreatly from one part of Colorado to another.
3) Much of Colorado is semi-arid. In semi-arid climates a small number of storm systemscontribute a large fraction of the precipitation each
Colorado averageannual precipitation andmoisture sources
Number of historicalweather stations used indrought study
Average Annual Precipitation, 1951-80
EXPLANATION
PRECIPITATION,IN INCHES
less than 12
12 to 16
16 to 20
20 to 25
25 to 40
greater than 40

15
respect to historic averages and probabilitiesprovides excellent insight into Colorado’s droughthistory.
3) The Standardized Precipitation Index (SPI),developed at Colorado State University in the early1990s, appears to us to be the simplest yet mostrobust index for describing drought patterns. Indexvalues relate directly to precipitation departuresfrom average, but also show precipitation probabili-ties accurately. The SPI is particularly flexible foradapting to different time scales. While otherindexes may have inherent time scales, the SPI canbe set to accommodate one or a combination oftime scales.
4) Historic data are critical to the successfuldetermination and interpretation of drought. Wemust continue basic and routine measurements ofprecipitation, temperature, snow accumulation, andstreamflow that remain consistent with historicalmeasurements of the past.
Colorado Drought Patterns
Here are a few facts and figures that we havelearned about drought in Colorado. This informa-tion is based on actual observations of precipitationhere in Colorado dating back to 1890. Some areasof the state do not have much data prior to 1920.
1) Drought is a very frequent visitor toColorado.
• Single season droughts with precipitation of75 percent or less of average for one to threemonths in a row occur nearly every year inColorado.
• Based on the Standardized PrecipitationIndex, 3-month droughts with an index value of –1or lower (equivalent to a moderate precipitationdeficit with a probability of occurrence of no morethan 16 percent for any consecutive 3-monthperiod), occurs approximately 90 time in 100 yearsI3 1
16
months (April 1900, May 1935, September 1938)were embedded in long-duration drought episodes.
5) Spatial patterns of drought.• There appears to be no such thing as a
“typical” drought pattern.• Each of the largest and most severe droughts
have had their own uniqueformation and spatial patterns.
• Each region of the state hasits own unique drought historywhich may be similar or totallydifferent from other regions of thestate. Northern Colorado issometimes wet when southernColorado is dry and vice versa.The same is true for east versuswest.
• It is rare for the entire stateto exhibit similar precipitationpatterns for more than a fewmonths in a row. During thewinter of 1995-1996, fiveconsecutive months brought aboveaverage precipitation toColorado’s northern and centralmountains while southern andeastern Colorado remained muchdrier than average. Such persistingpatterns are very unusual.
6) Drought severity – howdry can it get?
• Many areas of Coloradohave gone without any measurableprecipitation for up to 60 consecu-tive days. Long dry periods likethis are most likely in the fall andearly winter. For a six-monthwinter season, 25-40 percent ofthe average accumulated precipita-tion represents an extremely drywinter (October-March). For anentire year, 50-60 percent ofaverage represents an extremedrought year. Two to four monthsin a row with less precipitationthan average is common. Five ormore consecutive months withbelow average precipitation arevery rare. Some weather stationshave never had six or moreconsecutive dry months.
• The following set ofcontour maps (page 18 A-C)shows what the least measuredprecipitation has been, expressed
as a percent of the 1961-1990 average, for A)winter (October-March), B) growing season (April-September), and C) the entire water year (October-September). A set of maps (D-F) is also shown forthe 10 percent probability level (10th percentile).Ninety percent of all years can be expected to havemore precipitation.
• Another way of looking at drought is bydetermining “accumulated deficits.” For example, ifyour average annual precipitation is 16 inches, butyou only received 12 inches, your accumulateddeficit would be 4 inches for that year. When youaccumulate deficits and surpluses year after year,you find that Colorado’s worst droughts reach adeficit of about two full years of average precipita-tion. In Colorado’s northern mountains, and otherareas with more reliable precipitation, accumulateddeficits only reach about 1.2 years of averageprecipitation. For example, if Durango averages 20inches of precipitation per year, a very severemulti-year drought might result in an accumulateddeficit of more than 20 inches over a few years timebefore above average precipitation reduces thosedeficits. (Refer to graph on page 19.)
7) Timing of drought – When does it start?When does it end?
• Short duration droughts can begin and endin any season.
• Major droughts with durations of one yearor longer tend to begin in and end in the season thatis locally the wet season. This varies from place toplace in the state. For example:
• Major droughts in the mountains tend tobegin or end during the winter or spring months. Inextreme southwestern Colorado, significantdroughts have both begun and ended in the fall. Themore dramatic the seasonal precipitation cycle is,the more difficult it is to end a major droughtduring the time of year that is the climatologicaldry season. For example, over eastern Colorado, themonths of December, January, and February are avery dry time of year. The three months combinedproduce, on average, less than 10 percent of theannual precipitation. Rarely does enough precipita-tion fall during this time of year to significantlyalleviate longer-term moisture deficits. However, aweek or two of very wet weather during late springeast of the mountains can bring a major drought toan end. For example, the spring of 1995 and the lastfew days of April 1999 delivered enough precipita-tion to compensate for large deficits.
• Droughts may end abruptly with widespreadheavy rains. For example, the severe drought of1952-1956 was followed by Colorado’s wettestyear on record, 1957. But not all droughts endcompletely and abruptly.
Drought in Colorado – (continued from page 15)

17
8) Does a dry winter foretell a wet summer?There is endless folklore concerning drought.
Even before “El Nino” found its way into climato-logical jargon, people have talked about droughtand drought indicators. Does the climate of oneseason foretell the next? Much folklore wouldsuggest that. Our analyses, however, did not bearthat out. We looked at a number of combinations.What happens after a very dry winter in themountains? What happens after a very dry autumnat lower elevations (such as fall 1999 in Colorado)?We didn’t get fancy and divide years into differentgroupings based on the phase of tropical circula-tions. We just dumped all the data into a pot and letthe numbers fall where they lay. What came outlooked like a bunch of shotgun blasts. In all, lessthan 10 percent of the variance was explained bythe precipitation from the preceding season.Sometimes dry winters in the mountains werefollowed by wet summers (like 1999), but otheryears were different. Sometimes dry springs alongthe Front Range were followed by hot dry summers(like 1954), but other years they weren’t. All in all,the picture was pretty much clear as mud. Without alot more sorting and analyzing, it is not obvious atall that one season helps foretell the next here inColorado.
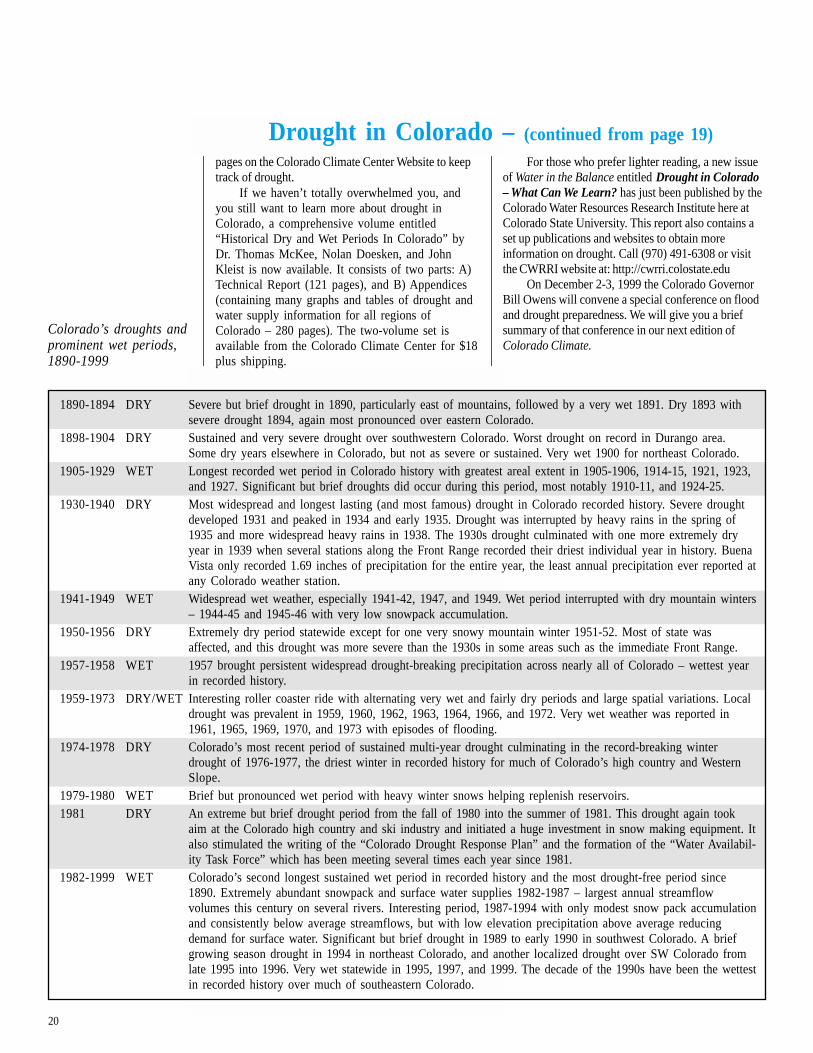
9) Colorado’s droughts and prominent wetperiods, 1890-1999. The entire precipitation historyof Colorado can be summarized into well-defineddry and wet periods. The table is a summary ofColorado’s drought history since 1890 (see page 20).
10) Are there drought cycles?People don’t ask us if there are drought cycles
in Colorado. Most people are positive that there are.Some say there is a 3 year cycle, while others claim7. The sunspot cycle of 11 years has caught somepeople’s attention, while many strongly believe thata 22 year drought cycle (double sunspot cycle)controls Colorado’s drought patterns.
We examined our rainfall records in Coloradoin search of drought cycles, and all I can say is –well, I don’t know. There is some evidence of a twoto three year cycle over portions of southern andeastern Colorado. The dry periods in the 1890s,1930s, 1950s, and again in the 1970s convincedsome observers that the double sunspot cycle reallydoes affect drought patterns in Colorado. Thattheory doesn’t explain why the 1910s were so wet,why parts of the 1960s were very dry, and why wehave been wet for the better part of 18 years in arow, but many still believe it. As for a seven oreleven-year cycle, there isn’t much supportingevidence for that. It is true that dry periods arefollowed by wet, and wet followed by dry? Thatmakes a cycle, doesn’t it? The problem is that thosecycles just aren’t very reliable. As such, they don’t
Fraction of Coloradoin drought, based on3-month SPI
Fraction of Coloradoin drought, based on48-month SPI
(continued on page 18)

18
help us much if at all in predicting what willhappen next year or the year after that. Eventhrowing in the irregular cycle of the El NinoSouthern Oscillation, we are still left with a greatdeal of unexplained variability in our precipitation.
Will Colorado See Drought Again?
We all know the answer to that question. Yes,drought will return. But when? Where? What will itbe like?
We don’t know exactly, but what we havelearned from the past does provide some wisdom tohelp us prepare for the future. Tree ring studies andother paleohydroclimatic investigations by a varietyof scientists (sand dune movements, glacial retreatsand advances, pollens, lake levels, sediments, etc.)all add to the picture.
Colorado has come a long way since the dustbowl years. We manage our crop and grasslandswith soil and water conservation in mind. We storelarge volumes of water from wet years for use indry years, and from wet seasons for use in dryseasons. We divert water from areas with lowerdemands to areas with more population andfarmable lands. Still we know, history has a way ofrepeating itself.
Our study of past droughts has shown that theworst droughts are multi-year droughts. Vegetationdries up, soils blow, stored water reserves aregradually depleted, shallow wells go dry. Whatbegins as a minor inconvenience can, for somepeople, mean economic hardship and eventually theloss of property and livelihoods.
Sometime and somewhere in Colorado aclimatological scenario may unfold that goessomething like this. For two to four years, winterand spring precipitation in Colorado’s mountainswill fall far short of the average. Winter precipita-tion totals of 60 to 70 percent of average in thehigh country will be followed by hot, dry summerson the Eastern Plains and Western Slope. Thecombination of diminished supplies along with
Drought in Colorado – (continued from page 17)
Correlation of summer precipitation (April -September SPI) to previous winter snow (April 1 snowpack)for selected Colorado watersheds from McKee et al, 1999.
San JuanAnimas Rio North Cache Big South
Yampa White Colorado Gunnison Dolores Grande Platte La Poudre Thompson Platte Arkansas
Yampa/White -0.05 0.05 -0.06 0.14 0.09 0.09 0.00 -0.11 -0.12 0.14 0.09Colorado 0.03 0.09 -0.01 0.17 0.09 0.11 0.08 -0.02 -0.08 0.15 0.10Gunnison 0.09 0.14 0.01 0.10 0.05 0.08 0.09 0.03 -0.02 0.07 0.06San Juan/Animas 0.12 0.09 -0.09 -0.03 -0.14 -0.05 0.04 -0.09 -0.08 0.01 -0.06Rio Grande -0.02 0.14 -0.06 0.04 0.00 -0.01 0.01 -0.05 -0.16 -0.07 0.03Upper South Platte 0.17 0.21 0.13 0.34 0.36 0.26 0.14 0.11 -0.03 0.30 0.29Lower South Platte -0.03 0.09 -0.05 0.12 0.14 0.21 0.03 -0.05 -0.08 0.06 0.09Upper Arkansas 0.02 0.15 -0.01 0.12 0.07 0.02 0.02 -0.08 -0.13 0.13 0.00Lower Arkansas 0.11 0.20 -0.01 0.17 0.20 0.18 0.06 0.00 -0.09 0.12 0.11
Apr
il 1
Snow
pack
April -September SPI
Precipitation as apercent of average
A) Driest Winter
B) Driest Summer
C) Driest Water Year
D) Winter PP, 10th Percentile
E) Summer PP, 10th Percentile
F) Water Year, 10th Percentile

19
heavy use of irrigation water will gradually depletesurface reserves and make ground water pumpingmore expensive. The Ogallala aquifer will againshow signs of rapid depletion like it first did in the1960s and 1970s. Dryland vegetation will growshort and sparse. Bare patches will appear on sandysoils. Plant residue on unirrigated crop land willdecrease each year. Despite efforts to retain soilmoisture, crops will suffer and more topsoil willblow. Disputes between water users will increase.Then along will come a winter like the winter of1976-77 with snowpack accumulations less than 50percent of average over most of the Coloradomountains. Spring will not bring its normal seriesof widespread rain and snow storms to the FrontRange and Eastern Plains. A few storms will teaseand appease us, but only a few. For the months ofApril through June, only about half of the averagemoisture will fall. Strong westerly and southwest-erly winds will blow frequently, kicking up moreand more dust as agriculture production falters.Finally, with reservoirs already very low, a long,hot summer will bring frequent temperatures nearor above the 100 degree mark at lower elevations.Forest fires will race through thousands of acres ofdry timber, and clouds of smoke will turn sunsetson the Front Range a deep blood red.
Do you believe this? Will you be ready if itreally does happen? Colorado’s water plannersthink long and hard about drought. They know it isa part of life in the semiarid west. But most of usnever give it a thought. Frankly, we haven’t hadtoo. The last multiyear drought in Colorado endedin the late 1970s, and the last severe and wide-spread year-long drought Colorado ended in 1981.Oh yes, there have been local droughts since then,some quite severe like we saw over southwesternColorado in 1989-1990 and again from the latesummer of 1995 to early 1996. But droughts of thatduration are not uncommon. Overall, since 1982,Colorado has enjoyed the longest spell of wet(compared to historic averages) weather statewidesince the favorably cool and wet period from 1905through 1929 when so much of Colorado wassettled and farmed. For portions of southeasternColorado, the decade of the 1990s is the wettestdecade since weather observations began in the late19th century.
The population of Colorado has growndramatically since 1982. Water is now needed forendangered fish populations, mountain snowmaking, and eager river and reservoir recreationistsas well as for farmers, for hydropower generationand for rapidly growing cities. So far, we have donea fairly good job meeting these diverse demandswhile still delivering the water to downstreamstates prescribed by interstate compacts. We havemet these demands by making changes in water
(continued on page 20)
Average line (in red) is9-year running mean
Accumulatedprecipitation deficit forDurango, CO
management, but most importantly by the abun-dance of water that we have enjoyed. When droughtreturns, and surely it will, how far will we be ableto stretch our water resources?
How to Get More InformationBeginning with the next issue of Colorado
Climate there will be new regular section entitled“Drought Watch.” There we will track the area,duration and severity of drought conditions inColorado in comparison with known droughts ofthe past. We will also work towards a special set of
20
pages on the Colorado Climate Center Website to keeptrack of drought.
If we haven’t totally overwhelmed you, andyou still want to learn more about drought inColorado, a comprehensive volume entitled“Historical Dry and Wet Periods In Colorado” byDr. Thomas McKee, Nolan Doesken, and JohnKleist is now available. It consists of two parts: A)Technical Report (121 pages), and B) Appendices(containing many graphs and tables of drought andwater supply information for all regions ofColorado – 280 pages). The two-volume set isavailable from the Colorado Climate Center for $18plus shipping.
Drought in Colorado – (continued from page 19)For those who prefer lighter reading, a new issue
of Water in the Balance entitled Drought in Colorado– What Can We Learn? has just been published by theColorado Water Resources Research Institute here atColorado State University. This report also contains aset up publications and websites to obtain moreinformation on drought. Call (970) 491-6308 or visitthe CWRRI website at: http://cwrri.colostate.edu
On December 2-3, 1999 the Colorado GovernorBill Owens will convene a special conference on floodand drought preparedness. We will give you a briefsummary of that conference in our next edition ofColorado Climate.
Colorado’s droughts andprominent wet periods,1890-1999
1890-1894 DRY Severe but brief drought in 1890, particularly east of mountains, followed by a very wet 1891. Dry 1893 withsevere drought 1894, again most pronounced over eastern Colorado.
1898-1904 DRY Sustained and very severe drought over southwestern Colorado. Worst drought on record in Durango area.Some dry years elsewhere in Colorado, but not as severe or sustained. Very wet 1900 for northeast Colorado.
1905-1929 WET Longest recorded wet period in Colorado history with greatest areal extent in 1905-1906, 1914-15, 1921, 1923,and 1927. Significant but brief droughts did occur during this period, most notably 1910-11, and 1924-25.
1930-1940 DRY Most widespread and longest lasting (and most famous) drought in Colorado recorded history. Severe droughtdeveloped 1931 and peaked in 1934 and early 1935. Drought was interrupted by heavy rains in the spring of1935 and more widespread heavy rains in 1938. The 1930s drought culminated with one more extremely dryyear in 1939 when several stations along the Front Range recorded their driest individual year in history. BuenaVista only recorded 1.69 inches of precipitation for the entire year, the least annual precipitation ever reported atany Colorado weather station.
1941-1949 WET Widespread wet weather, especially 1941-42, 1947, and 1949. Wet period interrupted with dry mountain winters– 1944-45 and 1945-46 with very low snowpack accumulation.
1950-1956 DRY Extremely dry period statewide except for one very snowy mountain winter 1951-52. Most of state wasaffected, and this drought was more severe than the 1930s in some areas such as the immediate Front Range.
1957-1958 WET 1957 brought persistent widespread drought-breaking precipitation across nearly all of Colorado – wettest yearin recorded history.
1959-1973 DRY/WET Interesting roller coaster ride with alternating very wet and fairly dry periods and large spatial variations. Localdrought was prevalent in 1959, 1960, 1962, 1963, 1964, 1966, and 1972. Very wet weather was reported in1961, 1965, 1969, 1970, and 1973 with episodes of flooding.
1974-1978 DRY Colorado’s most recent period of sustained multi-year drought culminating in the record-breaking winterdrought of 1976-1977, the driest winter in recorded history for much of Colorado’s high country and WesternSlope.
1979-1980 WET Brief but pronounced wet period with heavy winter snows helping replenish reservoirs.1981 DRY An extreme but brief drought period from the fall of 1980 into the summer of 1981. This drought again took
aim at the Colorado high country and ski industry and initiated a huge investment in snow making equipment. Italso stimulated the writing of the “Colorado Drought Response Plan” and the formation of the “Water Availabil-ity Task Force” which has been meeting several times each year since 1981.
1982-1999 WET Colorado’s second longest sustained wet period in recorded history and the most drought-free period since1890. Extremely abundant snowpack and surface water supplies 1982-1987 – largest annual streamflowvolumes this century on several rivers. Interesting period, 1987-1994 with only modest snow pack accumulationand consistently below average streamflows, but with low elevation precipitation above average reducingdemand for surface water. Significant but brief drought in 1989 to early 1990 in southwest Colorado. A briefgrowing season drought in 1994 in northeast Colorado, and another localized drought over SW Colorado fromlate 1995 into 1996. Very wet statewide in 1995, 1997, and 1999. The decade of the 1990s have been the wettestin recorded history over much of southeastern Colorado.

NONPROFITORGANIZATIONU.S. POSTAGE
PAIDFort Collins, Colorado 80523
Permit Number 19
Colorado Climate CenterDepartment of Atmospheric ScienceFort Collins, Colorado 80523-1371
“The SNOW Booklet: A Guide to the Science, Climatology, andMeasurement of Snow in the United States” by Nolan J. Doesken andArthur Judson, January 1997, ISBN # 0-9651056-2-8, Colorado StateUniversity, $17.50 per booklet (includes shipping and handlingcharges).
If you like snow, you’ll like “The SNOW Booklet.” NolanDoesken, Colorado’s Assistant State Climatologist, teamed up withArthur Judson, long-time avalanche forecaster and snow scientistfor the U.S. Forest Service (now retired in Steamboat Springs,Colorado), to compile an extensive but concise assortment ofuseful information about snow.
This is a handy and colorful reference for anyone interestedin snow – weather watchers, skiers, students, science teachers,travelers. If you would like a copy mailed to you, send $17.50(check or money order made out to Colorado State University)to:
Colorado Climate CenterDepartment of Atmospheric ScienceColorado State UniversityFort Collins, CO 80523-1371To order by phone, call Odie Bliss at (970) 491-8545.
Are you a National Weather Service CooperativeWeather Observer who would like a copy of this book?Contact your National Weather Service representative.
Next Issue:
• Where do our climatedata come from?
• Growing season trendsacross Eastern Colorado
• Summary of GovernorOwens’ Flood andDrought PreparednessConference
• Urban Heat Islands – Dothey exist in Colorado?
• Can We PredictColorado Climate in the21st Century?
• Plus our regularfeatures, and more.