colorado bureau of land management social climate
TRANSCRIPT

NORTH CENTRAL CLIMATE SCIENCE CENTER 2017
SPATIAL INDICATORS ANALYSIS 1
INDICATORS STUDY
RESEARCH QUESTIONS:
Which regions (i.e., management areas,
counties, cities) are most economically
dependent upon BLM-managed lands?
What are the primary public land-dependent
livelihoods in each region?
Which regions are likely to be most sensitive to:
o a) climate hazards and variability?
o b) BLM decision-making?
Map 1 - Public lands in Colorado play a major role in the state's economic, cultural, and ecological systems. In the Western half of the state, in particular, lands managed by the Bureau of Land Management (shown above in dark grey) have and will continue to shape the fate of human communities in complex ways.
COLORADO BUREAU OF LAND MANAGEMENT SOCIAL CLIMATE VULNERABILITY ASSESSMENT
SUMMARY OF FINDINGS – INDICATORS ANALYSIS
MAPPING SENSITIVITY TO CLIMATE
STRESSORS AND PUBLIC LANDS
MANAGEMENT With over 40% of the state’s land
surface under management by federal
and state agencies, the fate of
Colorado’s diverse communities and
their economies are inextricably linked
to public land decision-making, be it in
terms of protecting fragile watersheds,
ensuring access for livestock grazing, or
maintaining access for the state’s world
class outdoor tourism industry. For the
Bureau of Land Management, however,
the unique historical, cultural, and
ecological processes that drove the BLM
management mandate’s evolution
requires a more nuanced look at how
human communities across the state
(and beyond) interact with the unique lands and resources
that the BLM oversees.
To support BLM staff at the state- and field office
level understand these complex connections, we examined
a wide array of publicly available and internal BLM datasets
relating to public land, social, and economic indicators of
sensitivity to climate stressors, ecosystem services
provisioning, and public land decision-making, Our goal? To
give managers a view of the characteristics of the
communities that rely upon public lands, both in terms of
their overall ability to withstand increasing stress from
changes in climate and their capacity to engage actively in
the complex work of adapting public land management
practices to environmental transformation. Moreover, we
aimed to do so in a spatially-explicit way, one that reflects
both the uneven distribution of BLM-managed lands across
the state and the highly skewed nature of the state’s
population, wealth, and economic characteristics. Here, we
NORTH CENTRAL CLIMATE SCIENCE CENTER 2017
SPATIAL INDICATORS ANALYSIS 2
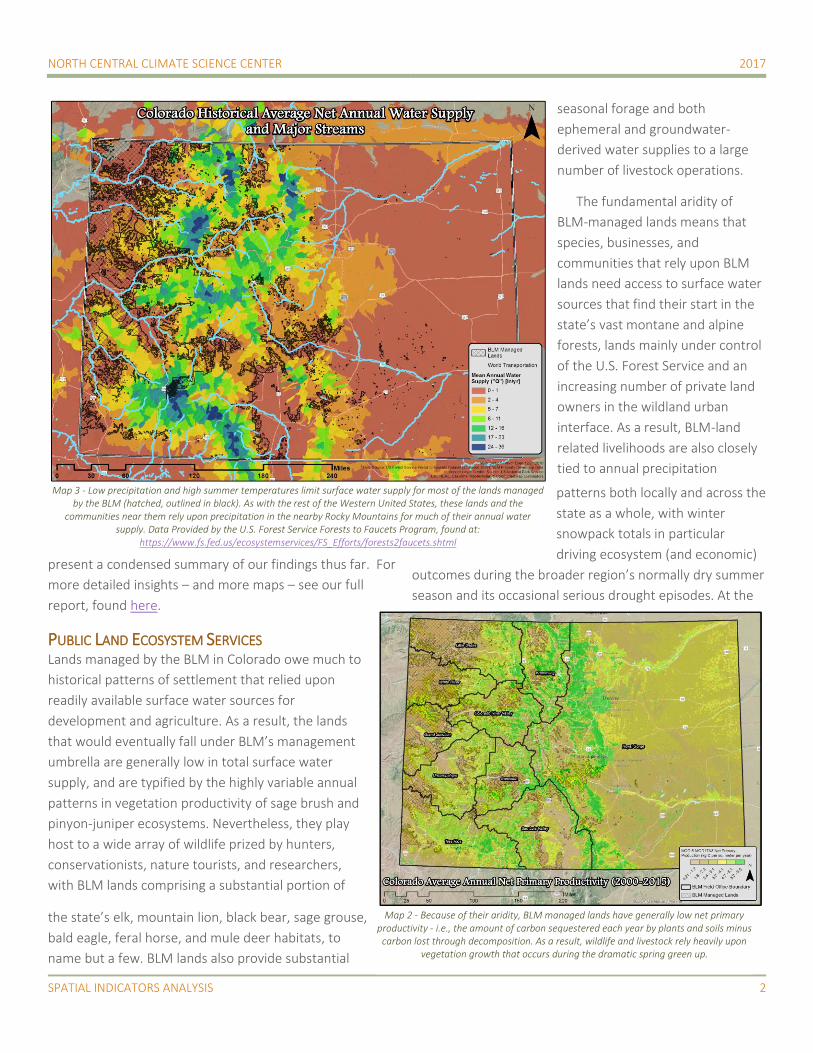
Map 3 - Low precipitation and high summer temperatures limit surface water supply for most of the lands managed by the BLM (hatched, outlined in black). As with the rest of the Western United States, these lands and the
communities near them rely upon precipitation in the nearby Rocky Mountains for much of their annual water supply. Data Provided by the U.S. Forest Service Forests to Faucets Program, found at:
https://www.fs.fed.us/ecosystemservices/FS_Efforts/forests2faucets.shtml
Map 2 - Because of their aridity, BLM managed lands have generally low net primary productivity - i.e., the amount of carbon sequestered each year by plants and soils minus
carbon lost through decomposition. As a result, wildlife and livestock rely heavily upon vegetation growth that occurs during the dramatic spring green up.
present a condensed summary of our findings thus far. For
more detailed insights – and more maps – see our full
report, found here.
PUBLIC LAND ECOSYSTEM SERVICES Lands managed by the BLM in Colorado owe much to
historical patterns of settlement that relied upon
readily available surface water sources for
development and agriculture. As a result, the lands
that would eventually fall under BLM’s management
umbrella are generally low in total surface water
supply, and are typified by the highly variable annual
patterns in vegetation productivity of sage brush and
pinyon-juniper ecosystems. Nevertheless, they play
host to a wide array of wildlife prized by hunters,
conservationists, nature tourists, and researchers,
with BLM lands comprising a substantial portion of
the state’s elk, mountain lion, black bear, sage grouse,
bald eagle, feral horse, and mule deer habitats, to
name but a few. BLM lands also provide substantial
seasonal forage and both
ephemeral and groundwater-
derived water supplies to a large
number of livestock operations.
The fundamental aridity of
BLM-managed lands means that
species, businesses, and
communities that rely upon BLM
lands need access to surface water
sources that find their start in the
state’s vast montane and alpine
forests, lands mainly under control
of the U.S. Forest Service and an
increasing number of private land
owners in the wildland urban
interface. As a result, BLM-land
related livelihoods are also closely
tied to annual precipitation
patterns both locally and across the
state as a whole, with winter
snowpack totals in particular
driving ecosystem (and economic)
outcomes during the broader region’s normally dry summer
season and its occasional serious drought episodes. At the
NORTH CENTRAL CLIMATE SCIENCE CENTER 2017
SPATIAL INDICATORS ANALYSIS 3
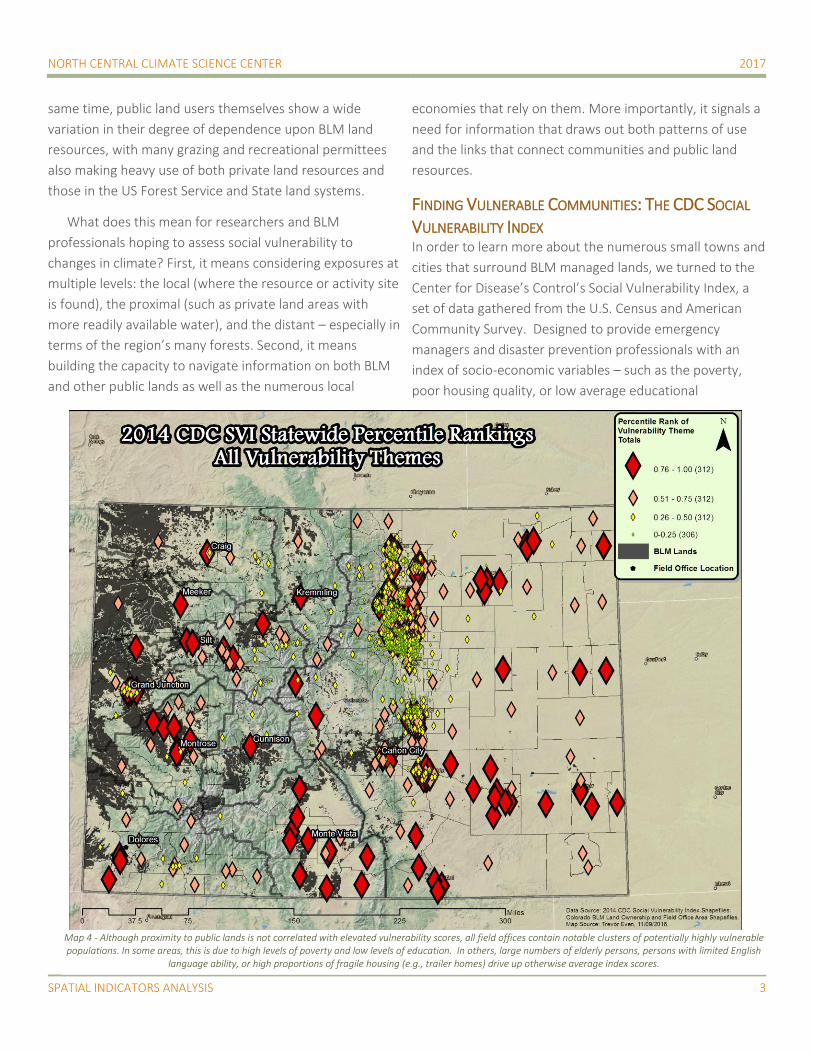
Map 4 - Although proximity to public lands is not correlated with elevated vulnerability scores, all field offices contain notable clusters of potentially highly vulnerable populations. In some areas, this is due to high levels of poverty and low levels of education. In others, large numbers of elderly persons, persons with limited English
language ability, or high proportions of fragile housing (e.g., trailer homes) drive up otherwise average index scores.
same time, public land users themselves show a wide
variation in their degree of dependence upon BLM land
resources, with many grazing and recreational permittees
also making heavy use of both private land resources and
those in the US Forest Service and State land systems.
What does this mean for researchers and BLM
professionals hoping to assess social vulnerability to
changes in climate? First, it means considering exposures at
multiple levels: the local (where the resource or activity site
is found), the proximal (such as private land areas with
more readily available water), and the distant – especially in
terms of the region’s many forests. Second, it means
building the capacity to navigate information on both BLM
and other public lands as well as the numerous local
economies that rely on them. More importantly, it signals a
need for information that draws out both patterns of use
and the links that connect communities and public land
resources.
FINDING VULNERABLE COMMUNITIES: THE CDC SOCIAL
VULNERABILITY INDEX In order to learn more about the numerous small towns and
cities that surround BLM managed lands, we turned to the
Center for Disease’s Control’s Social Vulnerability Index, a
set of data gathered from the U.S. Census and American
Community Survey. Designed to provide emergency
managers and disaster prevention professionals with an
index of socio-economic variables – such as the poverty,
poor housing quality, or low average educational
NORTH CENTRAL CLIMATE SCIENCE CENTER 2017
SPATIAL INDICATORS ANALYSIS 4
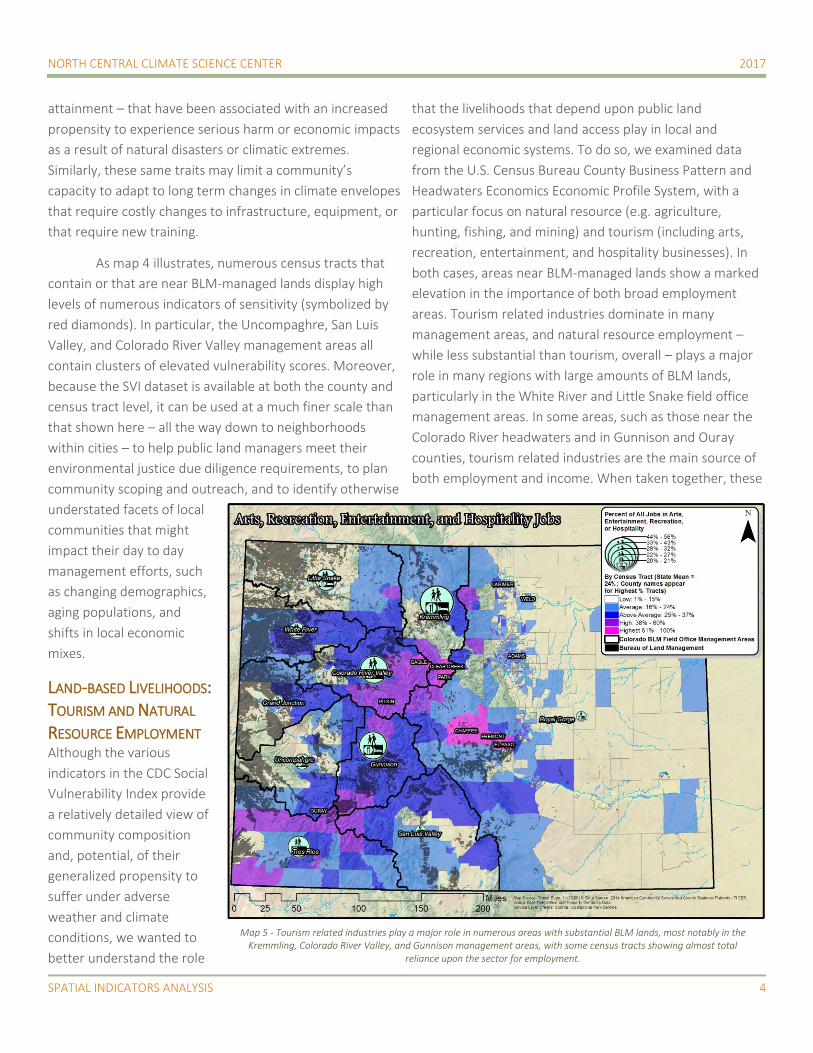
Map 5 - Tourism related industries play a major role in numerous areas with substantial BLM lands, most notably in the Kremmling, Colorado River Valley, and Gunnison management areas, with some census tracts showing almost total
reliance upon the sector for employment.
attainment – that have been associated with an increased
propensity to experience serious harm or economic impacts
as a result of natural disasters or climatic extremes.
Similarly, these same traits may limit a community’s
capacity to adapt to long term changes in climate envelopes
that require costly changes to infrastructure, equipment, or
that require new training.
As map 4 illustrates, numerous census tracts that
contain or that are near BLM-managed lands display high
levels of numerous indicators of sensitivity (symbolized by
red diamonds). In particular, the Uncompaghre, San Luis
Valley, and Colorado River Valley management areas all
contain clusters of elevated vulnerability scores. Moreover,
because the SVI dataset is available at both the county and
census tract level, it can be used at a much finer scale than
that shown here – all the way down to neighborhoods
within cities – to help public land managers meet their
environmental justice due diligence requirements, to plan
community scoping and outreach, and to identify otherwise
understated facets of local
communities that might
impact their day to day
management efforts, such
as changing demographics,
aging populations, and
shifts in local economic
mixes.
LAND-BASED LIVELIHOODS: TOURISM AND NATURAL
RESOURCE EMPLOYMENT Although the various
indicators in the CDC Social
Vulnerability Index provide
a relatively detailed view of
community composition
and, potential, of their
generalized propensity to
suffer under adverse
weather and climate
conditions, we wanted to
better understand the role
that the livelihoods that depend upon public land
ecosystem services and land access play in local and
regional economic systems. To do so, we examined data
from the U.S. Census Bureau County Business Pattern and
Headwaters Economics Economic Profile System, with a
particular focus on natural resource (e.g. agriculture,
hunting, fishing, and mining) and tourism (including arts,
recreation, entertainment, and hospitality businesses). In
both cases, areas near BLM-managed lands show a marked
elevation in the importance of both broad employment
areas. Tourism related industries dominate in many
management areas, and natural resource employment –
while less substantial than tourism, overall – plays a major
role in many regions with large amounts of BLM lands,
particularly in the White River and Little Snake field office
management areas. In some areas, such as those near the
Colorado River headwaters and in Gunnison and Ouray
counties, tourism related industries are the main source of
both employment and income. When taken together, these
NORTH CENTRAL CLIMATE SCIENCE CENTER 2017
SPATIAL INDICATORS ANALYSIS 5
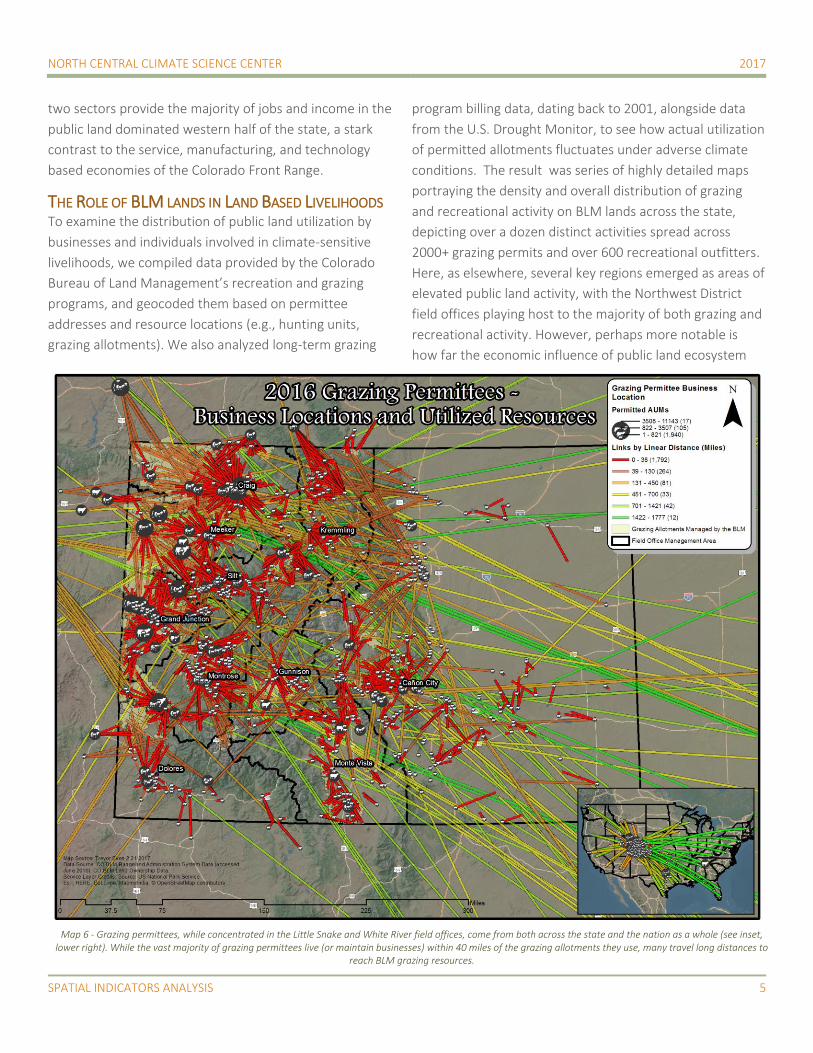
Map 6 - Grazing permittees, while concentrated in the Little Snake and White River field offices, come from both across the state and the nation as a whole (see inset, lower right). While the vast majority of grazing permittees live (or maintain businesses) within 40 miles of the grazing allotments they use, many travel long distances to
reach BLM grazing resources.
two sectors provide the majority of jobs and income in the
public land dominated western half of the state, a stark
contrast to the service, manufacturing, and technology
based economies of the Colorado Front Range.
THE ROLE OF BLM LANDS IN LAND BASED LIVELIHOODS To examine the distribution of public land utilization by
businesses and individuals involved in climate-sensitive
livelihoods, we compiled data provided by the Colorado
Bureau of Land Management’s recreation and grazing
programs, and geocoded them based on permittee
addresses and resource locations (e.g., hunting units,
grazing allotments). We also analyzed long-term grazing
program billing data, dating back to 2001, alongside data
from the U.S. Drought Monitor, to see how actual utilization
of permitted allotments fluctuates under adverse climate
conditions. The result was series of highly detailed maps
portraying the density and overall distribution of grazing
and recreational activity on BLM lands across the state,
depicting over a dozen distinct activities spread across
2000+ grazing permits and over 600 recreational outfitters.
Here, as elsewhere, several key regions emerged as areas of
elevated public land activity, with the Northwest District
field offices playing host to the majority of both grazing and
recreational activity. However, perhaps more notable is
how far the economic influence of public land ecosystem
NORTH CENTRAL CLIMATE SCIENCE CENTER 2017
SPATIAL INDICATORS ANALYSIS 6
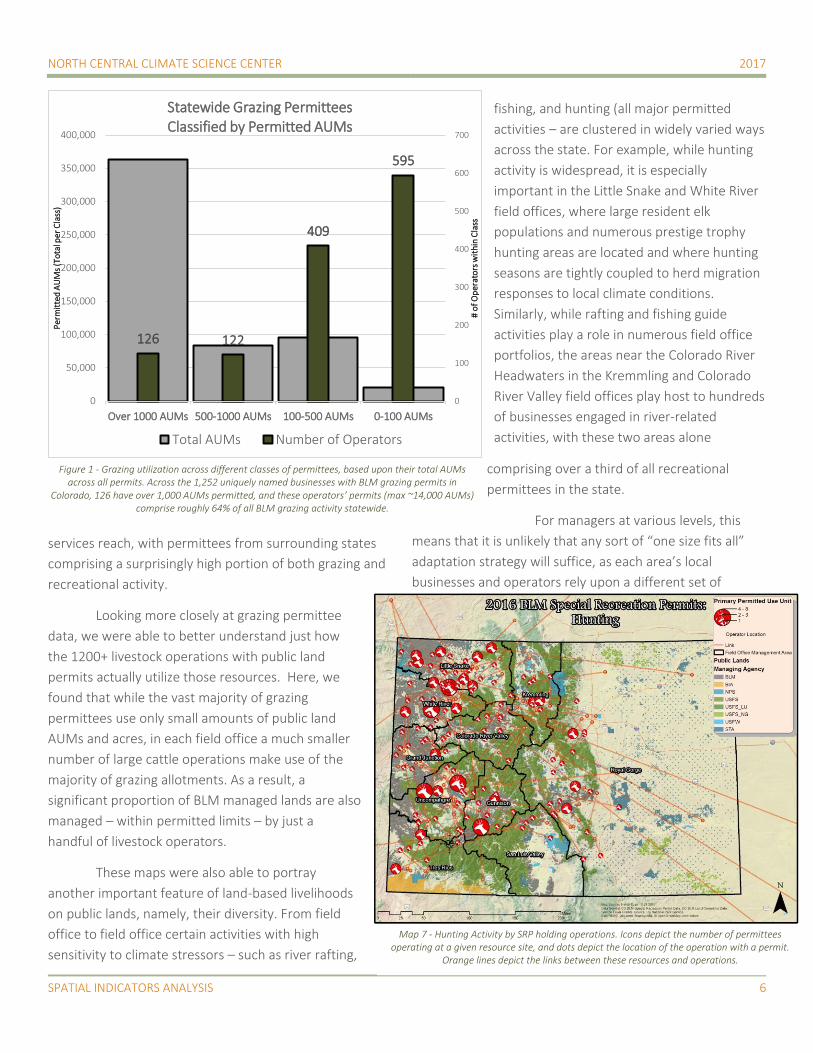
Figure 1 - Grazing utilization across different classes of permittees, based upon their total AUMs across all permits. Across the 1,252 uniquely named businesses with BLM grazing permits in
Colorado, 126 have over 1,000 AUMs permitted, and these operators’ permits (max ~14,000 AUMs) comprise roughly 64% of all BLM grazing activity statewide.
services reach, with permittees from surrounding states
comprising a surprisingly high portion of both grazing and
recreational activity.
Looking more closely at grazing permittee
data, we were able to better understand just how
the 1200+ livestock operations with public land
permits actually utilize those resources. Here, we
found that while the vast majority of grazing
permittees use only small amounts of public land
AUMs and acres, in each field office a much smaller
number of large cattle operations make use of the
majority of grazing allotments. As a result, a
significant proportion of BLM managed lands are also
managed – within permitted limits – by just a
handful of livestock operators.
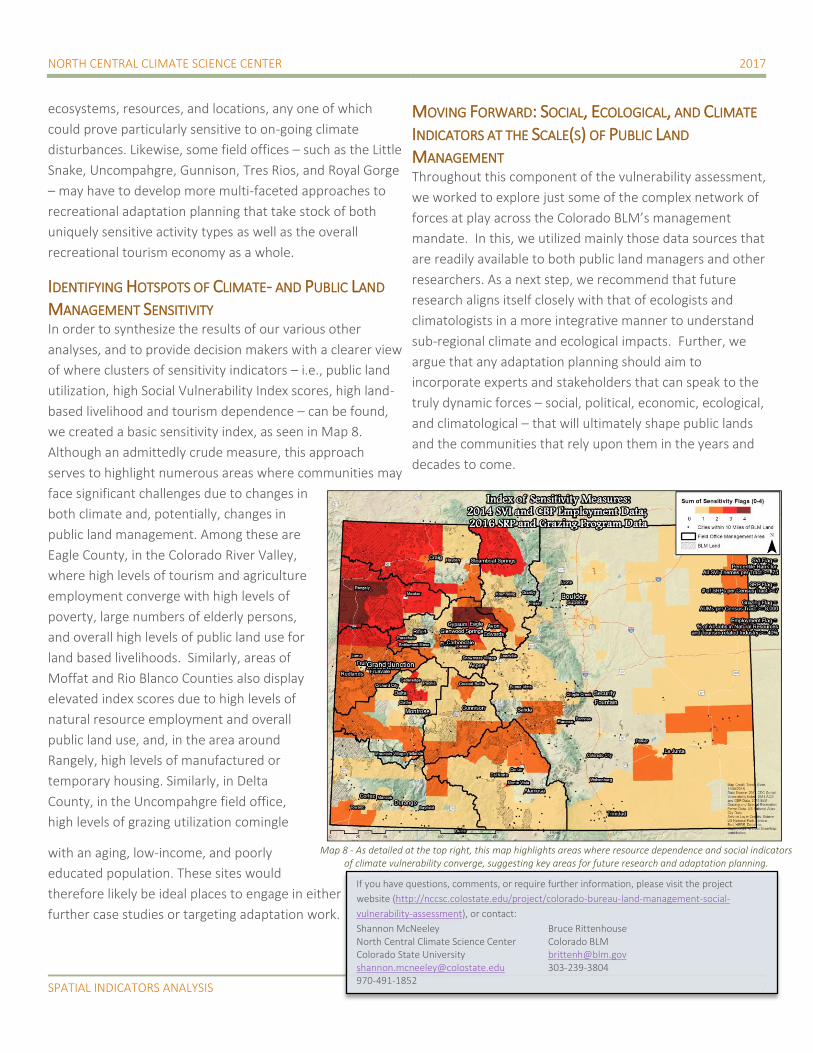
These maps were also able to portray
another important feature of land-based livelihoods
on public lands, namely, their diversity. From field
office to field office certain activities with high
sensitivity to climate stressors – such as river rafting,
fishing, and hunting (all major permitted
activities – are clustered in widely varied ways
across the state. For example, while hunting
activity is widespread, it is especially
important in the Little Snake and White River
field offices, where large resident elk
populations and numerous prestige trophy
hunting areas are located and where hunting
seasons are tightly coupled to herd migration
responses to local climate conditions.
Similarly, while rafting and fishing guide
activities play a role in numerous field office
portfolios, the areas near the Colorado River
Headwaters in the Kremmling and Colorado
River Valley field offices play host to hundreds
of businesses engaged in river-related
activities, with these two areas alone
comprising over a third of all recreational
permittees in the state.
For managers at various levels, this
means that it is unlikely that any sort of “one size fits all”
adaptation strategy will suffice, as each area’s local
businesses and operators rely upon a different set of
126 122
409
595
0
100
200
300
400
500
600
700
0
50,000
100,000
150,000
200,000
250,000
300,000
350,000
400,000
Over 1000 AUMs 500-1000 AUMs 100-500 AUMs 0-100 AUMs
# o
f Op
erat
ors
wit
hin
Cla
ss
Per
mit
ted
AU
Ms
(To
tal p
er C
lass
)
Statewide Grazing Permittees Classified by Permitted AUMs
Total AUMs Number of Operators
Map 7 - Hunting Activity by SRP holding operations. Icons depict the number of permittees operating at a given resource site, and dots depict the location of the operation with a permit.
Orange lines depict the links between these resources and operations.
NORTH CENTRAL CLIMATE SCIENCE CENTER 2017
SPATIAL INDICATORS ANALYSIS 7
ecosystems, resources, and locations, any one of which
could prove particularly sensitive to on-going climate
disturbances. Likewise, some field offices – such as the Little
Snake, Uncompahgre, Gunnison, Tres Rios, and Royal Gorge
– may have to develop more multi-faceted approaches to
recreational adaptation planning that take stock of both
uniquely sensitive activity types as well as the overall
recreational tourism economy as a whole.
IDENTIFYING HOTSPOTS OF CLIMATE- AND PUBLIC LAND
MANAGEMENT SENSITIVITY In order to synthesize the results of our various other
analyses, and to provide decision makers with a clearer view
of where clusters of sensitivity indicators – i.e., public land
utilization, high Social Vulnerability Index scores, high land-
based livelihood and tourism dependence – can be found,
we created a basic sensitivity index, as seen in Map 8.
Although an admittedly crude measure, this approach
serves to highlight numerous areas where communities may
face significant challenges due to changes in
both climate and, potentially, changes in
public land management. Among these are
Eagle County, in the Colorado River Valley,
where high levels of tourism and agriculture
employment converge with high levels of
poverty, large numbers of elderly persons,
and overall high levels of public land use for
land based livelihoods. Similarly, areas of
Moffat and Rio Blanco Counties also display
elevated index scores due to high levels of
natural resource employment and overall
public land use, and, in the area around
Rangely, high levels of manufactured or
temporary housing. Similarly, in Delta
County, in the Uncompahgre field office,
high levels of grazing utilization comingle
with an aging, low-income, and poorly
educated population. These sites would
therefore likely be ideal places to engage in either
further case studies or targeting adaptation work.
MOVING FORWARD: SOCIAL, ECOLOGICAL, AND CLIMATE
INDICATORS AT THE SCALE(S) OF PUBLIC LAND
MANAGEMENT Throughout this component of the vulnerability assessment,
we worked to explore just some of the complex network of
forces at play across the Colorado BLM’s management
mandate. In this, we utilized mainly those data sources that
are readily available to both public land managers and other
researchers. As a next step, we recommend that future
research aligns itself closely with that of ecologists and
climatologists in a more integrative manner to understand
sub-regional climate and ecological impacts. Further, we
argue that any adaptation planning should aim to
incorporate experts and stakeholders that can speak to the
truly dynamic forces – social, political, economic, ecological,
and climatological – that will ultimately shape public lands
and the communities that rely upon them in the years and
decades to come.
Map 8 - As detailed at the top right, this map highlights areas where resource dependence and social indicators of climate vulnerability converge, suggesting key areas for future research and adaptation planning.
If you have questions, comments, or require further information, please visit the project
website (http://nccsc.colostate.edu/project/colorado-bureau-land-management-social-
vulnerability-assessment), or contact:
Shannon McNeeley Bruce Rittenhouse North Central Climate Science Center Colorado BLM Colorado State University [email protected] [email protected] 303-239-3804 970-491-1852