colorado climate - climate.atmos.colostate.educlimate.atmos.colostate.edu/pdfs/fall2000.pdf · ......
TRANSCRIPT

ColoradoClimate
Fall 2000 Vol. 1, No. 4
22 Colorado Climate
Table of ContentsClimate Memories – A Blizzard or Two Is Good for You ............................................................................................ 1
Climate on the Web – Natural Resources Conservation Service ................................................................................. 2
A Time for Time Series – Trends in Observed Solar Energy in Colorado .................................................................. 3
Folklore – Fowl Weather Is Coming ............................................................................................................................. 5
For Teachers – What Can We Learn in the Snow? ....................................................................................................... 6
Colorado Climate in Review ......................................................................................................................................... 8
June 2000 ................................................................................................................................................................... 8
July 2000 ................................................................................................................................................................... 9
August 2000 ............................................................................................................................................................ 10
September 2000 ....................................................................................................................................................... 12
Water Year in Review, October 1999 through September 2000 ............................................................................ 13
Can a Megadrought Occur in Colorado? .................................................................................................................... 17
Colorado NDVI Greeness Images ............................................................................................................................... 19
Climate Data at Work – Snow Loads .......................................................................................................................... 20
Cover Photo: Fall AspenTrees in SouthwesternColorado. Photo by NolanDoesken.
If you have a photo that you wouldlike considered for the cover ofColorado Climate, please submit it tothe address at right. Enclose a notedescribing the contents andcircumstances including location anddate it was taken. Digital photo-graphs can also be considered.Submit digital imagery via attachedfiles to: [email protected] otherwise arranged inadvanced, photos cannot be returned.
ColoradoClimateFall 2000Vol. 1, No. 4
Colorado Climate publication (ISSN 1529-6059) is published four times per year, Winter, Spring,Summer and Fall. Subscription rates are $15.00 for four issues or $7.50 for a single issue.
The Colorado Climate Center is supported by the Colorado Agricultural Experiment Stationthrough the College of Engineering.
Production Staff: Odilia A. P. Bliss and Ann Dummer, Colorado Climate CenterBarbara Dennis and Lisa Schmitz, Publications and Printing
An earlier publication with the same name, “Colorado Climate,” was published monthly from 1977 through 1996 with thesupport of the Colorado Agricultural Experiment Station and the Colorado State University College of Engineering.
Colorado Climate CenterAtmospheric Science Department
Fort Collins, CO 80523-1371
Phone: (970) 491-8545Phone and fax: (970) 491-8293
Roger A. Pielke, Sr.Professor and State Climatologist
Nolan J. DoeskenAssistant State Climatologist
Web: http://ccc.atmos.colostate.edu

Colorado Climate 1
Climate Memories – A Blizzard or TwoIs Good for YouNolan J. Doesken
P art of who I am and who you are comes frommemories and past experiences, both goodand bad. There is nothing like witnessingsevere weather, be it a quaking thunderstorm,
a sudden flood, or a howling blizzard, to make us justa little stronger, a little wiser, and perhaps a bit morehumble.
I don’t mean to say blizzards are good. Lookingback at past blizzards in Colorado, dozens of peoplehave lost their lives along with hundreds of thousandsof livestock since European settlers made their way tothe Great Plains and Rocky Mountains. Hunters,hikers, and skiers sometimes lose their way andoccasionally die as blowing snow obscures friendlylandmarks. As recently as 1997, several people died inthe teeth of an October blizzard.
Last year, 1999, we missed an opportunity tocommemorate one of the Great Plains’ most memo-rable blizzards, “The Blizzard of ’49,” on its 50th
anniversary. Thousands of people in northeastColorado will still be happy to tell you what theyremember from that incredible storm. It would beworth your while to listen to them, too. In Nebraska,that storm still ranks near the top of the list of mostimportant news stories of the 20th Century. Books havebeen written and even a movie or two has beenproduced that captured and shared some of the intenselife-or-death experiences of that early January storm.
Think about your own life. Can you think of ablizzard or awesome snow or ice storm that you stillremember like it was yesterday? I recall one blizzardand two ice storms from my childhood in centralIllinois. Ice storms aren’t a big part of our climate inColorado, but in the Midwest they were nature’s tree(and powerline) pruners. After hours of steady rainfalling from leaden clouds, and temperatures of about28°F with gusty northeasterly winds (I paid attentionto that even as a young child), trees began to bend,sway, and crack. One dared not venture outside nomatter how great the urge. Each crack was like agunshot. The lights flickered and then went out.School was cancelled for what seemed to be months(memories are neat, but not always accurate). For mysisters and I, it was a wonderful time – playing games,assembling puzzles, telling stories, playing piano, andsinging together. When the sun came out two dayslater the landscape was unreal. Natural piles ofjumbled tree branches under each large tree stretchedmuch higher than my head. My path was blocked inall directions but the landscape was beautiful beyondwords – glistening like a million diamonds deliveredas a gift from heaven.
My parents’ memories were a bit different. Myfather recalled sleepless nights as he worried aboutfrozen pipes and fire hazards from lamps and candles.Every hour or two he had to shovel coal into the oldfurnace to keep us from freezing while we childrenjoyfully but naivelylaughed and played. Heremembered the creaksand groans that came fromthe roof, especially as thewind blew. The weight ofseveral inches of ice was aburden that he was notsure the old house couldbear. He remembered allthe crews of men and theirtrucks working day andnight to restore power. Mymother rememberedmelting ice and snow sowe could have water todrink and cook with. Sheremembered scroungingcanned goods and relicsfrom the bottom of thefreezer to keep us all fed.Then, when the tempera-tures warmed a few dayslater but miles and milesof power lines and polesstill laid on the ground,she remembered the bigsale at the grocery storewhere all the meat fromthe “locker” was distributed before it spoiled. Myparents are long gone from this life, but they tookthose memories with them to their final days. Sowill I.
Not all memories need to be of childhood storms.The blizzard of October 1997 is still fresh in my mindand will be for a long time. I can’t tell you the wholestory now. We don’t have enough space here. But I’llstart.
I have always been thrilled by winter storms, butI hate traveling in them. If at all possible, I pay closeattention to weather forecasts and alter my plans ifnecessary so that I am safe at home before a big stormhits. Storms are fun when they can be watched andenjoyed from a safe and warm haven. Such was notthe case that autumn night three years ago. My boss,Tom McKee, his wife, Lee, and I were returning to
(continued on page 4)
1913 snowstorm. Photocourtesy of the ColoradoHistorical Society.
Colorado Climate 1

2 Colorado Climate
Climate on the Web – Natural ResourcesConservation ServiceNolan J. Doesken
s the autumn months pass and winter setsin, this is a great time to practice checkingout mountain snowpack levels andanticipated water supplies. The Natural
Resources Conservation Service websites are greatplaces to go.
For many years, the measurements of snow depthand water content from Colorado’s snowiest locationswere undertaken by teams of snow experts equippedwith special coring tubes and scales who would visitspecial “snow courses” once each month from latewinter through spring. These adventurous folks tookmeasurements on skis, snowshoes, or whatever it tookto get them high into the snow accumulation zones ofthe Rockies. Each month, water planners with theireyes on the mountain snowpack would anxiously awaitthe findings. Things have changed in the world ofsnow surveying in the past 20 years with the help ofSNOTEL (SNOw TELemetry), an automated systemfor measuring snow water content and radioing theresults automatically each day using “meteor burst”communications. Now each of us can track snowpackaccumulations pretty much anywhere in the westernstates all year round from the friendly, warm comfortsof our computer desks. Snow depths, water contents,comparisons with average conditions, historicalanalysis, and predictions of summer water supplies arejust some of the information you will find. There arecountless maps, graphs, and tables of information,many of them right up to this morning’s reports. Quitefrankly, it’s amazing. And if snow isn’t your passion,you can also track reservoir levels and even soilmoisture at sites across the country. Summaries ofclimate information for every county in the countrycan also be selected. If you’re not careful, you couldspend the whole day at this site, so be ready.
My guess is if you love snow, and are interestedin the mountains, you’ll be visiting this site a lot fromnow on.
A
Inch
es
http://www.co.nrcs.usda.gov
Daily precipitation (____)and snow pillow
measurements of Snow WaterEquivalent (____)
compared to average (____)and (____) for the NRCSVail Mountain SNOTEL.
http://www.wcc.nrcs.usda.gov

Colorado Climate 3
A Time for Time Series – Trends in ObservedSolar Energy in ColoradoNolan Doesken
ast issue we showed you long-term trends and variations in thenumber of clear and cloudy days observed at a few Coloradoweather stations. From the 1950s into the 1980s, the number ofcloudy days increased significantly. More recently, that trend
seemed to be leveling out. However, a change in observing proceduresand instrumentation during the 1990s at airport weather stationsinterrupted that time series.
The creation of COAGMET (Colorado Agricultural MeteorologyNetwork) in Colorado about a decade ago inadvertently helped bridgethis chasm. Each of the agricultural weather stations included a low costelectronic sensor for estimating solar energy reaching a horizontalsurface at ground level. While these sensors are not perfectly accurate,they do provide an interesting source of data for observing year to yearvariations in solar energy.
To look for variations in solar energy during the past decade, weselected a few of the stations with the most complete data.
As you can see from these graphs, the most obvious feature is thereliable annual cycle in solar energy. Precipitation totals vary widelyfrom year to year, but solar radiation is almost as stable and predictableas a good hard rock. It’s this cycle that drives the whole global climatesystem. Solar energy reaching the ground is approximately three timesgreater in winter than in summer over Colorado. The rate of change inboth spring and fall is quite remarkable. No wonder the seasonalchanges in weather patterns are so dramatic.
L Solar Radiation (Lngly) Burlington 2, CO
0100200300400500600700800
1992
Jan
May Sep
1993
Jan
May Sep
1994
Jan
May Sep
1995
Jan
May Sep
1996
Jan
May Sep
1997
Jan
May Sep
1998
Jan
May Sep
1999
Jan
May Sep
2000
Jan
May Sep
So
lar
Rad
iati
on
(L
ng
ly
Solar Radiation (Lngly) Center, CO
0100200300400500600700800
1992
Jan
May Sep
1993
Jan
May Sep
1994
Jan
May Sep
1995
Jan
May Sep
1996
Jan
May Sep
1997
Jan
May Sep
1998
Jan
May Sep
1999
Jan
May Sep
2000
Jan
May Sep
So
lar
Rad
iati
on
(L
ng
ly)
Solar Radiation (Lngly) Delta, CO
0
100
200
300400
500
600
700
800
1992
Jan
May Sep
1993
Jan
May Sep
1994
Jan
May Sep
1995
Jan
May Sep
1996
Jan
May Sep
1997
Jan
May Sep
1998
Jan
May Sep
1999
Jan
May Sep
2000
Jan
May Sep
So
lar
Rad
iati
on
(L
ng
ly)
Solar Radiation (Lngly) Dove Creek, CO.
0100
200300400
500600
700800
1992
Jan
May Sep
1993
Jan
May Sep
1994
Jan
May Sep
1995
Jan
May Sep
1996
Jan
May Sep
1997
Jan
May Sep
1998
Jan
May Sep
1999
Jan
May Sep
2000
Jan
May Sep
So
lar
Rad
iati
on
(L
ng
ly)
Solar Radiation (Lngly) Fort Collins 1, CO
100
200
300
400
500
600
700
800
1992
Jan
May Sep
1993
Jan
May Sep
1994
Jan
May Sep
1995
Jan
May Sep
1996
Jan
May Sep
1997
Jan
May Sep
1998
Jan
May Sep
1999
Jan
May Sep
2000
Jan
May Sep
So
lar
Rad
iati
on
(L
ng
ly)
Solar Radiation (Lngly) Olathe, CO
100
200
300
400
500
600
700
800
1992
Jan
May Sep
1993
Jan
May Sep
1994
Jan
May Sep
1995
Jan
May Sep
1996
Jan
May Sep
1997
Jan
May Sep
1998
Jan
May Sep
1999
Jan
May Sep
2000
Jan
May Sep
So
lar
Rad
iati
on
(L
ng
ly)
Solar Radiation (Lngly) Yellow Jacket CO
100
200
300
400
500
600
700
800
1992
Jan
May Sep
1993
Jan
May Sep
1994
Jan
May Sep
1995
Jan
May Sep
1996
Jan
May Sep
1997
Jan
May Sep
1998
Jan
May Sep
1999
Jan
May Sep
2000
Jan
May Sep
Sol
ar R
adia
tion
(Ln
gly)
(continued on page 4)

4 Colorado Climate
Some of the important geographic variations insolar energy across the state also appear in thesegraphs. For example, the Center weather station nearthe middle of the broad San Luis Valley in southcentral Colorado is much sunnier than Fort Collins tothe north. The latitude accounts for some of thisdifference, but there is also a big difference incloudiness between these two sites in both winter andsummer.
Can we look at these graphs and detect anysignificant trends? Well, first of all, nine years is avery short time when it comes to trends. Nine years ofsolar radiation data is enough to get a good idea ofexpected average values and the nature of the annualcycle, but it is not long enough to detect long-termtrends. Furthermore, the low-cost sensors used for thismeasurement may not be stable enough over time todiscern subtle changes. But we can spot some of thesignificant variations that appear from time to timeand have big effects on agriculture. The spring months
of 1995 stand out at most stations. Rather than shootingup in April and May, incoming energy reaching theground remained nearly constant as dense, persistingcloud cover hung over all but extreme southern andsouthwestern Colorado. That year, despite abundantmoisture, crops got off to a terrible start due to the cool,cloudy weather.
There was also an interesting anomaly this pastyear. Usually, solar insolation peaks in June. In 2000,however, there was very little cloudiness in July andmany stations peaked one month later. In fact, theentire summer had more sunshine than normal withonly 1994 showing similar amounts. Both, notsurprisingly, were very dry and hot summers.
If you want to keep an eye on solar radiation inColorado, monitor the COAGMET weather data athttp://ccc.atmos.colostate.edu – click on COAGMET.
P.S. Solar radiation is expressed in a variety ofunits that some find baffling. Here are some of thecommonly used units and their conversions.
A Time for Time Series (continued from page 3)
To convert from To Multiply by
BTU per foot2 Kilowatt-hour per meter2 3.1525 x 10⁻³
BTU per foot2 Kilojoule per meter2 11.349
BTU per foot2 Calorie per centimeter2 (langley) 0.27125
Kilowatt-hour per meter2 Kilojoule per meter2 3600
Kilowatt-hour per meter2 Calorie per centimeter2 (langley) 86.04
Kilojoule per meter2 Calorie per centimeter2 (langley) 0.02390
To derive From Divide by
Colorado. We had been away all week at professionalmeetings and were anxious to get home. It had beenmild when we left Fort Collins several days before andnone of us were dressed for winter. We arrived onseparate flights, but we planned to rendezvous at theairport and drive back to Fort Collins together in theircomfortable 4-wheel drive vehicle.
Both of our planes landed safely at DenverInternational Airport, late but intact. Never before hadI landed in such lousy weather. The plane was nearlyon the ground before we caught our first glimpse ofrunway lights directly below us through the swirlingsnow. We all quietly gave thanks for sophisticatedguidance systems – and divine guidance as we taxiedto the nearly obscured terminal.
The next few hours went from fun and exciting tochallenging, to nerve wracking, to downright scary.Even a good vehicle and excellent highways are no
match for the combination of cold temperatures, heavysnow, and strong winds that turn a lovely snowfall intoa life-threatening blizzard. We thought if we could justget over to I-25 we could follow a semi. Even if it tookextra hours, we’d still be sleeping in our own bedslater that night. That wish never quite came to pass.We almost made it to Longmont when the truck wewere trying to follow decided to quit for the night. In away it was a relief to pull off the road and quit battlingthe hypnotic snowflakes and the wiper blades thatfroze into blocks of ice every few minutes. We sleptfitfully, in 15 to 30 minutes blocks, but we stayedrelatively warm and relatively safe. Every 30 minutesor so we ran the engine just enough to warm up ourfeet and hands. Then we’d shut it down again and tryto sleep. All traffic was stopped. All of us travelerswere humbled captives of the storm.
Blizzard (continued from page 1)
(continued on page 5)

Colorado Climate 5
IFolklore – Fowl Weather Is ComingNolan J. Doesken
weather invariably followed soon behind. Aunt Minerva, the old lady across the street in my home town, would tellus what kind of a winter to expect based on the number of geese we would see, how early in the fall they passedover, and how high they flew. She was convinced that the higher and faster they flew, the harder the approachingwinter would be. Now, those blasted geese are everywhere here in Fort Collins, flying in all directions seeminglyyear round. Why did they quit migrating anyway? Did that mean no more harsh winters?
Here are a few other bits of wisdom that some people have believed strongly based on years of observations.For the most part, the validity of these observations remains unproven.
• “When prairie chickens roost in creek bottoms and timber, expect cold weather.”
• “Robins will perch on the topmost branches of trees and whistle when a storm isapproaching.”
• “A crowing rooster during rain indicates fair weather ahead.” However, “When theroosters go crowing to bed, they will arise with watery head.”
• “When sea gulls fly to land, a storm is on hand.” – either that, or a newlandfill just opened for business.
• “When the woodpecker leaves, expect a hard winter.”
• “Magpies (common here in Colorado) flying and uttering harsh cries predict windyweather.”
• “If chickens go outside in the rain, the rain will last all day. But if they seek shelter, therain will be brief.” I’ve seen this myself, but I don’t think it’s really a forecast. All-dayrains like the spring and autumn “upslope” storms that we sometimes get along theFront Range in Colorado tend to be steady, long-lasting, but quite light in intensity – not heavyenough to scare the chickens back to the coop. Heavier showers, however, like an afternoonthunderstorm, send all of us scurrying. These storms, however, are normally short lived.
These are but a few of the pearls of fowl weather wisdom. If you have weather folklore that youwould like to share with us, we’d love to hear from you. We’ll try to include it in a future issue,along with a discussion of the possible validity.
must admit, I’m not much of a bird watcher. But for thousands of years, some people have been watchingbirds to anticipate changes in the weather. There is a great wealth of weather lore that involves fowl – bothdomestic and wild. As a child, I was thrilled by the migrations of Canada geese over central Illinois. Wewouldn’t see them every year, but when large “Vs” cut through the skies high overhead in the autumn, cold
(continued on page 16)
Blizzard (continued from page 4)Before daybreak the next morning, the visibilities
seemed to improve a bit as the snow diminishedperceptibly. The winds were still strong, and snow stillswirled around us. It took some maneuvering to avoidthe large drifts, but Tom cautiously worked his wayback on the highway. With the illumination ofdaylight, and with hardly anyone else on the Interstate,we made it home in time for breakfast. We were safe.Others did not fare so well. Hundreds of people spentclose to 24 hours on Pena Boulevard caught in deepdrifts near the airport. Had we been just 20 minuteslater leaving the airport, we would have been theretoo. The storm was even worse in southeasternColorado where nearly three feet of wind-driven snowformed huge drifts. In the days that followed, severalbodies were found stuck and frozen in the snow. Forsome, this was their last blizzard.
What blizzards do you remember? Here is a list
of some of Colorado’s mightiest storms as recorded bymore than a century of volunteer weather observersacross the state. By no means is this all the blizzardsand snowstorms, but certainly some unforgettableones.
January 11-13, 1888: An extreme Great Plainsblizzard brought misery and death from Montana andthe Dakotas south into Oklahoma and Texas. Reportsare sketchy, but it appeared that portions of easternColorado experienced windblown snow followed byfrigid cold. Fort Collins reported a temperature of28°F following the storm. The storm was a catastrophefor cattle and sheep ranchers on the plains as hugenumbers of livestock froze to death.
Winter 1899: An incredible barrage of snow-storms totally buried Colorado’s central mountainsduring a 10-week period from late January through
6 Colorado Climate
For Teachers – What Can We Learn in the Snow?Nolan J. Doesken
here are colder places than Colorado andthere are snowier places, too. But ourcombination of mountains, plains, highelevations, and interior continental location
speed will tell you quite a bit about the nature of thestorm and the potential for large accumulations. Fasterfall speeds mean faster accumulations.
You can also guess how long it took the snow toreach the ground. Snow-producing clouds are usuallybetween 2,000 and 15,000 feet above ground.
You can also estimate wind speeds by measuringhorizontal motion of the crystals. Small, light crystalswill be carried along by the wind at speeds nearlyidentical to the wind speed. You can measure thesespeeds in feet or meters per second and then convertthese into miles per hour or kilometers per hour as afun little math problem when you’re back in yourclassroom. A few kids may even like the challenge oftrying to make those conversions in their heads.Remember that if you are working in English units, 60miles per hour is equivalent to exactly 88 feet persecond. So a 10-mile per hour breeze is just under 15feet per second.
Another fun thing to do is to watch how thecrystals fall. Do they fall in a straight line or do theydance about as they fall. The easiest way to evaluatethis is to try to catch them on your tongue. The flakesthat fall erratically are a real challenge for even thequickest catcher. If it is snowing heavily with manyfine crystals, you will catch them on your tongue evenwithout trying. Then your principal may soon dismissschool, as this is a sign of heavy snow.
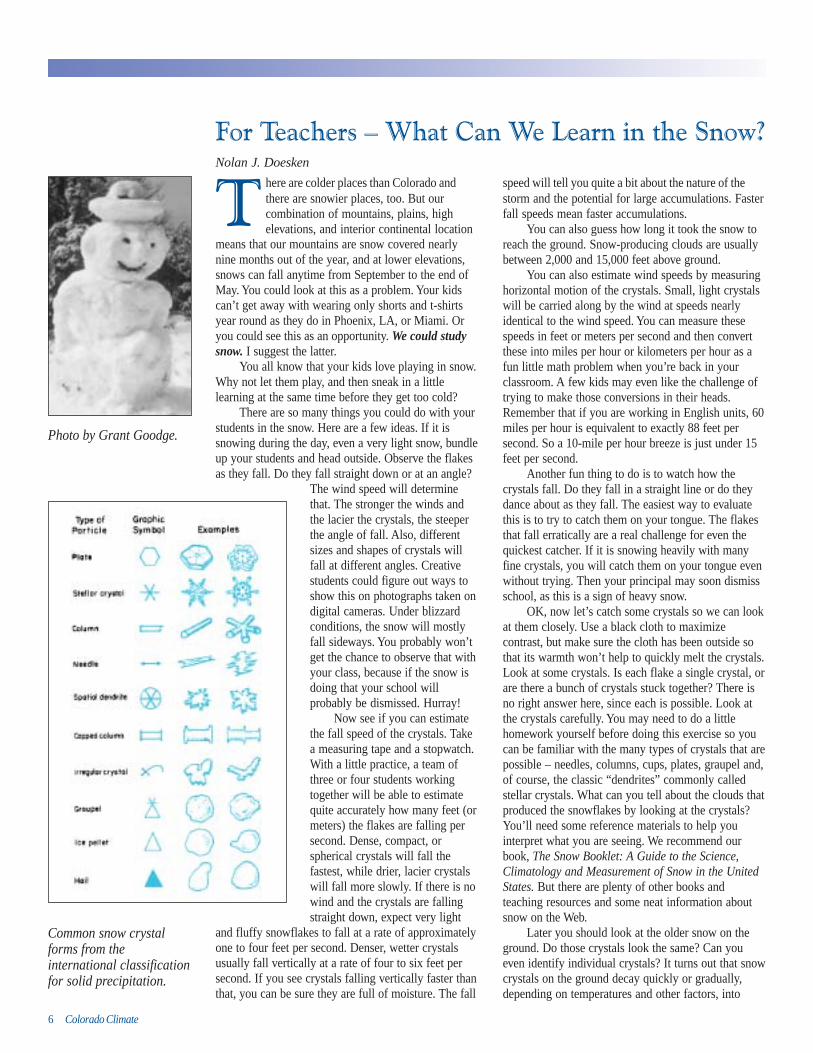
OK, now let’s catch some crystals so we can lookat them closely. Use a black cloth to maximizecontrast, but make sure the cloth has been outside sothat its warmth won’t help to quickly melt the crystals.Look at some crystals. Is each flake a single crystal, orare there a bunch of crystals stuck together? There isno right answer here, since each is possible. Look atthe crystals carefully. You may need to do a littlehomework yourself before doing this exercise so youcan be familiar with the many types of crystals that arepossible – needles, columns, cups, plates, graupel and,of course, the classic “dendrites” commonly calledstellar crystals. What can you tell about the clouds thatproduced the snowflakes by looking at the crystals?You’ll need some reference materials to help youinterpret what you are seeing. We recommend ourbook, The Snow Booklet: A Guide to the Science,Climatology and Measurement of Snow in the UnitedStates. But there are plenty of other books andteaching resources and some neat information aboutsnow on the Web.
Later you should look at the older snow on theground. Do those crystals look the same? Can youeven identify individual crystals? It turns out that snowcrystals on the ground decay quickly or gradually,depending on temperatures and other factors, into
means that our mountains are snow covered nearlynine months out of the year, and at lower elevations,snows can fall anytime from September to the end ofMay. You could look at this as a problem. Your kidscan’t get away with wearing only shorts and t-shirtsyear round as they do in Phoenix, LA, or Miami. Oryou could see this as an opportunity. We could studysnow. I suggest the latter.
You all know that your kids love playing in snow.Why not let them play, and then sneak in a littlelearning at the same time before they get too cold?
There are so many things you could do with yourstudents in the snow. Here are a few ideas. If it issnowing during the day, even a very light snow, bundleup your students and head outside. Observe the flakesas they fall. Do they fall straight down or at an angle?
The wind speed will determinethat. The stronger the winds andthe lacier the crystals, the steeperthe angle of fall. Also, differentsizes and shapes of crystals willfall at different angles. Creativestudents could figure out ways toshow this on photographs taken ondigital cameras. Under blizzardconditions, the snow will mostlyfall sideways. You probably won’tget the chance to observe that withyour class, because if the snow isdoing that your school willprobably be dismissed. Hurray!
Now see if you can estimatethe fall speed of the crystals. Takea measuring tape and a stopwatch.With a little practice, a team ofthree or four students workingtogether will be able to estimatequite accurately how many feet (ormeters) the flakes are falling persecond. Dense, compact, orspherical crystals will fall thefastest, while drier, lacier crystalswill fall more slowly. If there is nowind and the crystals are fallingstraight down, expect very light
and fluffy snowflakes to fall at a rate of approximatelyone to four feet per second. Denser, wetter crystalsusually fall vertically at a rate of four to six feet persecond. If you see crystals falling vertically faster thanthat, you can be sure they are full of moisture. The fall
T
Photo by Grant Goodge.
Common snow crystalforms from theinternational classificationfor solid precipitation.
Colorado Climate 7
(continued on page 18)
forms that look more like little balls of ice. There are alot of physics involved in this process that snowscientists refer to as “metamorphosis.” And youthought only butterflies did that. Not all your studentswill be interested, but you can at least get themthinking by asking them to recall how the snow feelsas they walk through it and how it changes from day today. You’ll realize that at first the fresh snow may belike soft powder, but later it becomes harder and icier.Sometimes you can even walk on top of the snowwithout breaking through.
How snow crystals change in deep layers ofaccumulated snow up in the mountains is somethingthat avalanche scientists study and watch verycarefully. You may or may not know this, but Coloradohas more fatalities from avalanches than any otherstate. If your school is in or near the mountains, youmay have an avalanche expert nearby who could cometalk to your class about the amazing characteristics ofsnow crystals. It isn’t just the depth of snow thatcauses avalanches, but changes of these crystals incertain layers that make the snowpack unstable andvulnerable to avalanches. The sooner your snow-loving adventurers find out about this, the better. Itcould save their lives.
Have everyone gather around you and cup yourhand to your ear. Ask all of your students to listencarefully. What do you hear? Are sound wavesaffected by snowfall? When snow is falling, and whenthe ground is coated by fresh snow, sound waves tendto be quickly absorbed. A car traveling down thenearby road may scarcely be audible. Part of the magicof fresh snow is the silence that accompanies it. Later,after the snow ends and the snow settles and compacts,the characteristics of sound begin to change. The snowno longer muffles sound. In fact, sounds may seem totravel much further than usual. This may be due, inpart, to the smooth surface of older snow that mayhelp to uniformly reflect sound waves. But it isprobably some of the indirect effects of snow that havethe largest impact on sound. The air tends to remainvery cold just above snow-covered surfaces causingwhat we call “temperature inversions” where tempera-tures are coldest near the ground and increase withheight above the ground. Winds will tend to be calmerat ground level in the presence of temperatureinversions. Calm winds mean no sounds from wind,which makes it possible to hear other sounds moreclearly. Cold air is also denser than warmer air. Soundtravels more efficiently in a denser medium.
My goodness, we forget the basics. If possible,have your kids measure snow. The fundamentalclimatological measurements of snow consist of depthof fresh snow, water content of fresh snow, total depthof both new and old snow, and its total water content.Weather observers throughout the U.S. measure theaccumulation of fresh snow each day using thesimplest of tools – a ruler or yardstick. The U.S.
continues to take measurements in English units, butsomeday that should change.
Measuring the depth of fresh snow seems so easy,and it is. All you have to do is stick a ruler in the snowand measure the depth, right? That’s right, and whenthe winds have been calm, the skies cloudy, and thetemperature well below freezing we could all go outwith our rulers and come up with about the sameanswer. However, part of the exciting mystery of snowis its mobility. It doesn’t stay put. When the windblows, snow moves. It swirls about and landsunevenly. Windblown snow is compacted, while snowfalling in protected locations remains more fluffy anduncompacted. Furthermore, snow changes with timeas crystal structures deep within the snow graduallychange. Just because you had six inches of snow onthe ground last night doesn’t mean you’ll still find sixinches this morning. And then, of course, there is thematter of melting. Snow can melt from beneath, if theground is warm, even when the air is well belowfreezing. Likewise, snow can melt from the top assoon as the sun hits it, especially if dirt or other darkobjects stick up through the snow to absorb solarenergy. Winds and moist air will also hasten snowmelt.What this all means is that measuring snow is likeshooting at a moving target.
How much time you will spend measuring snowprobably depends on how much you like snowyourself. The simplest exercise is simply to have eachstudent measure the total depth of snow with a yard/meter stick but from different locations around theschool. You could even make a local map of snowdepth around your school and discuss the windpatterns, ground surfaces and slopes, buildinglocations and vegetation patterns that contribute to theobserved snowfall pattern. Then you could have your
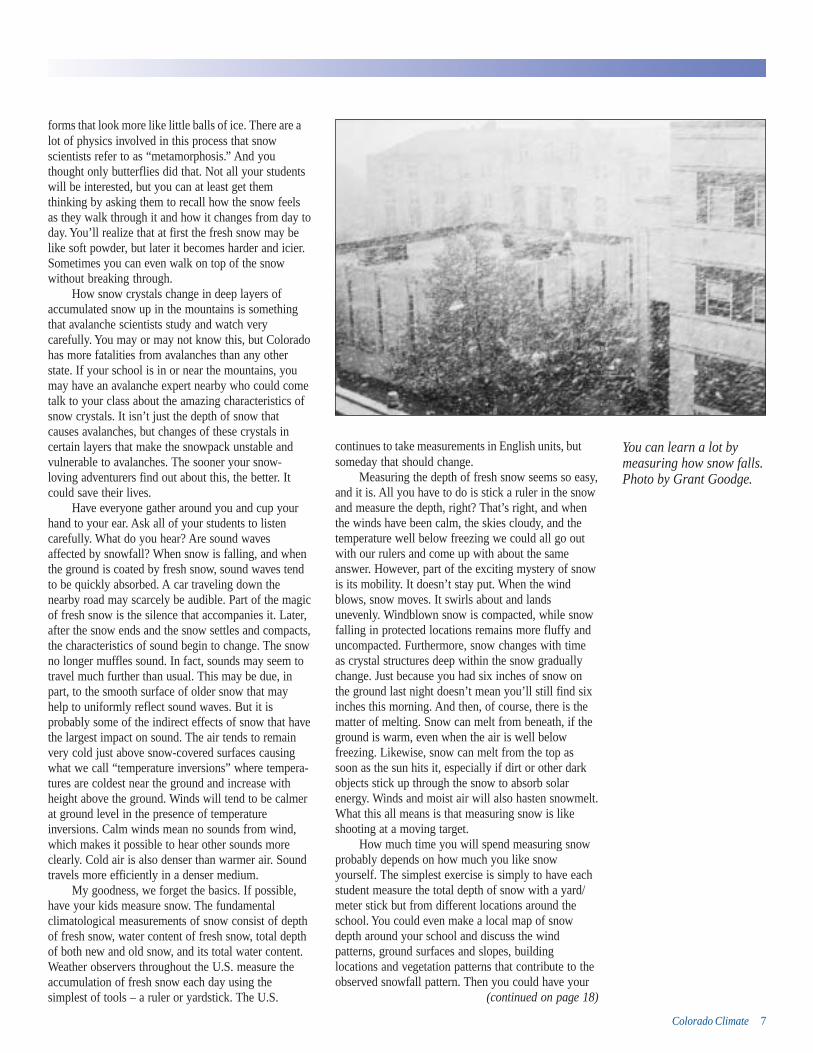
You can learn a lot bymeasuring how snow falls.Photo by Grant Goodge.
8 Colorado Climate
Colorado Climate in Reviewwinds, only to be extinguished by a surprise late seasonsnowfall.
PrecipitationPrecipitation totals for June were less than
average over most of Colorado. Much of easternColorado received less than half of the June average,as did portions of the Western Slope. Several weatherstations in eastern Colorado and on the Western Slopemeasured less than 0.50 inches for the month. With thefrequent dry winds, this was scarcely enough moistureto moisten the soil or grow any grass. But not all areaswere dry. Frequent showers late in the month left someareas of southern Colorado above average. Someweather stations in the central mountains also werewetter than average. Vail received over two inches,most of which fell in the last half of the month.
TemperatureEarly in the month it looked like Colorado was on
its way to a real scorcher as temperatures climbed wellinto the 90s on several days. However, several strongcold fronts brought periods of sharply cooler tempera-tures with highs only in the 50s and 60s later in themonth over eastern Colorado and the Front Range.The result was near average temperatures for themonth as a whole over eastern Colorado while thewestern half of the state ended up two to three degreesabove average.
June Daily Highlights1-5 Generally dry and hot over western Colorado
but pleasantly cool but windy east of themountains except on the 3rd when temperaturessoared briefly.
6-8 Hot and dry statewide. The remnants of themountain snowpack melted quickly underbright sunshine and mountain temperatures inthe 70s. The Steamboat Springs weather stationhit 90°F on the 7th. Clouds and winds increasedin western Colorado on the 8th.
9-10 A cold front swept across the state bringingrelief from the early heat but with only a fewlight showers, mostly in the mountains.
11-15 Low humidity and high winds helped two forestfires along the Front Range to spread rapidly,consuming dozens of homes west of Lovelandand southwest of Denver. The fires spread mostrapidly on the 12th and 15th when temperatureswere highest and relative humidity fell to 10percent or less.
16-17 A strong cold front swept southward across thestate late on the 15th with 40-50 m.p.h. windsand with temperatures dropping 30-40 degrees.Little or no precipitation accompanied the front,
June 2000Climate in Perspective
June was topsy-turvy with strong winds and hugeswings in temperature, especially east of the moun-tains. Early June, normally cool and damp, was veryhot and dry. Late June, normally hot and dry, was cooland damp. Despite a strong jet stream and severalpronounced storm systems, hail and tornadoes werefew. In fact, northeast Colorado, which is accustomedto severe storms in June with generous rainfall to helpcrops grow, experienced one of the driest Junes inrecorded history with very little severe weather.Particularly noteworthy were a pair of very large forestfires in the Front Range foothills (the High Meadowsfire southwest of Denver and the Bobcat Gulch firewest-northwest of Loveland) which erupted early inJune and spread rapidly in the face of parched swirling
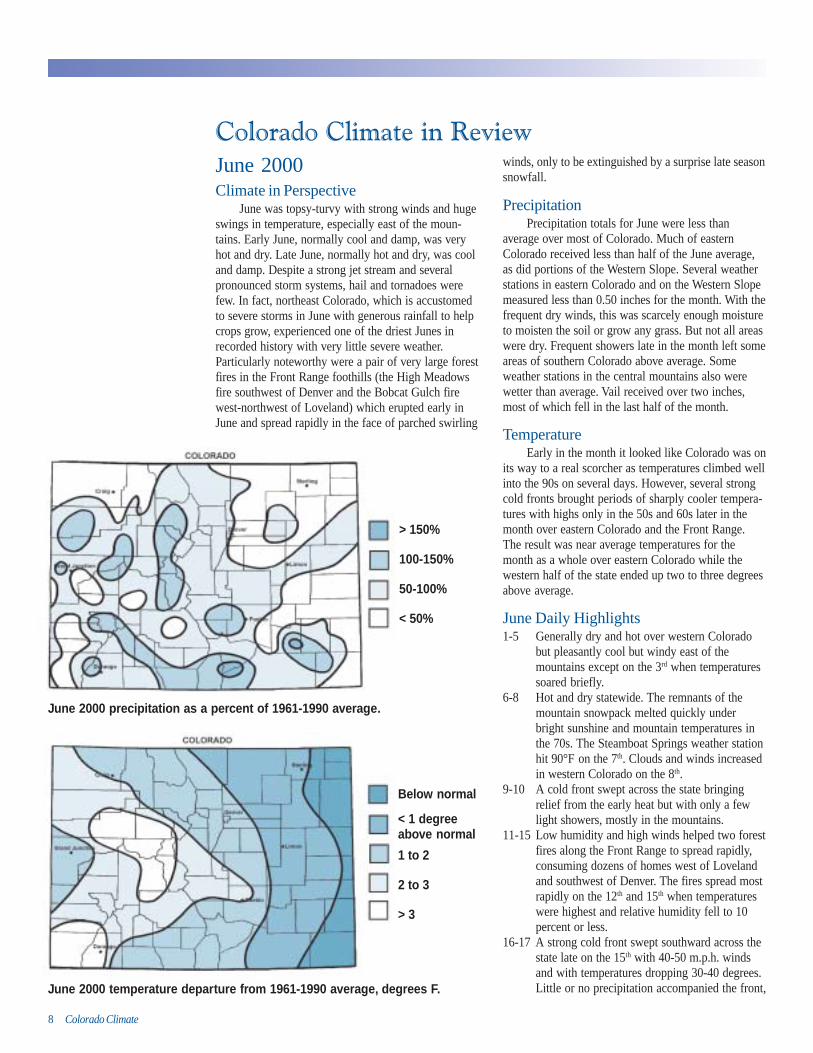
June 2000 precipitation as a percent of 1961-1990 average.
June 2000 temperature departure from 1961-1990 average, degrees F.
> 150%
100-150%
50-100%
< 50%
Below normal
< 1 degreeabove normal
1 to 2
2 to 3
> 3

Colorado Climate 9
but low clouds and drizzle developed later on the16th over northern Colorado increasing to asteady, cold rain which eventually turned tosnow in the northern mountains and easternfoothills early on the 17th, mercifully bringingthe fires under control.
18-19 A large trough of low pressure crossed the statebringing cool and unsettled weather. Precipita-tion was widespread over northwest Coloradobut dissipated as it crossed the mountains.Meeker picked up over an inch of moisture andthree-quarters inch hail on the 19th.
20-21 Mostly dry but cool.22-24 Warmer with weakening winds aloft and
increasing humidity. A few severe thunder-storms developed over eastern Colorado on the22nd.
25-26 Chilly air from the north collided with warmmoist air from the south to produce the onlywidespread precipitation event of the month. Afew stations in southeastern Colorado receivedover an inch of rain on the 26th.
27-30 Conditions remained unsettled, with scatteredthundershowers each day, especially oversouthern Colorado. Temperatures graduallymoderated and returned to average by the endof the month.
June 2000 Monthly ExtremesJune 2000 Monthly ExtremesJune 2000 Monthly ExtremesJune 2000 Monthly ExtremesJune 2000 Monthly ExtremesDescriptionDescriptionDescriptionDescriptionDescription StationStationStationStationStation ExtremeExtremeExtremeExtremeExtreme DateDateDateDateDatePrecipitation (day): LaJunta 20S 1.62" Jun 27Precipitation (total): Flagler 3.21"High Temperature: Yuma 105°F Jun 7Low Temperature: Sargents 19°F Jun 20
July 2000Climate in Perspective
July is normally the hottest month of the year,and that was certainly the case in 2000. A large high-pressure ridge stayed in the region for most of themonth. Daytime temperatures climbed into the 90s atlower elevations nearly every day but dropped backinto the 50s and lower 60s by morning. July is also thewettest month of the year based on total statewideprecipitation, but not this year. Thunderstormsdeveloped on many days, but widespread precipitationwas limited to a brief period in mid July.
PrecipitationSome of Colorado’s eastern plains received
much-needed moisture in July. From Yuma south toSpringfield, many locations got at least 3 inches ofrain. Yuma’s 4.91" total was the greatest in the state,although 3.70" fell in just one day. A few areas ofcentral Colorado also got more rainfall than average.
For most of the state, however, July was drier thanaverage. Much of the Western Slope as well asnortheastern Colorado were extremely dry. TheGreeley station on the campus of the University ofNorthern Colorado reported just 0.36 inches for themonth, the second driest July in 31 years of record.
TemperatureTemperatures for July were above average
statewide. The warmest areas, compared to average,were found over northeastern Colorado and overextreme southwestern counties. Denver, Boulder,Greeley, Fort Morgan, and Sterling all ended up atleast three degrees F above average. No new recordhighs were set, but above-average temperaturespersisted day after day. Denver, for example, saw themercury reach 90°F or greater on 25 days in July.
Statewide Average Daily Precipitationgraph(s) (above and throughout this article)shows relative amounts of precipitation foreach region. Label on each column indicatespercent of stations with measurableprecipitation for each day.
July 2000 precipitation as a percent of 1961-1990 average.
> 150%
100-150%
50-100%
< 50%

10 Colorado Climate
July Daily Highlights1-7 Hot and dry with southwesterly winds aloft.
Isolated thunderstorms developed most days butproduced little rain. However, a storm managedto drop nearly two inches of rain and large hailon Lamar late on the 2nd. The 4th of July wassunny and appropriately hot and dry. Athunderstorm east of Sterling dropped a largetornado near Fleming/Dailey on the evening ofthe 5th, causing significant local damage.
8-9 A pulse of tropical moisture moved intoColorado from Arizona and New Mexicotriggering numerous thundershowers over andnear the mountains.
10-12 Hot weather continued with scattered thunder-storms primarily east of the mountains. Largehail fell at Eckley on the 10th, and the Puebloairport got 1.95 inches of rain on the 11th.
13-15 Mostly dry and hot statewide.16-17 A cold front brought a much-appreciated break
in the hot weather over much of Colorado andalso triggered widespread and locally heavyrains. A few tornados were spotted over
northeastern Colorado. The heaviest rains of thesummer fell east of the mountains. Manylocations on the plains picked up at least aninch of rain, while temperatures only reachedinto the 60s and 70s over northeast Colorado onthe 17th.
18-21 Dry over western Colorado with seasonallywarm temperatures statewide. Scattered andlocally heavy storms developed east of themountains, most numerous 19-20th. Yumapicked up 3.70" from a local downpour.
22-26 Continued quite hot with high-based afternoonthundershowers producing little rainfall. Amajor wildfire erupted in Mesa Verde NationalPark closing the park and spreading a largeplume of smoke over the region.
27-31 High pressure aloft shifted westward givingmost of Colorado northerly winds aloft. Smokefrom large forest fires elsewhere in the Westcovered Colorado in a thickening haze. A fewthundershowers developed each day, but littlerain reached the ground.
July 2000 Monthly ExtremesJuly 2000 Monthly ExtremesJuly 2000 Monthly ExtremesJuly 2000 Monthly ExtremesJuly 2000 Monthly ExtremesDescriptionDescriptionDescriptionDescriptionDescription StationStationStationStationStation ExtremeExtremeExtremeExtremeExtreme DateDateDateDateDatePrecipitation (day): Ralston Res. 3.72” Jul 17Precipitation (Total): Yuma 4.91High Temperature: Las Animas 106°F Jul 4
Ordway 106°F Jul 7Low Temperature: Sargents 24°F Jul 4
August 2000Climate in Perspective
Smoke-covered skies gave visual evidence to themany large forest fires that burned out of controlduring August over Montana, Idaho, and other westernstates. Fires continued to burn early in the month onMesa Verde, but Colorado was spared the worst of itdespite continued hot and dry weather. Humidityincreased in mid August, and afternoon thundershow-ers developed each day during the last half of themonth bringing at least temporary relief to what wasotherwise one of the hottest and driest summers thatColorado had experienced in several years.
PrecipitationRainfall patterns in August were spotty, but wet
areas outnumbered the dry by almost two to one.Some parts of southeastern Colorado recorded lessthan 25 percent of the average August precipitationwhile areas from Colorado Springs and Denvernortheast to Fort Morgan were much wetter thanaverage. The Sedgwick-Julesburg area of northeasternColorado, severely impacted by drought this year,finally received beneficial rains. Except for extreme
July 2000 temperature departure from 1961-1990 average, degrees F.
> 2 degreesabove normal
0 to 2degrees

Colorado Climate 11
northwestern Colorado, the majority of the mountainsand western valleys were wetter than average.
TemperaturesThe hot summer of 2000 continued well into
August. Daily maximum temperatures reached orexceeded 90°F in Denver 15 out of the first 16 dayshelping establish a new record for the most days in ayear with temperatures of 90 or higher. The entire stateended up three to five degrees above the 1961-1990average with the warmest areas in extreme eastern,southwestern and northwestern Colorado.
August Daily Highlights1-3 Mostly dry and very hot, especially over
western Colorado. Hayden hit 95°F and Meekerclimbed to 98°F on the 1st. A few isolatedthundershowers developed. Visibilities werereduced as smoke from western forest firescrossed the state.
4-5 Temperatures dropped slightly as an upper-leveldisturbance triggered some thunderstorms. FortMorgan received 1.89" from a storm on the 4th.Crested Butte picked up 1.69" from a heavylocalized storm.
6-11 Hot and dry weather persisted with occasion-ally smoky skies.
12-16 More hot weather with temperatures stillflirting with the 100°F mark. Holyoke hit 104°Fon the 14th and Lamar followed with a 105°Freading on the 15th. Moisture increased overwestern Colorado fueling afternoon showersand thunderstorm from the mountains west-ward. Leadville recorded 1.10" of rain on the13th.
17-18 Cooler statewide with more widespread showeractivity. Parts of Aurora received over 3" of rainin two days with locally heavier amounts. Afurious storm brought hail, high winds and2.65" of rain to Fort Carson (south edge ofColorado Springs).
August 2000 precipitation as a percent of 1961-1990 average.
August 2000 temperature departure from 1961-1990 average, degrees F.
August 2000 Monthly ExtremesAugust 2000 Monthly ExtremesAugust 2000 Monthly ExtremesAugust 2000 Monthly ExtremesAugust 2000 Monthly ExtremesDescriptionDescriptionDescriptionDescriptionDescription StationStationStationStationStation ExtremeExtremeExtremeExtremeExtreme DateDateDateDateDatePrecipitation (day): Colo. Spgs. 2.99” Aug 28Precipitation (total): Bonham Res. 6.80”High Temperature: John Martin 106°F Aug 16
DamLow Temperature: Meredith 26°F Aug 19
19-28 Not too hot but still consistently above averagewith numerous thundershower developmenteach day. Some of the storms dropped locallyheavy rains such as the 1.52" rainfall at Hollyon the 20th and 2.99" at Colorado Springs on the29th. Finally, the forest fire danger began tosubside across the state.
29-31 A weak cold front dropped temperatures a bitand brought a faint hint of the approach ofautumn. Daily convective showers continued
> 200%
150 - 200%
100-150%
50-100%
< 50%
> 4 degreesabove normal3 to 4degrees
12 Colorado Climate
especially over and near the mountains. YellowJacket picked up over two inches of rain in twodays.
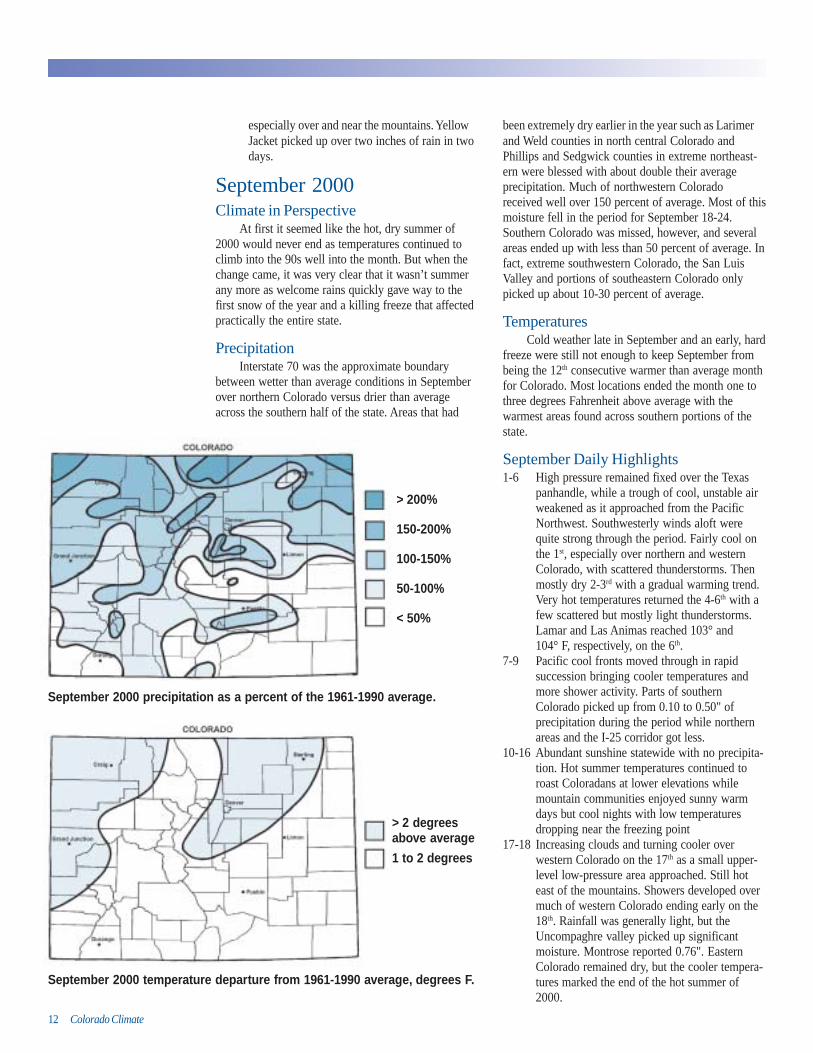
September 2000Climate in Perspective
At first it seemed like the hot, dry summer of2000 would never end as temperatures continued toclimb into the 90s well into the month. But when thechange came, it was very clear that it wasn’t summerany more as welcome rains quickly gave way to thefirst snow of the year and a killing freeze that affectedpractically the entire state.
PrecipitationInterstate 70 was the approximate boundary
between wetter than average conditions in Septemberover northern Colorado versus drier than averageacross the southern half of the state. Areas that had
been extremely dry earlier in the year such as Larimerand Weld counties in north central Colorado andPhillips and Sedgwick counties in extreme northeast-ern were blessed with about double their averageprecipitation. Much of northwestern Coloradoreceived well over 150 percent of average. Most of thismoisture fell in the period for September 18-24.Southern Colorado was missed, however, and severalareas ended up with less than 50 percent of average. Infact, extreme southwestern Colorado, the San LuisValley and portions of southeastern Colorado onlypicked up about 10-30 percent of average.
TemperaturesCold weather late in September and an early, hard
freeze were still not enough to keep September frombeing the 12th consecutive warmer than average monthfor Colorado. Most locations ended the month one tothree degrees Fahrenheit above average with thewarmest areas found across southern portions of thestate.
September Daily Highlights1-6 High pressure remained fixed over the Texas
panhandle, while a trough of cool, unstable airweakened as it approached from the PacificNorthwest. Southwesterly winds aloft werequite strong through the period. Fairly cool onthe 1st, especially over northern and westernColorado, with scattered thunderstorms. Thenmostly dry 2-3rd with a gradual warming trend.Very hot temperatures returned the 4-6th with afew scattered but mostly light thunderstorms.Lamar and Las Animas reached 103° and104° F, respectively, on the 6th.
7-9 Pacific cool fronts moved through in rapidsuccession bringing cooler temperatures andmore shower activity. Parts of southernColorado picked up from 0.10 to 0.50" ofprecipitation during the period while northernareas and the I-25 corridor got less.
10-16 Abundant sunshine statewide with no precipita-tion. Hot summer temperatures continued toroast Coloradans at lower elevations whilemountain communities enjoyed sunny warmdays but cool nights with low temperaturesdropping near the freezing point
17-18 Increasing clouds and turning cooler overwestern Colorado on the 17th as a small upper-level low-pressure area approached. Still hoteast of the mountains. Showers developed overmuch of western Colorado ending early on the18th. Rainfall was generally light, but theUncompaghre valley picked up significantmoisture. Montrose reported 0.76". EasternColorado remained dry, but the cooler tempera-tures marked the end of the hot summer of2000.
September 2000 precipitation as a percent of the 1961-1990 average.
September 2000 temperature departure from 1961-1990 average, degrees F.
> 200%
150-200%
100-150%
50-100%
< 50%
> 2 degreesabove average
1 to 2 degrees
Colorado Climate 13
19-25 Windy, cooler and unsettled on the 19th as chillyautumn air moved southward out of Canada.Significant and welcome rains fell overnortheastern Colorado overnight into themorning of the 20th. Holyoke reported 1.03".The 21st was pleasant east of the mountains, butwidespread rains and thunderstorms moved intowestern Colorado continuing on the 22nd
spreading eastward. Some rainfall totals werequite large. Steamboat Springs measured 1.70"for the storm. Cold, wet weather continued as alarge, cold high-pressure area over Montanacombined with a low-pressure area over Utah.Temperatures dipped to near the freezing pointon the 23rd and rains changed to snow overmany portions of northern Colorado andcontinued into the 24th. The first snow of theseason brought just a few inches to most areas.However, Larimer County was hit hard by 6 to15 inches of heavy snow. Trees still in full leafcracked under the load, leaving some residentswithout power. As skies cleared later on the24th, temperatures dropped into the 20s bymorning on the 25th, bringing the 2000 growingseason to a close.
26-30 September ended with lots of sunshine and agradual return to above average temperatures.Some might call this “Indian Summer”following the first snow and freezing tempera-tures on the 24-25th. The dry weather wasinterrupted on the 29th as an upper air distur-bance crossed the state from the west triggeringshowers and thundershowers most numerous inthe mountains. Several weather stations incentral and southern Colorado received about0.25" of moisture.
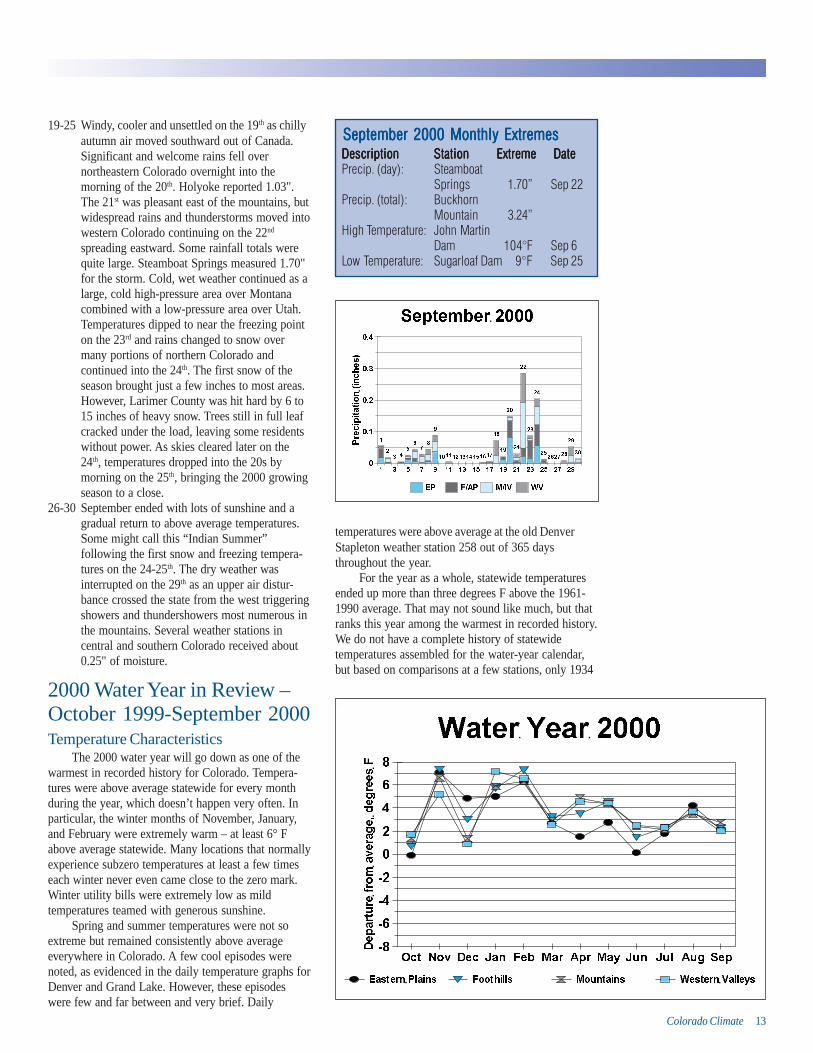
2000 Water Year in Review –October 1999-September 2000Temperature Characteristics
The 2000 water year will go down as one of thewarmest in recorded history for Colorado. Tempera-tures were above average statewide for every monthduring the year, which doesn’t happen very often. Inparticular, the winter months of November, January,and February were extremely warm – at least 6° Fabove average statewide. Many locations that normallyexperience subzero temperatures at least a few timeseach winter never even came close to the zero mark.Winter utility bills were extremely low as mildtemperatures teamed with generous sunshine.
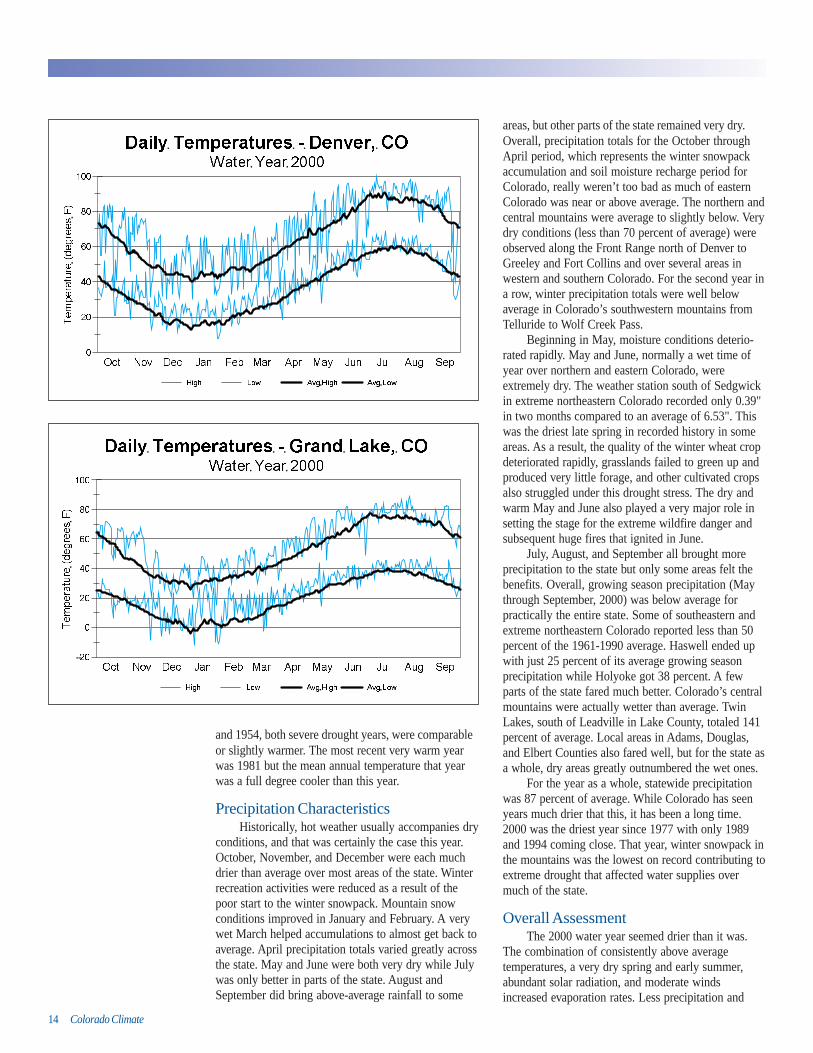
Spring and summer temperatures were not soextreme but remained consistently above averageeverywhere in Colorado. A few cool episodes werenoted, as evidenced in the daily temperature graphs forDenver and Grand Lake. However, these episodeswere few and far between and very brief. Daily
temperatures were above average at the old DenverStapleton weather station 258 out of 365 daysthroughout the year.
For the year as a whole, statewide temperaturesended up more than three degrees F above the 1961-1990 average. That may not sound like much, but thatranks this year among the warmest in recorded history.We do not have a complete history of statewidetemperatures assembled for the water-year calendar,but based on comparisons at a few stations, only 1934
September 2000 Monthly ExtremesSeptember 2000 Monthly ExtremesSeptember 2000 Monthly ExtremesSeptember 2000 Monthly ExtremesSeptember 2000 Monthly ExtremesDescriptionDescriptionDescriptionDescriptionDescription StationStationStationStationStation ExtremeExtremeExtremeExtremeExtreme DateDateDateDateDatePrecip. (day): Steamboat
Springs 1.70” Sep 22Precip. (total): Buckhorn
Mountain 3.24”High Temperature: John Martin
Dam 104°F Sep 6Low Temperature: Sugarloaf Dam 9°F Sep 25
14 Colorado Climate
and 1954, both severe drought years, were comparableor slightly warmer. The most recent very warm yearwas 1981 but the mean annual temperature that yearwas a full degree cooler than this year.
Precipitation CharacteristicsHistorically, hot weather usually accompanies dry
conditions, and that was certainly the case this year.October, November, and December were each muchdrier than average over most areas of the state. Winterrecreation activities were reduced as a result of thepoor start to the winter snowpack. Mountain snowconditions improved in January and February. A verywet March helped accumulations to almost get back toaverage. April precipitation totals varied greatly acrossthe state. May and June were both very dry while Julywas only better in parts of the state. August andSeptember did bring above-average rainfall to some
areas, but other parts of the state remained very dry.Overall, precipitation totals for the October throughApril period, which represents the winter snowpackaccumulation and soil moisture recharge period forColorado, really weren’t too bad as much of easternColorado was near or above average. The northern andcentral mountains were average to slightly below. Verydry conditions (less than 70 percent of average) wereobserved along the Front Range north of Denver toGreeley and Fort Collins and over several areas inwestern and southern Colorado. For the second year ina row, winter precipitation totals were well belowaverage in Colorado’s southwestern mountains fromTelluride to Wolf Creek Pass.
Beginning in May, moisture conditions deterio-rated rapidly. May and June, normally a wet time ofyear over northern and eastern Colorado, wereextremely dry. The weather station south of Sedgwickin extreme northeastern Colorado recorded only 0.39"in two months compared to an average of 6.53". Thiswas the driest late spring in recorded history in someareas. As a result, the quality of the winter wheat cropdeteriorated rapidly, grasslands failed to green up andproduced very little forage, and other cultivated cropsalso struggled under this drought stress. The dry andwarm May and June also played a very major role insetting the stage for the extreme wildfire danger andsubsequent huge fires that ignited in June.
July, August, and September all brought moreprecipitation to the state but only some areas felt thebenefits. Overall, growing season precipitation (Maythrough September, 2000) was below average forpractically the entire state. Some of southeastern andextreme northeastern Colorado reported less than 50percent of the 1961-1990 average. Haswell ended upwith just 25 percent of its average growing seasonprecipitation while Holyoke got 38 percent. A fewparts of the state fared much better. Colorado’s centralmountains were actually wetter than average. TwinLakes, south of Leadville in Lake County, totaled 141percent of average. Local areas in Adams, Douglas,and Elbert Counties also fared well, but for the state asa whole, dry areas greatly outnumbered the wet ones.
For the year as a whole, statewide precipitationwas 87 percent of average. While Colorado has seenyears much drier that this, it has been a long time.2000 was the driest year since 1977 with only 1989and 1994 coming close. That year, winter snowpack inthe mountains was the lowest on record contributing toextreme drought that affected water supplies overmuch of the state.
Overall AssessmentThe 2000 water year seemed drier than it was.
The combination of consistently above averagetemperatures, a very dry spring and early summer,abundant solar radiation, and moderate windsincreased evaporation rates. Less precipitation and

Colorado Climate 15
more evaporation means more rapid drying. The verymild winter also meant that little or no snowpackaccumulated in the foothills and western plateaus.While high-elevation snowpack accumulation wasclose to average at the end of the winter, the snowpackdid not extend down to the intermediate and lowerelevations that constitute a much larger portion of thestate. Lower areas dried out very quickly in the spring,contributing to the high fire danger.
After the wet summer of 1999, Coloradoreservoirs were in great shape going into 2000 withmany full to capacity. With such a high demand forwater, however, reservoirs were quickly depletedduring late spring and summer of 2000, particularlythe agricultural reservoirs on the plains of northeasternColorado. Fish populations were at risk at a number ofreservoirs prompting special temporary fishingregulations to encourage harvesting fish. Overall,reservoir storage went from 137 percent of the long-term average on October 1, 1999 down to 100 percentof average at the end of the year. While stored watervolumes were still adequate in many parts of the state,this is nevertheless a very large one-year lossrepresenting a depletion of well over 500,000 acre-feetof water.
With the warm winter and spring, winter runoffand streamflow were greater than usual. Most streamsreached their snowmelt runoff peaks in May and thendropped off quickly. Some streams actually went dryby early to mid summer. Stretches of the South PlatteRiver in northeastern Colorado were completely dry.The Little Thompson River at Pinewood Springs wentcompletely dry, creating a real problem for that smallcommunity. The rains of late August and Septemberwere indeed welcome
Can we blame anything for the heat and lack ofprecipitation? Some might say it is the evidence ofglobal warming. Others point the finger at La Nina(cooler than average ocean surface temperatures in thetropics west of South America) as the culprit. Stillothers simply said, “We’re overdue for a drought.” Intruth, there are no simple answers. Variability inclimate from one year to the next is one of the greatchallenges that we face. La Nina was in place in 1999,but Colorado ended up with a very wet year, despiteforecasts of likely dry weather. The cold phase of theEl Nino Southern Oscillation persisted in 2000 andlikely did contribute in part to the weather patterns thatwe experienced. Likewise, temperature anomalies inthe northern Pacific Ocean also contributed. As forglobal warming, not everyone was sweltering in theheat. Even as Colorado suffered through a hotsummer, the east coast and Mid Atlantic states enjoyedone of their coolest summers in many years.
Water Year 2000 (Oct. 1999 - Sept. 2000) precipitation as a percent of1961-1990 average
Summer 2000 (May - Sept.) precipitation as a percent of 1961-1990 average.
T = Temperature/Precipitation O = Precipitation site only
WV M/IV F/AP EPWestern Mountains/ Foothills/ EasternValleys Interior Valleys Adjacent Plains Plains
> 110%
90-110%
70-90%
< 70%
> 120%
100-120%
80-100%
50-80%
< 50%

16 Colorado Climate
March 1899. Aspen and Breckenridge were among themountain communities that were totally isolated for upto two months as all railroad traffic was blockaded.Some mountain residents who had become accus-tomed to the efficiency of heating with coal foundthemselves without fuel. During one six-day storm inearly March, the Breckenridge weather observermeasured over 70 inches of snow. By the end ofMarch he reported drifts in the mountains up to 200feet deep. The weather station at the Ruby miningcamp near Crested Butte reported 249 inches ofsnowfall in March. That value still stands as the recordmonthly snowfall for Colorado.
December 1-5, 1913: The worst snowstorm ofrecorded history for the Colorado Front Range fromRaton, NM, to Cheyenne, WY. Dozens of trainscarrying hundreds of passengers became stranded inmany areas of the state. Roofs collapsed (see thearticle on “Snow Loads” in this issue on page 20)under the weight of nearly four feet of wet snow inDenver.
April 14-15, 1921: While Denver and other FrontRange cities received a combination of cold rain andwet snow, an incredibly heavy snow fell in thefoothills and mountains of Colorado. It was thegreatest snowfall in 24 hours ever recorded anywherein North America. 76 inches fell at Silver Lake west ofBoulder. The snow contained more than five inches ofwater. Other areas between Cripple Creek and the
Wyoming border reported up to 60 inches of snowfrom this brief but intense storm.
1930: The decade of the infamous GreatDepression and “Dust Bowl” kicked off with aviciously cold January with temperatures below zeromuch of the month. Then a brief but wicked blizzardhit eastern Colorado November 19-20, leaving driftsup to 10 feet high in Burlington with larger drifts onthe surrounding open prairie.
November 2-6, 1946: At least 13 people losttheir lives as up to 50 inches of snow fell from a long-lasting early blizzard. Residents of eastern Coloradowere totally isolated for many days until warmerweather helped melt the early snow.
January 1-6, 1949: One of the worst combina-tions of cold temperatures, heavy snow, and severaldays of howling winds buried houses and barns fromnear Fort Collins and Greeley northeastward acrossmuch of Nebraska. Thousands endured harrowingexperiences to survive this storm. When winds finallydiminished, an extensive airlift was performed overNebraska to carry hay to stranded livestock and tobring food and fuel to residents isolated by thisremarkable storm.
December 29-31, 1951: A furious onslaught ofheavy, wet snow and high winds pounded all of westernColorado from the high mountains down to the lowvalleys. Even normally snow-sparse areas like GrandJunction were buried under deep snow. With a suddendeposit of more than six feet of wind-packed snows upin the high country, avalanches went wild. Mountainhighways were closed for days over almost every pass.
March 10-11, 1977: Following months ofdrought, a sudden spring blizzard packing winds ofmore than 70 m.p.h. clobbered east central andnortheast Colorado. At least nine people lost their livesalong with many livestock. Drifts of snow werecombined with layers of blown topsoil followingmonths of very dry weather.
December 24, 1982: Denver’s infamousChristmas Eve Blizzard made for the whitest andquietest Christmas in history for much of the FrontRange. Two to three feet accumulated on the level indowntown Denver. Thousands of travelers werestranded for days. Many of Denver’s neighborhoodstreets remained impassable for one to two weeks.Other areas of Colorado also were affected, andseveral people lost their lives after becoming lost orstuck in the storm.
February 11-20, 1986: A siege of heavy snow hitthe mountains as flood-producing storms poundedCalifornia. Several feet of snow accumulated in mostmountain communities. The combination of deepsnow and high winds resulted in hundreds of ava-lanches.
Blizzard (continued from page 5)
(continued on page 19)
December 25, 1982blizzard. Photo taken byWalter Johnson, U.S.Bureau of Reclamation.
Colorado Climate 17
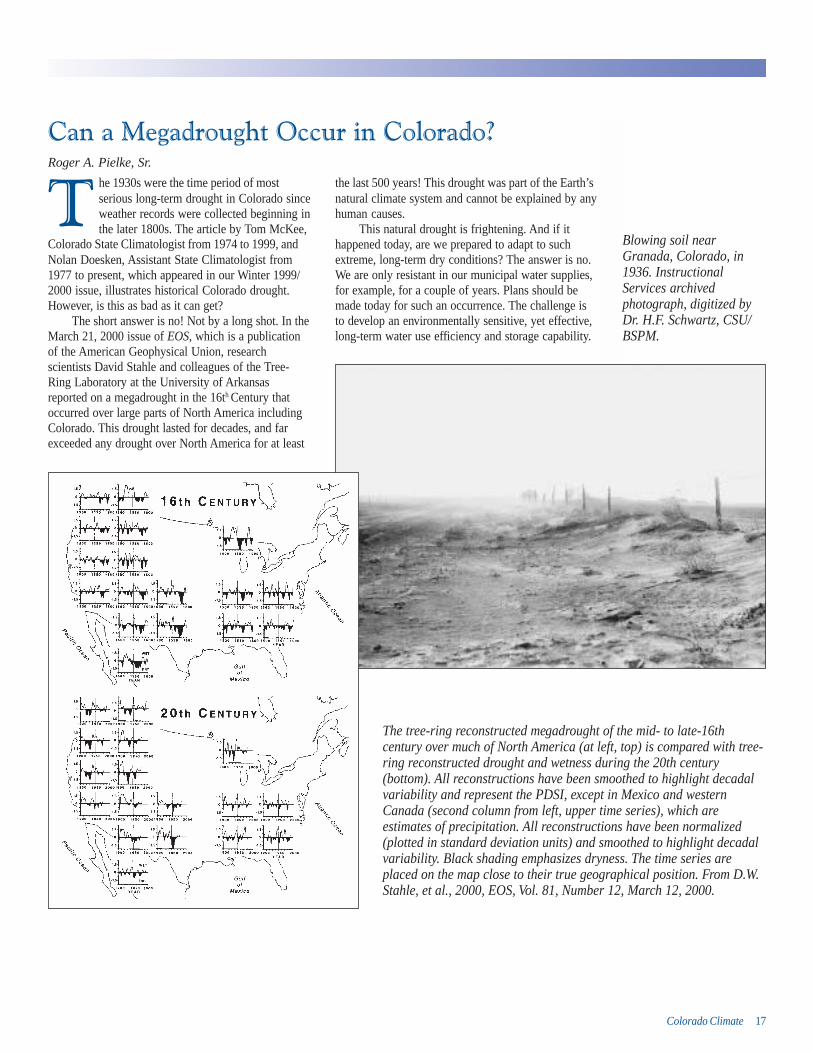
Can a Megadrought Occur in Colorado?Roger A. Pielke, Sr.
he 1930s were the time period of mostserious long-term drought in Colorado sinceweather records were collected beginning inthe later 1800s. The article by Tom McKee,
Blowing soil nearGranada, Colorado, in1936. InstructionalServices archivedphotograph, digitized byDr. H.F. Schwartz, CSU/BSPM.
Colorado State Climatologist from 1974 to 1999, andNolan Doesken, Assistant State Climatologist from1977 to present, which appeared in our Winter 1999/2000 issue, illustrates historical Colorado drought.However, is this as bad as it can get?
The short answer is no! Not by a long shot. In theMarch 21, 2000 issue of EOS, which is a publicationof the American Geophysical Union, researchscientists David Stahle and colleagues of the Tree-Ring Laboratory at the University of Arkansasreported on a megadrought in the 16th Century thatoccurred over large parts of North America includingColorado. This drought lasted for decades, and farexceeded any drought over North America for at least
T
The tree-ring reconstructed megadrought of the mid- to late-16thcentury over much of North America (at left, top) is compared with tree-ring reconstructed drought and wetness during the 20th century(bottom). All reconstructions have been smoothed to highlight decadalvariability and represent the PDSI, except in Mexico and westernCanada (second column from left, upper time series), which areestimates of precipitation. All reconstructions have been normalized(plotted in standard deviation units) and smoothed to highlight decadalvariability. Black shading emphasizes dryness. The time series areplaced on the map close to their true geographical position. From D.W.Stahle, et al., 2000, EOS, Vol. 81, Number 12, March 12, 2000.
the last 500 years! This drought was part of the Earth’snatural climate system and cannot be explained by anyhuman causes.
This natural drought is frightening. And if ithappened today, are we prepared to adapt to suchextreme, long-term dry conditions? The answer is no.We are only resistant in our municipal water supplies,for example, for a couple of years. Plans should bemade today for such an occurrence. The challenge isto develop an environmentally sensitive, yet effective,long-term water use efficiency and storage capability.

18 Colorado Climate
For Teachers (continued from page 7)
Courtesy of NationalWeather Service.
students compute some basic statistics – average, median, range,and any other property of the distribution you like. You could drawor create on the computer histograms of snow accumulation fromyour set of measurements. There are few limits.
If possible, you should also measure the water content of thesnow. That requires a little more work, but it is the water contentthat in the end is the single most important aspect of snow. Snowis an amazing process that harvests water vapor from the sky anddeposits it on the ground so that it can gently melt and soak ineven more effectively than rain. In the mountains, the snowpack isour frozen reservoir providing water to most residents of the stateand to millions more people downstream who benefit from thewaters of the Colorado River, the Platte, the Arkansas, and the RioGrande. I’ve run out of time to go into intricate detail on how youcan have your kids measure the water content of snow, but I have afunny feeling you can figure that out on your own. It’s never quiteas easy as it seems, but it is something that every student can doand learn from.
Finally, when you’re back in the warmth and comfort of yourclassroom, consider having your students do some snowfallcomparisons. What is the average winter snowfall for your town?What is the snowiest month? How does your snowfall compare toother parts of Colorado and other parts of the country? You caneven compare to other parts of the world. With a little homeworkahead of time, you can find some websites with snowfall data formany parts of the country to help with this comparison.
Enjoy winter, and enjoy snow. When in doubt, go ahead andact like a kid catching snowflakes on your tongue. You’ll feel likea kid again, and your students will think you’re pretty neat. If youhave questions about snow in Colorado, we’ll do our best toanswer them. Have a great winter!
2223
24
26
272829
32
33
3334
3436
38
4141
4545
46
46
4748
4949
51
5157
5861
62
74
7580
8690
90
98117
118135
146
171
178197
222
224
266
395458
0 100 200 300 400 500
Colorado Average Annual Snowfall (inches)
Cheyenne Wells
Rocky Ford
Grand Junction
Lamar
Burlington
Fort M organ
Rangely
Pueblo
Holyoke
Springfield
Cortez
Buena Vista
Limon
Alamosa
Akron
Canon City
Greeley
Colorado Springs
Trinidad
Eagle
Del Norte
Leroy
Antero Reservoir
Rifle
Gunnison
Paonia
Fort Collins
Glenwood Springs
Denver
Walden
Durango
Craig
Boulder
M eeker
Walsenburg
Evergreen
Westcliffe
Pagosa Springs
Dillon
Silverton
Grand Lake
Steamboat Springs
Aspen
Telluride
Winter Park
Crested Butte
Climax
Berthoud Pass
Wolf Creek Pass

Colorado Climate 19
February 1989: Blizzard conditions developedsuddenly along I-70 in western Colorado as tempera-tures plummeted (western Colorado is not accustomedto the extreme rapid changes that are more commoneast of the mountains). Eagle, normally a drymountain valley, recorded a quick 16 inches ofsnowfall and Grand Junction reported 11 inches.World Cup ski events at Vail were cancelled becauseof extreme winter weather conditions, with subzerotemperatures, strong winds, and at least three feet ofnew snow.
October 24-25, 1997: Perhaps the most severeblizzard to strike eastern Colorado so early in theseason, this storm dropped one to three feet of snow injust over 24 hours with winds gusting to 60 miles perhour. The Arkansas Valley was especially hard hit andremained snow covered for much of the winter. Somestructures were damaged or collapsed in southeastern
Blizzard (continued from page 16)Colorado under the weight of large snowdrifts. Severalpeople lost their lives. In the mountains, extremelystrong easterly winds developed at mountain-top levelduring the height of the storm. Millions of trees wereblown down in the forest northeast of SteamboatSprings.
Share Your Story:As you reflect on some of the storms you’ve
experienced, perhaps you have a story that needsto be shared. If so, submit it in writing to theColorado Climate Center, and we will bedelighted to include it in our historic climate dataarchives. Stories may be chosen for publication.Photos to accompany your stories will be greatlyappreciated.
Colorado NDVI Greenness ImagesColorado NDVI(Normalized DifferenceVegetation Index)greenness satellite imagesare shown here for Junethrough September 2000.The decreased greennessseen in these images showsthe drying up of vegetationor harvesting of crops overthis time period.Images courtesy of U.S.Geological Survey EROSData Center, Sioux Falls,SD.
June 2000 August 2000
July 2000 September 2000

20 Colorado Climate
Climate Data at Work – Snow LoadsNolan J. Doesken
id you ever drive through SteamboatSprings on a calm, sunny day in lateFebruary and wonder why all the youngmen were standing on rooftops with their
resulting from snow. The most memorable storm wasthe great blizzard of 1913. Building collapses werereported in many cities from Trinidad to Fort Collinsafter four days of heavy snow, much of it wet, notfluffy. More recently, the roof of one of historicGeorgetown’s famous old buildings collapsed in May1969 after a heavy spring storm. A restaurant inBoulder was badly damaged following a surprise 30-inch May snowstorm in 1978. In March 1990, studentsat Rocky Mountain High School were evacuated fromthe school when teachers and students noticed ceilingtile bending or falling off as steel trusses bent underthe weight of a very wet 17-inch snowfall. As recentlyas the October 1997 blizzard, buildings in southeasternColorado were damaged by the weight of snow.
So let’s make some calculations. How much doessnow weigh? A foot of fresh snow here in Coloradowill typically melt down to somewhere between 0.70"and 1.00" of water. Sometimes, the snow is so fluffythat a foot of snow may only contain 0.30" of water orless. However, if that snow is wetter than average,such as our autumn or spring storms, then the watercontent may be much more. The Fort Collins storm ofMarch 6, 1990, dropped 17 inches of snowfall in justover 24 hours, but at temperatures just above thefreezing point and with much of the snow falling inthe form of pellets, the snow had a remarkable watercontent of 3.48" as measured at the official weatherstation on the campus of Colorado State University.Realizing that a cubic foot of water weights just over62 pounds, then we can determine that a square foot ofa flat roof covered with 17 inches of snow with awater content of 3.48" weights 18.1 pounds. That maynot sound like much until you think about how largeyour roof is. A modest 1,500-square-foot single-storyranch-style house will typically have at least 1,700square feet of roof surface. Actually, since the roof issloped, the area will be greater, but it is the equivalenthorizontal roof area that we care about. Consideringporches and eaves, this area is typically about 10percent greater than the area of the house itself.Multiply the number of pounds of snow per squarefoot by the number of horizontal square feet of roof,and you come up with 1,700 square feet x 18.1 poundsper square feet = 30,763 pounds. That’s more than 15tons. That’s equivalent to having a dump truck parkedup on your roof – or a whole herd of horses for youanimal lovers.
The reason the 1913 storm was so bad inColorado was because of the incredible water content.Not only was this a very deep snow, but also it waswet. The observed water content of the 45.7" of freshsnow reported in Denver December 1-5 was 5.21" asmeasured by a rooftop precipitation gauge. Gauges
shirts off? It wasn’t just to impress the young ladies orto get an early tan. They are up there to protect thebuildings from the weight of snow.
Have you ever thought about yourown roof? When was it built? Whodesigned it? How strong is it? These arethings you usually don’t worry about –unless, of course, there are four feet ofheavy, wet snow perched up there andyour ceiling over your bed is beginningto crack and sag.
Fortunately our county buildingofficials all across Colorado do thinkabout things like this so we don’t have to.Years ago, structural engineers andclimatologists put their heads togetherand developed the concept of “SnowLoad.” That engineering term simplyrefers to the forces applied by the weightof snow. These forces must be accountedfor as new buildings are designed andolder buildings are renovated.
As harmless as it may look, snowthat accumulates gradually all winter as itdoes up in the mountains, or snow thatfalls in sudden heavy dumps as it
sometimes does at lower elevations applies extremeforces on buildings. If they are not adequatelydesigned, roofs can be damaged or even collapse.Through history, there has been disaster after disaster
caused by roof failuresfollowing seeminglyharmless accumulations ofsnow. One of the mostfamous collapses was theKnickerbocker Theater inWashington D.C. back in1922 following a heavysnow. The Civic CenterColiseum in Hartford,Conn., collapsed follow-ing a “Nor’easter” onJanuary 18, 1978. Manybuildings in the southeastwere damaged ordestroyed by the powerful
snowstorm of March 13, 1993, that was called bymany “the storm of the century.” Even though we areaccustomed to snow here in Colorado, there are stillmany examples through the years of structural failures
D
Photo taken by CharlesKuster, Leadville,Colorado.
Colorado Climate 23
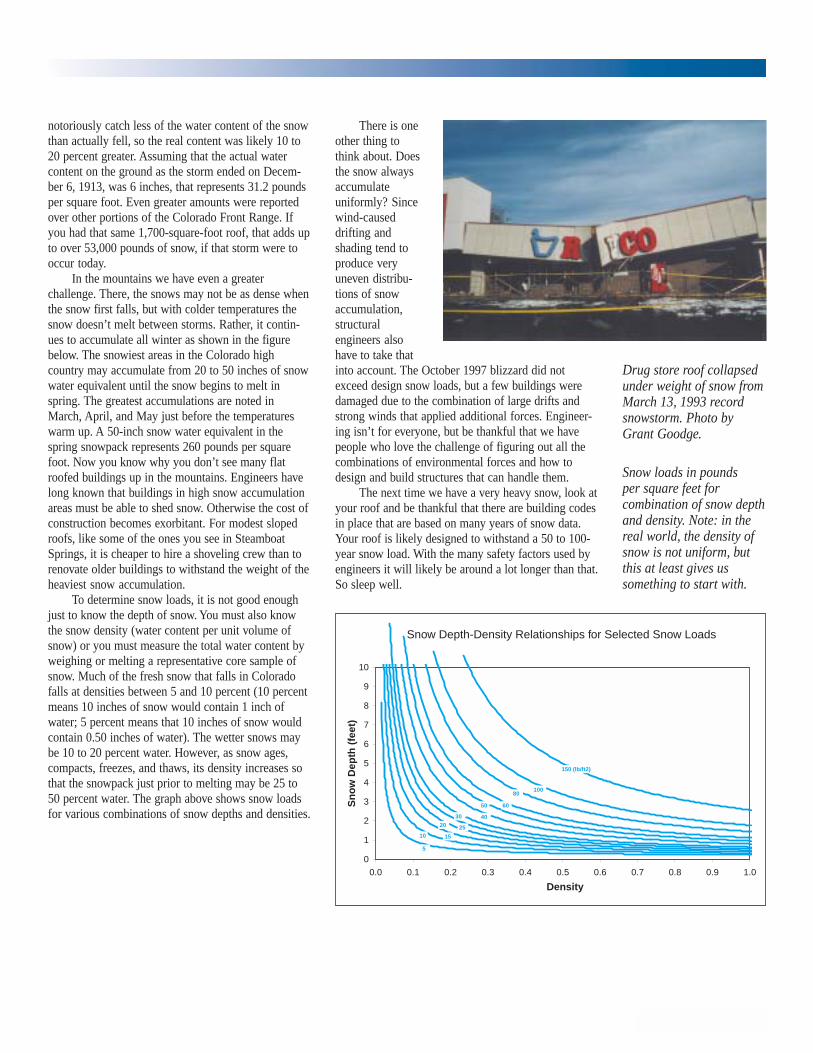
notoriously catch less of the water content of the snowthan actually fell, so the real content was likely 10 to20 percent greater. Assuming that the actual watercontent on the ground as the storm ended on Decem-ber 6, 1913, was 6 inches, that represents 31.2 poundsper square foot. Even greater amounts were reportedover other portions of the Colorado Front Range. Ifyou had that same 1,700-square-foot roof, that adds upto over 53,000 pounds of snow, if that storm were tooccur today.
In the mountains we have even a greaterchallenge. There, the snows may not be as dense whenthe snow first falls, but with colder temperatures thesnow doesn’t melt between storms. Rather, it contin-ues to accumulate all winter as shown in the figurebelow. The snowiest areas in the Colorado highcountry may accumulate from 20 to 50 inches of snowwater equivalent until the snow begins to melt inspring. The greatest accumulations are noted inMarch, April, and May just before the temperatureswarm up. A 50-inch snow water equivalent in thespring snowpack represents 260 pounds per squarefoot. Now you know why you don’t see many flatroofed buildings up in the mountains. Engineers havelong known that buildings in high snow accumulationareas must be able to shed snow. Otherwise the cost ofconstruction becomes exorbitant. For modest slopedroofs, like some of the ones you see in SteamboatSprings, it is cheaper to hire a shoveling crew than torenovate older buildings to withstand the weight of theheaviest snow accumulation.
To determine snow loads, it is not good enoughjust to know the depth of snow. You must also knowthe snow density (water content per unit volume ofsnow) or you must measure the total water content byweighing or melting a representative core sample ofsnow. Much of the fresh snow that falls in Coloradofalls at densities between 5 and 10 percent (10 percentmeans 10 inches of snow would contain 1 inch ofwater; 5 percent means that 10 inches of snow wouldcontain 0.50 inches of water). The wetter snows maybe 10 to 20 percent water. However, as snow ages,compacts, freezes, and thaws, its density increases sothat the snowpack just prior to melting may be 25 to50 percent water. The graph above shows snow loadsfor various combinations of snow depths and densities.
There is oneother thing tothink about. Doesthe snow alwaysaccumulateuniformly? Sincewind-causeddrifting andshading tend toproduce veryuneven distribu-tions of snowaccumulation,structuralengineers alsohave to take thatinto account. The October 1997 blizzard did notexceed design snow loads, but a few buildings weredamaged due to the combination of large drifts andstrong winds that applied additional forces. Engineer-ing isn’t for everyone, but be thankful that we havepeople who love the challenge of figuring out all thecombinations of environmental forces and how todesign and build structures that can handle them.
The next time we have a very heavy snow, look atyour roof and be thankful that there are building codesin place that are based on many years of snow data.Your roof is likely designed to withstand a 50 to 100-year snow load. With the many safety factors used byengineers it will likely be around a lot longer than that.So sleep well.
0
1
2
3
4
5
6
7
8
9
10
0.0 0.1 0.2 0.3 0.4 0.5 0.6 0.7 0.8 0.9 1.0
Density
Sn
ow
Dep
th (
feet
)
5
1510
150 (lb/ft2)
6050
4030
2520
80100
Snow Depth-Density Relationships for Selected Snow Loads
Drug store roof collapsedunder weight of snow fromMarch 13, 1993 recordsnowstorm. Photo byGrant Goodge.
Snow loads in poundsper square feet forcombination of snow depthand density. Note: in thereal world, the density ofsnow is not uniform, butthis at least gives ussomething to start with.

Climate affects us daily!So don’t miss a single issue, subscribe to:
Colorado Climate$15.00/year • 4 (four) issues per year
$7.50 for a single issueWinter, Spring, Summer and Fall
YES! I want to subscribe to the Colorado Climate publication.(Please photocopy and mail this form)
Check one below:
❑ Payment enclosed (make check or money order payable toColorado State University, U.S. Funds only)
❑ Invoice me
❑ Charge my credit cardVISA/MC Account: _______________________________________
Exp: ________ Card Holder Name: _______________________________Name: _____________________________________________________Company Name: _____________________________________________Address: ____________________________________________________City: ____________________________ State: ______ ZIP: ___________Phone: __________________ e-mail: _____________________________
Return to:
Colorado Climate Center • Department of Atmospheric ScienceColorado State University • Fort Collins • Colorado 80523-1371Phone: (970) 491-8545 • Fax: (970) 491-8449E-mail: [email protected]
Share this form with a friend.Show your library.
Col
orad
o C
limat
e C
ente
rD
epar
tmen
t of
Atm
osph
eric
Sci
ence
Fort
Col
lins,
Col
orad
o 80
523-
1371
Floods, Hail, Drought, Blizzards, Lightning, Tornadoes