colombia: recent economic performance and prospects · colombia: recent economic performance and...
TRANSCRIPT
COLOMBIA:
RECENT ECONOMIC PERFORMANCE AND PROSPECTS
Jose Darío Uribe E.
Governor of the Banco de la República
1. Introduction
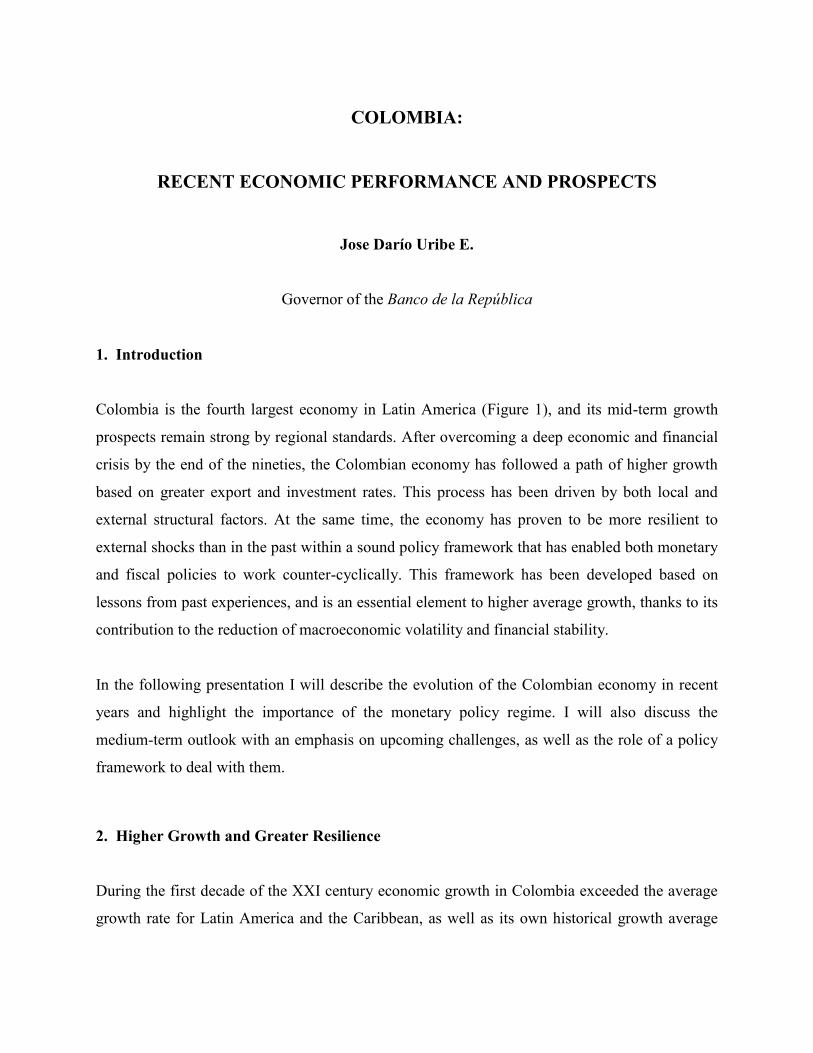
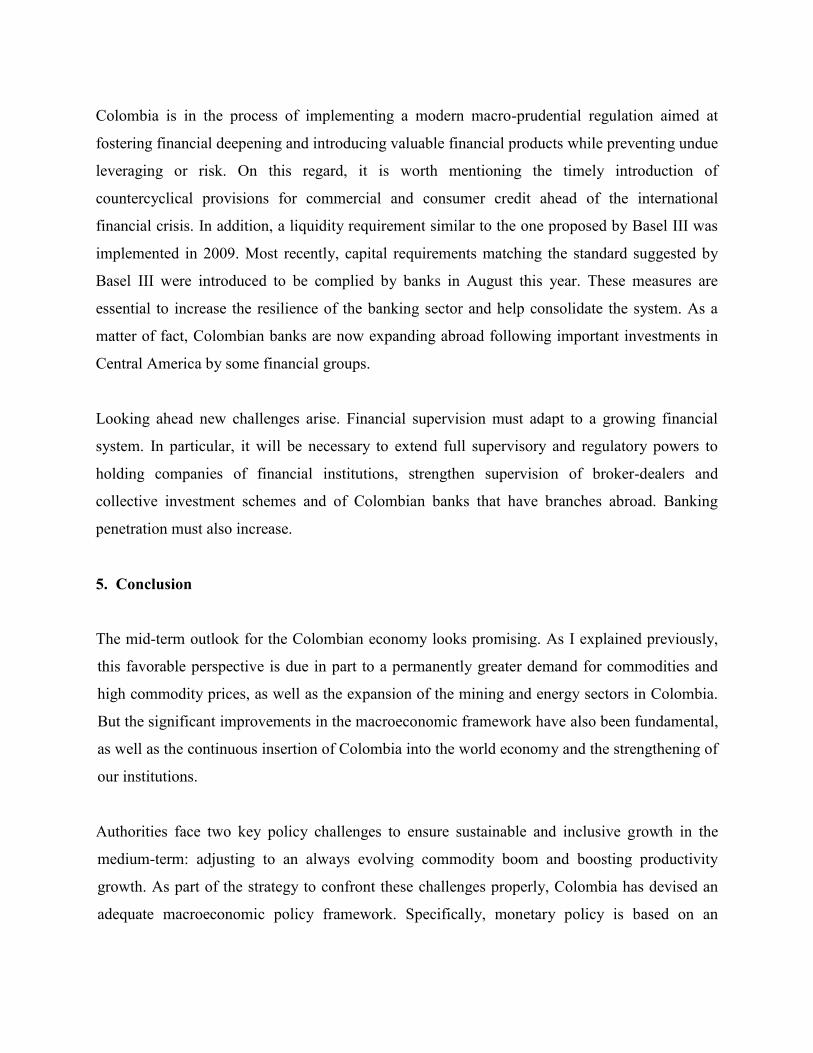
Colombia is the fourth largest economy in Latin America (Figure 1), and its mid-term growth
prospects remain strong by regional standards. After overcoming a deep economic and financial
crisis by the end of the nineties, the Colombian economy has followed a path of higher growth
based on greater export and investment rates. This process has been driven by both local and
external structural factors. At the same time, the economy has proven to be more resilient to
external shocks than in the past within a sound policy framework that has enabled both monetary
and fiscal policies to work counter-cyclically. This framework has been developed based on
lessons from past experiences, and is an essential element to higher average growth, thanks to its
contribution to the reduction of macroeconomic volatility and financial stability.
In the following presentation I will describe the evolution of the Colombian economy in recent
years and highlight the importance of the monetary policy regime. I will also discuss the
medium-term outlook with an emphasis on upcoming challenges, as well as the role of a policy
framework to deal with them.
2. Higher Growth and Greater Resilience
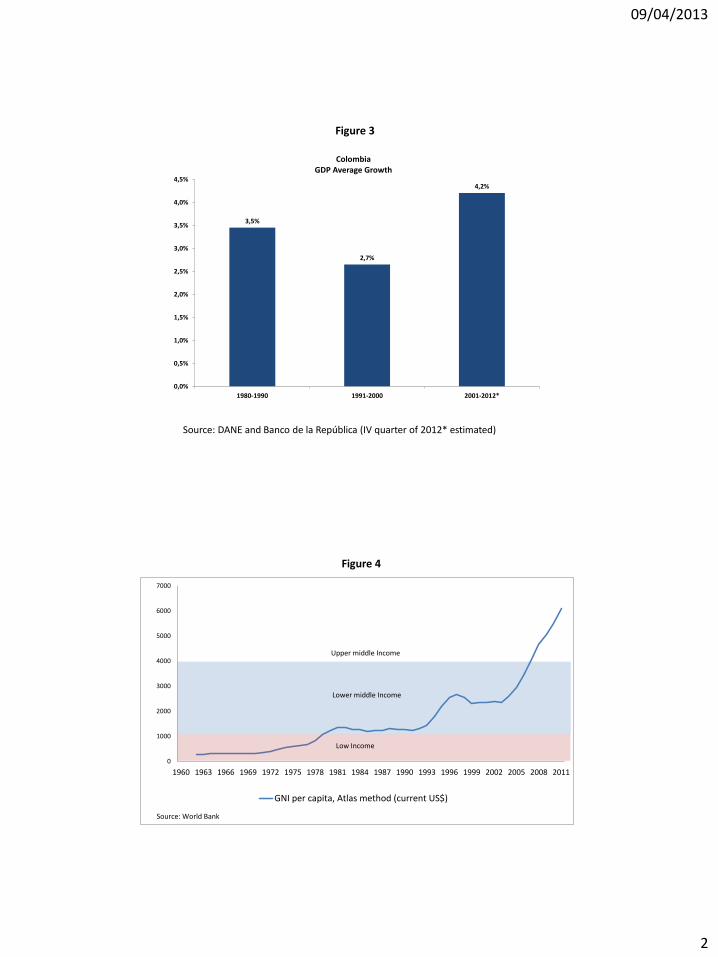
During the first decade of the XXI century economic growth in Colombia exceeded the average
growth rate for Latin America and the Caribbean, as well as its own historical growth average
(Figures 2 and 3). As a result, the Colombian economy now belongs to the group of upper-
middle income countries (Figure 4).
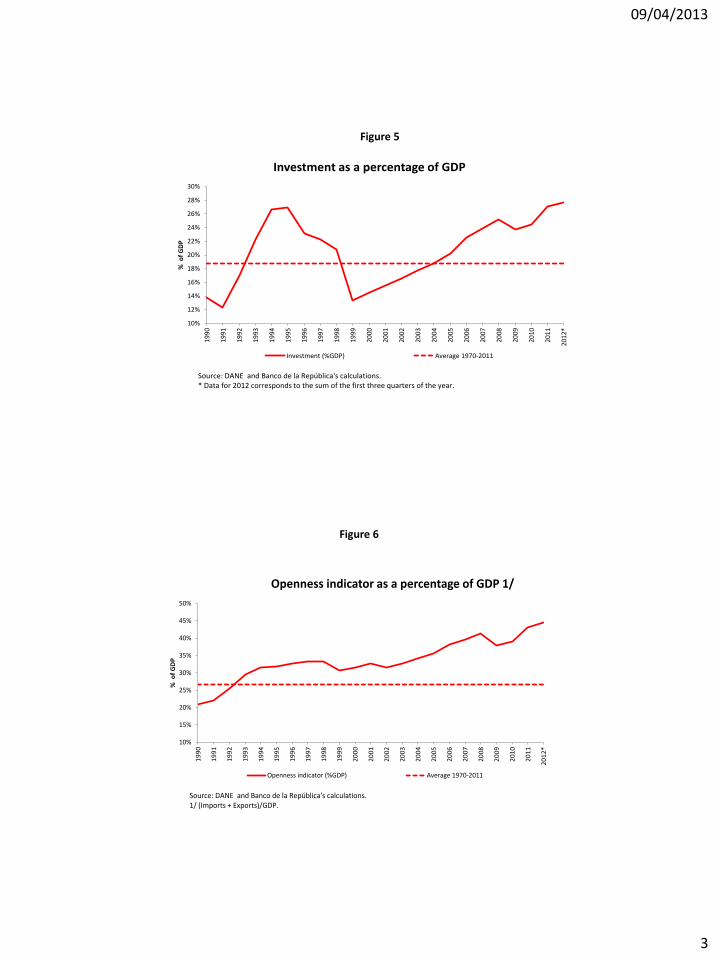
Two factors were instrumental for this accomplishment: first, an upward trend in the share of
investment with respect to output (Figure 5); and second, the continuous insertion of Colombia
into the world economy, both through international trade (exports and imports) and investment
inflows (Figure 6). Behind these achievements lie local factors such as significant improvements
in matters of security and fiscal management, as well as the attainment of a low, stable inflation.
The improved fiscal situation reinforced the market’s perception that the public debt is
sustainable and significantly decreased the uncertainty of future taxation and financing costs.
Low, stable inflation implied lower long-term real interest rates (due to nominal stability and a
smaller inflation risk), better resource allocation and productivity, and increased safety for
investors.
External factors have also been important for the new phase of growth in Colombia. Structural
changes in the world economy, such as the rapid industrialization and urbanization process in
China and India together with the growing income of several emerging market economies, meant
a greater demand for commodities and a rise in their prices. This stimulated investment in
resource-rich countries, raised their terms of trade and national incomes and diminished their
perceived riskiness. In the case of Colombia, findings of oil and mineral reserves increased the
positive impact of these events, since the combination of higher production volumes and prices
enhanced expectations of future export and fiscal revenues.
Besides increasing its potential growth through the 2000s, the Colombian economy has exhibited
a remarkable resilience to the difficult external conditions of the last few years. This has been
possible thanks to the enhancing ability to perform monetary and fiscal countercyclical policies,
coupled with favorable macroeconomic conditions such as low inflation, sustainable public debt,
and a stable financial system in the context of a flexible exchange rate regime. This increasing
resilience was evident in the reaction of the Colombian economy to the collapse of Lehman
Brothers and the ensuing global financial crisis. In contrast to its dismal response to the Asian
and Russian crises of the late nineties, the Colombian economy kept growing in 2008-2009 and
recovered rapidly in 2010-2011 (Figure 7). As a result, growth volatility has been substantially
subdued and is now lower than the average for Latin America (Figure 8).
Overall, improvements in the Colombian macroeconomic policy framework were central to
driving the economy along a higher growth path as well as to increasing its resilience in the face
of adverse shocks. Most importantly, stability strengthens the incentives to undertake long-term
productive investment projects. As I will explain next, the Central Bank’s strategy for
implementing its monetary policy has played a key role in achieving these results.
3. Monetary Policy: Low and Stable Inflation and Smoothing Output Fluctuations
Since 1999, Banco de la República has used a flexible inflation-targeting regime. The objectives
of this strategy are to maintain a low and stable inflation and to smooth output fluctuations
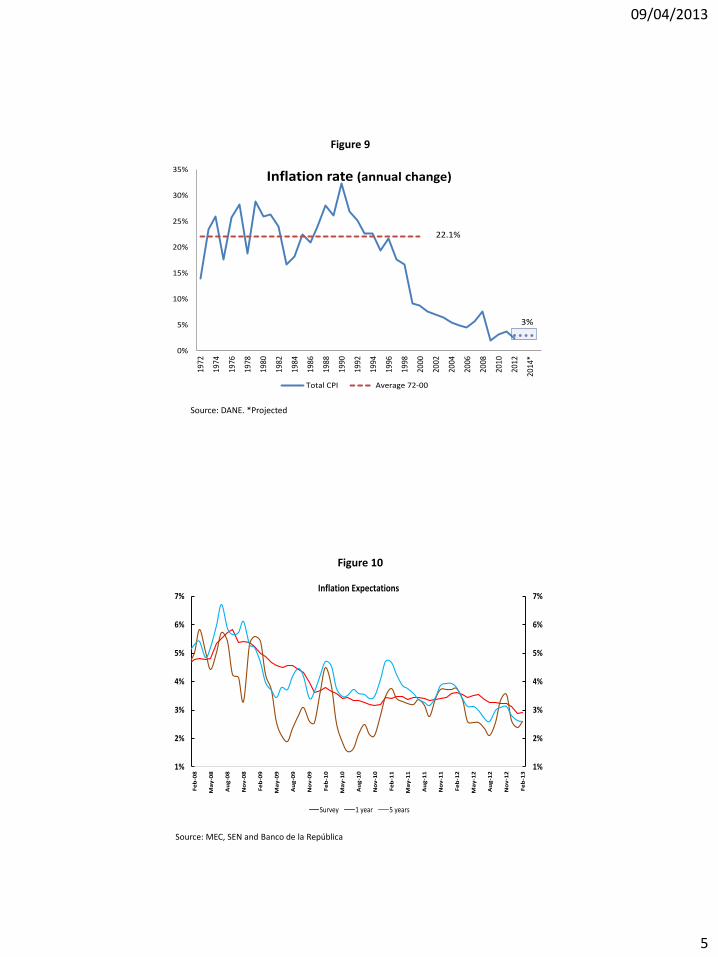
around a sustainable growth path. Inflation has been gradually reduced from two-digit levels to
the official long-term target of 3%, with a control range of 1 +/- one percentage point, and it is
currently hovering at around 2%, reflecting the absence of inflationary pressures (Figure 9).
The possibility of simultaneously maintaining inflation on-target and smoothing output
fluctuations depends on the Central Bank’s capacity to anchor inflation expectations (Figure 10).
If public expectations deviate significantly from the inflation target, monetary policy loses its
ability to dampen the business cycles. Thus, the Bank’s credibility is crucial for the success of
monetary policy. Credibility comes from developing the proper policy framework and building a
track record of success in achieving and maintaining a low and stable inflation.
The Bank’s main instrument for monetary policy is the short-term interest rate. When aggregate
demand falls below its sustainable level and the economy faces lower inflation, the appropriate
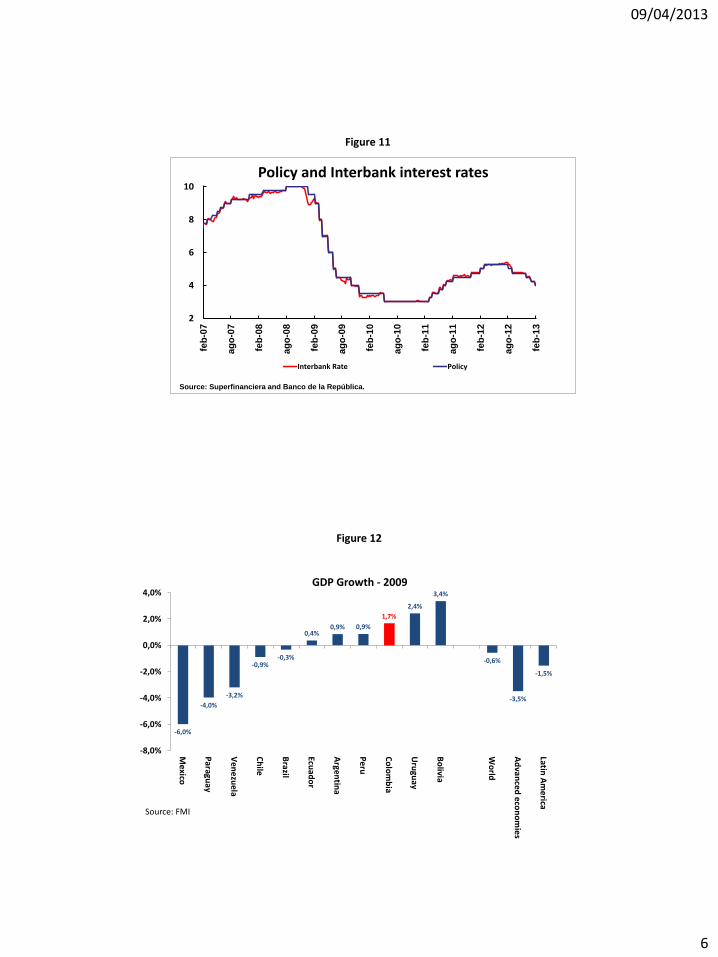
policy reaction is to lower interest rates. For instance, after the collapse of Lehman Brothers and
the subsequent shock in September 2008, the Board of Directors of the Central Bank reduced the
policy rate from 10% to 3% (Figure 11). The combination of this extraordinary monetary
stimulus and a financial sector that continued to provide credit to households and businesses, as
well as a moderate fiscal expansion resulted in a growth rate of 1.7% in 2009, the highest among
large Latin American countries in that year (Figure 12). In contrast, once the economy recovered
its growth pace and faced a strong increase in consumer credit, the Central Bank moved off its
exceptional policy and increased interest rates from 3% in January 2011 to the “more normal”
level of 5.25% in February of 2012.
Recently, a variety of shocks of different nature and duration have affected prices and
production. Positive agricultural supply shocks, a strong peso, reductions in the value added tax,
and a weaker aggregate demand have led to a significant reduction in the inflation rate and
inflation forecasts, currently placing them below the long term target of 3%. Meanwhile, an
unexpected contraction in gross capital formation, particularly in civil works and construction,
associated with regulatory and administrative factors, led to a negative output gap at the close of
2012. For the same reason, projections for GDP growth in 2013 fall below the full potential of
the economy. These factors prompted the Bank to lower the interest rate from 5.25% in June
2012 to 3.75% last February, which will provide a necessary stimulus in the current
circumstances without putting the inflation target at risk.
The floating exchange rate is also an integral part of the Bank’s strategy for implementing
monetary policy (Figure 13). In a commodity-exporting, small, open economy with price and
wage rigidities like Colombia, most shocks are better absorbed by the exchange rate. For
example, in the second semester of 2008 the policy response to the Lehman shock prompted the
exchange rate to respond endogenously - it fell sharply, by more than 40% - which was an
expansionary impulse for the economy. Moreover, exchange rate flexibility facilitates the
adoption of a countercyclical monetary policy and makes the private sector more prudent in its
decisions of foreign indebtedness.
4. Medium-Term Outlook for the Colombian Economy: Opportunities and Challenges
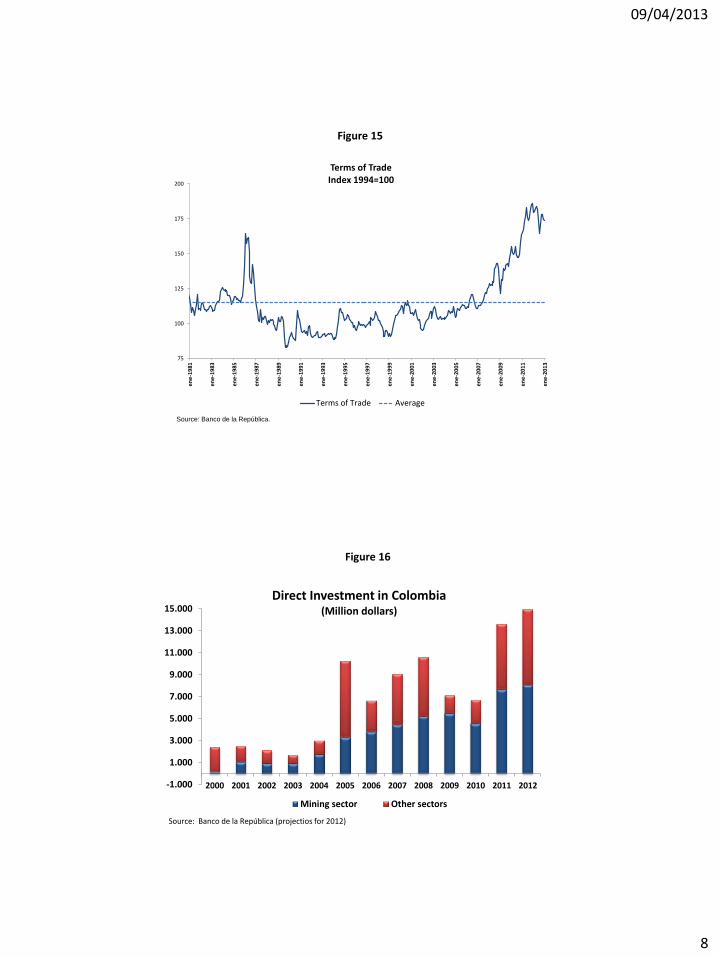
The last decade witnessed an increase in production and exports of oil, coal and other mining
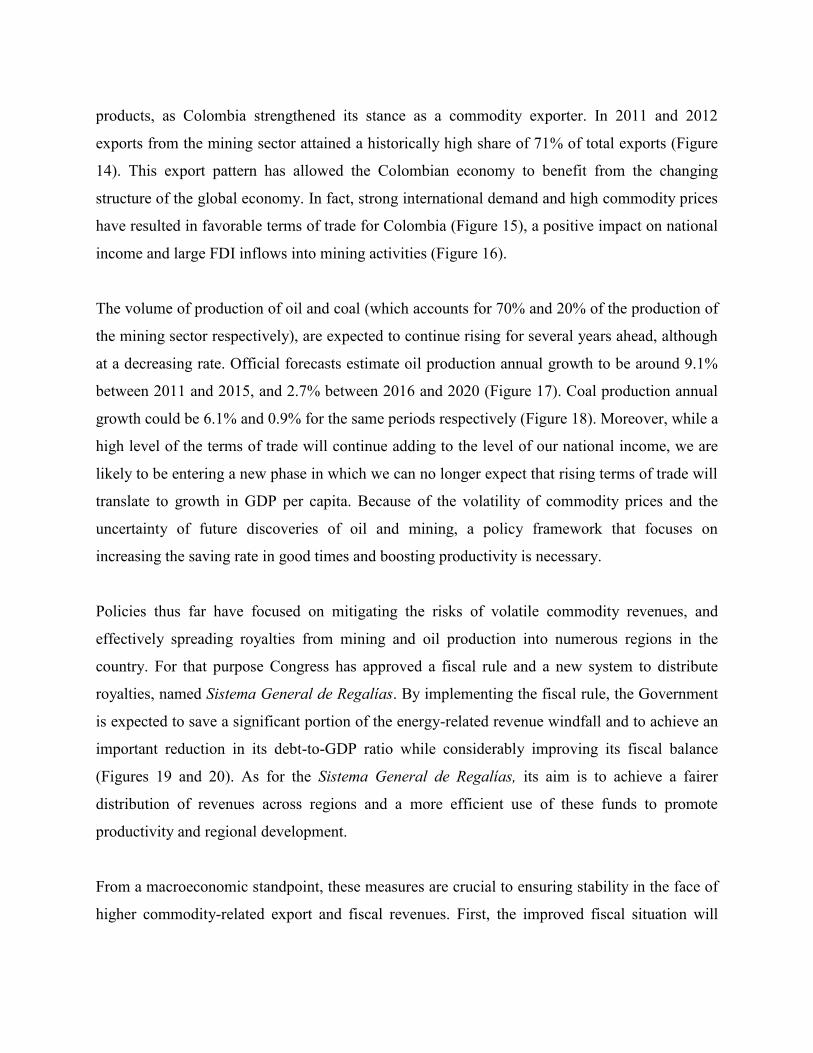
products, as Colombia strengthened its stance as a commodity exporter. In 2011 and 2012
exports from the mining sector attained a historically high share of 71% of total exports (Figure
14). This export pattern has allowed the Colombian economy to benefit from the changing
structure of the global economy. In fact, strong international demand and high commodity prices
have resulted in favorable terms of trade for Colombia (Figure 15), a positive impact on national
income and large FDI inflows into mining activities (Figure 16).
The volume of production of oil and coal (which accounts for 70% and 20% of the production of
the mining sector respectively), are expected to continue rising for several years ahead, although
at a decreasing rate. Official forecasts estimate oil production annual growth to be around 9.1%
between 2011 and 2015, and 2.7% between 2016 and 2020 (Figure 17). Coal production annual
growth could be 6.1% and 0.9% for the same periods respectively (Figure 18). Moreover, while a
high level of the terms of trade will continue adding to the level of our national income, we are
likely to be entering a new phase in which we can no longer expect that rising terms of trade will
translate to growth in GDP per capita. Because of the volatility of commodity prices and the
uncertainty of future discoveries of oil and mining, a policy framework that focuses on
increasing the saving rate in good times and boosting productivity is necessary.
Policies thus far have focused on mitigating the risks of volatile commodity revenues, and
effectively spreading royalties from mining and oil production into numerous regions in the
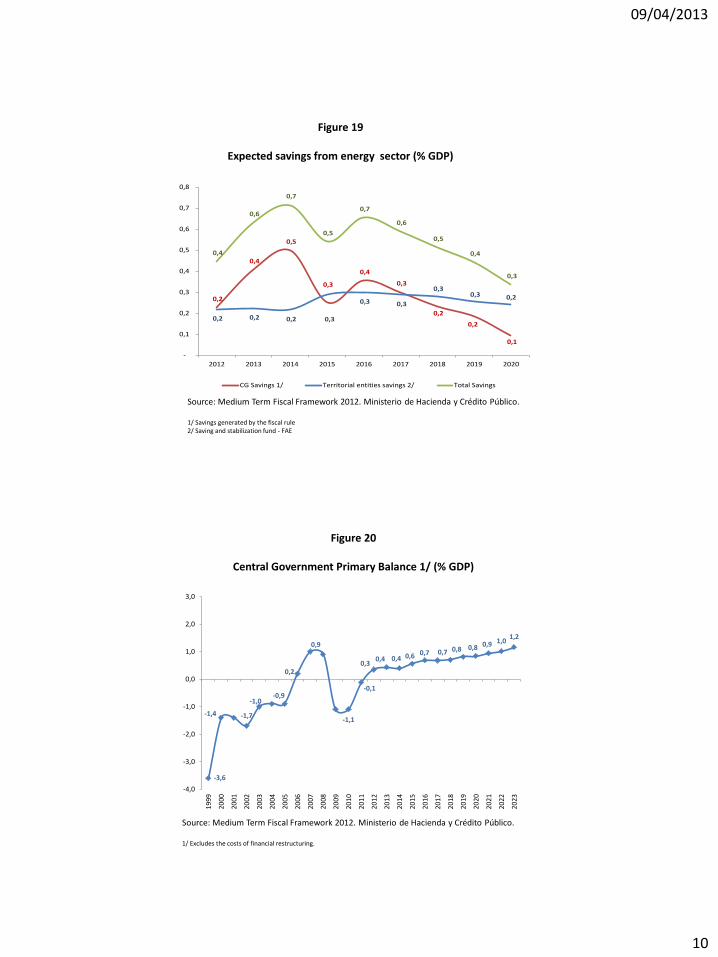
country. For that purpose Congress has approved a fiscal rule and a new system to distribute
royalties, named Sistema General de Regalías. By implementing the fiscal rule, the Government
is expected to save a significant portion of the energy-related revenue windfall and to achieve an
important reduction in its debt-to-GDP ratio while considerably improving its fiscal balance
(Figures 19 and 20). As for the Sistema General de Regalías, its aim is to achieve a fairer
distribution of revenues across regions and a more efficient use of these funds to promote
productivity and regional development.
From a macroeconomic standpoint, these measures are crucial to ensuring stability in the face of
higher commodity-related export and fiscal revenues. First, the improved fiscal situation will

reduce the vulnerability of the economy to adverse shocks and will enhance the credibility of the
inflation target. Second, the savings generated by both the fiscal rule and the system for
distributing royalties will mitigate the real appreciation of the currency that naturally follows
from a commodity boom, hence alleviating concerns of the Dutch disease. And third, the fiscal
rule will contribute to the adoption of countercyclical fiscal policies and support the role that
monetary policy plays in this respect.
The country is also likely to attract large capital inflows due to an improved risk perception.
Authorities face the challenge of maximizing the return on large, potentially volatile capital
flows, and on this regard structural policies aimed at boosting productivity will be helpful. For its
part, the Banco de la República will maintain a flexible exchange rate but accelerate the
accumulation of international reserves to counter a higher probability of misalignment of the
exchange rate, help curb the risks of the recent slowdown of the global economy, and aid the
current Colombian expansionary monetary policy.
Recent free trade agreements (FTA) with the United States, Colombia’s largest trading partner
with 38% of exports, and South Korea, are welcome measures to strengthen competitiveness in
tradable sectors other than mining and oil. The FTA with South Korea will deepen the insertion
of Colombia into the Asian market, which could promote a positive correlation between
commodity prices and demand for Colombian agriculture and manufacturing exports, and in turn
would help reduce the negative consequences of fluctuations in commodity prices on tradable
sectors different from energy-mining. In addition, Colombia has signed free trade agreements
with other countries in the Americas and a FTA with the European Union is close to ratification.
While the unemployment rate has declined in Colombia, it remains high for Latin American
standards, and a high proportion of the Colombian work force lies in informal, often low-
productivity jobs. The Ministry of Finance proposed a tax reform that was approved by Congress
in December of 2012, which seeks to increase revenue while decreasing the effective cost of
hiring labor, and to allow for a more efficient and progressive system.
Colombia is in the process of implementing a modern macro-prudential regulation aimed at
fostering financial deepening and introducing valuable financial products while preventing undue
leveraging or risk. On this regard, it is worth mentioning the timely introduction of
countercyclical provisions for commercial and consumer credit ahead of the international
financial crisis. In addition, a liquidity requirement similar to the one proposed by Basel III was
implemented in 2009. Most recently, capital requirements matching the standard suggested by
Basel III were introduced to be complied by banks in August this year. These measures are
essential to increase the resilience of the banking sector and help consolidate the system. As a
matter of fact, Colombian banks are now expanding abroad following important investments in
Central America by some financial groups.
Looking ahead new challenges arise. Financial supervision must adapt to a growing financial
system. In particular, it will be necessary to extend full supervisory and regulatory powers to
holding companies of financial institutions, strengthen supervision of broker-dealers and
collective investment schemes and of Colombian banks that have branches abroad. Banking
penetration must also increase.
5. Conclusion
The mid-term outlook for the Colombian economy looks promising. As I explained previously,
this favorable perspective is due in part to a permanently greater demand for commodities and
high commodity prices, as well as the expansion of the mining and energy sectors in Colombia.
But the significant improvements in the macroeconomic framework have also been fundamental,
as well as the continuous insertion of Colombia into the world economy and the strengthening of
our institutions.
Authorities face two key policy challenges to ensure sustainable and inclusive growth in the
medium-term: adjusting to an always evolving commodity boom and boosting productivity
growth. As part of the strategy to confront these challenges properly, Colombia has devised an
adequate macroeconomic policy framework. Specifically, monetary policy is based on an
inflation-targeting regime, which anchors inflation expectations and helps smooth the economic
cycle. This is coupled with a floating exchange rate policy that also plays a stabilizing role for
the economy and a sound banking sector.
The adoption of a fiscal rule contribute to the exercise of a countercyclical macroeconomic
policy, while the royalty distribution law help save a portion of oil revenues and ensure a fairer
and more efficient distribution system. This will reduce the impact of rising oil revenue on
domestic demand as well as on inflation and on the exchange rate.
09/04/2013
1
0
500
1.000
1.500
2.000
2.500
3.000
Bra
zil
Mexic
o
Arg
entina
Co
lom
bia
Venezuela
Chile
Peru
Ecuador
Uru
guay
Bolivia
Latin America- GDP 2012 (USD Billions)
Figure 1
Source: IMF-WEO October 2012
APÉNDICE
-2%
-1%
0%
1%
2%
3%
4%
5%
6%
7%
8%
20
01
20
02
20
03
20
04
20
05
20
06
20
07
20
08
20
09
20
10
20
11
20
12
% o
f G
DP
Growth GDP 2001-2012
Latin America and the Caribbean Colombia Average 1980-2012
Figure 2
Source: DANE and IMF
09/04/2013
2
3,5%
2,7%
4,2%
0,0%
0,5%
1,0%
1,5%
2,0%
2,5%
3,0%
3,5%
4,0%
4,5%
1980-1990 1991-2000 2001-2012*
ColombiaGDP Average Growth
Figure 3
Source: DANE and Banco de la República (IV quarter of 2012* estimated)
0
1000
2000
3000
4000
5000
6000
7000
1960 1963 1966 1969 1972 1975 1978 1981 1984 1987 1990 1993 1996 1999 2002 2005 2008 2011
GNI per capita, Atlas method (current US$)
Source: World Bank
Low Income
Lower middle Income
Upper middle Income
Figure 4
09/04/2013
3
10%
12%
14%
16%
18%
20%
22%
24%
26%
28%
30%
1990
1991
1992
1993
1994
1995
1996
1997
1998
1999
2000
2001
2002
2003
2004
2005
2006
2007
2008
2009
2010
2011
2012
*
% o
f G
DP
Investment as a percentage of GDP
Investment (%GDP) Average 1970-2011
Source: DANE and Banco de la República's calculations.* Data for 2012 corresponds to the sum of the first three quarters of the year.
Figure 5
Figure 6
10%
15%
20%
25%
30%
35%
40%
45%
50%
19
90
19
91
19
92
19
93
19
94
19
95
19
96
19
97
19
98
19
99
20
00
20
01
20
02
20
03
20
04
20
05
20
06
20
07
20
08
20
09
20
10
20
11
20
12
*
% o
f G
DP
Openness indicator as a percentage of GDP 1/
Openness indicator (%GDP) Average 1970-2011
Source: DANE and Banco de la República's calculations.1/ (Imports + Exports)/GDP.

09/04/2013
4
5,9%
2,6%
4,5%
0,0%
1,0%
2,0%
3,0%
4,0%
5,0%
6,0%
7,0%
2004-2007 2008-2009 2010-2012
ColombiaGDP Average Growth
Figure 7
Source: DANE and Banco de la República (projections for IV quarter of 2012)
0,000
0,005
0,010
0,015
0,020
0,025
0,030
0,035
0,040
19
89
19
90
19
91
19
92
19
93
19
94
19
95
19
96
19
97
19
98
19
99
20
00
20
01
20
02
20
03
20
04
20
05
20
06
20
07
20
08
20
09
20
10
20
11
20
12
Sta
nd
ard
De
via
tio
n(1
0-y
ea
r ro
llin
g w
ind
ow
)
GDP Volatility
Colombia Latin America and the Caribbean
Figure 8
Source: Banco de la República and IMF
09/04/2013
5
0%
5%
10%
15%
20%
25%
30%
35%
1972
1974
1976
1978
1980
1982
1984
1986
1988
1990
1992
1994
1996
1998
2000
2002
2004
2006
2008
2010
2012
2014
*
Inflation rate (annual change)
Total CPI Average 72-00
22.1%
3%
Figure 9
Source: DANE. *Projected
1%
2%
3%
4%
5%
6%
7%
1%
2%
3%
4%
5%
6%
7%
Fe
b-0
8
Ma
y-0
8
Au
g-0
8
No
v-0
8
Fe
b-0
9
Ma
y-0
9
Au
g-0
9
No
v-0
9
Fe
b-1
0
Ma
y-1
0
Au
g-1
0
No
v-1
0
Fe
b-1
1
Ma
y-1
1
Au
g-1
1
No
v-1
1
Fe
b-1
2
Ma
y-1
2
Au
g-1
2
No
v-1
2
Fe
b-1
3
Inflation Expectations
Survey 1 year 5 years
Figure 10
Source: MEC, SEN and Banco de la República
09/04/2013
6
2
4
6
8
10
feb
-07
ag
o-0
7
feb
-08
ag
o-0
8
feb
-09
ag
o-0
9
feb
-10
ag
o-1
0
feb
-11
ag
o-1
1
feb
-12
ag
o-1
2
feb
-13
Policy and Interbank interest rates
Interbank Rate Policy
Source: Superfinanciera and Banco de la República.
Figure 11
-6,0%
-4,0%
-3,2%
-0,9% -0,3%
0,4% 0,9% 0,9%
1,7%
2,4%
3,4%
-0,6%
-3,5%
-1,5%
-8,0%
-6,0%
-4,0%
-2,0%
0,0%
2,0%
4,0%
Me
xico
Pa
raguay
Ve
ne
zuela
Ch
ile
Brazil
Ecuad
or
Argen
tina
Pe
ru
Co
lom
bia
Uru
guay
Bo
livia
Wo
rld
Ad
vanced
econ
om
ies
Latin A
me
rica
GDP Growth - 2009
Source: FMI
Figure 12

09/04/2013
7
1600
1800
2000
2200
2400
2600
2800
feb
-07
ago
-07
feb
-08
ago
-08
feb
-09
ago
-09
feb
-10
ago
-10
feb
-11
ago
-11
feb
-12
ago
-12
feb
-13
COP/USD Colombian exchange rate
Source: Banco de la República.
Figure 13
55% 62% 61% 56%56%
55% 56% 57% 49%
45% 36% 30% 28%
45% 38% 39% 44%
44%
45%
44%
43%
51%
55%
64%
70% 72%
0
10.000
20.000
30.000
40.000
50.000
60.000
2000 2001 2002 2003 2004 2005 2006 2007 2008 2009 2010 2011 2012(Jan-Nov)
To
tal
Ex
po
rts
(US
$ m
illi
on
s)
Composition of Colombian Exports
Others Mining goods
Figure 14
Source: DANE - DIAN
09/04/2013
8
75
100
125
150
175
200e
ne
-19
81
en
e-1
98
3
en
e-1
98
5
en
e-1
98
7
en
e-1
98
9
en
e-1
99
1
en
e-1
99
3
en
e-1
99
5
en
e-1
99
7
en
e-1
99
9
en
e-2
00
1
en
e-2
00
3
en
e-2
00
5
en
e-2
00
7
en
e-2
00
9
en
e-2
01
1
en
e-2
01
3
Terms of Trade Index 1994=100
Terms of Trade Average
Source: Banco de la República.
Figure 15
Figure 16
-1.000
1.000
3.000
5.000
7.000
9.000
11.000
13.000
15.000
2000 2001 2002 2003 2004 2005 2006 2007 2008 2009 2010 2011 2012
Direct Investment in Colombia(Million dollars)
Mining sector Other sectors
Source: Banco de la República (projectios for 2012)

09/04/2013
9
2015:1228 mbd
2018:1313 mbd
-15%
-10%
-5%
0%
5%
10%
15%
20%
0
200
400
600
800
1.000
1.200
1.400
1.600
20
00
20
01
20
02
20
03
20
04
20
05
20
06
20
07
20
08
20
09
20
10
20
11
20
12
20
13
20
14
20
15
20
16
20
17
20
18
20
19
20
20
Ye
ar -o
n-ye
ar p
erce
nta
ge ch
an
ge
tho
usa
nd
ba
rre
ls p
er
da
y
Production Annual change
Figure 17
Oil Production in Colombia
Source: Medium Term Fiscal Framework 2012. Ministerio de Hacienda y Crédito Público.
2015: 99 mill-ton
2020:103 mill-ton
-15%
-10%
-5%
0%
5%
10%
15%
20%
25%
30%
0
20
40
60
80
100
120
20
00
20
01
20
02
20
03
20
04
20
05
20
06
20
07
20
08
20
09
20
10
20
11
20
12
20
13
20
14
20
15
20
16
20
17
20
18
20
19
20
20
Ye
ar -o
n-y
ea
r pe
rcen
tag
e ch
an
ge
M
illi
on
s o
f t
on
s
Production Annual change
Figure 18
Coal Production in Colombia
Source: Medium Term Fiscal Framework 2012. Ministerio de Hacienda y Crédito Público.
09/04/2013
10
0,2
0,4
0,5
0,3
0,4
0,3
0,2
0,2
0,1
0,2 0,2 0,2 0,3
0,3 0,3
0,3 0,3 0,2
0,4
0,6
0,7
0,5
0,7
0,6
0,5
0,4
0,3
-
0,1
0,2
0,3
0,4
0,5
0,6
0,7
0,8
2012 2013 2014 2015 2016 2017 2018 2019 2020
CG Savings 1/ Territorial entities savings 2/ Total Savings
Figure 19
Expected savings from energy sector (% GDP)
Source: Medium Term Fiscal Framework 2012. Ministerio de Hacienda y Crédito Público. 1/ Savings generated by the fiscal rule 2/ Saving and stabilization fund - FAE
-3,6
-1,4 -1,7
-1,0-0,9
0,2
0,9
-1,1
-0,1
0,30,4 0,4 0,6 0,7 0,7 0,8 0,8 0,9 1,0
1,2
-4,0
-3,0
-2,0
-1,0
0,0
1,0
2,0
3,0
19
99
20
00
20
01
20
02
20
03
20
04
20
05
20
06
20
07
20
08
20
09
20
10
20
11
20
12
20
13
20
14
20
15
20
16
20
17
20
18
20
19
20
20
20
21
20
22
20
23
Figure 20
Central Government Primary Balance 1/ (% GDP)
Source: Medium Term Fiscal Framework 2012. Ministerio de Hacienda y Crédito Público. 1/ Excludes the costs of financial restructuring.