colliers international | north america highlights ...north american industrial markets scale back...
TRANSCRIPT
North American Industrial Markets Scale Back LossesRoss J. Moore | Executive Vice President, Market and Economic Research
U.S. industrial real estate markets finished the year on a weak note, but were a marked improve-ment compared with the prior three quarters. The backdrop for warehouse markets was still fairly dismal with most warehouse users looking to consolidate their space needs or hold their real estate needs steady at best, but the tone was more upbeat than earlier in the year. Rents, however, fell again and continued an eight quarter long series of declines. Even though the economy registered robust growth in the fourth quarter and further expansion is expected in the coming quarters, U.S. warehouse markets are unlikely to stage any vigorous bounce back anytime soon. Even though the Institute for Supply Management (ISM) manufacturing index posted a sixth consecutive reading above the critical “50” level (January – 58.4) the business landscape remains somewhat fragile limit-ing any sort of robust recovery. For 2010 a further increase in vacancy is anticipated, although at a much reduced rate, with vacancies plateauing as early as Q2. With almost no construction coming onto the market and forecasts for continued economic growth over the next few quarters, occupan-cies should begin to rise by midyear and firmer fundamentals by year end. Rental growth, however, will not be part of the real estate lexicon during 2010 and many markets may have to wait until 2012 before rents start to rise.
U.S. warehouse markets continue to lose tenants – but at a reduced rate. Fourth quarter absorption was again negative, with occupied space decreasing by 17.6 million square feet (MSF). Fourth quarter results, however, were a significant improvement from last quarter when 47.3 MSF was returned to the market but marked a return to levels registered in the year-ago period. This brought year-to-date absorption to –160.7 MSF and leaves occupied space 187.8 MSF below peak levels recorded at the end of Q1 2008. While a large number, this represents just a 1.6% decline in occupied space. Canadian markets, however, finished the year with a sizeable gain in occupied space with fourth quarter absorption totaling 2.2 MSF.
Warehouse construction continues to fall to record lows. Fourth quarter comple-tions totaled just 7.0 MSF, a modest drop from the third quarter, but the lowest on record. New
COLLIERS INTERNATIONAL 1
I N D U S T R I A L | F O U R T H Q U A R T E R | 2 0 0 9
www.colliers.com
HighlightsCO L L I E R S I N T E R N A T I O N A L | N O R T H A M E R I C A
Absorption Completions Vacancy
-60
-40
-20
0
20
40
60
Q4 2009Q3 2009Q2 2009Q1 2009Q4 2008
7
8
9
10
11%
Mill
ion
Squa
reFe
et
Vac
ancy
(%
)
Copyright © 2010 Colliers International. Colliers International is a worldwide affiliation of independently owned and operated companies.
MARKET INDICATORS
USA INDUSTRIAL MARKET Q4 2008 – Q4 2009
USA INDUSTRIAL MARKET SUMMARY STATISTICSFOURTH QUARTER 2009
Vacancy Rate: 10.92%
Change from Q3 2009: 0.18
Absorption:
–17.6 Million Square Feet
New Construction:
7.0 Million Square Feet
Under Construction:
15.4 Million Square Feet
Asking Rents Per Square Foot:
Average Warehouse/
Distribution Center: $4.99
Change from Q3 2009: –2.97%
continued on page 7
VACANCY
NET ABSORPTION
CONSTRUCTION
RENTAL RATE
*Projected, relative to prior period
Q42009
Q1 2010*

2 COLLIERS INTERNATIONAL
UNITED STATES OF AMERICA INDUSTRIAL SURVEY
MARKETEXISTING INVENTORY (SF)
DEC. 31, 2009NEW CONSTRUCTION
Q4 2009 (SF)NEW CONSTRUCTION
YTD 2009 (SF)CURRENTLY UNDER CONSTRUCTION (SF)
Atlanta, GA 576,883,000 0 1,548,000 19,000
Bakersfield, CA 30,943,000 172,000 358,000 507,000
Baltimore, MD 230,481,000 205,000 516,000 370,000
Boise, ID 31,671,000 0 733,000 35,000
Boston, MA 150,335,000 0 0 0
Charleston, SC 30,996,000 20,000 180,000 60,000
Charlotte, NC 267,511,000 299,000 2,709,000 426,000
Chicago, IL 1,311,920,000 269,000 6,641,000 1,693,000
Cleveland, OH 413,330,000 26,000 67,000 14,000
Columbia SC 35,120,000 465,000 966,000 0
Columbus, OH 245,054,000 48,000 271,000 97,000
Dallas/Ft. Worth, TX 741,126,000 149,000 10,495,000 1,600,000
Denver, CO 272,991,000 29,000 535,000 688,000
Detroit, MI 461,159,000 45,000 290,000 61,000
Fairfield, CA 33,018,000 – – 400,000
Fresno, CA 48,600,000 0 100,000 0
Ft. Lauderdale/Broward County, FL 129,576,000 25,000 912,000 0
Greenville, SC 154,218,000 0 83,000 77,000
Hartford, CT 96,975,000 0 608,000 58,000
Honolulu, HI 38,198,000 50,000 250,000 25,000
Houston, TX 478,731,000 329,000 6,690,000 1,302,000
Jacksonville, FL 116,247,000 0 0 414,000
Las Vegas, NV 106,955,000 496,000 1,700,000 371,000
Little Rock, AR 44,303,000 0 90,000 750,000
Los Angeles – Inland Empire, CA 378,431,000 446,000 4,249,000 667,000
Los Angeles, CA 874,685,000 392,000 1,963,000 450,000
Louisville, KY 94,301,000 103,000 1,288,000 818,000
Memphis, TN 189,792,000 157,000 257,000 400,000
Miami, FL 227,913,000 0 1,207,000 165,000
Milwaukee, WI 282,200,000 50,000 1,500,000 200,000
New Jersey – Central 293,077,000 593,000 868,000 0
New Jersey – Northern 425,542,000 0 172,000 0
Oakland, CA 131,233,000 0 0 53,000
Orange County, CA 200,837,000 0 0 0
Orlando, FL 140,654,000 0 0 0
Philadelphia, PA 424,738,000 573,000 3,226,000 1,017,000
Phoenix, AZ 226,797,000 1,267,000 1,639,000 812,000
Pleasanton/Walnut Creek, CA 32,911,000 0 0 54,000
Portland, OR 168,672,000 210,000 817,000 520,000
Raleigh, NC 90,779,000 46,000 368,000 30,000
Reno, NV 73,518,000 0 32,000 0
Sacramento, CA 184,575,000 11,000 123,000 43,000
San Diego, CA 189,017,000 0 1,102,000 122,000
San Francisco Peninsula, CA 40,808,000 0 0 0
San Jose/Silicon Valley, CA 253,311,000 0 0 135,000
Seattle/Puget Sound, WA 288,546,000 137,000 1,097,000 137,000
St. Louis, MO 263,879,000 163,000 666,000 0
Stockton/San Joaquin County, CA 89,377,000 86,000 2,404,000 0
Tampa Bay, FL 207,854,000 0 116,000 38,000
Washington, DC 203,240,000 100,000 1,425,000 726,000
West Palm Beach, FL 56,529,000 0 20,000 0
USA TOTAL/AVERAGE 12,079,555,000 6,960,000 60,280,000 15,354,000

COLLIERS INTERNATIONAL 3
MARKETABSORPTION Q4 2009 (SF)
ABSORPTION YTD 2009 (SF)
VACANCY RATE SEPT. 30, 2009 (%)
VACANCY RATE DEC. 31, 2009 (%)
Atlanta, GA (1,147,000) (3,188,000) 13.1 13.3
Bakersfield, CA 296,000 25,000 8.5 8.2
Baltimore, MD (304,000) (1,856,000) 11.3 11.4
Boise, ID (200,000) (1,223,000) 11.4 12.0
Boston, MA (1,932,000) (5,945,000) 19.7 21.3
Charleston, SC 20,000 628,000 10.7 10.8
Charlotte, NC 345,000 (4,220,000) 12.5 12.5
Chicago, IL (3,762,000) (22,091,000) 11.9 12.1
Cleveland, OH (367,000) (3,692,000) 8.0 8.1
Columbia SC 607,000 464,000 8.1 8.6
Columbus, OH (376,000) (1,366,000) 12.4 12.6
Dallas-Ft. Worth, TX 78,000 (5,591,000) 11.7 11.7
Denver, CO 486,000 349,000 8.9 8.6
Detroit, MI (1,809,000) (5,433,000) 13.9 14.3
Fairfield, CA (299,000) (952,000) 11.5 12.9
Fresno, CA 50,000 (405,000) 8.0 8.2
Ft. Lauderdale/Broward County, FL (845,000) (3,199,000) 9.9 10.6
Greenville, SC 444,000 (36,000) 11.2 10.9
Hartford, CT 98,000 98,000 9.4 9.3
Honolulu, HI (88,000) (211,000) 4.6 4.8
Houston, TX 441,000 1,723,000 6.6 6.7
Jacksonville, FL (209,000) (1,485,000) 9.2 10.3
Las Vegas, NV (986,000) (3,384,000) 14.3 15.6
Little Rock, AR (1,252,000) (3,279,000) 15.4 16.2
Los Angeles – Inland Empire, CA 567,000 (6,043,000) 15.4 15.2
Los Angeles, CA (4,341,000) (17,635,000) 5.4 5.9
Louisville, KY (2,180,000) (2,809,000) 8.3 10.6
Memphis, TN 2,190,000 (1,556,000) 14.7 13.7
Miami, FL (670,000) (4,788,000) 10.1 10.4
Milwaukee, WI (643,000) (245,000) 7.8 8.0
New Jersey – Central (122,000) (1,460,000) 9.9 10.2
New Jersey – Northern (417,000) (4,587,000) 7.5 7.6
Oakland, CA 1,120,000 (598,000) 9.3 8.4
Orange County, CA (451,000) (3,138,000) 5.8 6.0
Orlando, FL (147,000) (3,945,000) 13.2 13.3
Philadelphia, PA (136,000) (1,096,000) 9.9 10.1
Phoenix, AZ 1,031,000 (4,101,000) 17.6 17.2
Pleasanton/Walnut Creek, CA 222,000 (953,000) 15.3 14.6
Portland, OR 577,000 (1,660,000) 7.8 7.6
Raleigh, NC (226,000) (2,601,000) 13.5 13.8
Reno, NV (198,000) (1,947,000) 15.0 15.3
Sacramento, CA (322,000) (1,930,000) 11.4 11.6
San Diego, CA (405,000) (3,771,000) 11.3 11.6
San Francisco Peninsula, CA (211,000) (1,566,000) 9.5 10.0
San Jose/Silicon Valley, CA 451,000 (8,347,000) 13.7 13.3
Seattle/Puget Sound, WA (732,000) (2,498,000) 7.0 7.3
St. Louis, MO 345,000 (5,667,000) 10.7 10.6
Stockton/San Joaquin County, CA (593,000) (2,487,000) 16.8 17.5
Tampa Bay, FL (1,015,000) (5,768,000) 10.5 10.9
Washington, DC (412,000) (3,156,000) 12.8 13.1
West Palm Beach, FL (130,000) (2,050,000) 12.2 12.4
USA TOTAL/AVERAGE (17,562,000) (160,671,000) 10.74 10.92
UNITED STATES OF AMERICA INDUSTRIAL SURVEY

4 COLLIERS INTERNATIONAL
UNITED STATES OF AMERICA INDUSTRIAL SURVEY LAND PRICE, SALES PRICE AND CAP RATE AS OF DECEMBER 2009
MARKETLAND PRICE
(US$ PSF)SALES PRICE
(US$ PSF)CAP
RATE %VACANCY FORECAST
(3 MONTHS)ABSORPTION FORECAST
(3 MONTHS)RENT FORECAST
(3 MONTHS)
Atlanta, GA 1.50 32.83 8.00 Down Up Same
Bakersfield, CA 3.50 48.00 9.50 Same Same Same
Baltimore, MD – – – – – –
Boise, ID 2.90 – – Up Down Down
Boston, MA 50.72 54.00 7.50 Down Down Down
Charleston, SC 2.30 45.00 9.50 Down Up Up
Charlotte, NC – – – – – –
Chicago, IL 4.37 38.00 8.25 Up Down Down
Cleveland, OH 1.32 48.00 10.25 Up Down Down
Columbia SC 1.00 – – Down Down Same
Columbus, OH – – – – – –
Dallas-Ft. Worth, TX 1.75 28.00 8.80 Up Down Down
Denver, CO 3.25 37.00 9.00 Same Same Same
Detroit, MI – 40.00 8.00 Up Same Down
Fairfield, CA – – – Down Up Same
Fresno, CA 2.00 30.00 8.50 Up Up Same
Ft. Lauderdale/Broward County, FL 11.50 67.00 – Up Down Down
Greenville, SC 0.90 38.00 9.50 Down Up Same
Hartford, CT 2.30 40.00 10.00 Same Same Same
Honolulu, HI 42.00 – – Up Down Down
Houston, TX 6.12 75.00 10.00 Up Down Down
Jacksonville, FL – 48.00 9.00 Up Down Down
Las Vegas, NV 10.81 – – Up Up Down
Little Rock, AR 2.48 38.50 10.25 Same Same Same
Los Angeles – Inland Empire, CA 4.00 74.00 8.75 Down Up Same
Los Angeles, CA 15.00 103.00 7.75 Up Down Down
Louisville, KY 3.32 32.00 11.00 Same Same Same
Memphis, TN 1.00 25.00 11.25 Down Up Same
Miami, FL 14.00 72.00 – Up Down Down
Milwaukee, WI 2.10 50.00 9.75 Same Same Same
New Jersey – Central – 45.00 8.00 Up Down Down
New Jersey – Northern – 58.93 8.00 Up Down Down
Oakland, CA – – 8.00 Down Up Same
Orange County, CA 18.32 129.00 7.50 Same Same Down
Orlando, FL 2.40 43.10 9.20 Same Up Down
Philadelphia, PA 2.90 40.00 9.50 Down Up Same
Phoenix, AZ 7.86 41.63 7.50 Down Up Down
Pleasanton/Walnut Creek, CA 13.00 – – Same Same Same
Portland, OR 5.58 77.56 – Same Down Same
Raleigh, NC – – – – – –
Reno, NV 3.50 46.03 8.50 Up Down Same
Sacramento, CA 8.00 50.00 8.20 Same Up Same
San Diego, CA – 87.02 8.49 Up Same Same
San Francisco Peninsula, CA 175.00 300.00 6.50 Up Same Same
San Jose/Silicon Valley, CA 37.41 57.50 8.50 Same Down Down
Seattle/Puget Sound, WA – – – Up Down Down
St. Louis, MO – – – – – –
Stockton/San Joaquin County, CA 5.50 53.00 8.60 Up Down Down
Tampa Bay, FL – 44.95 9.00 Up Up Down
Washington, DC – – – – – –
West Palm Beach, FL 9.00 68.00 – Up Down Down
USA AVERAGE 13.29 59.60 8.82
COLLIERS INTERNATIONAL 5
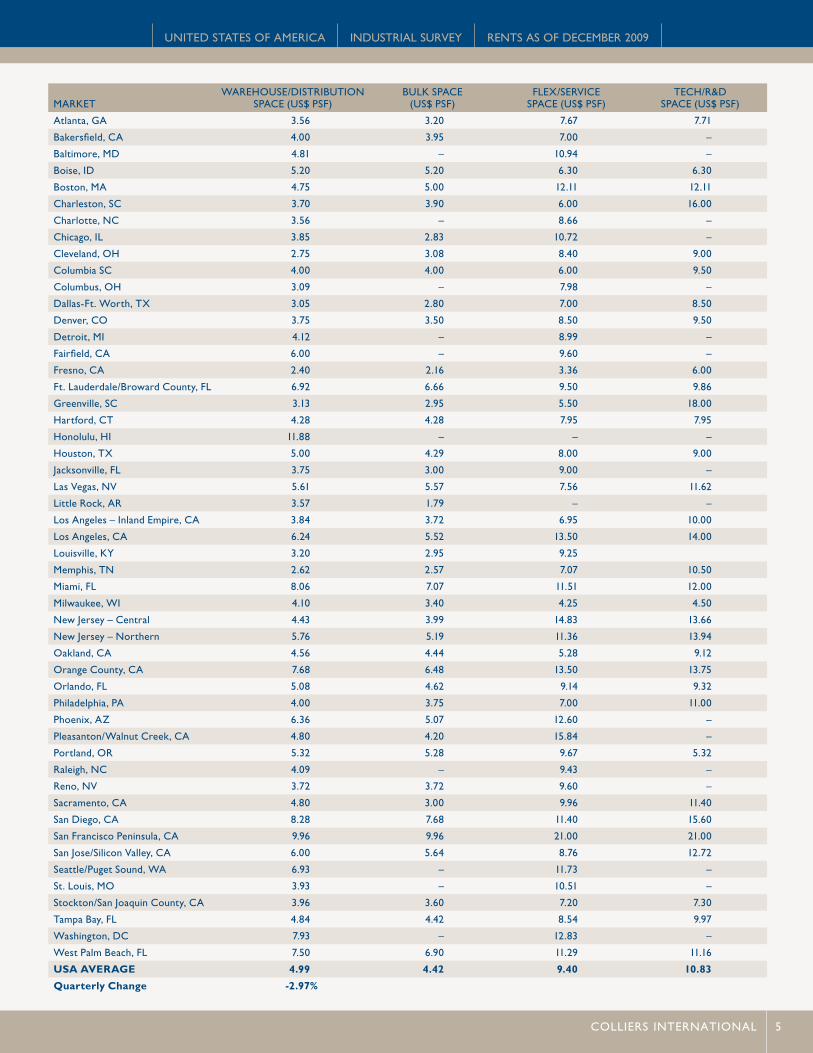
MARKETWAREHOUSE/DISTRIBUTION
SPACE (US$ PSF)BULK SPACE
(US$ PSF)FLEX/SERVICE
SPACE (US$ PSF)TECH/R&D
SPACE (US$ PSF)
Atlanta, GA 3.56 3.20 7.67 7.71
Bakersfield, CA 4.00 3.95 7.00 –
Baltimore, MD 4.81 – 10.94 –
Boise, ID 5.20 5.20 6.30 6.30
Boston, MA 4.75 5.00 12.11 12.11
Charleston, SC 3.70 3.90 6.00 16.00
Charlotte, NC 3.56 – 8.66 –
Chicago, IL 3.85 2.83 10.72 –
Cleveland, OH 2.75 3.08 8.40 9.00
Columbia SC 4.00 4.00 6.00 9.50
Columbus, OH 3.09 – 7.98 –
Dallas-Ft. Worth, TX 3.05 2.80 7.00 8.50
Denver, CO 3.75 3.50 8.50 9.50
Detroit, MI 4.12 – 8.99 –
Fairfield, CA 6.00 – 9.60 –
Fresno, CA 2.40 2.16 3.36 6.00
Ft. Lauderdale/Broward County, FL 6.92 6.66 9.50 9.86
Greenville, SC 3.13 2.95 5.50 18.00
Hartford, CT 4.28 4.28 7.95 7.95
Honolulu, HI 11.88 – – –
Houston, TX 5.00 4.29 8.00 9.00
Jacksonville, FL 3.75 3.00 9.00 –
Las Vegas, NV 5.61 5.57 7.56 11.62
Little Rock, AR 3.57 1.79 – –
Los Angeles – Inland Empire, CA 3.84 3.72 6.95 10.00
Los Angeles, CA 6.24 5.52 13.50 14.00
Louisville, KY 3.20 2.95 9.25
Memphis, TN 2.62 2.57 7.07 10.50
Miami, FL 8.06 7.07 11.51 12.00
Milwaukee, WI 4.10 3.40 4.25 4.50
New Jersey – Central 4.43 3.99 14.83 13.66
New Jersey – Northern 5.76 5.19 11.36 13.94
Oakland, CA 4.56 4.44 5.28 9.12
Orange County, CA 7.68 6.48 13.50 13.75
Orlando, FL 5.08 4.62 9.14 9.32
Philadelphia, PA 4.00 3.75 7.00 11.00
Phoenix, AZ 6.36 5.07 12.60 –
Pleasanton/Walnut Creek, CA 4.80 4.20 15.84 –
Portland, OR 5.32 5.28 9.67 5.32
Raleigh, NC 4.09 – 9.43 –
Reno, NV 3.72 3.72 9.60 –
Sacramento, CA 4.80 3.00 9.96 11.40
San Diego, CA 8.28 7.68 11.40 15.60
San Francisco Peninsula, CA 9.96 9.96 21.00 21.00
San Jose/Silicon Valley, CA 6.00 5.64 8.76 12.72
Seattle/Puget Sound, WA 6.93 – 11.73 –
St. Louis, MO 3.93 – 10.51 –
Stockton/San Joaquin County, CA 3.96 3.60 7.20 7.30
Tampa Bay, FL 4.84 4.42 8.54 9.97
Washington, DC 7.93 – 12.83 –
West Palm Beach, FL 7.50 6.90 11.29 11.16
USA AVERAGE 4.99 4.42 9.40 10.83
Quarterly Change -2.97%
UNITED STATES OF AMERICA INDUSTRIAL SURVEY RENTS AS OF DECEMBER 2009
6 COLLIERS INTERNATIONAL
CANADA INDUSTRIAL SURVEY AND RENTS
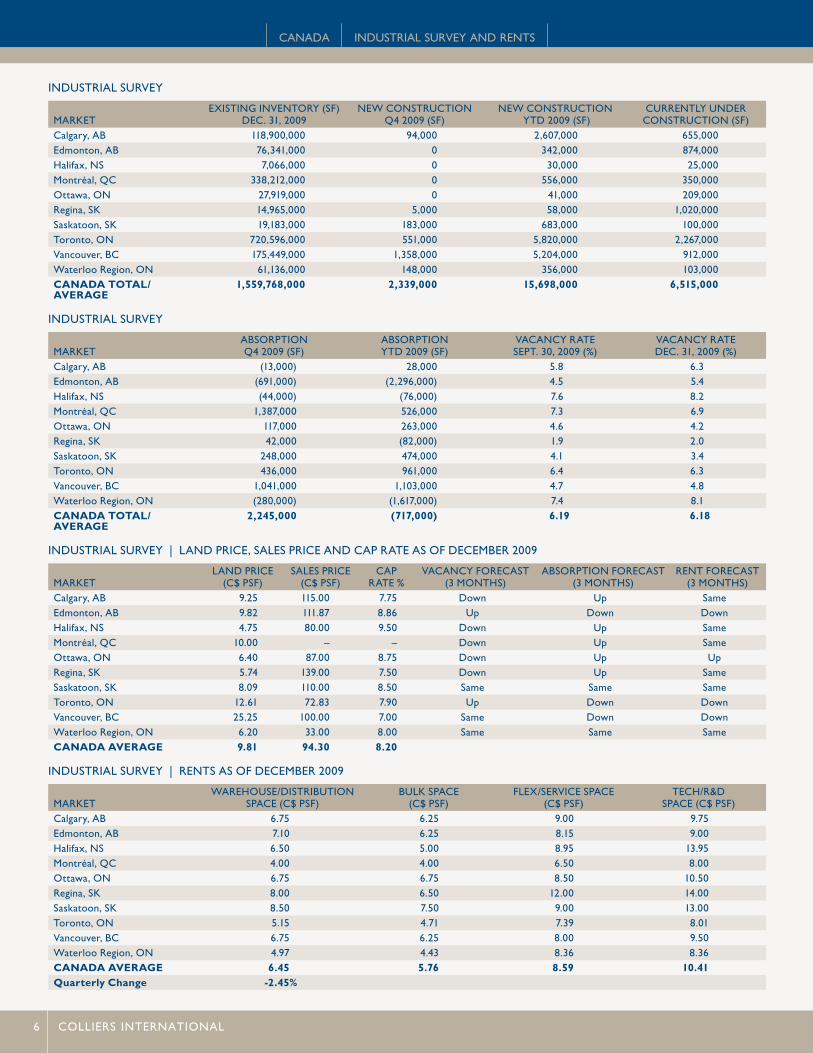
INDUSTRIAL SURVEY
MARKETEXISTING INVENTORY (SF)
DEC. 31, 2009NEW CONSTRUCTION
Q4 2009 (SF)NEW CONSTRUCTION
YTD 2009 (SF)CURRENTLY UNDER CONSTRUCTION (SF)
Calgary, AB 118,900,000 94,000 2,607,000 655,000Edmonton, AB 76,341,000 0 342,000 874,000Halifax, NS 7,066,000 0 30,000 25,000Montréal, QC 338,212,000 0 556,000 350,000Ottawa, ON 27,919,000 0 41,000 209,000Regina, SK 14,965,000 5,000 58,000 1,020,000Saskatoon, SK 19,183,000 183,000 683,000 100,000Toronto, ON 720,596,000 551,000 5,820,000 2,267,000Vancouver, BC 175,449,000 1,358,000 5,204,000 912,000Waterloo Region, ON 61,136,000 148,000 356,000 103,000CANADA TOTAL/AVERAGE
1,559,768,000 2,339,000 15,698,000 6,515,000
INDUSTRIAL SURVEY
MARKETABSORPTION Q4 2009 (SF)
ABSORPTION YTD 2009 (SF)
VACANCY RATE SEPT. 30, 2009 (%)
VACANCY RATE DEC. 31, 2009 (%)
Calgary, AB (13,000) 28,000 5.8 6.3Edmonton, AB (691,000) (2,296,000) 4.5 5.4Halifax, NS (44,000) (76,000) 7.6 8.2Montréal, QC 1,387,000 526,000 7.3 6.9Ottawa, ON 117,000 263,000 4.6 4.2Regina, SK 42,000 (82,000) 1.9 2.0Saskatoon, SK 248,000 474,000 4.1 3.4Toronto, ON 436,000 961,000 6.4 6.3Vancouver, BC 1,041,000 1,103,000 4.7 4.8Waterloo Region, ON (280,000) (1,617,000) 7.4 8.1CANADA TOTAL/AVERAGE
2,245,000 (717,000) 6.19 6.18
INDUSTRIAL SURVEY | LAND PRICE, SALES PRICE AND CAP RATE AS OF DECEMBER 2009
MARKETLAND PRICE
(C$ PSF)SALES PRICE
(C$ PSF)CAP
RATE %VACANCY FORECAST
(3 MONTHS)ABSORPTION FORECAST
(3 MONTHS)RENT FORECAST
(3 MONTHS)Calgary, AB 9.25 115.00 7.75 Down Up SameEdmonton, AB 9.82 111.87 8.86 Up Down DownHalifax, NS 4.75 80.00 9.50 Down Up SameMontréal, QC 10.00 – – Down Up SameOttawa, ON 6.40 87.00 8.75 Down Up UpRegina, SK 5.74 139.00 7.50 Down Up SameSaskatoon, SK 8.09 110.00 8.50 Same Same SameToronto, ON 12.61 72.83 7.90 Up Down DownVancouver, BC 25.25 100.00 7.00 Same Down DownWaterloo Region, ON 6.20 33.00 8.00 Same Same SameCANADA AVERAGE 9.81 94.30 8.20
INDUSTRIAL SURVEY | RENTS AS OF DECEMBER 2009
MARKETWAREHOUSE/DISTRIBUTION
SPACE (C$ PSF)BULK SPACE
(C$ PSF)FLEX/SERVICE SPACE
(C$ PSF)TECH/R&D
SPACE (C$ PSF)Calgary, AB 6.75 6.25 9.00 9.75Edmonton, AB 7.10 6.25 8.15 9.00Halifax, NS 6.50 5.00 8.95 13.95Montréal, QC 4.00 4.00 6.50 8.00Ottawa, ON 6.75 6.75 8.50 10.50Regina, SK 8.00 6.50 12.00 14.00Saskatoon, SK 8.50 7.50 9.00 13.00Toronto, ON 5.15 4.71 7.39 8.01Vancouver, BC 6.75 6.25 8.00 9.50Waterloo Region, ON 4.97 4.43 8.36 8.36CANADA AVERAGE 6.45 5.76 8.59 10.41Quarterly Change -2.45%

COLLIERS INTERNATIONAL 7
MARKETVACANCY RATEDEC. 31, 2009 (%)
Boston, MA 21.3Stockton/San Joaquin County, CA 17.5Phoenix, AZ 17.2Little Rock, AR 16.2Las Vegas, NV 15.6Reno, NV 15.3Los Angeles – Inland Empire, CA 15.2Pleasanton/Walnut Creek, CA 14.6Detroit, MI 14.3Raleigh, NC 13.8Memphis, TN 13.7Orlando, FL 13.3San Jose/Silicon Valley, CA 13.3Atlanta, GA 13.3Washington, DC 13.1Fairfield, CA 12.9Columbus, OH 12.6Charlotte, NC 12.5West Palm Beach, FL 12.4Chicago, IL 12.1Boise, ID 12.0Dallas-Ft. Worth, TX 11.7Sacramento, CA 11.6San Diego, CA 11.6Baltimore, MD 11.4Tampa Bay, FL 10.9USA AVERAGE 10.9Greenville, SC 10.9Charleston, SC 10.8Louisville, KY 10.6St. Louis, MO 10.6Ft. Lauderdale/Broward Co., FL 10.6Miami, FL 10.4Jacksonville, FL 10.3New Jersey – Central 10.2Philadelphia, PA 10.1San Francisco Peninsula, CA 10.0Hartford, CT 9.3Columbia SC 8.6Denver, CO 8.6Oakland, CA 8.4Fresno, CA 8.2Bakersfield, CA 8.2Cleveland, OH 8.1Milwaukee, WI 8.0Portland, OR 7.6New Jersey – Northern 7.6Seattle/Puget Sound, WA 7.3Houston, TX 6.7Orange County, CA 6.0Los Angeles, CA 5.9Honolulu, HI 4.8
construction is now just a fraction of that recorded at year-end 2007 when Q4 2007 warehouse completions totaled 55.5 MSF. In the coming quarters construction is anticipated to go even lower and stay well below 10 MSF per quarter for all of 2010 and quite pos-sibly 2011. Scarce construction financing and uneconomic rents have halted almost all speculative warehouse development. This was reflected in quarter-end construction activity which registered just 15.4 MSF, a substantial drop from the 153.5 MSF that was under construction at the end of the third quarter of 2007 and well below levels ever recorded.
U.S. industrial vacancy rate approaching 11.0%. The U.S. industrial warehouse vacancy rate increased by 18 basis points during the fourth quarter to register 10.92%. This was the smallest quarterly increase since vacancies started their upward march two years ago but did bring the national vacancy rate to a decade high and up by 307 basis points from the low registered in the fourth quarter of 2007. Of the 51 markets tracked across the country, 38 saw vacancies increase while thirteen registered declines. Canadian warehouse vacancies, however, stayed largely unchanged dropping by 1 basis point during the quarter to 6.18%.
Rents drop 3.0% during the quarter. Fourth quarter warehouse rents posted a modest decrease falling 3.0% to $4.99 per square foot. With this latest decrease, U.S. warehouse rents are down 9.7% over the past year and 12.3% from the peak recorded in Q4 2007. While some markets have seen rents remain steady, some metros have seen industrial lease rates fall by over 25% in the last 12 months. Canadian warehouse rents also decreased during the quarter falling 2.5% to $6.45 CAD per square foot.
GLOSSARYAbsorption – Net change in leased space over a given period of time.
Bulk Space – 100,000 square feet or more with up to 10 percent office space, the balance being general warehouse space with 20 to 36 foot ceiling heights. All loading is dock-height.
Flex Space – Single-story buildings having 10- to 18-foot ceilings with both floor-height and dock-height loading. Includes wide variation in office space utilization, ranging from retail and personal service through distribution, light industrial and occasional heavy industrial use.
Inventory – Includes all existing multi or single tenant leased and owner-occupied industrial warehouse, light manufacturing, flex and R&D properties greater than or equal to 10,000 square feet.
New Construction – Includes completed speculative and build-to-suit construction. New construction quoted on a net basis after any demolitions or conversions.
Service Space – Single story (or mezzanine) with 10- to 16-foot ceilings with frontage treatment on one side and dock-height loading or grade level roll-up doors on the other. Less than 15% office.
Tech/R&D – One- and two- story, 10- to 15-foot ceiling heights with up to 50% office/dry lab space (remainder in wet lab, workshop, storage and other support), with dock-height and floor-height loading.
Triple Net Rent – Includes rent payable to the landlord and does not include additional expenses such as taxes, insurance, maintenance, janitorial and utilities. All industrial and high-tech/R&D rents in this report are quoted on an annual, triple net per square foot basis in U.S. dollars.
Vacancy Rate – Percentage of total inventory available (both vacant and occupied) as at the survey date including direct vacant and sublease space.
Warehouse – 50,000 square feet or more with up to 15 percent office space, the balance being general warehouse space with 18 to 30 foot ceiling heights. All loading is dock-height.
The information contained herein has been obtained from sources deemed reliable. While every reasonable effort has been made to ensure its accuracy, we cannot guarantee it. No responsibility is assumed for any inaccuracies. Readers are encouraged to consult their professional advisors prior to acting on any of the material contained in this report.
North American Industrial Markets Scale Back LossesContinued from page 1
UNITED STATES OF AMERICA INDUSTRIAL SURVEY VACANCY RATES
www.colliers.com
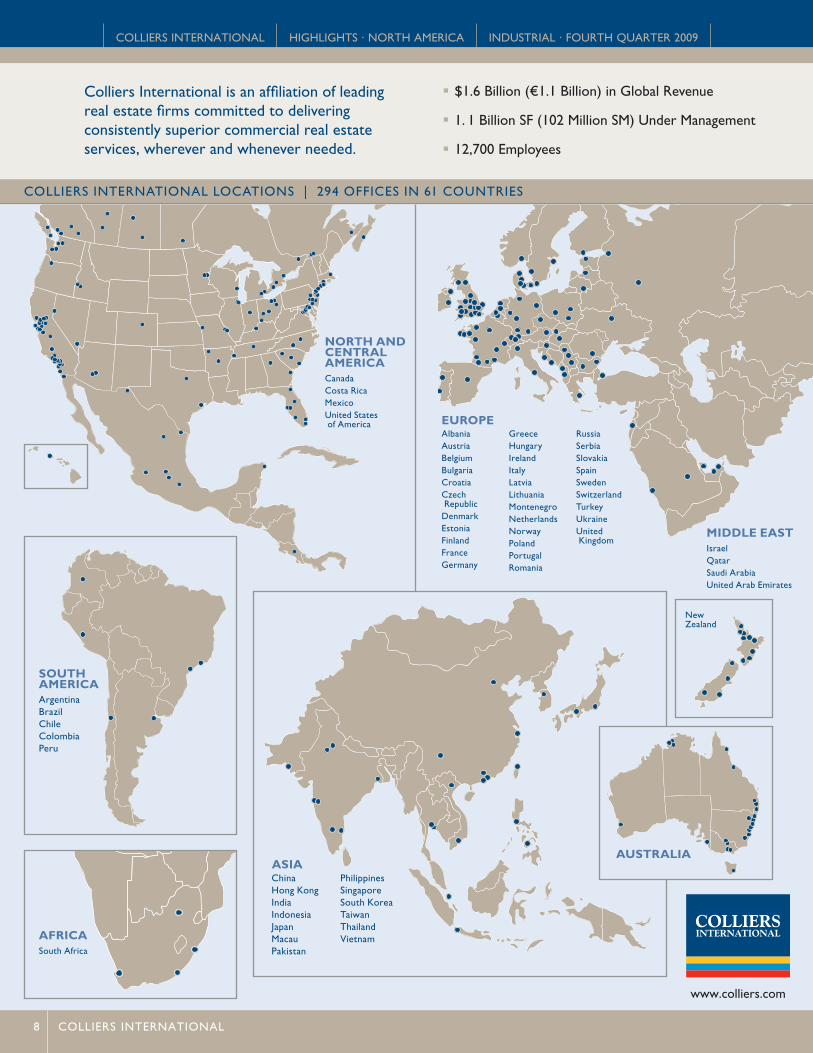
COLLIERS INTERNATIONAL LOCATIONS | 294 OFFICES IN 61 COUNTRIES
� $1.6 Billion (€1.1 Billion) in Global Revenue
� 1. 1 Billion SF (102 Million SM) Under Management
� 12,700 Employees
Colliers International is an affiliation of leading real estate firms committed to delivering consistently superior commercial real estate services, wherever and whenever needed.
COLLIERS INTERNATIONAL HIGHLIGHTS · NORTH AMERICA INDUSTRIAL · FOURTH QUARTER 2009
8 COLLIERS INTERNATIONAL