exergy destruction and losses on four north sea offshore
TRANSCRIPT

General rights Copyright and moral rights for the publications made accessible in the public portal are retained by the authors and/or other copyright owners and it is a condition of accessing publications that users recognise and abide by the legal requirements associated with these rights.
Users may download and print one copy of any publication from the public portal for the purpose of private study or research.
You may not further distribute the material or use it for any profit-making activity or commercial gain
You may freely distribute the URL identifying the publication in the public portal If you believe that this document breaches copyright please contact us providing details, and we will remove access to the work immediately and investigate your claim.
Downloaded from orbit.dtu.dk on: Oct 02, 2021
Exergy destruction and losses on four North Sea offshore platforms: A comparativestudy of the oil and gas processing plants
Voldsund, Mari ; Nguyen, Tuong-Van; Elmegaard, Brian; Ertesvåg, Ivan S.; Røsjorde, Audun; Jøssang,Knut; Kjelstrup, Signe
Published in:Energy
Link to article, DOI:10.1016/j.energy.2014.02.080
Publication date:2014
Document VersionPeer reviewed version
Link back to DTU Orbit
Citation (APA):Voldsund, M., Nguyen, T-V., Elmegaard, B., Ertesvåg, I. S., Røsjorde, A., Jøssang, K., & Kjelstrup, S. (2014).Exergy destruction and losses on four North Sea offshore platforms: A comparative study of the oil and gasprocessing plants. Energy, 74, 45–58. https://doi.org/10.1016/j.energy.2014.02.080

Exergy destruction and losses on four North Sea offshore platforms:A comparative study of the oil and gas processing plants
Mari Voldsunda, Tuong-Van Nguyenb, Brian Elmegaardb, Ivar Stale Ertesvagc, Audun Røsjorded, KnutJøssangc, Signe Kjelstrupa
aDepartment of Chemistry, Norwegian University of Science and Technology,Høgskoleringen 5, NO-7491 Trondheim, Norway
bSection of Thermal Energy, Department of Mechanical Engineering, Technical University of Denmark,Building 403, Nils Koppels Alle, DK-2800 Kongens Lyngby, Denmark
cDepartment of Energy and Process Engineering, Norwegian University of Science and TechnologyKolbjørn Hejes vei 1b, NO-7491 Trondheim, Norway
dStatoil ASAMartin Linges vei 33, NO-1364 Fornebu, Norway
Abstract
The oil and gas processing plants of four North Sea offshore platforms are analysed and compared, basedon the exergy analysis method. Sources of exergy destruction and losses are identified and the findings for thedifferent platforms are compared. Different platforms have different working conditions, which implies thatsome platforms need less heat and power than others. Reservoir properties and composition vary over thelifetime of an oil field, and therefore maintaining a high efficiency of the processing plant is challenging. Theresults of the analysis show that 27%–57% of the exergy destruction take place in the gas treatment sections,13%–29% take place in the gas recompression sections and 10%–24% occur in the production manifolds. Theexergy losses with flared gas are significant for two of the platforms. The exact potential for energy savingsand for enhancing system performances differs across offshore platforms. However, the results indicate thatthe largest rooms for improvement lie in (i) gas compression systems where large amounts of gas may becompressed and recycled to prevent surge, (ii) production manifolds where well-streams are depressurisedand mixed, and (iii) in the installation of flare gas recovery systems.
Keywords: Exergy, Oil and gas, Energy, Efficiency
1. Introduction
Oil and gas processing on North Sea offshore platforms consumes substantial amounts of power and hasa significant environmental impact, being responsible for about 26% of the total greenhouse gas emissionsof Norway in 2011 [1]. Onsite processes on offshore facilities suffer from significant performance losses overthe lifetime of the installation, as a consequence of substantial variations of the reservoir properties (e.g.pressure and temperature) and of the production flow rates and composition (e.g. gas-to-oil and water-to-oilratios, crude oil properties). These off-design conditions lead to the use of control strategies such as anti-surge recycling [2], and thus to greater power consumption and larger exergy destruction. Moreover, as theoil production decreases with time, energy-intensive techniques such as gas and water injection are employedto enhance oil recovery from the reservoir. It is therefore challenging to maintain a high performance of theoverall system over time, while optimising the oil and gas production.
Email addresses: [email protected] (Mari Voldsund), [email protected] (Tuong-Van Nguyen), [email protected](Brian Elmegaard), [email protected] (Ivar Stale Ertesvag), [email protected] (Audun Røsjorde),[email protected] (Knut Jøssang), [email protected] (Signe Kjelstrup)

Nomenclature
T Temperature, K
E Exergy rate, W
m mass flow rate, kg/s
e specific exergy, J/kg
h specific enthalpy, J/kg
p pressure, Pa
s specific entropy, J/kgK
x mass fraction
Q thermal energy
W work
Abbreviations
EOS Equation of state
Superscripts
ch chemical
kin kinetic
mix mixture
ph physical
pot potential
Q heat
W work
Subscripts
i component
0 dead state
d destruction
in inlet
l loss
out outlet
Svalheim and King [3] stressed the large power demand of the gas compression and water injectionprocesses over the lifespan of the oilfield. To the knowledge of the authors, it is the only study in the openliterature that investigates the life of field variations of the energy demand of oil and gas facilities. Thevariations are due to changes in field pressure, water-to-oil and gas-to-oil ratios over the lifetime of the field.Their studies also emphasised the benefits that resulted from applying best practices in energy management(e.g. gas turbine operation near design load, reduction of flaring and venting practices, and integrationof waste heat recovery). Similarly, Kloster [4,5] argued that these measures could and did contribute tosignificant energy savings and a reduction of the CO2-emissions of the Norwegian oil and gas installations.A mapping of the thermodynamic inefficiencies is useful, as it indicates room for improvements in a rationalmanner. Such information can be obtained by carrying out an exergetic analysis, which is based on both the1st and 2nd laws of thermodynamics. The exergy of a system is defined as the maximum theoretical abilityto do work when it interacts with the environment, and is, unlike energy, not conserved in real processes[6]. An exergy accounting reveals the locations and extents of thermodynamic irreversibilities present in agiven system, and these irreversibilities account for a greater fuel use throughout successive processes [7].
Oliveira and Van Hombeeck [8] conducted an exergy analysis of a Brazilian oil platform which includedthe separation, compression and pumping modules but not the production manifolds. Their work showedthat the least exergy-efficient subsystem was the oil and gas separation, while the most exergy-consumingones were the petroleum heating and the gas compression processes. Voldsund et al. [9] carried out anexergy analysis of a Norwegian oil platform and considered the production manifold, the separation andrecompression processes, the fuel gas subsystem and the oil pumping and gas reinjection trains. Theirstudy demonstrated that the largest exergy destruction took place in the production manifold and in thegas reinjection systems. There were no considerable petroleum heating operations on this platform, sincethe feed temperature was high enough for separation of the specific oil by pressure reduction only, andthus there was no exergy destruction due to heating operations. Nguyen et al. [10] conducted a genericanalysis of Norwegian oil and gas facilities. Their work suggested that the production manifold and gascompression trains were generally the most exergy-destructive parts, followed by the recompression andseparation modules. It was also shown that these results were particularly sensitive to the compressor andpump efficiencies, as well as to the petroleum composition.
2

The similitude and discrepancies in the results of these studies suggest that differences in the designsetup and in the field conditions may affect the locations and extents of the thermodynamic irreversibilitiesof the overall system. The literature appears to contain no systematic comparison of the sources of exergydestruction for oil and gas platforms. Therefore, in this work, the platform analysed by Voldsund et al.[9] is compared with three other North Sea offshore platforms, which have not been studied in this mannerbefore. The variations of the reservoir fluid composition over the life cycle of each field are not investigated,but it is worth emphasising that the four platforms operate at a different production period of an oilfield(peak and end-life). The work was carried out in three main steps:
• simulation and investigation of the platforms;
• exergy accounting;
• comparison of the four platforms, based on the outcomes from the two previous steps.
The present paper is part of two projects dealing with modelling and analysis of oil and gas producingplatforms. It builds on previous works conducted by the same authors and is structured as follows: Section 2describes the followed methodology, with a strong emphasis on the system description and on the similaritiesand differences between the four cases. Section 3 presents a comparison of the results obtained for eachplatform. The results are discussed in Section 4 and are followed by concluding remarks in Section 5.
2. Methodology
2.1. System description
The purpose of an offshore platform is to extract, process and export petroleum. A typical offshoreplatform consists of a processing section, utilities, drilling modules, and a living quarter. The focus of thisstudy is the processing of oil and gas, which takes place in the processing section. All power and heatthat are needed in the processing section are delivered by power turbines and heat recovery systems thatare part of the utilities, normally by combustion of the natural gas produced at the platform. A flare gassystem, which is also a part of the utilities, handles gas released during unplanned over-pressuring of plantequipment and small volumes of waste gas that cannot be easily captured and returned to the system forprocessing.
The structural designs of the processing plants on the four platforms are similar. Meanwhile, differentreservoir fluid characteristics and reservoir properties, as well as different requirements for the products, haveresulted in dissimilar temperatures, pressures and flow rates throughout the process, and different demandsfor compression, heating, cooling and treatment.
In Section 2.1.1 we give a generalised overview of the oil and gas processing plant for the studied platforms,in Section 2.1.2 we present key information on the platforms, to indicate the main differences between them,and in Section 2.1.3 we list process data that are important to explain the different results for the platforms.
2.1.1. A generalised overview of the processing plant
An overview of the processing plants on the four platforms, with subsystems and material streams, isshown schematically in Fig. 1. This figure shows the common overall set-up of the processing plants. Thedetailed process set-ups are illustrated in Figs. A.7–A.10. Well fluids from several producing wells (1) enterone or more production manifolds where pressure is reduced and streams from the different wells are mixed.The mixed streams (2) are sent to a separation train where oil, gas and water are separated in several stagesby reducing pressure in each step, and where heating may be required.
Oil or condensate (3) is sent to the main oil/condensate treatment section where it is pumped for furtherexport (4). Produced gas is compressed in a recompression train to match the pressure of the stream enteringthe separation train (2). This compression is done in several stages, each stage with a cooler, a scrubberand a compressor. Condensate from the recompression train is sent back to the separation train, whilecompressed gas is sent to the gas treatment section.
3

The produced gas is treated differently on the four platforms, with different demands for compressionand dehydration, depending on the properties of the gas and on whether the product (5) is to be exportedor used for enhanced oil recovery. This can be performed either with gas injection, where gas is injectedinto the reservoir in order to maintain a high pressure, or gas lift, where gas is injected in the wells inorder to reduce the density of the well-streams. On one of the platforms additional gas is imported (9) andcompressed in this section. Condensate from the gas treatment is either recycled to the separation train orpumped, dehydrated and exported (6) in a separate condensate treatment section. Fuel gas is taken fromone of the streams with produced gas, treated in a fuel gas system and sent (8) to the power turbines, andfor two of the platforms also to the flares for pilot flames.
From each of the subsystems shown in Fig. 1, except from the seawater injection system, some gas maybe sent to the flares, in urgency cases and/or in order to maintain a stable production. The amount offlared gas is normally negligible compared to the main hydrocarbon flows, representing less than 2% of thetotal exergy of the crude oil and gas flows. In special cases large amounts of gas may be flared to avoidemergencies.
Produced water (7) is treated and either discharged to the sea or injected into another reservoir. Seawater(10) may be compressed for injection into the producing reservoir for enhanced recovery (11).
Productionmanifold(s)
SeparationOil/condensate
export
Recompression
Gas treatment
Fuel gas system
Gas for injection, lift or export
Oil or condensate for export
Condensate treatment
1 2 3 4
Condensate for export
Well streams from reservoir
Fuel gas to turbines and flares
Gas import from other platform 5
6
Seawater injection
10 11
Water for disposal or discharge
Water injected into reservoir
Seawater
8
9
7
Figure 1: A generalised overview of the processing plant on the four North Sea platforms. The arrows represent one or severalmass streams while the blocks represent subsystems. Dotted arrows and blocks are not present at all four platforms. Flaredand vented gases come from several sections of the processing plant and are not shown in the figure for readability.
2.1.2. Key information on the studied platforms
The studied platforms are labelled Platform A, B, C and D, and their main characteristics are givenbelow:
4

• Platform A has been in production for approximately 20 years and is characterised by a high gas-to-oil ratio. Oil is pumped to a nearby platform while gas is injected into the reservoir for pressuremaintenance. Water injection is also used as a recovery technique, but the injection water is producedat another platform, and is therefore not taken into consideration in this analysis. Produced water isdischarged to the sea. Platform A was investigated in previous works of the same authors and moredetails of the analysis can be found in [9].
• Platform B has been in production for approximately 10 years. It has high reservoir temperature,pressure and gas-to-oil ratio and produces gas and condensate through pressure depletion. The ex-ported gas is not dehydrated. Produced water is injected into another reservoir for disposal. Powerconsumption is small because of a relatively low compression demand. There is some heat integrationbetween process streams with cooling- and heating demand.
• Platform C has also been in production for approximately 10 years. It produces oil with high viscosity,and heating is required to ease the crude oil-water separation. The heating demand is met by wasteheat recovery from the exhaust gases exiting the gas turbines, and by heat integration with otherprocess streams. Gas lift and gas injection are used as recovery strategies: however, the gas-to-oilratio of this field is small and gas is therefore imported. Produced water is discharged to the sea. Aflare gas recovery system is installed. An exergetic assessment of this platform was also presented byJøssang [11].
• Platform D has been in production for approximately 20 years, and gas, oil and condensate areexported. The treatment of condensate is due to a high propane content in the reservoir fluid and isdone to prevent recirculation of medium-weight alkanes in the separation and recompression trains.Both gas and condensate are dehydrated. Condensate and gas are mixed at the outlet of the condensatetreatment section and are exported in the same pipeline network. Heating is required to enhanceseparation of oil, gas and water, for regenerating the glycol used for dehydration, and for fractionatingcondensate. Gas lift and water injection are used to enhance oil recovery.
The gas-to-oil ratios and product flow rates for each of the studied platforms are given in Table 1. Volumeflows are estimated at a temperature of 15 ◦C and a pressure of 1.013 bar. These conditions are denotedstandard and are used as a norm by e.g. the Norwegian Petroleum Directorate. It should be noted that thechoice of these conditions only impacts the values of the volume flows, and is not related to the choice ofthe reference conditions for the energy and exergy analyses.
Table 1: Gas-to-oil ratios and product flow rates for the studied oil and gas platforms. Gas-to-oil ratio is given on a standardvolume basis.
Platform A Platform B Platform C Platform D
Gas-to-oil ratio [-] 2800 3200 360 230Exported oil/condensate [Sm3/h] 133 239 1105 271Exported gas [103 Sm3/h] - 761 - 7.9Injected gas [103 Sm3/h] 369 - 363 -Lift gas [103 Sm3/h] - - 22 49.4Produced water [Sm3/h] 67 12 250 1110Injected seawater [Sm3/h] - - - 890
2.1.3. Process details
Temperatures and pressures for key streams are given in Table 2. The values given as range (e.g. 64–111 for Platform B, Table 2) mean that the reservoir fluids are extracted through different wells, whichare located at different depths and are thus operated at different temperatures. The following points areessential for a better understanding of the outcome of the analysis:
5

• Pressure is reduced in the production manifold and the separation train. Well stream pressures, p1, andpressures into the separation train, p2, vary between the platforms, while pressure out of the separationtrain, p3, ranges between 1.7 and 2.8 bar for all platforms, due to vapor pressure requirements for theoil/condensate export.
• Temperatures at the outlet of the production manifold, T2, are higher for Platforms A and B thanfor Platforms C and D. No heating is required in order to separate the well streams of the firsttwo platforms, while the low temperature together with the petroleum characteristics make heatingnecessary for the latter two. Export pipelines are subject to practical constraints such as limitationson the operating temperatures, and low temperatures at the inlets of the pumps and compressorsare preferred for efficient operation. Thus, the well stream temperatures have effect on the heatingdemands, and also to a certain extent on the cooling demands of the platforms.
• In the export pumping section the pressure of the produced oil or condensate is increased from p3 top4. The magnitude of p4 depends on the export requirements.
• The gas treatment section differs across the platforms, depending on the conditions of the incominggas, and the planned use of it. On Platforms A, C and D the pressure is increased from p2 to p5,since the produced gas is to be injected, used for gas lifting or exported at a pressure higher than p2.On Platform B the gas is not compressed. Since the well-stream pressure is high, the operators canallow a pressure at the outlet of the production manifold higher than the pressure required for export,so p5 is lower than p2. For a detailed overview of the structural design of this section in each of theplatforms, we refer to Figs. A.7–A.10.
• The imported gas on Platform C is compressed from p9 to p5 in the gas treatment section.
• On Platform D seawater is pressurised from p10 (ambient) to p11 and injected.
Table 2: Pressures and temperatures in the oil- and gas processing of the studied oil and gas platforms.
Stream number Platform A Platform B Platform C Platform D(type) p [bar] T [◦C] p [bar] T [◦C] p [bar] T [◦C] p [bar] T [◦C]
1 (reservoir fluids) 88–165 80–87 123–155 64–111 13–111 51–72 15–187 55–74
2 (reservoir fluids) 70 74 120 10646a 62 a
849–67
7b 69b 63b
13c 65c
3 (oil/condensate) 2.8 55 2.4 62 2.7 97 1.7 45–554 (oil/condensate) 32 50 107 56 99 76 19 61–685 (treated gas) 236 78 118 35 184 75 179 816 (condensate) - - - - - - 179 687 (produced water) 9 73 61 78 7.2 72 1.3 558 (fuel gas) 18 54 37 50 39 61 21 599 (gas import) - - - - 110 4.4 - -10 (inlet seawater) - - - - - - 1 811 (injection seawater) - - - - - - 127–147 57
aFrom high pressure manifoldbFrom low pressure manifoldcFrom test manifold
Since flow rates throughout the process change over the field lifetime, some parts are run at lower flowrates than the process equipment was designed for. To avoid compressor surging in this situation, gas isrecycled around the compression stages, to keep a minimum flow rate through the compressor. The recycledgas is also sent through the cooler and the scrubber of the compression stage (see Figs.A.7–A.10 for theexact process set-up), to keep a low temperature and remove the liquid resulting from the cooling. Gasrecycling only takes place within a given sub-system (e.g. recompression or compression). The gas recycling
6

rates around compressor stages in the various compression sections of the four platforms are given in Table3. There is anti-surge recycling in the recompression trains of all platforms, while in the gas treatmentsection there is recycling of the imported gas in Platform B and of the produced gas in Platform D.
Table 3: Anti-surge recycle rates in the various compression sections of the studied oil and gas platforms, given as percentageof the flow through the compressors.
Platform A Platform B Platform C Platform D
Recompression train [%] 69–92 4–34 32–44 65–75Gas treatment, produced gas compression [%] 0 - 0 5–35Gas treatment, import gas compression [%] - - 22 -
2.2. Process simulation
One typical production day was simulated for each platform. The simulations were built on measuredvalues and on values assumed or found in documentation of equipment. The measured values used forPlatforms A, B and D are mean values for the simulated day, while the values for Platform C are measuredat 12:00. The simulated production days were days with stable conditions, meaning that the standarddeviations for the flow rates throughout the day for exported oil or condensate were either lower than 10Sm3/h or 3% and the standard deviation of produced gas was lower than 2% (Table 4). The basic data usedin the simulations is available in the literature [9] for Platform A, in the supplementary information of thispaper for Platforms B and C, and it is confidential for Platform D.
Table 4: Standard deviation in measured flow rates of produced oil, condensate and gas for Platforms A, B and D for thesimulated days. The values given for Platform C (marked with *) are maximum deviation through the day from the valuemeasured at 12:00.
Platform A Platform B Platform C Platform D
Exported oil [Sm3/h] 9 7 8* 2.2[%] 7 3 0.7* 0.80
Lift-, injected or exported gas [Sm3/h] ≤ 0.8·103 8·103 6·103* 55·103
[%] ≤ 0.2 1.1 1.7* 0.7
Platforms A, C and D process oil and gas, and the Peng-Robinson equation of state (EOS) [12] wasselected. Platform B mainly processes gas and light liquid hydrocarbons, and the Soave-Redlich-KwongEOS [13] was used. The process simulations of Platforms A and C were carried out with Aspen HYSYS[14] version 7.3. Platform D was simulated with Aspen Plus [15] version 7.2 using the Peng-Robinson EOSand the Non-Random Two Liquid model [16], with the exception of the glycol dehydration system that wassimulated using the glycol property package of Aspen HYSYS.
The test manifold was merged together with the 1st stage separator in the simulations of Platforms Aand B, while it was included as an independent separator in the simulations of Platforms C and D. Crude oilmixtures contain a large variety of chemical compounds, from hydrocarbons such as light alkanes and heavyaromatics, to impurities such as nickel and vanadium. Detailed compositional analyses of these mixtures arerarely carried out, and crude oils are thus modelled as mixtures of known and unknown, named hypotheticalcomponents. Light- and medium-weight hydrocarbons are represented by known components such as lightalkanes and alkenes. On the contrary, the components forming the heavy fractions of the crude oil arenot modelled individually, but are lumped into the fictive groups of components. A given hypotheticalcomponent corresponds therefore to several real components, and displays the thermophysical and chemicalproperties of a given fraction of the crude oil. In this work, the hypothetical properties were obtained fromthe operators for the Platforms A, B and C, while they were derived from crude oil assays and measurementsfor Platform D. The numerical tolerance limits of the process models were set so that the relative deviationsbetween in and out flows of the systems were smaller than 2·10−5 both for mass and energy for all fourplatforms.
7

2.3. Exergy analysis
2.3.1. Exergy accounting
An exergy accounting was performed to identify the sources of thermodynamic inefficiencies in the fourcases investigated. The exergy of a stream of matter is defined as the maximum theoretical work obtainablewhen the stream of matter interacts with the environment to reach equilibrium. This maximum theoreticalwork is obtained when all processes involved are reversible.Internal irreversibilities, that take place in all realprocesses, are responsible for exergy destruction in the oil and gas processing units. The exergy destructioncan be calculated from an exergy balance [6,7]. For an open control volume in steady-state conditions, theexergy destruction rate, Ed, is defined as the difference between the rates of exergy entering and leaving asystem:
Ed = EQ + EW +∑
minein −∑
mouteout (1)
where EW and EQ are the rates of exergy accompanying work and heat entering the system. For simplicitywe name these variables power and heat exergy in the rest of this study. The symbols m and e representthe mass flow rate and the specific exergy of the stream of matter. Out of the exergy streams leaving thesystem, some streams are not useful, and is therefore discharged to the environment. Such streams can beidentified as exergy losses.
2.3.2. Exergy transfer
The exergy transported with a material stream, e, can be expressed as the sum of its kinetic, ekin,potential, epot, physical, eph, and chemical components, ech [6]:
e = ekin + epot + eph + ech (2)
The specific physical exergy accounts for differences in temperature and pressure with the ambient temper-ature and pressure (T0, p0) without changes in chemical composition. It is defined as:
eph = (h− h0) − T0(s− s0) (3)
where h and s are the specific enthalpy and entropy calculated at the stream conditions and h0 and s0 atambient temperature, T0, and pressure, p0. The specific chemical exergy accounts for differences in chemicalcomposition with a reference environment and can be expressed as:
echmix =
∑i
xiechi︸ ︷︷ ︸
I
+h0 −∑i
xihi,0 − T0
(s0 −
∑i
xisi,0
)︸ ︷︷ ︸
II
=∑i
xiechi,mix︸ ︷︷ ︸
III
(4)
where term I represents the chemical exergy of the pure components, with xi the mass fraction and echi
the specific chemical exergy. Term II corresponds to the decrease of chemical exergy due to mixing effects,with hi,0 the enthalpy of pure component i at ambient conditions, and si,0 the corresponding entropy. TermIII denotes the chemical exergy of the components in the mixture, with ech
i,mix the specific chemical exergyof component i in the mixture. The specific potential and kinetic exergies are equal to the potential andkinetic energies, respectively.
Exergy transferred as work (e.g. electric or mechanical work) is equal to the amount of work:
EW = W (5)
and exergy transferred as heat is determined by the Carnot efficiency, and is for temperatures above theambient given by:
EQ =
(1 − T0
T
)Q (6)
The symbol W denotes work transfer and Q denotes transfer of thermal energy.
8

2.3.3. Calculation details
The ambient pressure and temperature used in the calculation of physical exergy were 1 atm and 8 ◦C,which is the average air temperature for the North Sea [17]. The chemical exergy of the pure componentswere taken as presented by Szargut [18] for the real chemical components. They are calculated followingthe method and correlations of Rivero [19] for the hypothetical components. Potential and kinetic exergywere assumed negligible in comparison with chemical and physical exergy in the present cases.
The control volume chosen for the exergy analysis on the four platforms includes the process modulesshown in Fig. 1, with the components presented in Figs. A.7–A.10. The exergy destruction taking place inthe heaters in Platforms B and C is assigned to the separation sub-systems, as the heating demand resultsfrom the temperature requirements in that section. The following sub-systems are not considered in thiswork, as they are not part of the processing plant as such, or contribute only to a minor extent to the totalexergy destruction of the plant.
• The seawater lift, which includes the pumps required to lift the seawater on-site and to bring it to thepressure of the cooling water distribution system;
• The cooling medium system;
• The pilot flares and flare headers, where the unusable gas, released by pressure relief valves in severalparts of the plant (e.g. separation and fuel gas sub-systems), is burnt off with air and rejected to theatmosphere;
• The produced water treatment, where chemicals such as biocides are mixed with produced water toease separation with impurities;
• The gas lift, where the pressure of the gas streams is decreased to match the wellhead pressure andease petroleum production.
In the present work, the term exergy destruction refers to the irreversibilities taking place within thecontrol volume under study (internal irreversibilities). The term exergy losses refers to the irreversibilitiesoutside this control volume, i.e. the ones taking place when waste exergy streams are dissipated to theenvironment.
For instance, the flare headers are considered as a part of the utility plant of an oil and gas platform.They are therefore not included in the control volume and all the chemical exergy in flared gas is countedas a loss. In the case of the coolers, the irreversibilities caused by the pressure drops on the gas and waterside, as well as with heat transfer, are accounted as exergy destruction. The increase in temperature-basedexergy on the cooling medium side is accounted as an exergy loss.
3. Results
The exergy input of the oil and gas processing plants, as well as the useful and lost exergy outputs,are given in Table 5. The exergy input consists of the exergy flowing with the well streams, the importedgas, and the heat and power exergies. The useful exergy output includes the exergy flowing with the exportstreams, gas for injection and lift, and fuel gas. The useful exergy output corresponds to 99.5%–99.8% of theexergy input. Such values are often referred to as the total exergy efficiencies. The exergy flows associatedwith the heat and power inputs to the processing plants are 0.05%–1.8% of the magnitude of the exportedexergy flows.
The fuel gas is counted as useful output, even though it is not an exported product, because the focus ofthis study is the processing plants, and not the overall platforms. The fuel gas exergy represents 0.3%–8%of the exported exergy. The fuel gas is consumed to produce power for the drilling modules (where the loadsvary significantly from day to day) and for the living quarter, as well as heat and power for the processingplants.
The main sources of exergy losses on the four studied platforms include the discharge of produced water,the release of flared and vented gases to the atmosphere, and the rejection of cooling water to the sea.
9

The exact amount of exergy losses with flared and vented gases varies from day to day, as gas flaring is notpracticed continuously and is subject to significant variations over days. For the days we study, the chemicalexergy of the flared gases are significant at Platforms A and D, while exergy losses with produced water aresignificant in the cases of Platforms C and D.
Table 5: Exergy flows on the studied platforms, expressed in MW. For exergy flows related to material streams, the corre-sponding stream numbers from Fig. 1 are given.
Streamnumber Platform A Platform B Platform C Platform D
Input flowsWell streams, total exergy 1 5.8·103 11·103 15·103 3.8·103
Gas import, total exergy 9 - - 1.8·103 -Power exergy input - 25 5.5 30 17Heat exergy inputa - - 0.28 6.9 1.8Output flows, usefulExported oil/condensate, total exergy 4+6 1.4·103 2.4·103 13·103 2.8·103
Exported gas, total exergy 5 - 8.6·103 - 0.2·103
Gas injection and lift, total exergy 5 4.3·103 - 4.3·103 0.8·103
Fuel gas, total exergy 8 110 30 110 90Output flows, lostProduced water, chemical exergy 7 0.94 0.17 3.6 16Produced water, physical exergy 7 0.54 0.14 2.0 6.1Flared gas, chemical exergy - 5.0 1.3 0 4.7Flared gas, physical exergy - ≤ 0.03 ≤ 0.01 0 ≤ 0.2Exergy leaving with cooling mediumb - 3.2 4.5 1.8 0.7
aBoth heat from the utilities and from heat integration between process streams.bThe temperature-based exergy received by the cooling medium.
The power and heat exergy, which are consumed in each subsystem for the four platforms, are presentedin absolute numbers and per oil equivalent (o.e.) in Figs. 2 and 3, respectively. The unit oil equivalentis used by oil and gas companies as a way to present into a single measure the production of oil, gas andcondensate. It is considered that 1 unit of volume of oil has roughly the same energy content as 1 unit ofvolume of condensate, or as 1000 units of volume of gas. The production manifolds are not included in Figs.2 and 3, because no heat or power exergy is consumed there on any of the platforms, since the only processestaking place in the manifolds are mixing and throttling. For the remaining subsystems it is shown that:
• Power is mainly used for compression in the recompression sections, gas treatment sections andoil/condensate sections.
• On Platform D a significant amount of power is also used for increasing the seawater pressure forfurther injection.
• No power is required in the gas treatment section on Platform B, at the difference of the three otherplatforms, because the feed pressure (p1) at the inlet of the separation subsystem is high enough tomeet the export specifications (p5).
• In the separation section on Platform C, approximately half of the exergy used for crude oil heatingcomes from heat integration with other product streams, while the other half comes from waste heatfrom the power turbines.
• The heating demand of the gas treatment and oil/condensate treatment sections on Platform D (inthe dehydration processes) is met by recovering waste heat from the power turbines, electrical heating,and to a minor extent by heat integration.
10

• Power used for heating in the fuel gas systems is less than 1% of the total power consumption for eachof the platforms.
• Power and heat exergy consumed per oil equivalent is highest for Platform A, followed by PlatformD, while it is relatively small for Platforms B and C.
• The power exergy consumed per oil equivalent is particularly high in the gas treatment section onPlatform A with 520 MJ/o.e.
-
2
4
6
8
10
12
14
16
18
20
A B C D A B C D A B C D A B C D A B C D A B C D
Separation Recompression Gas treatment Oil/condensateexport
Fuel gas system Seawaterinjection
Exer
gy c
on
sum
pti
on
[M
W]
Heat exergy for heating, waste heat (T-based)
Heat exergy for heating, heat integration (T-based)
Power for heating
Power for compression/pumping
Figure 2: Power and heat exergy consumed in each subsystem for the studied platforms (Platforms A–D). The productionmanifolds are not included, since no power and heat exergy is consumed there. The thermal energy labelled ‘waste heat’ isfrom a heating medium that is heated with waste heat from the power turbines. The thermal energy labelled ‘heat integration’is from heat integration with other process streams.
In Fig. 4 exergy destruction in each subsystem for each of the platforms are given and in Fig. 5 the samevalues are given as percentage for each platform. In general, the highest contributions to exergy destructionare due to:
• throttling in production manifolds and separation trains;
• irreversibilities in coolers;
• inefficiencies in compressors and anti-surge recycling.
A more detailed investigation of Fig. 5 shows the following about the locations and sources of exergydestruction on the four platforms:
• Exergy destruction in production manifolds represents 10–24% of the total exergy destruction at thefour platforms.
• Exergy destruction due to throttling in separation trains accounts for 2–12%.
• Exergy destroyed in compressors amounts to 28–40%, with the exception of Platform B where itamounts to only 13%.
11

-
50
100
150
200
250
300
350
400
450
500
550
A B C D A B C D A B C D A B C D A B C D A B C D
Separation Recompression Gas treatment Oil/condensateexport
Fuel gas system Seawaterinjection
Spec
ific
exe
rgy
con
sum
pti
on
[M
J /
Sm3 o
.e.]
Heat exergy for heating, waste heat (T-based)
Heat exergy for heating, heat integration (T-based)
Power for heating
Power for compression/pumping
Figure 3: Power and heat exergy consumed per exported oil equivalent (o.e.) in each subsystem for the studied platforms(Platforms A–D). The production manifolds are not included, since no power and heat exergy is consumed there. The heatexergy labelled ‘waste heat’ is from a heating medium that is heated with waste heat from the power turbines. The thermalenergy labelled ‘heat integration’ is from heat integration with other process streams.
0
1
2
3
4
5
6
7
8
9
10
A B C D A B C D A B C D A B C D A B C D A B C D A B C D
Productionmanifold(s)
Separation Recompression Gas treatment Oil/condensateexport
Fuel gas system Seawaterinjection
Exer
gy d
estr
uct
ion
[M
W]
Destruction in coolers
Destruction due to recycle pressure loss
Destruction in compressors/pumps
Destruction due to throttling
Destruction due to mixing
Destruction in heaters
Rest
Figure 4: Exergy destruction in each subsystem for the studied platforms (Platforms A–D). The main sources of exergydestruction/loss in each subsystem are indicated with different colours, and smaller sources are lumped into ‘rest’. Theterm ‘rest’ corresponds to minor contributions to the exergy destruction such as pressure drops in pipelines, distillation andregeneration columns.
• On Platform B, 33% is due to cooling in the gas treatment section.
• Exergy destruction due to pressure loss in recycled streams amounts to 4–15% for the four platforms.
• Exergy destruction in the crude oil heater makes up approximately 6% and 5% respectively for Plat-
12

0%
10%
20%
30%
40%
50%
60%
A B C D A B C D A B C D A B C D A B C D A B C D A B C D
Productionmanifold(s)
Separation Recompression Gas treatment Oil/condensateexport
Fuel gas system Seawaterinjection
Exer
gy d
estr
uct
ion
Destruction in coolers
Destruction due to recycle pressure loss
Destruction in compressors/pumps
Destruction due to throttling
Destruction due to mixing
Destruction in heaters
Rest
Figure 5: Percentage of exergy destruction in each subsystem for the studied platforms (Platforms A–D). The main sources ofexergy destruction/loss in each subsystem are indicated with different colours, and smaller sources are lumped into ‘rest’. Theterm ‘rest’ corresponds to minor contributions to the exergy destruction such as pressure drops in pipelines, distillation andregeneration columns.
forms C and D.
• The exergy destruction in the oil/condensate export system of Platform A accounts for 1%, while forPlatforms B–D it accounts for 6–10%.
• Exergy destruction in the fuel gas, produced water handling and seawater injection systems are ofminor importance compared to the other studied systems.
The exergy destroyed per exported oil equivalent in each subsystem for the four platforms are shownin Fig. 6. Platforms A and D have clearly more inefficiencies per oil equivalent than Platforms B and C.They are older than the other two platforms and have export flow rates that are low compared to theirpeak production. Platform A has a high gas-to-oil ratio (2800), injects gas and exports only oil. Theinjection of gas makes a high oil recovery from the reservoir possible but is responsible for considerablepower consumption and exergy destruction:
• The large amount of gas that is not exported gives high exergy destruction per exported oil equivalentin the production manifold (125 MJ/o.e.).
• In the recompression train, recycling of gas to prevent compressor surging has led to almost constantflow rates, and thus exergy destruction, even if the amount of oil in the separation train has decreased.
• The high exergy destruction per exported oil equivalent in the gas treatment section (245 MJ/o.e.) isbecause here a significant amount of compression work is done to produce gas that is not exportedbut used for enhanced oil recovery.
Platform D has a low gas-to-oil ratio (230), uses gas and seawater for lift and injection, and exports oil,gas and condensate. The high exergy destruction per exported oil equivalent (178 MJ/o.e.) results from thelarge amount of power required to compress the gas.
13

0
50
100
150
200
250
A B C D A B C D A B C D A B C D A B C D A B C D A B C D
Productionmanifold(s)
Separation Recompression Gas treatment Oil/condensateexport
Fuel gas system Seawaterinjection
Spec
ific
exe
rgy
des
tru
ctio
n [
MJ
/ Sm
3 o
.e.]
Destruction in coolers
Destruction due to recycle pressure loss
Destruction in compressors/pumps
Destruction due to throttling
Destruction due to mixing
Destruction in heaters
Rest
Figure 6: Exergy destruction per exported oil equivalent (o.e.) in each subsystem for the studied platforms (Platforms A–D).The main sources of exergy destruction/loss in each subsystem are indicated with different colours, and smaller sources arelumped into ‘rest’. The term ‘rest’ corresponds to minor contributions to the exergy destruction such as pressure drops inpipelines, distillation and regeneration columns.
4. Discussion
4.1. Accuracy
The main results of this study are estimates for heat and power exergy consumption, exergy destructionand exergy losses. The accuracy of these results, i.e. the closeness to the true values, depends on theaccuracy of the simulations and on the energy and exergy calculations. The following points may affect theaccuracy: (i) the variations of the process variables throughout the day, (ii) measurement uncertainties, (iii)accuracy of the equations of state, (iv) accuracy of correlations used in calculation of chemical exergy and(v) selection of standard state for chemical exergy calculations.
There are natural variations in the feed compositions, temperatures, pressures and flow rates, which leadto variations also in other process variables throughout the system. However, steady-state conditions wereassumed in the calculations. As described in Section 2.2, the measured values considered in the simulationsfor Platforms A, B and D were day-averaged, and this results in a levelling of inconsistencies due to lageffects of the system. In the case of Platform C, the measured values were taken at a specific point of timeso for this platform there is a higher possibility for inconsistent data. All four platforms are simulated ondays with stable conditions, and this both limits lag effects and gives small standard deviations over theday.
An overview of measurement uncertainties is given in Table 6. The authorities have set requirements forthe uncertainties of fiscal measurements, e.g. export flow rates and fuel gas consumption. The measurementuncertainties for such variables were assumed to be equal to the limits set in the requirements. The valuesfor the measurement uncertainties for other process variables were assumed based on guidelines set by the oilcompany, discussions with the operators and the authors own experiences. In most cases, the measurementuncertainties were larger than the standard deviations of the variables over the day, so the latter weretherefore not taken into consideration in this study.
The Peng-Robinson [12] and the Soave-Redlich-Kwong [13] equations of state (EOS) were used to cal-culate the enthalpies and entropies of each stream. Both were conceived to estimate the vapour-liquidequilibrium properties and fugacities of hydrocarbon mixtures, and they are widely used for modellingpetroleum processes. The Soave-Redlich-Kwong EOS was initially designed to describe the behaviour ofsmall and non-polar molecules in vapour phase, making it particularly suitable for modelling gas processes.However, it was inaccurate for calculations of hydrocarbon properties in liquid phase. This was improved in
14

the Peng-Robinson EOS [20,21]. The Soave-Redlich-Kwong EOS was chosen for the simulations of PlatformC, which mostly processes gas, and the Peng-Robinson EOS for the simulations of Platforms A, B and D.
For the calculation of heat and power exergy consumption and exergy losses, uncertainty originatingfrom measurements and from the equation of state are most relevant. A detailed analysis of the impactof these points were performed for Platform A [9]. Uncertainty originating from the equation of state wasevaluated by comparing values obtained for methane from the equation of state used in the simulation, withvalues obtained from a presumably more accurate equation of state. The total uncertainties originatingfrom these two error sources were lower than 10% for the power consumption and exergy destruction in theproduction manifolds, recompression and gas treatment sections. The uncertainties for the separation andexport sections were higher (Table 7). For all four platforms, the processes are similar, the measurementsare of the same type, and the same or similar equations of state were used as for Platform A. These pointssuggest that the uncertainties of the calculated heat and power consumption and exergy destruction forPlatforms B–D are of the same magnitude as for Platform A.
Table 6: Measurement uncertainty assumed at 95% confidence level for process variables, expressed in %.
Process variable Uncertainty
Pressure 1.0Temperature 1.0 ◦CElectric power 2Oil/condensate export flow rate 0.3Gas export flow rate 1.0Fuel gas flow rate 1.8Flare gas flow rate 5Other flow rates 10
Table 7: Uncertainty of total power consumption and total exergy destruction for Platform A [9], expressed in %.
Power Exergy destruction
Production manifold - 9Separation 15 25Export section 47 40a
Recompression 0.6 5Gas treatment 1 5Fuel gas system 1 1
aMisprint in [9]. For exergy destruction in export section, the uncertainty should be 100 kW.
The method of Rivero [19] was used to calculate the chemical exergy of hypothetical components, basedon the lower heating value and on the elemental composition of each crude oil fraction. Szargut presenteda similar expression, which takes fewer elements into account and this equation is claimed to have a meanaccuracy of 0.5% [18]. The petroleum correlations used to estimate the lower heating value have an accuracyof 1% [22]. The correlations are based on the elemental composition and the specific gravity of each crudeoil fraction, and these properties are not exactly known. Petroleum assays for blends containing the specificcrude oils were used instead, and this gives additional error to the exergy of the hypothetical components.
The reference environment of Szargut [18] was used in this study. It is worth noticing that the model ofKotas [6], which is based on a previous model of Szargut, predicts a standard chemical exergy three timeslarger for water, but displays similar values for hydrocarbon compounds. However, the model of Kotas hasa reference atmosphere with a relative humidity of 28%, while the relative humidity is 70% in the model ofSzargut. Since the platforms are located offshore, the model of Szargut is considered to be most realistic.
The accuracy of the calculated exergy of waste streams (exergy losses), as well as the exergy of feed andexport streams, do mainly depend on the calculation of chemical exergy of the hypothetical components,and on the uncertainty of the exported flow rates. The exergy losses associated with produced water doesin addition have a strong dependency on the choice of reference environment.
15

4.2. Suggestion of process improvements
The four platforms compared within this study are of the North Sea platform type. They illustratethe diversity among these facilities, with production of heavy and viscous oil to condensate and gas, andwith different product specifications, reservoir conditions, and operating strategies. The mapping of thethermodynamic irreversibilities shows where exergy is destroyed in the system and hints therefore to processroute improvements.
4.2.1. Production manifold
Significant quantities of exergy are destroyed in the production manifold in any case. It is thereforeexpected that most North Sea platforms present this behaviour, and this is supported by the findings of thegeneric analysis conducted by Nguyen et al. [10]. The two platforms where this exergy destruction is thelowest (Platforms B and D) are characterised by a small difference between the inlet pressures of the chokevalves and of the 1st stage separators. The first one has the highest gas-to-oil ratio (3200), and condensate-gas separation can be started at a relatively high pressure (120 bar). On the opposite, the second one hasthe lowest gas-to-oil ratio (230), but the highest water production (1110 Sm3/h). It is run at the end-life ofthe production field, and the pressure at the inlet of the production manifold has therefore decreased.
A first possibility for improving these systems is to design the production manifolds at several pressurelevels, as done on some platforms. Gas can be recovered at higher pressures, meaning that a smalleramount of exergy is destroyed by throttling, and lower compression power is required. It would also limitmixing of well-streams with different compositions, and ease phase separation. As the reservoir pressuredecreases with time, inflowing streams can be rerouted to another manifold when their pressure becomeslower. However, the selection of the number of manifolds, and of the pressure levels, is a compromise betweenthe supplementary equipment cost (capital cost), the operating costs (smaller power demand and larger gasexport) and the oil production (smaller liquid production).
Other possibilities are to integrate multiphase expanders, which would reduce the exergy destructiontaking place in the expansion process and generate additional power, or multiphase ejectors that can useexergy in high pressure wells to increase production in depleted ones. However, the design of such equipmentis a challenging task because the well-streams contain sand, hydrogen sulphides and other impurities, andthis could cause corrosion and reduce the lifetime of these components.
The overall benefits of measures on production manifolds are linked to the development of the feedcomposition over time. High pressure gas contains more pressure-based exergy than high pressure liquid.
4.2.2. Gas treatment
The present comparison suggests that the gas treatment process often is the major exergy-destroyingsub-system. It results from combined effects of the inefficiencies of the turbomachinery components, andof the temperature gap between the cooling water and hot gas streams. These trends were observed for allplatforms where there was a need for gas compression, both with and without anti-surge recycling. Thisillustrates that designing and operating a highly efficient gas compression process is critical for reaching ahigh performance of the overall processing plant. However, it is challenging to maintain a high performancebecause the gas flow rates decrease with time, resulting in compressors run in off-design conditions. Svalheim[2,3] and Bothamley [23] proposed various measures, such as re-wheeling the compressors when large amountsof gas must be recycled to prevent surge. The integration of several but parallel trains would also result inhigher energy savings, since varying flow rates can be handled by closing or opening parallel trains, and thecompressors will be run for a longer period near their nominal point.
The exergy destruction taking place in the coolers placed before the compressors is partly caused by theanti-surge recycling, as larger gas flow rates need to be cooled before being recompressed. Smaller amountsof exergy may be destroyed with a better match of the water and gas flow rates and temperatures. Theexergy discharged from the gas streams may be recovered, although it may be difficult to recover heat atthese temperature levels (30 to 150 ◦C). Further integration with the heating systems present on the facilitiesmay be investigated.
16

4.2.3. Process–utility integration
The interactions between the utility system and the processing plant should be investigated in furtherdetails. A comparison with the Brazilian platform investigated by Oliveira and Van Hombeeck [8] showsthe differences across platforms located in different oil regions. On the four North Sea platforms studied inthis work, the heating demand was limited, and waste heat from the exhaust gases was enough to cover it.The gas turbines were designed to provide the required electrical power, but a large amount of excess heatis discharged into the environment, as it is recovered only to a moderate extent. On the opposite, on theBrazilian platform, the oil separation process has a significant heating demand, and recovering waste heatfrom the gas turbines was not sufficient. A furnace was therefore complementing the heat recovery system.
The heating demand depends, among other factors, on (i) the initial feed temperature, which is lowerin the Brazilian Gulf than in the North Sea, (ii) the viscosity of the crude oil (iii) the content of medium-weight hydrocarbons, which is much higher for the oil extracted on Platform D than conventional lightoil, (iv) the integration of processes such as CO2-capture by chemical absorption, glycol dehydration andcondensate fractionation. These energy efficiency measures are discussed in the works of Kloster [4,5] and ofNguyen et al. [10]. Replacing conventional combustion technologies to combined cycles may be one of themost significant measures for improving the efficiency of oil and gas platforms. Cogeneration technologiestogether with a high level of process integration, may be relevant for platforms with a high heat demand.The integration of bottoming cycles would improve the efficiency of the complete system, at the expense ofhigher capital costs due to higher space requirements. Such solutions are already in use on other North Seainstallations [24].
4.2.4. Flaring, cooling water and produced water
Losses with flaring vary from day to day, but for some platforms the total amount of exergy dissipatedwith these gas losses can be significant throughout the year. Such losses can be reduced with the use of gasrecovery systems, as already done on Platform C.
Little can be done to recover exergy from the produced and cooling water flows, since their chemicalexergy is hardly usable, and their temperature is relatively low (50–75 ◦C). Kloster [4] suggested to usethe produced water extracted along with oil and gas instead of treated seawater or to re-use the coolingwater for enhanced oil recovery water injection, as done on some platforms, to reduce the pumping andwater demands. However, the hydrocarbon content of the wastewater may be problematic, as it could causeplugging, and re-using the produced water for injection is only possible for platforms operated on fields witha high water-to-oil ratio.
4.3. Significance and limitations
We have mapped the exergy destruction and losses in the oil and gas processing plants of four oil andgas platforms. The present findings are in accordance with the results of Svalheim and King [2], who statedthat the gas compression step is the most energy-demanding steps. They can also be compared to theprevious findings of Bothamley [23] who focused on the variety of offshore processing options in differentoil regions. The findings of this paper may be used for estimating qualitatively the locations and extents ofthermodynamic irreversibilities on North Sea oil and gas platforms, although caution should be exercisedwhen other design setups are considered, or if the compositions of the well-streams differ strongly.
Moreover, the four platforms present significant differences among each other: the well-fluid compositiondiffers from one facility to another, different products are exported and gas is sometimes used for lift orinjection, and processes such as condensate treatment and gas dehydration are not always installed. A directcomparison is therefore made difficult. However, it should be noted that, although significant differences canbe found between the four platforms, general trends can be observed. Significant exergy destruction takesplace in the compressors and coolers in any case, and the gas recirculation to prevent surge has a significantimpact for platforms with decreasing oil and gas production. The results depend on factors such as (i) theefficiency and the control strategies of the turbo-machinery components (ii) the integration of additionalsubsystems and (iii) the outlet specifications of the processing plant.
The integration of gas dehydration has little impact on the total exergy destruction of the platform. Theirreversibilities taking place in the glycol absorber and in the regenerator are small in comparison to the
17

ones taking place in the compressors and coolers, because of the small flow rate of tri-ethylene glycol. Theintegration of an additional condensate treatment section results in a smaller power consumption, comparedto the case where no separate section is integrated [25].
Finally, the differences between the platforms analysed in this study and the Brazilian case shows thatcaution should be exercised when extending the present conclusions to platforms in other regions of theworld. This suggests that each oil platform should be assessed individually, to pinpoint major sources ofexergy destruction on that specific facility.
5. Conclusion
Exergy analyses were performed on the oil and gas processing plants on four North Sea oil and gasplatforms, which differ by their operating conditions and strategies. The comparison of the sources to exergydestruction and exergy losses illustrated the large exergy destruction associated with the gas treatment andproduction manifold systems, ranging above 27% and 10%, respectively. The fuel gas and seawater injectionprocesses represent less than 3% each in every case. For two of the platforms the exergy losses due to flaringwere significant.
However, the contributions of the recompression, separation and oil export sections vary across thedifferent platforms. Although the precise values of the exergy destruction rates differ from one platform toanother, the results indicate that the largest rooms for improvement lie in (i) gas compression systems, (ii)production manifolds, and (iii) flared gas recovery.
Acknowledgements
The motivation from Statoil’s new-idea project of reducing CO2 emissions from offshore oil and gasplatforms is essential to this study. The Faculty of Natural Sciences and Technology at the NorwegianUniversity of Science and Technology is acknowledged for financial support, as well as the funding fromthe Norwegian Research Council through the Petromaks programme, within the project 2034/E30 led byTeknova.
References
[1] Statistics Norway . Emissions of greenhouse gases: Create your own tables and graphs. 2013.Http://www.ssb.no/emner/01/04/10/klimagassn/ [October 2013].
[2] Svalheim SM, King DC. Life of Field Energy Performance. In: Proceedings of the SPE Offshore Europe Conference. July;Aberdeen, United Kingdom: Society of Petroleum Engineers; 2003, p. 1–10 (Paper SPE 83993).
[3] Svalheim SM. Environmental Regulations and Measures on the Norwegian Continental Shelf. In: Proceedings of the SPEInternational Conference on Health, Safety and Environment in Oil and Gas Exploration and Production. Kuala Lumpur,Malaysia: Society of Petroleum Engineers; 2002, p. 1–10 (Paper SPE 73982).
[4] Kloster P. Energy Optimization on Offshore Installations with Emphasis on Offshore and Combined Cycle Plants. In:Proceedings of the Offshore Europe Conference. Aberdeen, United Kingdom: Society of Petroleum Engineers; 1999, p.1–9 (Paper SPE 56964).
[5] Kloster P. Reduction of Emissions to Air Through Energy Optimisation on Offshore Installations. In: Proceedings ofthe SPE International Conference on Health, Safety, and the Environment in Oil and Gas Exploration and Production.Stavanger, Norway: Society of Petroleum Engineers; 2000, p. 1–7 (Paper SPE 61651).
[6] Kotas TJ. The Exergy Method of Thermal Plant Analysis. Malabar, USA: Krieger Publishing; 1995.[7] Bejan A, Tsatsaronis G, Moran M. Thermal Design & Optimization. New York, USA: John Wiley & Sons; 1996.[8] Oliveira Jr. SD, Van Hombeeck M. Exergy Analysis of Petroleum Separation Processes in Offshore Platforms. Energy
Conversion and Management 1997;38(15-17):1577–84.[9] Voldsund M, Ertesvag IS, He W, Kjelstrup S. Exergy Analysis of the Oil and Gas Processing a Real Production Day on
a North Sea Oil Platform. Energy 2013;55:716–27.[10] Nguyen TV, Pierobon L, Elmegaard B, Haglind F, Breuhaus P, Voldsund M. Exergetic assessment of energy systems on
North Sea oil and gas platforms. Energy 2013;–:1–14. doi:10.1016/j.energy.2013.03.011; Energy (in press).[11] Jøssang K. Evaluation of a North Sea oil platform using exergy analysis. Master’s thesis; Norwegian University of Science
and Technology; 2013.[12] Peng DY, Robinson DB. A New Two-Constant Equation of State. Industrial & Engineering Chemistry Fundamentals
1976;15(1):59–64.
18

[13] Soave G. Equilibrium constants from a modified Redlich–Kwong equation of state. Chemical Engineering Science1972;27(6):1197–203.
[14] Aspen Technology . Aspen Hysys 2004.2 R©– User Guide. Cambridge, USA: Aspen Technology; 2004.[15] Aspen Technology . Aspen Plus – Modelling Petroleum Processes. Burlington, USA: Aspen Technology; 1999.[16] Renon H, Prausnitz JM. Local compositions in thermodynamic excess functions for liquid mixtures. AIChE Journal
1968;14(1):135–44.[17] Norwegian Meteorological Institute . Mean temperature – ordered report. http://eklima.met.no; 2012.[18] Szargut J, Morris D, Steward F. Exergy analysis of thermal, chemical, and metallurgical processes. New York, USA:
Hemisphere; 1988.[19] Rivero R, Rendon C, Monroy L. The Exergy of Crude Oil Mixtures and Petroleum Fractions: Calculation and Application.
International Journal of Applied Thermodynamics 1999;2(3):115–23.[20] Tsonopoulos C, Heidman J. From Redlich-Kwong to the present. Fluid phase equilibria 1985;24(1):1–23.[21] Soave G. 20 years of Redlich–Kwong equation of state. Fluid Phase Equilibria 1993;82:345–59.[22] Speight JG. Handbook of petroleum product analysis. Wiley; 2002.[23] Bothamley M. Offshore Processing Options for Oil Platforms. In: Proceedings of the SPE Annual Technical Conference
and Exhibition. Houston, USA: Society of Petroleum Engineers; 2004, p. 1–17 (Paper SPE 90325).[24] Alveberg LJ, Melberg EV, editors. Facts 2013: The Norwegian Petroleum Sector. Ministry of Petroleum and Energy and
Norwegian Petroleum Directorate; 2013.[25] Li KJ. Use of a Fractionation Column in an Offshore Environment. In: Proceedings of the SPE Annual Technical
Conference and Exhibition. New Orleans, USA: Society of Petroleum Engineers; 1996, p. 1–11 (Paper SPE 49121).
Appendix A. Process Flowsheets
The process flowsheets of each of the platforms are shown in Figs. A.7 – A.10.
19

Separation
Fuel gas system
Drain system
Oil export
Gas treatment
Recompression
To
power
turbines
To
flaring
Oil for
export
Produced
water
Gas
injection
Production manifold
EC
EC
Compressor
Valve
Scrubber
Separator
Electrostatic
coalescer
Heater
Cooler
Electric heater
Pump
Figure A.7: Process flow diagram of the processing plant of Platform A. Gas streams are shown with orange arrows, waterstreams with blue arrows, and oil, condensate and mixed streams are shown with brown arrows.
20

SeparationCondensate export
Gas treatment
Recompression
Fuel gas system
Produced water
Condensate export
Gas export
Production manifold
To power turbines
Phase splitter
1st stage 2nd stage 3rd stage
Figure A.8: Process flow diagram of the processing plant of Platform B. Gas streams are shown with orange arrows, waterstreams with blue arrows, and oil, condensate and mixed streams are shown with brown arrows. Symbol explanations can befound in Fig. A.7
21

Recompression
Separation and oil export
Fuel gas system
Gas treatment
Production manifolds
EC
HP
LP
Test
Gas injection
Gas lift
Oil export
Gas import
Produced water
Producing wells: 18
Producingwells: 6
Producingwells: 1
Figure A.9: Process flow diagram of the processing plant of Platform C. Gas streams are shown with orange arrows, waterstreams with blue arrows, and oil, condensate and mixed streams are shown with brown arrows. Symbol explanations can befound in Fig. A.7
22

Production manifold
Fuel gassystem
Oil export
Condensate treatment
Recompression
Separation
Gas treatment
Seawater injection
Export oil
Discharged water
Export gas
Lift gas
Export condensate
Injection water
Compressor Valve Pump Separator Heat exchanger Scrubber Degasser Column Kettle
To flare headers
To GTs
To GTs
Pressurised seawater
Storage
Vented gas
Figure A.10: Process flow diagram of the processing plant of Platform D. Gas streams are shown with orange arrows, waterstreams with blue arrows, glycol is shown with purple arrows, and oil, condensate and mixed streams are shown with brownarrows.
23

Supplementary information: Process modelling
Platform A
All details on process data, except for the cooling water system, for Platform A can be found in Ref [9].The process flowsheet is shown in Fig. A.11. Details for the cooling water system are found in Table A.8.
Separation
Fuel gas system
Drain system
Oil export
Gas treatment
Recompression
To
power
turbines
To
flaring
Oil for
export
Produced
water
Gas
injection
Production manifold
EC
EC
Compressor
Valve
Scrubber
Separator
Electrostatic
coalescer
Heater
Cooler
Electric heater
Pump
Figure A.11: Process flow diagram of the processing plant of Platform A. Gas streams are shown with orange arrows, waterstreams with blue arrows, and oil, condensate and mixed streams are shown with brown arrows.
Platform B
The process at Platform B was simulated for a real production day with stable and typical processconditions. The process flowsheet of Platform B is given in Fig. A.12.
Composition data was available for (i) the reservoir fluids at the start of the field lifetime and (ii) theexport gas from a few months before the simulated production day. To simulate the well streams, thecomposition of the reservoir fluids was used, but to get the correct water-to-oil ratio, water was mixed in,while to get the correct gas-to-oil ratio, gas with the composition of the export gas was removed. Thecompositions of the three fluids used to simulate the well streams are given in Table A.9. Hypotheticalcomponents (developed by the oil company) were used to describe the heavy fractions of the reservoir fluids,
24

Table A.8: Pressure, p, pressure drop, ∆P , temperatures, T , and mass fractions, x, from the oil company’s documentation ofthe cooling system set in the simulation of the cooling water system of Platform A.
Process unit Variable Value
Cooling medium to coolers p [bar] 7.8Pressure drop on cold side in coolers ∆p [bar] 0.5Cooling medium to coolers T [◦C] 17Cooling medium from all coolers mixed T [◦C] 37.7Cooling medium, TEG weight fraction xTEG [-] 0.3Cooling medium, water weight fraction xwater [-] 0.7Seawater to export cooler T [◦C] 8.0
SeparationCondensate export
Gas treatment
Recompression
Fuel gas system
Produced water
Condensate export
Gas export
Production manifold
To power turbines
Phase splitter
1st stage 2nd stage 3rd stage
Figure A.12: Process flow diagram of the processing plant of Platform B. Gas streams are shown with orange arrows, waterstreams with blue arrows, and oil, condensate and mixed streams are shown with brown arrows. Symbol explanations can befound in Fig. A.11
and the properties set for these hypothetical components are given in Table A.10. Calculated flow rates ofthe gas, condensate and water phases in each well stream are given in Table A.11. Calculated flow ratesare flow rates for each phase in the three-phase well streams estimated by the oil company. Measured flowrates of exported gas, exported condensate and produced water are given in Table A.12. The well streamflow rates of each phase were set such that the flow rates of the simulated product streams of the processfitted with the measured product streams in Table A.12 after all other input data in the simulation was set.The more uncertain calculated flow rates of the well streams in Table A.11 were used to set the ratio of flowfrom the different wells for each of the phases.
25

Table A.9: Composition of fluids used for simulation of feed streams of Platform B. The composition of gas is a measuredcomposition of the exported gas a few months before the simulated production day. The composition of reservoir fluids is thecomposition of the reservoir at start the start of the field lifetime.
Component Gas Reservoir fluids Water
Nitrogen 1.89·10−3 1.80·10−3 0CO2 3.78·10−2 3.53·10−2 0Water 0 0 1Methane 0.831 0.801 0Ethane 6.98·10−2 7.00·10−2 0Propane 3.02·10−2 3.09·10−2 0i-Butane 4.56·10−3 4.80·10−3 0n-Butane 9.04·10−3 1.01·10−2 0i-Pentane 2.71·10−3 3.50·10−3 0n-Pentane 2.91·10−3 4.00·10−3 0HypoB-1 1.03·10−2 5.10·10−3 0HypoB-2 0 7.90·10−3 0HypoB-3 0 8.50·10−3 0HypoB-4 0 4.90·10−3 0HypoB-5 0 4.50·10−3 0HypoB-6 0 3.10·10−3 0HypoB-7 0 2.00·10−3 0HypoB-8 0 1.20·10−3 0HypoB-9 0 8.00·10−4 0HypoB-10 0 6.00·10−4 0HypoB-11 0 3.00·10−4 0HypoB-12 0 1.00·10−4 0
Table A.10: Molecular weight, M , normal boiling point, Tb, ideal liquid density, ρ(id.liq.), critical temperature, Tc, criticalpressure, pc, critical volume, Vc, and acentric factor, ω, for the hypothetical components used to describe the heavy oilfractions of Platform B.
M [g/mol] Tb [◦C] ρid,liq [kg/m3] Tc [◦C] pc [bar] Vc [m3/kmol] ω [-]
HypoB-1 85.65 68.75 664.5 234.2 29.69 0.37 0.296HypoB-2 91.13 91.95 741 255 34.49 0.3938 0.454HypoB-3 104.3 116.7 765.5 279.3 30.35 0.4153 0.492HypoB-4 118.9 142.2 778 302.2 26.38 0.4571 0.534HypoB-5 140.1 176.3 790.7 331.6 22.35 0.5269 0.594HypoB-6 167.5 217.6 805.5 365.2 19.12 0.6203 0.669HypoB-7 197.5 255.9 818 397.8 16.87 0.7285 0.747HypoB-8 229 291.1 828.9 429 15.3 0.8467 0.825HypoB-9 256.6 318.6 838.6 454.5 14.38 0.952 0.89
HypoB-10 289 349.8 849.1 483 13.61 1.081 0.963HypoB-11 336 390.1 861.8 521.5 12.81 1.271 1.059HypoB-12 403.6 439 876.9 573.2 12.09 1.555 1.177
26

Table A.11: Calculated flow rates of the gas, oil and water phases in each well stream entering the production manifold atPlatform B. These flow rates are estimated by the oil company, based on measurements, and they have a high uncertainty.
Well Gas [103 Sm3/h] Condensate [Sm3/h] Water [Sm3/h]
5 153.9 73.61 1.726 88 41.9 0.7611 136 65.1 1.5312 10.6 5.09 0.1113 42.1 22.64 0.3714 180.3 85.94 1.85
Measured temperatures, pressures and flow rates set within the process are given in Table A.13, whilevalues set based on assumptions and information from documentation of the equipment are given in TableA.14. The following simplifications were done in the simulation:
• In the real process there is an additional test separator in the 1st separation stage. This separator wasmerged into the main 1st stage separator.
• All identical parallel coolers, pumps and scrubbers were merged into one.
• The individual delivery and return temperatures of the cooling medium from each of the coolers wasset to the measured delivery temperature and the temperature of the mixed cooling medium from allcoolers (Table A.13), unless this gave a temperature difference betweem inlet gas and outlet coolingmedium lower than 10 ◦C. In the latter case the temperature was set to give a difference of 10 ◦C.
• The gas fraction in the oil from the phase splitter was modified by splitting a part of the gas outletstream and adding it to the oil stream.
• Pressure drops in tubes and separators and heat losses from tubes were neglected. Pressure drops inheat exchangers, where this was not a function of measured pressures (Table A.13) were set to 1.0 bar.
Measured process variables are compared with simulated process variables in Table A.15. The followingpoints can be noted:
• The simulated temperature of the 1st stage separator is within the uncertainty of 1◦C (Table 6) ofthe measured value, while the simulated temperatures of the 2nd and 3rd stage separators deviatedwith 7.5 and 5.1 ◦C from the measured temperatures. These temperatures are strongly dependent onthe amount of condensate from the wet gas scrubber, and given that the temperature measurementsare correct, the reason for the deviation is assumed to be too high condensate flow from the wetgas scrubber, which indicate that the feed composition is not correct. Decreasing the flow rate ofcondensate with 2/5 gives the measured temperatures in the separators. Decreasing the liquid flowrate at the outlet of the wet gas cooler with 2/5 gave less than 1% change in the exergy destructionin this unit, while changing the temperatures in the separators to the measured ones, resulted inincreased exergy destruction in the coolers in the recompression train with 20% and decreased exergydestruction the compressors in the recompression train with 3.6%. Other changes were less than 1%.
• All simulated flow rates were within the uncertainty of 10% (Table 6) of the measured values.
• Simulated pressure of water and oil entering the water and 1st oil pumps, are 2.4 bar, while the mea-sured values are 3.75 and 3.86 bar, respectively. These deviations are found because height differencesare not taken into consideration in the simulation. As discussed for Platform A [9], this has littleimpact on the overall results.
27

Table A.12: Measured flow rates in process steams leaving Platform B.
Produced fluid Variable Value
Exported condensate F [Sm3/h] 238.9Exported gas F [103 Sm3/h] 761Produced water F [m3/h] 12.6
Table A.13: Measured process variables set in the simulated process flowsheet of Platform B.
Process stream description Variable Value Process stream description Variable Value
Production manifold RecompressionFrom well 5, valve, in p [bar] 131.2 1st stage compressor, in p [bar] 2.26From well 6, valve, in p [bar] 155.2 1st stage compressor, out p [bar] 9.35From well 11, valve, in p [bar] 127.4 2nd stage compressor, in p [bar] 8.90From well 12, valve, in p [bar] 123.2 2nd stage compressor, out p [bar] 27.88From well 13, valve, in p [bar] 124.4 3rd stage compressor, in p [bar] 27.15From well 14, valve, in p [bar] 145.9 3rd stage compressor, out p [bar] 62.87From well 5, valve, out p [bar] 122 4th stage compressor, in p [bar] 61.87From well 6, valve, out p [bar] 121.3 4th stage compressor, out p [bar] 118.4From well 11, valve, out p [bar] 122.4 Condensate pump, out p [bar] 5.7From well 12, valve, out p [bar] 121.1 1st stage cooler, out T [◦C] 29.4From well 13, valve, out p [bar] 121.7 1st stage compressor, out T [◦C] 101.3From well 14, valve, out p [bar] 121.6 2nd stage cooler, out T [◦C] 31.6From well 5, valve, in T [◦C] 109.6 2nd stage compressor, out T [◦C] 115.1From well 6, valve, in T [◦C] 107 3rd stage cooler, out T [◦C] 30.0a
From well 11, valve, in T [◦C] 110.1 3rd stage compressor, out T [◦C] 95.5From well 12, valve, in T [◦C] 63.9 4th stage cooler, out T [◦C] 35.0a
From well 13, valve, in T [◦C] 101 4th stage compressor, out T [◦C] 88.4From well 14, valve, in T [◦C] 110.5 1st stage compressor, in F [m3/h] 7200Separation 2nd stage compressor, in F [m3/h] 12001st stage separator p [bar] 119.6 3rd stage compressor, in F [m3/h] 14102nd stage separator p [bar] 27.8 4th stage compressor, in F [m3/h] 6503rd stage separator p [bar] 2.4 Flare systemPhase splitter, gas out F [Sm3/h] 74,000 To flare F [m3/h] 94.3Water pump, out p [bar] 61.06 Condensate exportFuel gas system 2nd pump, in p [bar] 18.78After inlet valve p [bar] 39 2nd pump, out p [bar] 106.7Fuel gas cooler, out T [◦C] 29.8 Condensate cooler, out T [◦C] 49.4Fuel gas heater, out T [◦C] 49.8 2nd pump, out T [◦C] 56.4To power turbines F [Sm3/h] 2300 Cooling systemGas treatment Cooling medium, delivery p [bar] 12.9Wet gas scrubber p [bar] 118.2 Cooling medium, delivery T [◦C] 24.5Wet gas cooler, out T [◦C] 32 Cooling medium from all coolers mixed T [◦C] 55
aSet point for cooler.
Table A.14: Values for efficiency, η, overall heat transfer coefficient, U , heat transfer surface area, A, temperature, T , Pressure,p, mass fraction, x, and electric work, Wel, assumed or from documentation from process equipment for Platform B.
Process unit Variable Value Source
SeparationWater pump η [%] 75 AssumedRecompressionCross heat exchanger Overall UA [kJ/◦C-h] 580,000 Assumed, operatorsCondensate export1st pump η [%] 55 Pump performance curvesCooling systemCooling medium, MEG weight fraction xMEG [-] 0.35 Documentation of cooling systemCooling medium, water weight fraction xwater [-] 0.65 Documentation of cooling systemFuel gas systemFuel gas heater Wel [kW] 0 Assumed, system description
28

Table A.15: Measured values for temperature, T , Pressure, p, and flow, F , compared with simulated values for Platform B.
Process stream description Variable Measured value Simulated value
Separation1st stage separator T [◦C] 105.5 105.82nd stage separator T [◦C] 86.9 79.43rd stage separator T [◦C] 67.3 62.21st stage separator, water out F [m3/h] 4.8 4.33rd stage separator, water out F [m3/h] 7.8 8.3Water pump, in p [bar] 3.75 2.4Gas treatmentWet gas scrubber, out F [103 Sm3/h] 690 720Condensate export1st pump, in p [bar] 3.86 2.41st pump, out F [m3/h] 250 2502nd pump, out F [m3/h] 250 250
29

Platform C
The process at Platform C was simulated for a real production day with stable conditions, and themeasured data given for this process is measured at 12.00 for this day. The day was a typical day with theexception that the produced water injection system was not in operation, so the water was discharged tothe sea. The process flowsheet of Platform C is given in Fig. A.13.
Recompression
Separation and oil export
Fuel gas system
Gas treatment
Production manifolds
EC
HP
LP
Test
Gas injection
Gas lift
Oil export
Gas import
Produced water
Producing wells: 18
Producingwells: 6
Producingwells: 1
Figure A.13: Process flow diagram of the processing plant of Platform C. Gas streams are shown with orange arrows, waterstreams with blue arrows, and oil, condensate and mixed streams are shown with brown arrows. Symbol explanations can befound in Fig. A.11.
Composition data was available for (i) the reservoir fluids at the start of the field lifetime and (ii) typicalcomposition of the imported gas (which is injected into the reservoir for pressure maintenance). These twofluids plus water was mixed to produce well streams giving realistic water-to-oil and gas-to-oil ratios. Thecompositions of these three fluids are given in Table A.16. Properties of hypothetical components (developedby the oil company) used to describe the heavy fractions are given in Table A.17. Calculated flow ratesfor each well stream are given in Table A.18. Calculated flow rates are flow rates for each phase in thethree-phase well streams estimated by the oil company. Measured flow rates for product streams are givenin Table A.19. The oil and gas flow rates in each well were set to make the simulated product streams fitwith the measured product streams (Table A.19) after all other input data in the simulation was set. Themore uncertain calculated flow rates in the well streams (Table A.18) were used to set the ratio of gas flow
30

rates from each well and the ratio of oil flow rate from each well. Since the produced water was dischargedto the sea, and not injected as usual, the flow rate of the produced water was not measured. The water flowrates in each well was therefore set equal to the calculated flow rate (Table A.18).
Table A.16: Composition of fluids (molar fraction) used for simulation of feed streams of Platform C. The composition of ‘gas’is the typical composition of the imported gas. The composition of ‘reservoir fluids’ is the composition of the reservoir at startthe start of the field lifetime.
Component Gas Reservoir fluids Water
Nitrogen 8.2·10−3 2.7·10−3 0CO2 1.4·10−2 6.0·10−4 0Water 1.0·10−6 0 1Methane 8.6·10−1 1.6·10−1 0Ethane 7.8·10−2 1.1·10−2 0Propane 3.1·10−2 2.8·10−3 0i-Butane 2.6·10−3 5.8·10−3 0n-Butane 4.0·10−3 1.6·10−3 0i-Pentane 4.7·10−4 3.7·10−3 0n-Pentane 4.3·10−4 1.0·10−3 0HypoA-1 2.4·10−4 0 0HypoC-1 0 5.5·10−2 0HypoC-2 0 8.3·10−2 0HypoC-3 0 1.4·10−1 0HypoC-4 0 2.4·10−1 0HypoC-5 0 2.0·10−1 0HypoC-6 0 9.5·10−2 0
Table A.17: Molecular weight, M , normal boiling point, Tb, ideal liquid density, ρ(id.liq.), critical temperature, Tc, and criticalpressure, pc, for the hypothetical components used to describe the heavy oil fractions of Platform C.
M [g/mol] Tb [◦C] ρid.liq. [kg/m3] Tc [◦C] pc [bar]
HypoA-1 81.00 73.00 721.2 247.9 33.46HypoC-1 98.78 85.76 754.3 269.3 35.50HypoC-2 141.2 173.9 816.6 365.7 27.19HypoC-3 185.8 240.5 861.0 434.1 22.71HypoC-4 241.1 314.5 902.5 505.2 18.54HypoC-5 404.5 487.1 955.3 647.0 10.45HypoC-6 907.0 552.8 1007 710.0 9.610
31

Table A.18: Calculated flow rates of the gas, oil and water phases for each well stream entering the production manifolds atPlatform C.
Well Gas Oil Water[103 Sm3/h] [Sm3/h] [Sm3/h]
High pressure production manifold2 18.06 43.69 9.596 6.84 17.49 4.108 7.29 17.56 0.549 3.97 11.49 0.0110 7.35 20.03 0.8315 30.52 133.09 18.1516 30.51 106.90 5.6317 3.88 7.41 0.0118 6.85 13.49 0.0119 7.22 33.02 0.3321 2.72 7.81 0.0025 4.43 22.91 3.4226 6.59 20.60 0.4227 3.71 14.40 0.4528 15.51 41.93 2.2130 6.15 19.17 4.2135 18.62 48.19 3.0840 6.40 27.01 1.42Low pressure production manifold3 2.88 183.26 29.8312 9.14 24.28 2.4013 1.65 105.37 89.7622 0.39 14.28 0.6034 0.21 14.15 0.4439 0.68 43.17 54.94Test manifold1 22.08 91.81 27.42
Table A.19: Measured flow rates in process steams leaving Platform C with uncertainty at 95% confidence level.
Produced fluid Variable Value
Oil F [m3/h] 1147 ± 3Injected gas F [103 Sm3/h] 360 ± 40Gas lift F [103 Sm3/h] 22 ± 2
32

Measured temperatures, pressures and flow rates set in the simulation are given in Table A.20, while val-ues set based on assumptions and information from documentation of the equipment are given in Table A.21.The following simplifications were done in the simulation:
• All identical parallel coolers, pumps and scrubbers were merged into one.
• The delivery and return temperatures of the cooling medium in each of the coolers were set to the valuesfor delivery and return temperature given in the documentation of the seawater system (Table A.21).
• Pressure drops and heat losses in tubes and separators were neglected.
• For heat exchangers where values for pressure drops were not direct functions of measured pressures(Table A.20), pressure drops were set equal to values found in datasheets (Table A.21) or to 1.0 bar.
• A dummy pump was included to increase the pressure of the condensate from 1st scrubber in therecompression train, to avoid inconsistencies in the flowsheet. The pressure out of the pump was setto the pressure out from the 2nd stage separator. In reality the pressure is increased due to heightdifferences.
Simulated values are compared with measured values in Table A.22. The following points can be noted:
• Most simulated temperatures (21 out of 28) are within the uncertainty of 1◦C (Table 6) of the measuredtemperatures. The maximum deviation between measured and simulated temperature is 3.7 ◦C,and this is either due to measurements with higher errors than the assumed uncertainty, or due toinaccuracies in the equation of state. Since deviations higher than 1 ◦C only take place in a few ofthe wells, the effect of this is assumed to be negligible compared to the error sources mentioned inSection 4.
• Simulated pressure of water and oil entering the water and 1st oil pumps, are 2.75 bar, while the mea-sured values are 4.20 and 3.96 bar, respectively. These deviations are found because height differencesare not taken into consideration in the simulation. As discussed for Platform A [9], this has littleimpact on the overall results.
• Simulated flow rates in the oil export and gas treatment sections are within an uncertainty of themeasured values of 10% (Table 6).
33

Table A.20: Measured process variables set in the simulated process flowsheet of Platform C.
Process stream description Variable Value Process stream description Variable Value
High pressure production manifold Low pressure production manifoldFrom well 2, valve, in p [bar] 85.8 From well 3, valve, in p [bar] 14.61From well 6, valve, in p [bar] 95.9 From well 12, valve, in p [bar] 90.2From well 8, valve, in p [bar] 93.9 From well 13, valve, in p [bar] 13.04From well 9, valve, in p [bar] 92.1 From well 22, valve, in p [bar] 70.2From well 10, valve, in p [bar] 95.6 From well 34, valve, in p [bar] 48.4From well 15, valve, in p [bar] 65.4 From well 39, valve, in p [bar] 22.5From well 16, valve, in p [bar] 77.0 From well 3, valve, out p [bar] 9.20From well 17, valve, in p [bar] 110.5 From well 12, valve, out p [bar] 8.08From well 18, valve, in p [bar] 105.4 From well 13, valve, out p [bar] 9.36From well 19, valve, in p [bar] 83.7 From well 22, valve, out p [bar] 7.85From well 21, valve, in p [bar] 96.5 From well 34, valve, out p [bar] 8.05From well 25, valve, in p [bar] 87.4 From well 39, valve, out p [bar] 8.22From well 26, valve, in p [bar] 94.1 From well 3, valve, in T [◦C] 71.1From well 27, valve, in p [bar] 80.8 From well 12, valve, in T [◦C] 61.7From well 28, valve, in p [bar] 94.5 From well 13, valve, in T [◦C] 70.9From well 30, valve, in p [bar] 94.0 From well 22, valve, in T [◦C] 56.0From well 35, valve, in p [bar] 96.6 From well 34, valve, in T [◦C] 57.2From well 40, valve, in p [bar] 88.5 From well 39, valve, in T [◦C] 71.8From well 2, valve, out p [bar] 47.1 Test manifoldFrom well 6, valve, out p [bar] 47.0 From well 1, valve, in p [bar] 60.4From well 8, valve, out p [bar] 47.0 From well 1, valve, out p [bar] 14.76From well 9, valve, out p [bar] 47.0 From well 1, valve, in T [◦C] 68.4From well 10, valve, out p [bar] 47.1 RecompressionFrom well 15, valve, out p [bar] 47.8 1st compressor, in p [bar] 1.24From well 16, valve, out p [bar] 47.4 1st compressor, out p [bar] 7.14From well 17, valve, out p [bar] 47.2 2nd compressor, in p [bar] 5.84From well 18, valve, out p [bar] 47.0 2nd compressor, out p [bar] 17.5From well 19, valve, out p [bar] 46.9 3rd compressor, in p [bar] 16.8From well 21, valve, out p [bar] 46.9 3rd compressor, out p [bar] 45.7From well 25, valve, out p [bar] 46.9 1st cooler, out T [◦C] 30.5From well 26, valve, out p [bar] 46.9 1st compressor, out T [◦C] 164.7From well 27, valve, out p [bar] 46.8 2nd cooler, out T [◦C] 28.3From well 28, valve, out p [bar] 47.0 2nd compressor, out T [◦C] 123.0From well 30, valve, out p [bar] 47.2 3rd cooler, out T [◦C] 26.5From well 35, valve, out p [bar] 47.1 3rd compressor, out T [◦C] 125.1From well 40, valve, out p [bar] 47.0 1st compressor, in F [103 Sm3/h] 6.3From well 2, valve, in T [◦C] 64.5 2nd compressor, in F [103 Sm3/h] 101From well 6, valve, in T [◦C] 66.1 3rd compressor, in F [103 Sm3/h] 87From well 8, valve, in T [◦C] 58.0 Gas treatmentFrom well 9, valve, in T [◦C] 60.6 1st compressor, in p [bar] 44.4From well 10, valve, in T [◦C] 62.4 1st compressor, out p [bar] 94.3From well 15, valve, in T [◦C] 71.8 2nd compressor, in p [bar] 93.1From well 16, valve, in T [◦C] 66.8 2nd compressor, out p [bar] 184.9From well 17, valve, in T [◦C] 51.7 Imported gas p [bar] 110.2From well 18, valve, in T [◦C] 57.9 Import gas compressor, in p [bar] 108.7From well 19, valve, in T [◦C] 61.9 Import gas compressor, out p [bar] 184.3From well 21, valve, in T [◦C] 50.5 1st cooler, out T [◦C] 27.0From well 25, valve, in T [◦C] 58.5 1st compressor, out T [◦C] 91.9From well 26, valve, in T [◦C] 60.9 2nd cooler, out T [◦C] 30.0From well 27, valve, in T [◦C] 57.0 2nd compressor, out T [◦C] 91.6From well 28, valve, in T [◦C] 60.9 Imported gas T [◦C] 4.4From well 30, valve, in T [◦C] 64.2 Import gas cooler, out T [◦C] 29.0From well 35, valve, in T [◦C] 67.8 Import gas compressor, in T [◦C] 9.0From well 40, valve, in T [◦C] 64.4 Import gas compressor, out T [◦C] 52.5Separation and oil export Imported gas F [103 Sm3/h] 159HP degasser p [bar] 46.0 For gas lift, HP F [103 Sm3/h] 0Test separator p [bar] 12.9 For gas lift, LP F [103 Sm3/h] 221st stage separator p [bar] 7.22 For injection F [103 Sm3/h] 360 ± 402nd stage separator p [bar] 2.75 Fuel gas systemWater pump, out p [bar] 13.48 Scrubber, in p [bar] 39.01st oil pump, out p [bar] 12.48 Heater, out T [◦C] 60.92nd oil pump, in p [bar] 9.46 To flare F [Sm3/h] 02nd oil pump, out p [bar] 99.1 To turbines F [Sm3/h] 9650 ± 170Oil heater, out T [◦C] 98.0Export cooler, in T [◦C] 80.8Export cooler, out T [◦C] 74.0
34
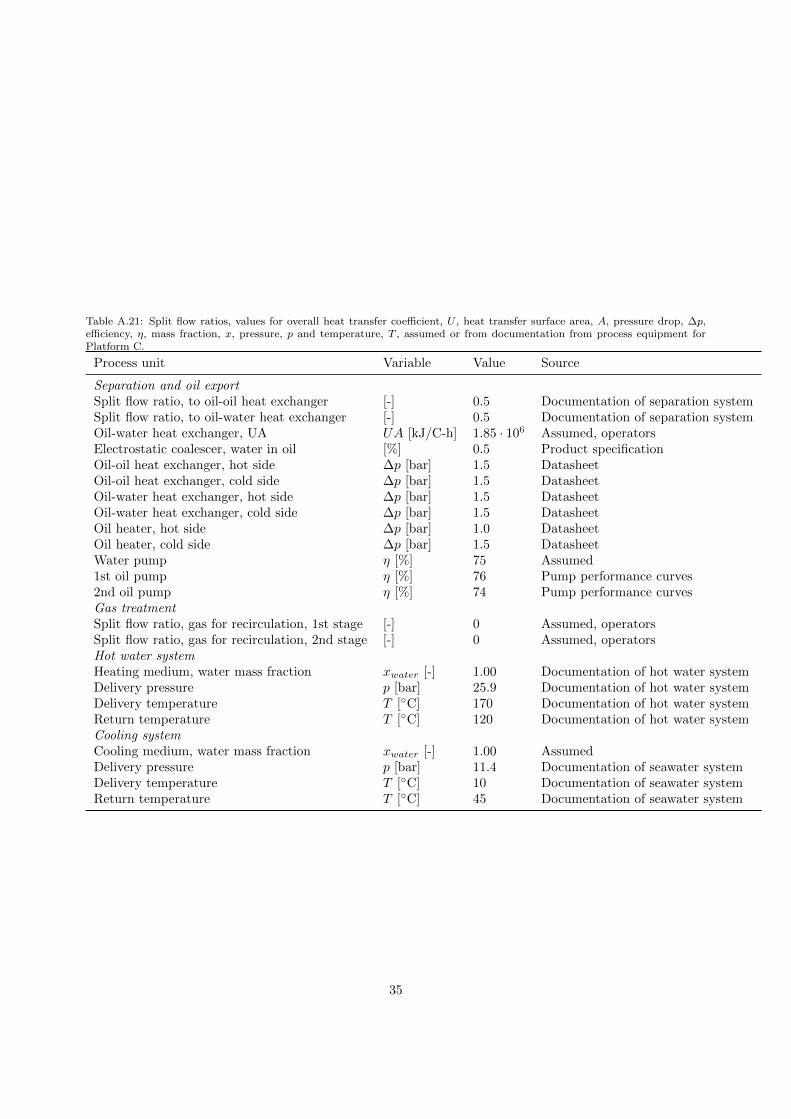
Table A.21: Split flow ratios, values for overall heat transfer coefficient, U , heat transfer surface area, A, pressure drop, ∆p,efficiency, η, mass fraction, x, pressure, p and temperature, T , assumed or from documentation from process equipment forPlatform C.
Process unit Variable Value Source
Separation and oil exportSplit flow ratio, to oil-oil heat exchanger [-] 0.5 Documentation of separation systemSplit flow ratio, to oil-water heat exchanger [-] 0.5 Documentation of separation systemOil-water heat exchanger, UA UA [kJ/C-h] 1.85 · 106 Assumed, operatorsElectrostatic coalescer, water in oil [%] 0.5 Product specificationOil-oil heat exchanger, hot side ∆p [bar] 1.5 DatasheetOil-oil heat exchanger, cold side ∆p [bar] 1.5 DatasheetOil-water heat exchanger, hot side ∆p [bar] 1.5 DatasheetOil-water heat exchanger, cold side ∆p [bar] 1.5 DatasheetOil heater, hot side ∆p [bar] 1.0 DatasheetOil heater, cold side ∆p [bar] 1.5 DatasheetWater pump η [%] 75 Assumed1st oil pump η [%] 76 Pump performance curves2nd oil pump η [%] 74 Pump performance curvesGas treatmentSplit flow ratio, gas for recirculation, 1st stage [-] 0 Assumed, operatorsSplit flow ratio, gas for recirculation, 2nd stage [-] 0 Assumed, operatorsHot water systemHeating medium, water mass fraction xwater [-] 1.00 Documentation of hot water systemDelivery pressure p [bar] 25.9 Documentation of hot water systemDelivery temperature T [◦C] 170 Documentation of hot water systemReturn temperature T [◦C] 120 Documentation of hot water systemCooling systemCooling medium, water mass fraction xwater [-] 1.00 AssumedDelivery pressure p [bar] 11.4 Documentation of seawater systemDelivery temperature T [◦C] 10 Documentation of seawater systemReturn temperature T [◦C] 45 Documentation of seawater system
35

Table A.22: Measured values for temperature, T , pressure, p, and flow, F , compared with simulated values for Platform C.
Process stream description Variable Measured value Simulated value
High pressure production manifoldFrom well 2, valve, out T [◦C] 61.5 61.6From well 6, valve, out T [◦C] 62.7 62.9From well 8, valve, out T [◦C] 53.9 53.2From well 9, valve, out T [◦C] 58.6 56.5From well 10, valve, out T [◦C] 58.5 58.2From well 15, valve, out T [◦C] 70.7 70.9From well 16, valve, out T [◦C] 64.7 64.7From well 17, valve, out T [◦C] 43.4 43.6From well 18, valve, out T [◦C] 51.6 50.7From well 19, valve, out T [◦C] 59.9 59.8From well 21, valve, out T [◦C] 47.0 45.9From well 25, valve, out T [◦C] 56.7 57.1From well 26, valve, out T [◦C] 57.8 57.1From well 27, valve, out T [◦C] 55.5 54.7From well 28, valve, out T [◦C] 57.1 56.8From well 30, valve, out T [◦C] 61.5 61.6From well 35, valve, out T [◦C] 63.7 63.6From well 40, valve, out T [◦C] 62.1 62.1Low pressure production manifoldFrom well 3, valve, out T [◦C] 70.5 71.0From well 12, valve, out T [◦C] 53.0 51.3From well 13, valve, out T [◦C] 70.6 70.9From well 22, valve, out T [◦C] 52.0 55.7From well 34, valve, out T [◦C] 54.9 57.4From well 39, valve, out T [◦C] 70.8 71.9Test manifoldFrom well 1, valve, out T [◦C] 64.9 65.0Separation and oil exportWater pump, in p [bar] 4.20 2.751st oil pump, in p [bar] 3.96 2.751st separator, in T [◦C] 65.1 65.52nd separator, in T [◦C] 96.6 97.22nd oil pump, out F [Sm3/h] 1000 1100Gas treatment1st compressor, in F [Sm3/h] 240,000 230,0002nd compressor, in F [Sm3/h] 260,000 230,000Fuel gas systemHeater, in T [◦C] 23.1 24.2
36