2009u.s.realestatereview - colliers international us rea… · colliers international...
TRANSCRIPT
COLL IERS INTERNATIONAL 2009 U.S. Real Estate Review
A SURVEY OF COMMERCIAL REAL ESTATE MARKETS
www.colliers.com

Colliers Research Services Group is recognized as a knowledge leader in thecommercial real estate industry, and provides clients with valuable marketintelligence to support business decisions. Colliers researchers providemulti-level support across all property types, ranging from data collectionto comprehensive market analysis.
Colliers Research has developed powerful technological tools to provideclients with valuable market intelligence. Our expansive databases housedetailed information on properties nationwide, including historical supply,demand, absorption data, and transaction comparables. Research uses thisinformation to produce quarterly surveys of office and industrial marketsin over 70 North American metropolitan areas.
Colliers research reports provide standardized information for each market.Market Highlights reports based upon quarterly surveys include inventory,vacancy, absorption and rental rates in side-by-side comparisons forNorth American markets as well as quarter-to-quarter comparisons andaggregated national statistics. Investment sales prices and cap rates arereported as well.
Research groups across the country also have expertise in location andsite analysis, geographic information systems, and financial modeling.To ensure that our clients’ real estate decisions are thoroughly informed,our researchers perform numerous financial analyses. Options includecomprehensive occupancy cost comparisons for potential lease locationsand complex lease vs. own scenarios.
The information contained herein has been obtained from sources deemed reliable. While every reasonableeffort has been made to ensure its accuracy, we cannot guarantee it. No responsibility is assumed for anyinaccuracies. Readers are encouraged to consult their professional advisors prior to acting on any of thematerial contained in this report.
Colliers International is a worldwide affiliation of independently owned and operated companies.
COLLIERS RESEARCH
TABLE OF CONTENTS
UNITED STATES REAL ESTATE REVIEW
Message from the Executive Vice President, Market & Economic Research 1
U.S. NATIONAL MARKETS APPENDICES
U.S. Office Market 68U.S. Industrial Warehouse Market 69U.S. Retail Centers 70U.S. Investment Sales Market 71 – 75Glossary 76Colliers U.S.A. Office Locations 77
U.S. CITY ANALYSES AND FORECASTS
Atlanta, GA 5Bakersfield, CA 6Baltimore, MD 7Boise, ID 8Boston, MA 9Charleston, SC 10Charlotte, NC 11Chicago, IL 12Cincinnati, OH 13Cleveland, OH 14Columbia, SC 15Columbus, OH 16Dallas/Ft. Worth, TX 17Denver, CO 18Detroit, MI 19Fairfield, CA 20Ft. Lauderdale/Broward County, FL 21Fresno, CA 22Greenville, SC 23Hartford, CT 24Honolulu, HI 25Houston, TX 26Indianapolis, IN 27Jacksonville, FL 28Kansas City, MO-KS 29Las Vegas, NV 30Little Rock, AR 31Los Angeles, CA 32Los Angeles/Inland Empire, CA 33
Louisville, KY 34Memphis, TN 35Miami/Dade County, FL 36Milwaukee, WI 37Minneapolis, MN 38Nashville, TN 39New Jersey – Central 40New Jersey – Northern 41New York, NY 42 – 44Oakland, CA 45Orange County, CA 46Orlando, FL 47Philadelphia, PA 48Phoenix, AZ 49Pleasanton/Walnut Creek, CA 50Portland, OR 51Raleigh/Durham, NC 52Reno, NV 53Sacramento, CA 54San Diego, CA 55San Francisco, CA 56San Francisco/San Mateo Peninsula, CA 57San Jose/Silicon Valley, CA 58Santa Rosa/Sonoma County, CA 59Seattle/Puget Sound, WA 60St. Louis, MO 61Stockton, CA 62Tampa Bay, FL 63Washington, DC 64 – 65West Palm Beach, FL 66
CO L L I E R S I N T E RNAT I ONA L l U . S . R E A L E S TAT E R E V I EW 2 0 0 9
www.colliers.com
How deep and how long are the questions repeated almostdaily by all those in the real estate industry? This year’sReal Estate Review shows income-producing real estateweakened considerably during the latter half of 2008;evidence thus far in 2009 suggests the downwardmomentum at year-end has accelerated and is almostguaranteed to continue for the remainder of 2009.
At times like this good market insight has never beenmore valued. This report attempts to synthesize themany thousands of leases signed, properties traded anddevelopments undertaken to give the reader a broad senseof the current, and more importantly,future direction of the marketplace inwhich we operate. The outlook hasnever been so daunting; having abetter understanding of the drivers ofdemand and challenges ahead will helpnavigate through what promises to bevery treacherous waters.
Credit, credit and credit were the topthree issues reported by almost everymarket in the country. Businesses,consumers and investors are thirsting forthis critical ingredient to a thriving androbust economy. Housing remains a keyconcern but layoffs and job losses arequickly becoming the top issue for real estate ownersand investors. Jobs and job growth are critical for income-producing real estate; as job losses mount, the outlook forreal estate becomes more uncertain.
For the commercial real estate sector, two overridingissues will dominate the balance of 2009 and quitepossibly well into 2010. To some extent they areinterrelated but deteriorating fundamentals and theability to refinance maturing debt will be key themesthat will be an immense challenge for investors andlenders alike. Fundamentals will weaken significantlywith vacancies for office, retail and industrial real estateexceeding the highs of the 2001-2003 period and will getvery close to the highs experienced during the early1990s. Because occupancies will be lower and rentsreduced, refinancing will be increasingly difficult with theneed for substantial equity infusions for many of thetransactions done since 2005-2006. Lenders have alreadyincreased underwriting standards and will be sure to only
apply stricter lending standards as the economy deteriorates.This will put enormous downward pressure on propertyprices, further reducing the ability of owners to refinance.
The outlook has seldom looked as ominous but whetherthe economy stabilizes this year or next, this recession willend and the next period of expansion will begin. Alreadythere are signs the next up-cycle will be very differentfrom the last. Less leverage will be a certainty, limitinganother round of cap rate compression.Consumer spendingwill be far more subdued as debt reduction will remaina top priority. Corporations will be far more careful with
working capital – meaning expansionwill only take place after carefulconsideration. As always, prime realestate will be highly coveted whilemarginal locations will languish untilan alternative use can be found.Previously high cost centers will struggleas corporations seek out the most costcompetitive alternative.
A newmindset similar to that experiencedduring the post-Depression era will beevident in many parts of the country.This movement toward prudence willnot extend indefinitely but real estateinvestors should be cognizant of a more
conservative mindset for a considerable period of time.The seeds of growth have already been planted with theunprecedented response by policymakers both in the U.S.and around the world. Fiscal and monetary policies arebeginning to take effect as demonstrated by a markedimprovement in the commercial paper market as well asfor corporate bonds.
This is not to suggest the coming months and quarterswon’t be full of tension and anxiety – they will.Whenever the economy slows substantially, as recent datahas shown, there is good reason to be cautious.All of us at Colliers are available to help you navigatethrough this challenging period.
Ross J. MooreExecutive Vice President,Market and Economic ResearchColliers International [email protected]
The Colliers U.S. RealEstate Review providesmarket by market dataand commentary for59 metropolitan areasacross the country.
The result is one of themost comprehensivereviews of its kind.
www.colliers.com 1
CO L L I E R S I N T E RNAT I ONA L l U . S . R E A L E S TAT E R E V I EW 2 0 0 9
SEEKING CLARITY IN THE MIDST OF A PROLONGED RECESSION

U.S. CITY ANALYSES AND FORECASTS
www.colliers.com

ATLANTA, GACO L L I E R S I N T E RNAT I ONA L l U . S . R E A L E S TAT E R E V I EW 2 0 0 9
CONTACT:Mike Spears • [email protected] l RESEARCH: Scott Amoson • [email protected] 5
OFFICE
• Office absorption finished 2008 in slightly positive territory.Despite the tough economy, Atlanta gained just under 100,000 SFof office tenants for the year.
• The top leases were Deloitte & Touche’s 247,700 SF renewal andexpansion Downtown, AT&T’s renewal of 221,000 SF in Northlakeand Primerica Financial’s 195,200 SF renewal in Northeast Atlanta.
• Atlanta was hit hard by the slowdown in the housing market.Previously known for being one of the nation’s leaders, the metroAtlanta region saw housing starts drop 88% in the past two years.
• Office construction in Atlanta remained heavily concentrated in theBuckhead and Midtown submarkets. Over 3.3 million SF of officespace was under construction in these two markets at year-end.
Office Outlook• Leasing activity in 2009 will continue to reel from the economicrecession. Absorption will be fairly strong in the first half of2009 thanks to scheduled move-ins, but will anemic in the latter half.
• Job losses will continue to accumulate in 2009. Professional &Business Services and Information & Financial Activities willbe the biggest industry losers affecting office demand.
• Office vacancy will rise over the next few years thanks toover-development in Buckhead and Midtown.
• The implications of Wachovia’s presence in Atlanta has yet to bedetermined by Wells Fargo’s buyout of the bank. Wachovia hasover 400,000 SF of office space in Atlanta.
• Tenants seeking space in Atlanta will enjoy a favorable market in thenext couple of years with some deals possibly bringing up to two yearsof free rent and others up to $100 per SF in T.I. allowances.
INDUSTRIAL
• Absorption was negative for the first time in six years.Approximately 1.7 million SF of space was put back onthe market in 2008.
• Atlanta’s three largest industrial deals in 2008 all occurred inSouth Atlanta: Rubbermaid signed for a 784,900 SF build-to-suit,Carlisle Tire signed for 676,000 SF of warehouse and Kellogg’srenewed for 547,500 SF of warehouse.
• Businesses tied to housing construction and manufacturing feltthe worst of the crisis.
• Industrial construction levels were at an all-time low in Atlanta.
Industrial Outlook• Absorption will continue to lag in 2009 as job losses continueto mount. Leasing activity will be slow and sporadic.
• Vacancy is expected to continue increasing in 2009, but thanks to theabsence of new development, it should begin stabilizing by year’s end.
• Industrial tenants seeking space in Atlanta can expect one of themost favorable markets in 15 years in 2009. Competition will befierce among Landlords, leading to enticing concession packagesfor prospective tenants.
• The construction industry which is expected to drop another13.6% in employment in 2009, will continue to affect industrialspace demand in Atlanta.
• Atlanta’s industrial market is poised for a quick rebound oncethe economy gets back on track. The city's diversity and leadinginternational airport allows the metro area to take advantageof global opportunities.
DOWNTOWN OFFICE
Inventory New Absorption Vacancy ClassA Cap Rate(SF) Supply (SF) (SF) Rate (%) Rent ($PSF) (%)
1999 46,939,000 290,000 (151,000) 7.4 22.20 –2000 47,589,000 650,000 1,397,000 5.7 24.20 9.252001 50,549,000 2,960,000 (166,000) 11.3 24.90 12.302002 51,774,000 1,225,000 59,000 13.3 23.50 9.402003 52,262,000 488,000 203,000 13.7 23.30 9.752004 52,815,000 553,000 348,000 13.9 21.90 9.002005 53,135,000 320,000 721,000 13.1 22.40 7.502006 53,845,000 710,000 321,000 13.6 21.90 6.502007 55,009,000 1,164,000 1,077,000 13.5 20.50 7.402008 55,273,000 264,000 371,000 12.6 23.00 7.25
SUBURBAN OFFICE
Inventory New Absorption Vacancy ClassA Cap Rate(SF) Supply (SF) (SF) Rate (%) Rent ($PSF) (%)
1999 141,627,000 10,259,000 8,485,000 10.6 23.00 –2000 148,990,000 7,363,000 6,588,000 10.6 23.30 9.502001 156,975,000 7,985,000 560,000 14.8 23.80 10.502002 161,293,000 4,318,000 406,000 16.9 22.40 10.002003 164,188,000 2,895,000 1,194,000 17.6 21.50 10.002004 165,530,000 1,342,000 3,841,000 15.9 21.30 8.502005 168,092,000 2,562,000 4,127,000 14.7 21.40 8.102006 170,988,000 2,896,000 3,848,000 13.9 21.50 7.502007 173,974,000 2,986,000 1,929,000 14.4 23.60 6.502008 177,249,000 3,275,000 (273,000) 15.8 23.10 8.00
INDUSTRIAL
Inventory New Absorption Vacancy Warehouse Land Cap Rate(SF) Supply (SF) (SF) Rate (%) Rent ($PSF) ($PSF) (%)
1999 471,232,000 18,629,000 15,507,000 8.5 3.75 – –2000 487,921,000 16,689,000 16,064,000 8.3 3.70 – –2001 507,342,000 19,421,000 3,510,000 11.2 3.60 2.50 9.752002 514,589,000 7,247,000 (1,961,000) 12.9 3.35 2.87 8.502003 517,618,000 3,029,000 1,369,000 13.1 3.30 3.80 9.152004 525,264,000 7,646,000 13,946,000 11.7 3.50 1.40 9.002005 534,665,000 9,401,000 11,800,000 11.0 3.75 1.85 8.402006 554,995,000 20,330,000 12,882,000 11.9 3.80 1.95 7.302007 564,486,000 9,491,000 9,439,000 11.3 3.83 2.30 8.002008 571,733,000 7,247,000 (1,665,000) 12.6 3.90 1.51 7.80
METROPOLITAN INDICATORS – 2009
• Gross Metro Product Percent Change: (0.1)
• Change in Total Employment (000): (46.2)Percent Change: (1.9)
• Unemployment Rate: 7.5
• Population (000): 5,473.9
Source: Moody’s Economy.com
BAKERSFIELD, CACO L L I E R S I N T E RNAT I ONA L l U . S . R E A L E S TAT E R E V I EW 2 0 0 9
DOWNTOWN OFFICE
Inventory New Absorption Vacancy ClassA Cap Rate(SF) Supply (SF) (SF) Rate (%) Rent ($PSF) (%)
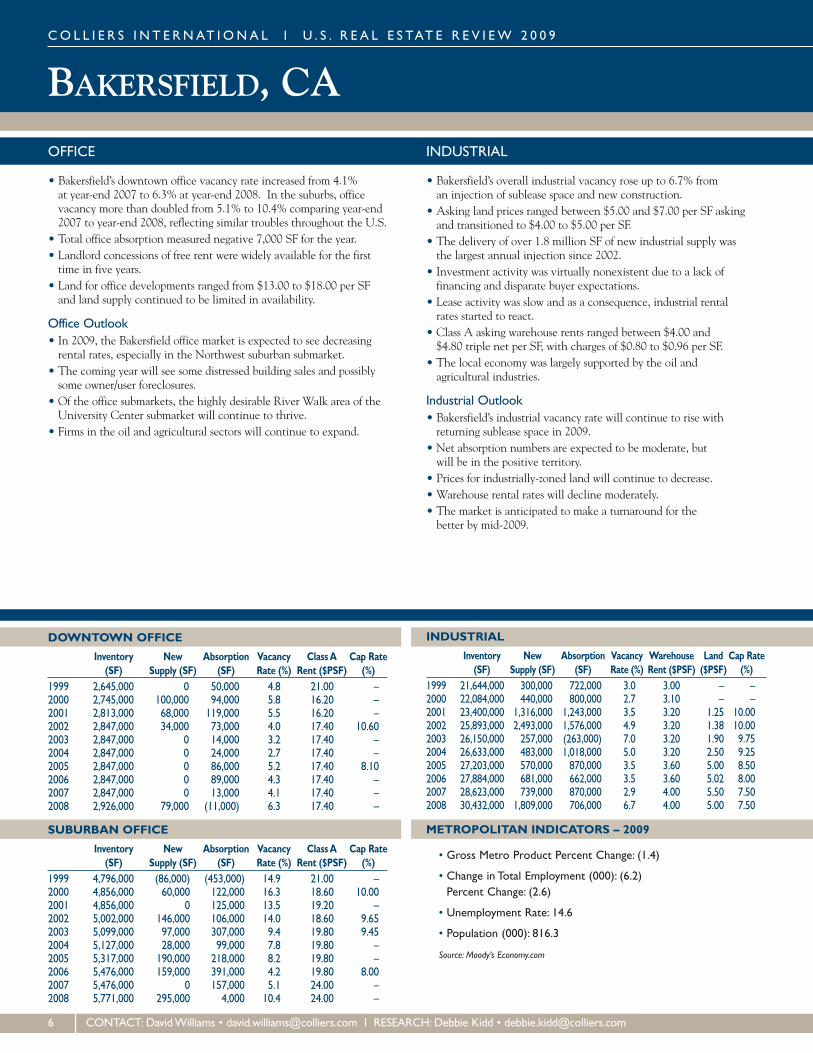
1999 2,645,000 0 50,000 4.8 21.00 –2000 2,745,000 100,000 94,000 5.8 16.20 –2001 2,813,000 68,000 119,000 5.5 16.20 –2002 2,847,000 34,000 73,000 4.0 17.40 10.602003 2,847,000 0 14,000 3.2 17.40 –2004 2,847,000 0 24,000 2.7 17.40 –2005 2,847,000 0 86,000 5.2 17.40 8.102006 2,847,000 0 89,000 4.3 17.40 –2007 2,847,000 0 13,000 4.1 17.40 –2008 2,926,000 79,000 (11,000) 6.3 17.40 –
SUBURBAN OFFICE
Inventory New Absorption Vacancy ClassA Cap Rate(SF) Supply (SF) (SF) Rate (%) Rent ($PSF) (%)
1999 4,796,000 (86,000) (453,000) 14.9 21.00 –2000 4,856,000 60,000 122,000 16.3 18.60 10.002001 4,856,000 0 125,000 13.5 19.20 –2002 5,002,000 146,000 106,000 14.0 18.60 9.652003 5,099,000 97,000 307,000 9.4 19.80 9.452004 5,127,000 28,000 99,000 7.8 19.80 –2005 5,317,000 190,000 218,000 8.2 19.80 –2006 5,476,000 159,000 391,000 4.2 19.80 8.002007 5,476,000 0 157,000 5.1 24.00 –2008 5,771,000 295,000 4,000 10.4 24.00 –
INDUSTRIAL
Inventory New Absorption Vacancy Warehouse Land Cap Rate(SF) Supply (SF) (SF) Rate (%) Rent ($PSF) ($PSF) (%)
1999 21,644,000 300,000 722,000 3.0 3.00 – –2000 22,084,000 440,000 800,000 2.7 3.10 – –2001 23,400,000 1,316,000 1,243,000 3.5 3.20 1.25 10.002002 25,893,000 2,493,000 1,576,000 4.9 3.20 1.38 10.002003 26,150,000 257,000 (263,000) 7.0 3.20 1.90 9.752004 26,633,000 483,000 1,018,000 5.0 3.20 2.50 9.252005 27,203,000 570,000 870,000 3.5 3.60 5.00 8.502006 27,884,000 681,000 662,000 3.5 3.60 5.02 8.002007 28,623,000 739,000 870,000 2.9 4.00 5.50 7.502008 30,432,000 1,809,000 706,000 6.7 4.00 5.00 7.50
METROPOLITAN INDICATORS – 2009
• Gross Metro Product Percent Change: (1.4)
• Change in Total Employment (000): (6.2)Percent Change: (2.6)
• Unemployment Rate: 14.6
• Population (000): 816.3
Source: Moody’s Economy.com
6 CONTACT:DavidWilliams • [email protected] l RESEARCH:Debbie Kidd • [email protected]
OFFICE
• Bakersfield’s downtown office vacancy rate increased from 4.1%at year-end 2007 to 6.3% at year-end 2008. In the suburbs, officevacancy more than doubled from 5.1% to 10.4% comparing year-end2007 to year-end 2008, reflecting similar troubles throughout the U.S.
• Total office absorption measured negative 7,000 SF for the year.• Landlord concessions of free rent were widely available for the firsttime in five years.
• Land for office developments ranged from $13.00 to $18.00 per SFand land supply continued to be limited in availability.
Office Outlook• In 2009, the Bakersfield office market is expected to see decreasingrental rates, especially in the Northwest suburban submarket.
• The coming year will see some distressed building sales and possiblysome owner/user foreclosures.
• Of the office submarkets, the highly desirable River Walk area of theUniversity Center submarket will continue to thrive.
• Firms in the oil and agricultural sectors will continue to expand.
INDUSTRIAL
• Bakersfield’s overall industrial vacancy rose up to 6.7% froman injection of sublease space and new construction.
• Asking land prices ranged between $5.00 and $7.00 per SF askingand transitioned to $4.00 to $5.00 per SF.
• The delivery of over 1.8 million SF of new industrial supply wasthe largest annual injection since 2002.
• Investment activity was virtually nonexistent due to a lack offinancing and disparate buyer expectations.
• Lease activity was slow and as a consequence, industrial rentalrates started to react.
• Class A asking warehouse rents ranged between $4.00 and$4.80 triple net per SF, with charges of $0.80 to $0.96 per SF.
• The local economy was largely supported by the oil andagricultural industries.
Industrial Outlook• Bakersfield’s industrial vacancy rate will continue to rise withreturning sublease space in 2009.
• Net absorption numbers are expected to be moderate, butwill be in the positive territory.
• Prices for industrially-zoned land will continue to decrease.• Warehouse rental rates will decline moderately.• The market is anticipated to make a turnaround for thebetter by mid-2009.
BALTIMORE, MD
DOWNTOWN OFFICE
Inventory New Absorption Vacancy ClassA Cap Rate(SF) Supply (SF) (SF) Rate (%) Rent ($PSF) (%)
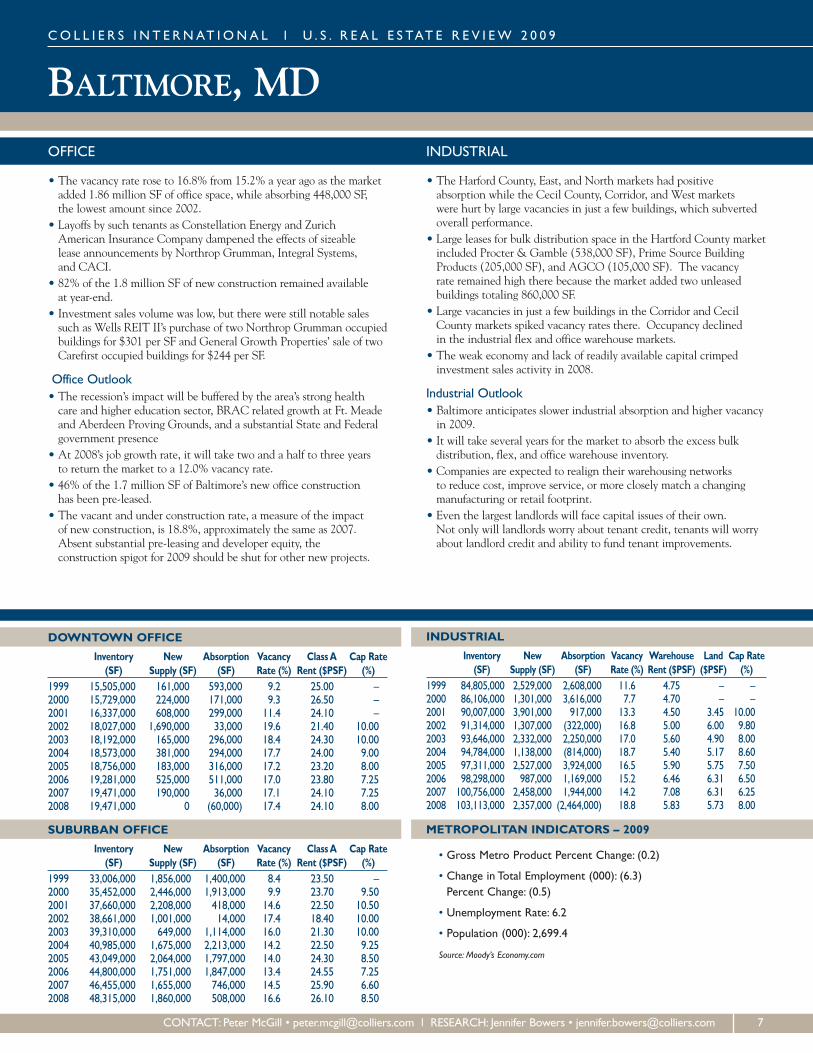
1999 15,505,000 161,000 593,000 9.2 25.00 –2000 15,729,000 224,000 171,000 9.3 26.50 –2001 16,337,000 608,000 299,000 11.4 24.10 –2002 18,027,000 1,690,000 33,000 19.6 21.40 10.002003 18,192,000 165,000 296,000 18.4 24.30 10.002004 18,573,000 381,000 294,000 17.7 24.00 9.002005 18,756,000 183,000 316,000 17.2 23.20 8.002006 19,281,000 525,000 511,000 17.0 23.80 7.252007 19,471,000 190,000 36,000 17.1 24.10 7.252008 19,471,000 0 (60,000) 17.4 24.10 8.00
SUBURBAN OFFICE
Inventory New Absorption Vacancy ClassA Cap Rate(SF) Supply (SF) (SF) Rate (%) Rent ($PSF) (%)
1999 33,006,000 1,856,000 1,400,000 8.4 23.50 –2000 35,452,000 2,446,000 1,913,000 9.9 23.70 9.502001 37,660,000 2,208,000 418,000 14.6 22.50 10.502002 38,661,000 1,001,000 14,000 17.4 18.40 10.002003 39,310,000 649,000 1,114,000 16.0 21.30 10.002004 40,985,000 1,675,000 2,213,000 14.2 22.50 9.252005 43,049,000 2,064,000 1,797,000 14.0 24.30 8.502006 44,800,000 1,751,000 1,847,000 13.4 24.55 7.252007 46,455,000 1,655,000 746,000 14.5 25.90 6.602008 48,315,000 1,860,000 508,000 16.6 26.10 8.50
INDUSTRIAL
Inventory New Absorption Vacancy Warehouse Land Cap Rate(SF) Supply (SF) (SF) Rate (%) Rent ($PSF) ($PSF) (%)
1999 84,805,000 2,529,000 2,608,000 11.6 4.75 – –2000 86,106,000 1,301,000 3,616,000 7.7 4.70 – –2001 90,007,000 3,901,000 917,000 13.3 4.50 3.45 10.002002 91,314,000 1,307,000 (322,000) 16.8 5.00 6.00 9.802003 93,646,000 2,332,000 2,250,000 17.0 5.60 4.90 8.002004 94,784,000 1,138,000 (814,000) 18.7 5.40 5.17 8.602005 97,311,000 2,527,000 3,924,000 16.5 5.90 5.75 7.502006 98,298,000 987,000 1,169,000 15.2 6.46 6.31 6.502007 100,756,000 2,458,000 1,944,000 14.2 7.08 6.31 6.252008 103,113,000 2,357,000 (2,464,000) 18.8 5.83 5.73 8.00
METROPOLITAN INDICATORS – 2009
• Gross Metro Product Percent Change: (0.2)
• Change in Total Employment (000): (6.3)Percent Change: (0.5)
• Unemployment Rate: 6.2
• Population (000): 2,699.4
Source: Moody’s Economy.com
CO L L I E R S I N T E RNAT I ONA L l U . S . R E A L E S TAT E R E V I EW 2 0 0 9
CONTACT: Peter McGill • [email protected] l RESEARCH: Jennifer Bowers • [email protected] 7
OFFICE
• The vacancy rate rose to 16.8% from 15.2% a year ago as the marketadded 1.86 million SF of office space, while absorbing 448,000 SF,the lowest amount since 2002.
• Layoffs by such tenants as Constellation Energy and ZurichAmerican Insurance Company dampened the effects of sizeablelease announcements by Northrop Grumman, Integral Systems,and CACI.
• 82% of the 1.8 million SF of new construction remained availableat year-end.
• Investment sales volume was low, but there were still notable salessuch as Wells REIT II’s purchase of two Northrop Grumman occupiedbuildings for $301 per SF and General Growth Properties’ sale of twoCarefirst occupied buildings for $244 per SF.
Office Outlook• The recession’s impact will be buffered by the area’s strong healthcare and higher education sector, BRAC related growth at Ft. Meadeand Aberdeen Proving Grounds, and a substantial State and Federalgovernment presence
• At 2008’s job growth rate, it will take two and a half to three yearsto return the market to a 12.0% vacancy rate.
• 46% of the 1.7 million SF of Baltimore’s new office constructionhas been pre-leased.
• The vacant and under construction rate, a measure of the impactof new construction, is 18.8%, approximately the same as 2007.Absent substantial pre-leasing and developer equity, theconstruction spigot for 2009 should be shut for other new projects.
INDUSTRIAL
• The Harford County, East, and North markets had positiveabsorption while the Cecil County, Corridor, and West marketswere hurt by large vacancies in just a few buildings, which subvertedoverall performance.
• Large leases for bulk distribution space in the Hartford County marketincluded Procter & Gamble (538,000 SF), Prime Source BuildingProducts (205,000 SF), and AGCO (105,000 SF). The vacancyrate remained high there because the market added two unleasedbuildings totaling 860,000 SF.
• Large vacancies in just a few buildings in the Corridor and CecilCounty markets spiked vacancy rates there. Occupancy declinedin the industrial flex and office warehouse markets.
• The weak economy and lack of readily available capital crimpedinvestment sales activity in 2008.
Industrial Outlook• Baltimore anticipates slower industrial absorption and higher vacancyin 2009.
• It will take several years for the market to absorb the excess bulkdistribution, flex, and office warehouse inventory.
• Companies are expected to realign their warehousing networksto reduce cost, improve service, or more closely match a changingmanufacturing or retail footprint.
• Even the largest landlords will face capital issues of their own.Not only will landlords worry about tenant credit, tenants will worryabout landlord credit and ability to fund tenant improvements.

BOISE, IDCO L L I E R S I N T E RNAT I ONA L l U . S . R E A L E S TAT E R E V I EW 2 0 0 9
DOWNTOWN OFFICE
Inventory New Absorption Vacancy ClassA Cap Rate(SF) Supply (SF) (SF) Rate (%) Rent ($PSF) (%)
1999 2,753,000 242,000 181,000 8.9 19.00 –2000 2,793,000 40,000 17,000 9.1 18.80 9.002001 2,793,000 – – – – –2002 2,793,000 – – – – –2003 2,868,000 75,000 (4,000) 10.6 18.90 8.752004 3,120,000 252,000 187,000 11.7 18.80 8.752005 3,209,000 89,000 206,000 7.6 18.90 8.802006 3,389,000 180,000 88,000 9.7 20.00 7.202007 3,470,000 81,000 126,000 9.3 19.90 7.902008 3,470,000 0 (8,000) 9.5 19.90 7.60
SUBURBAN OFFICE
Inventory New Absorption Vacancy ClassA Cap Rate(SF) Supply (SF) (SF) Rate (%) Rent ($PSF) (%)
1999 7,690,000 331,000 244,000 15.3 17.00 –2000 7,891,000 201,000 234,000 12.6 17.00 8.752001 7,891,000 – – – – –2002 7,891,000 – – – – –2003 8,333,000 442,000 323,000 15.6 16.60 8.502004 8,502,000 169,000 157,000 19.2 17.60 8.502005 9,381,000 879,000 1,068,000 13.4 16.90 9.402006 9,557,000 176,000 197,000 12.9 16.20 7.202007 9,875,000 318,000 113,000 15.6 16.50 7.902008 10,039,000 164,000 5,000 16.4 18.90 7.60
INDUSTRIAL
Inventory New Absorption Vacancy Warehouse Land Cap Rate(SF) Supply (SF) (SF) Rate (%) Rent ($PSF) ($PSF) (%)
1999 26,823,000 396,000 345,000 2.3 4.90 – –2000 28,184,000 1,361,000 1,558,000 1.5 5.00 – –2001 28,265,000 81,000 (712,000) 5.0 4.50 – –2002 28,410,000 145,000 (476,000) 7.7 3.50 – –2003 28,497,000 87,000 (468,000) 10.1 4.40 – 8.752004 28,634,000 137,000 146,000 10.0 4.60 5.00 8.752005 28,722,000 88,000 288,000 9.1 4.60 4.00 8.802006 28,902,000 180,000 754,000 5.7 6.03 3.94 7.852007 29,199,000 297,000 (83,000) 6.0 6.96 4.00 7.802008 29,598,000 399,000 (563,000) 8.7 6.72 4.20 7.30
METROPOLITAN INDICATORS – 2009
• Gross Metro Product Percent Change: 0.8
• Change in Total Employment (000): (5.6)Percent Change: (2.0)
• Unemployment Rate: 7.2
• Population (000): 613.4
Source: Moody’s Economy.com
8 CONTACT: Pete Draper • [email protected] l RESEARCH: Cory Read • [email protected]
OFFICE
• Vacancy throughout Boise’s Treasure Valley was on the rise, goingfrom 13.3% in 2007 to 14.6% in 2008.
• Boise State University purchased the former Albertson’s building onParkcenter, giving Boise State a 61,900 SF research facility.
• The troubled housing market has caused real estate and mortgagerelated companies to close, affecting demand for office space.
• The downtown witnessed minimal change in asking rates andvacancy throughout 2008.
• Shorter lease term durations became more and more commonplacedue to instability in the economy.
Office Outlook• Boise’s office vacancy rate is expected to continue rising in 2009• There will be a flood of new medical office space available for lease:160,000 SF in the Portico development near St. Lukes Hospital inMeridian, and the 70,000 SF Mulvaney Building near St. AlphonsusHospital in Boise.
• Landlords will offer more tenant and broker incentives suchas free rent, increased tenant improvement allowances andlarger commissions.
• Suburban submarkets will continue to add new office buildingsto the market primarily due to the growth in population andupgrade in infrastructure.
• Sublease space and vacancies will continue to rise, while askingrates and absorption are expected to decline.
INDUSTRIAL
• The Boise industrial vacancy rate throughout the Treasure Valleywas up from 6.0% in 2007 to 8.7% at the end of 2008.
• There were few transactions larger than 10,000 SF - Fastlane IndoorCart Racing leased 35,200 SF and American Tire Distributor leased39,000 SF of space.
• Shorter lease term durations were more commonplace dueto instability in the economy.
• Speculative construction came to a halt; however, most 2008 projectsin progress were being completed. One larger project that finishedwas the 165,000 SF warehouse building on Gowen Road.
• Realized lease rates in the first half of 2008 were right around askingrates, but asking rates in the second half of 2008 stayed flat withsome declining, while comp rates decreased.
Industrial Outlook• The industrial vacancy rate is expected to continue rising in 2009.• Owner/user sites will remain in high demand.• New infrastructure will include the widening interstate I-84 fromMeridian to Nampa, new overpasses on I-84 from Boise to Caldwell,and the new Ten Mile Road interchange.
• The availability of sublease space will rise due to the slowdownin home sales and downsizing in residential construction-basedcompanies such as BMCWest.
• Industrial landlords will also offer tenants and brokers moreconcessions such as free rent, increased tenant improvementallowances and larger commissions.
• In 2009, sublease space and vacancies are expected to continueto rise, while asking rates and absorption are expected to decline.
BOSTON, MA
DOWNTOWN OFFICE
Inventory New Absorption Vacancy ClassA Cap Rate(SF) Supply (SF) (SF) Rate (%) Rent ($PSF) (%)
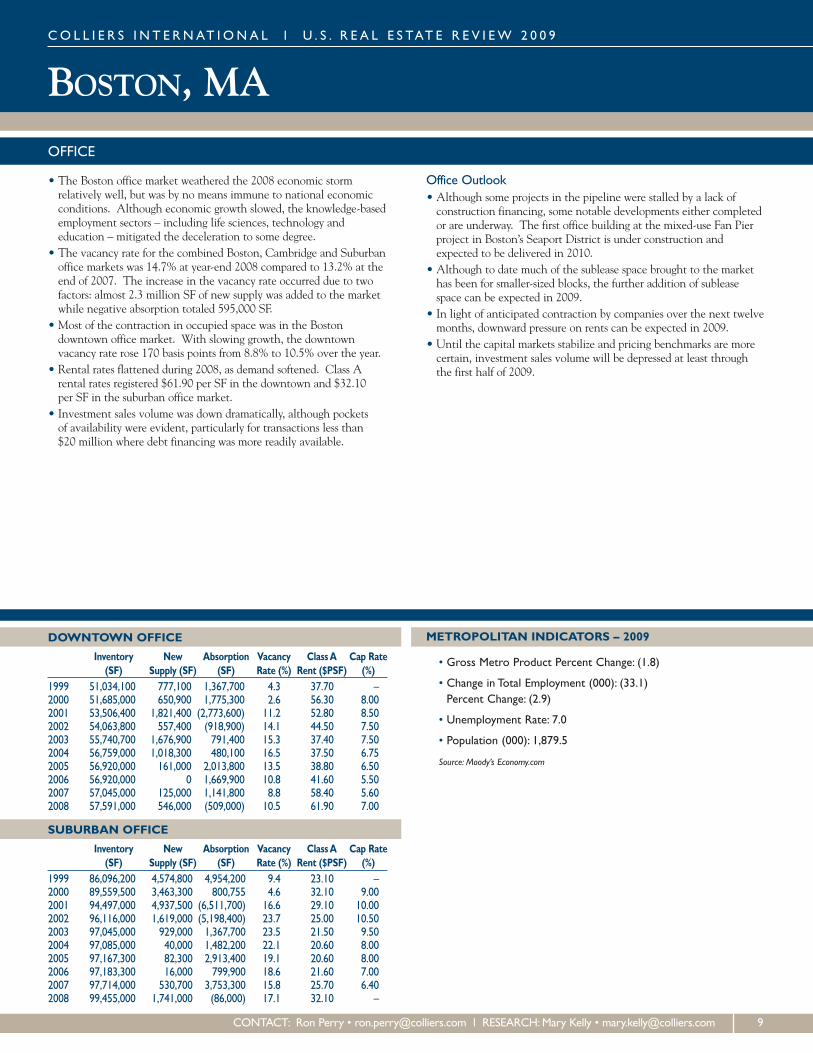
1999 51,034,100 777,100 1,367,700 4.3 37.70 –2000 51,685,000 650,900 1,775,300 2.6 56.30 8.002001 53,506,400 1,821,400 (2,773,600) 11.2 52.80 8.502002 54,063,800 557,400 (918,900) 14.1 44.50 7.502003 55,740,700 1,676,900 791,400 15.3 37.40 7.502004 56,759,000 1,018,300 480,100 16.5 37.50 6.752005 56,920,000 161,000 2,013,800 13.5 38.80 6.502006 56,920,000 0 1,669,900 10.8 41.60 5.502007 57,045,000 125,000 1,141,800 8.8 58.40 5.602008 57,591,000 546,000 (509,000) 10.5 61.90 7.00
SUBURBAN OFFICE
Inventory New Absorption Vacancy ClassA Cap Rate(SF) Supply (SF) (SF) Rate (%) Rent ($PSF) (%)
1999 86,096,200 4,574,800 4,954,200 9.4 23.10 –2000 89,559,500 3,463,300 800,755 4.6 32.10 9.002001 94,497,000 4,937,500 (6,511,700) 16.6 29.10 10.002002 96,116,000 1,619,000 (5,198,400) 23.7 25.00 10.502003 97,045,000 929,000 1,367,700 23.5 21.50 9.502004 97,085,000 40,000 1,482,200 22.1 20.60 8.002005 97,167,300 82,300 2,913,400 19.1 20.60 8.002006 97,183,300 16,000 799,900 18.6 21.60 7.002007 97,714,000 530,700 3,753,300 15.8 25.70 6.402008 99,455,000 1,741,000 (86,000) 17.1 32.10 –
METROPOLITAN INDICATORS – 2009
• Gross Metro Product Percent Change: (1.8)
• Change in Total Employment (000): (33.1)Percent Change: (2.9)
• Unemployment Rate: 7.0
• Population (000): 1,879.5
Source: Moody’s Economy.com
CO L L I E R S I N T E RNAT I ONA L l U . S . R E A L E S TAT E R E V I EW 2 0 0 9
CONTACT: Ron Perry • [email protected] l RESEARCH:Mary Kelly • [email protected] 9
OFFICE
• The Boston office market weathered the 2008 economic stormrelatively well, but was by no means immune to national economicconditions. Although economic growth slowed, the knowledge-basedemployment sectors – including life sciences, technology andeducation – mitigated the deceleration to some degree.
• The vacancy rate for the combined Boston, Cambridge and Suburbanoffice markets was 14.7% at year-end 2008 compared to 13.2% at theend of 2007. The increase in the vacancy rate occurred due to twofactors: almost 2.3 million SF of new supply was added to the marketwhile negative absorption totaled 595,000 SF.
• Most of the contraction in occupied space was in the Bostondowntown office market. With slowing growth, the downtownvacancy rate rose 170 basis points from 8.8% to 10.5% over the year.
• Rental rates flattened during 2008, as demand softened. Class Arental rates registered $61.90 per SF in the downtown and $32.10per SF in the suburban office market.
• Investment sales volume was down dramatically, although pocketsof availability were evident, particularly for transactions less than$20 million where debt financing was more readily available.
Office Outlook• Although some projects in the pipeline were stalled by a lack ofconstruction financing, some notable developments either completedor are underway. The first office building at the mixed-use Fan Pierproject in Boston’s Seaport District is under construction andexpected to be delivered in 2010.
• Although to date much of the sublease space brought to the markethas been for smaller-sized blocks, the further addition of subleasespace can be expected in 2009.
• In light of anticipated contraction by companies over the next twelvemonths, downward pressure on rents can be expected in 2009.
• Until the capital markets stabilize and pricing benchmarks are morecertain, investment sales volume will be depressed at least throughthe first half of 2009.
CHARLESTON, SCCO L L I E R S I N T E RNAT I ONA L l U . S . R E A L E S TAT E R E V I EW 2 0 0 9
DOWNTOWN OFFICE
Inventory New Absorption Vacancy ClassA Cap Rate(SF) Supply (SF) (SF) Rate (%) Rent ($PSF) (%)
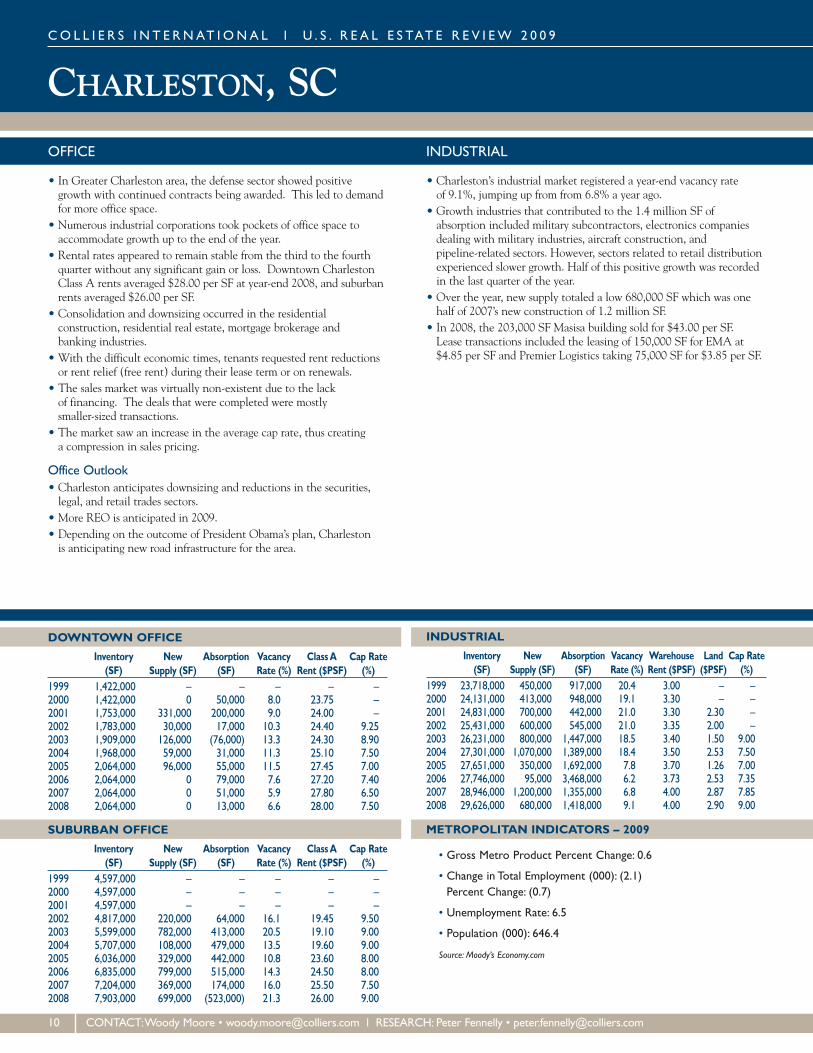
1999 1,422,000 – – – – –2000 1,422,000 0 50,000 8.0 23.75 –2001 1,753,000 331,000 200,000 9.0 24.00 –2002 1,783,000 30,000 17,000 10.3 24.40 9.252003 1,909,000 126,000 (76,000) 13.3 24.30 8.902004 1,968,000 59,000 31,000 11.3 25.10 7.502005 2,064,000 96,000 55,000 11.5 27.45 7.002006 2,064,000 0 79,000 7.6 27.20 7.402007 2,064,000 0 51,000 5.9 27.80 6.502008 2,064,000 0 13,000 6.6 28.00 7.50
SUBURBAN OFFICE
Inventory New Absorption Vacancy ClassA Cap Rate(SF) Supply (SF) (SF) Rate (%) Rent ($PSF) (%)
1999 4,597,000 – – – – –2000 4,597,000 – – – – –2001 4,597,000 – – – – –2002 4,817,000 220,000 64,000 16.1 19.45 9.502003 5,599,000 782,000 413,000 20.5 19.10 9.002004 5,707,000 108,000 479,000 13.5 19.60 9.002005 6,036,000 329,000 442,000 10.8 23.60 8.002006 6,835,000 799,000 515,000 14.3 24.50 8.002007 7,204,000 369,000 174,000 16.0 25.50 7.502008 7,903,000 699,000 (523,000) 21.3 26.00 9.00
INDUSTRIAL
Inventory New Absorption Vacancy Warehouse Land Cap Rate(SF) Supply (SF) (SF) Rate (%) Rent ($PSF) ($PSF) (%)
1999 23,718,000 450,000 917,000 20.4 3.00 – –2000 24,131,000 413,000 948,000 19.1 3.30 – –2001 24,831,000 700,000 442,000 21.0 3.30 2.30 –2002 25,431,000 600,000 545,000 21.0 3.35 2.00 –2003 26,231,000 800,000 1,447,000 18.5 3.40 1.50 9.002004 27,301,000 1,070,000 1,389,000 18.4 3.50 2.53 7.502005 27,651,000 350,000 1,692,000 7.8 3.70 1.26 7.002006 27,746,000 95,000 3,468,000 6.2 3.73 2.53 7.352007 28,946,000 1,200,000 1,355,000 6.8 4.00 2.87 7.852008 29,626,000 680,000 1,418,000 9.1 4.00 2.90 9.00
METROPOLITAN INDICATORS – 2009
• Gross Metro Product Percent Change: 0.6
• Change in Total Employment (000): (2.1)Percent Change: (0.7)
• Unemployment Rate: 6.5
• Population (000): 646.4
Source: Moody’s Economy.com
10 CONTACT:Woody Moore • [email protected] l RESEARCH: Peter Fennelly • [email protected]
OFFICE
• In Greater Charleston area, the defense sector showed positivegrowth with continued contracts being awarded. This led to demandfor more office space.
• Numerous industrial corporations took pockets of office space toaccommodate growth up to the end of the year.
• Rental rates appeared to remain stable from the third to the fourthquarter without any significant gain or loss. Downtown CharlestonClass A rents averaged $28.00 per SF at year-end 2008, and suburbanrents averaged $26.00 per SF.
• Consolidation and downsizing occurred in the residentialconstruction, residential real estate, mortgage brokerage andbanking industries.
• With the difficult economic times, tenants requested rent reductionsor rent relief (free rent) during their lease term or on renewals.
• The sales market was virtually non-existent due to the lackof financing. The deals that were completed were mostlysmaller-sized transactions.
• The market saw an increase in the average cap rate, thus creatinga compression in sales pricing.
Office Outlook• Charleston anticipates downsizing and reductions in the securities,legal, and retail trades sectors.
• More REO is anticipated in 2009.• Depending on the outcome of President Obama’s plan, Charlestonis anticipating new road infrastructure for the area.
INDUSTRIAL
• Charleston’s industrial market registered a year-end vacancy rateof 9.1%, jumping up from from 6.8% a year ago.
• Growth industries that contributed to the 1.4 million SF ofabsorption included military subcontractors, electronics companiesdealing with military industries, aircraft construction, andpipeline-related sectors. However, sectors related to retail distributionexperienced slower growth. Half of this positive growth was recordedin the last quarter of the year.
• Over the year, new supply totaled a low 680,000 SF which was onehalf of 2007’s new construction of 1.2 million SF.
• In 2008, the 203,000 SF Masisa building sold for $43.00 per SF.Lease transactions included the leasing of 150,000 SF for EMA at$4.85 per SF and Premier Logistics taking 75,000 SF for $3.85 per SF.

CHARLOTTE, NC
DOWNTOWN OFFICE
Inventory New Absorption Vacancy ClassA Cap Rate(SF) Supply (SF) (SF) Rate (%) Rent ($PSF) (%)
1999 17,430,000 1,145,000 938,000 5.1 28.00 –2000 18,182,000 752,000 947,000 3.2 25.30 8.002001 18,849,000 667,000 126,000 5.4 24.50 –2002 19,847,000 998,000 364,000 9.5 22.90 –2003 19,947,000 100,000 (7,000) 10.2 23.80 –2004 19,947,000 0 77,000 9.7 23.80 –2005 20,037,000 90,000 463,000 5.2 21.30 –2006 20,037,000 0 157,000 4.7 22.80 7.102007 20,078,000 41,000 363,000 2.5 29.00 6.252008 20,078,000 0 44,000 2.4 32.20 8.00
SUBURBAN OFFICE
Inventory New Absorption Vacancy ClassA Cap Rate(SF) Supply (SF) (SF) Rate (%) Rent ($PSF) (%)
1999 44,344,000 420,000 1,558,000 13.0 24.00 –2000 45,481,000 1,137,000 1,423,000 11.8 21.80 8.502001 47,334,000 1,853,000 215,000 17.8 20.30 –2002 48,191,000 857,000 98,000 19.8 20.00 –2003 48,583,000 392,000 539,000 18.9 19.30 –2004 49,246,000 663,000 89,000 20.7 19.30 –2005 50,199,000 953,000 1,551,000 15.3 19.40 –2006 51,759,000 1,560,000 1,273,000 15.7 19.70 7.602007 52,617,000 858,000 1,624,000 12.2 20.00 7.002008 54,490,000 1,873,000 735,000 13.3 20.00 8.50
INDUSTRIAL
Inventory New Absorption Vacancy Warehouse Land Cap Rate(SF) Supply (SF) (SF) Rate (%) Rent ($PSF) ($PSF) (%)
1999 162,549,000 1,959,000 2,044,000 13.0 4.30 – –2000 163,899,000 1,350,000 1,712,000 9.7 3.80 – –2001 166,389,000 2,490,000 233,000 7.1 3.88 1.49 9.502002 168,274,000 1,885,000 1,442,000 8.6 3.72 1.50 9.802003 168,911,000 637,000 (274,000) 8.9 3.12 1.70 9.502004 169,711,000 800,000 102,000 9.2 3.31 1.75 9.002005 170,466,000 755,000 1,648,000 9.2 3.65 2.06 9.002006 171,434,000 968,000 2,231,000 8.3 3.79 2.29 9.002007 172,578,000 1,144,000 2,825,000 7.4 3.85 1.95 7.502008 173,231,000 653,000 (930,000) 8.2 3.85 2.18 8.50
METROPOLITAN INDICATORS – 2009
• Gross Metro Product Percent Change: 1.7
• Change in Total Employment (000): (11.1)Percent Change: (1.3)
• Unemployment Rate: 8.4
• Population (000): 1,731.9
Source: Moody’s Economy.com
CO L L I E R S I N T E RNAT I ONA L l U . S . R E A L E S TAT E R E V I EW 2 0 0 9
CONTACT: Rob Cochran • [email protected] l RESEARCH: Kate Reilly • [email protected] 11
OFFICE
• Absorption was flat for the last half of 2008 with vacancy risingdue to the slowing demand and the delivery of new supply.
• Given the deteriorating national economy and the slowingdemand for office space, announcements for new constructioncame to a standstill.
• Rents increased at a brisk pace between 2007 and the end of 2008with an 8% increase citywide and a 20% increase in downtownrents. These rents flattened out at the end of 2008 and will probablydecrease around 5% in 2009, though most of this will be in higherconcessions than a decrease in face rates.
Office Outlook• In the first half of 2009, absorption will be flat or negative. With thedelivery of 3 million SF, about 50% pre-leased, coming online inlate 2009 and early 2010, downtown vacancy may climb from 6% to7% and citywide vacancy may rise to 12% or 13%.
• While the anticipated space demand effect of Wells Fargo’s purchaseof Wachovia is expected to be mild, it has fueled market uncertaintygoing into 2009 and a probable shift from a landlord's to a tenant’smarket. This is tempered with the anticipated absorption by Bankof America, driven by its acquisition of Merrill Lynch, and the factthat Charlotte is still the national hub for retail banking.
• While sublease space has been less than 1% of total supply for thepast years, it significantly increased by the end of 2008 and willbecome a bigger market factor in 2009. This discounted space willput pressure on rents, but will also offer some tenants a short-termoption to reevaluate the market at a lower cost.
INDUSTRIAL
• 2008 saw a significant increase in foreign firms moving theirmanufacturing operations into Charlotte. Meanwhile, textiles andhousing related manufacturing fell off dramatically over the year.
• Industrial speculative building ground to a halt with no new projectscurrently underway. The year ended with only two speculativeprojects: 250,000 SF at Sykes Industrial Park and the 172,000 SFat 77 Overlook.
• Good industrial land sites continued to be scarce in MecklenburgCounty. Development slowed considerably in the surrounding areasdue to economic factors.
• With the lack of new buildings being delivered, absorption remainedrelatively flat. Warehouse vacancy at the end of 2008 registered8.2%, up from the 7.4% a year earlier.
• Significant sales/lease transactions included 226,600 SF taken byPrecision Framing Systems at Logistics Pointe, 141,600 SF takenby Belk at Nation’s West, Anna’s Linens leasing 112,000 SF atRidge Creek I and DesignLine and Celgard leasing 100,000 SFeach at 2309 Nevada Boulevard and at South Point, respectively.
• Industrial land in the Charlotte metro area sold for between $85,000to $125,000 per acre while land in outlying counties went forbetween $35,000 and $65,000 per acre.
Industrial Outlook• The pace of speculative land development has slowed dramaticallyin 2008 and is not expected to change pace in 2009.
• Construction of a third parallel runway at Charlotte/Douglas Airportis anticipated to be completed by October 2010.

CHICAGO, ILCO L L I E R S I N T E RNAT I ONA L l U . S . R E A L E S TAT E R E V I EW 2 0 0 9
DOWNTOWN OFFICE
Inventory New Absorption Vacancy ClassA Cap Rate(SF) Supply (SF) (SF) Rate (%) Rent ($PSF) (%)
1999 119,220,000 333,000 355,000 9.9 34.00 –2000 120,493,000 1,273,000 178,000 10.7 36.00 9.502001 122,239,000 1,746,000 (2,826,000) 14.3 35.00 8.502002 123,021,000 782,000 (207,000) 15.0 32.00 8.502003 124,525,000 1,504,000 (535,000) 16.5 32.00 8.252004 126,352,000 1,827,000 (141,000) 17.8 32.00 7.502005 128,248,000 1,896,000 1,545,000 17.8 34.00 7.502006 128,727,000 479,000 3,520,000 15.4 36.00 5.502007 128,727,000 0 2,622,000 13.2 40.00 5.502008 129,228,000 501,000 320,000 12.8 39.00 6.75
SUBURBAN OFFICE
Inventory New Absorption Vacancy ClassA Cap Rate(SF) Supply (SF) (SF) Rate (%) Rent ($PSF) (%)
1999 93,210,000 3,984,000 1,681,000 11.7 27.00 –2000 97,139,000 3,929,000 1,383,000 13.8 28.50 9.502001 101,312,000 4,173,000 (3,010,000) 20.7 29.00 9.252002 103,025,000 1,713,000 (793,000) 23.4 25.00 9.502003 103,427,000 402,000 (1,283,000) 23.9 25.00 9.002004 103,966,000 539,000 2,501,000 21.8 22.00 8.002005 104,192,000 226,000 1,365,000 21.1 23.60 7.252006 104,325,000 133,000 1,385,000 18.9 22.30 7.252007 104,859,000 534,000 (176,000) 19.3 27.80 7.252008 106,564,000 1,705,000 (877,000) 20.9 24.00 8.00
INDUSTRIAL
Inventory New Absorption Vacancy Warehouse Land Cap Rate(SF) Supply (SF) (SF) Rate (%) Rent ($PSF) ($PSF) (%)
1999 1,162,745,000 22,227,000 24,189,000 5.6 5.20 – –2000 1,181,888,000 19,143,000 15,680,000 5.8 5.60 – –2001 1,192,236,000 10,348,000 (11,416,000) 8.0 5.10 4.68 9.002002 1,205,597,000 13,361,000 743,458 8.9 4.40 3.90 8.502003 1,219,063,000 13,466,000 7,392,000 9.4 4.60 4.80 8.102004 1,236,341,000 17,278,000 13,221,000 9.5 4.50 4.20 7.352005 1,255,233,000 18,892,000 19,349,000 9.0 4.60 5.17 6.752006 1,272,859,000 17,626,000 14,077,000 9.0 4.56 6.01 6.652007 1,287,019,000 14,160,000 11,833,000 8.8 4.64 6.39 6.752008 1,303,948,000 16,929,000 (11,081,000) 10.3 4.66 5.58 7.25
METROPOLITAN INDICATORS – 2009
• Gross Metro Product Percent Change: 1.1
• Change in Total Employment (000): (43.3)Percent Change: (1.1)
• Unemployment Rate: 8.1
• Population (000): 8,057.6
Source: Moody’s Economy.com
12 CONTACT:David Bercu • [email protected] l RESEARCH:George Cutro • [email protected]
OFFICE
• Large downtown leases included Sargent & Lundy’s renewal/expansion for 500,000 SF, Northern Trust Corp’s 420,000 SFrenewal/expansion and William Blair’s 340,000 SF new lease.
• While absorption remained positive in the downtown, totals werenot nearly as high as the prior three years, an indication of moderatesoftening in the CBD as a result of the economic fallout.
• The largest suburban lease of 2008 was Walgreen’s 320,000 SFsublease of Two Overlook Point in Lincolnshire.
• Investment sales fell dramatically in the CBD. The largest suburbaninvestment sale was John Buck Company’s purchase of ParkwayNorth Center in Deerfield for $169 million. There were fewersales as many buildings were removed from the market dueto the economic slowdown.
Office Outlook• Chicago’s CBD will have three new buildings delivered in 2009totaling 3.6 million SF. Despite successful pre-leasing, the tenantsrelocating to these new buildings will create significant vacanciesin numerous existing downtown Class A properties.
• The recession coupled with delivery of the new inventory is likelyto drive vacancy rates up in 2009 as tenants shed excess space or haltdecision making. This will likely translate to an increase in availablesublease space in the CBD.
• New development in the suburbs slowed down dramatically with only400,000 SF scheduled to be complete in six buildings. The majorityof the space has yet to be leased.
• The suburban market will see an increase in vacancy throughout2009 in both direct and sublet space. The suburbs continue to seea decrease in asking office rents in 2009 for all building classes.
INDUSTRIAL
• Food, beverage and pharmaceutical companies were major absorbersof space in 2008. Of the top ten transactions, four took place by theaforementioned companies.
• Developers in the big box corridor of I-80 put all large speculativeprojects on hold, precipitated by the current big box supply – at year-end, nine facilities were available in excess of 500,000 SF.
• Financial institutions’ stringent underwriting criteria (it was notuncommon to have to come up with a 40% to 50% downpayment)forced companies to turn to leasing to fill their space requirements.
• The Canadian National Railway purchase of the Elgin Joliet &Eastern Railway was finalized this year, despite opposition of severalcommunities that reside along the route. CNR plans to increasefreight traffic along this route but will spend a significant amount ofmoney to install safety equipment at crossings.
• Investors’ desire to purchase vacant buildings dissipated in 2008.Industrial land values fell in 2008 with the O’Hare market witnessingthe largest decline at 50% from last year’s level.
Industrial Outlook• Tenants with above-standard tenant improvements will have lessbuilding options in 2009. Some of the institutional owners will nothave the financial viability to compete for those deals.
• The trend of tenants approaching their landlords prior to upcominglease renewals with the pretense of lowering their occupancy costsbased on the current state of the market will continue throughout 2009.
• Sellers’ expectations will start to fall in line with what the market willbear in 2009. An uptick in seller financing is expected as sellers usethis as a vehicle to complete the transaction.

CINCINNATI, OH
DOWNTOWN OFFICE
Inventory New Absorption Vacancy ClassA Cap Rate(SF) Supply (SF) (SF) Rate (%) Rent ($PSF) (%)
1999 13,651,000 36,000 93,000 7.6 20.80 –2000 13,664,000 13,000 97,000 6.9 20.90 10.102001 13,671,000 7,000 (288,000) 10.5 21.30 9.002002 14,034,000 363,000 (221,000) 12.2 21.20 10.002003 13,437,000 (597,000) (56,000) 13.0 21.20 10.002004 13,436,000 (1,000) 120,000 11.9 21.00 10.002005 13,595,000 159,000 (78,000) 13.7 21.80 9.002006 12,707,000 (888,000) (311,000) 17.5 21.80 8.002007 12,707,000 0 175,000 17.3 22.30 7.502008 12,707,000 0 (178,000) 17.3 23.60 –
SUBURBAN OFFICE
Inventory New Absorption Vacancy ClassA Cap Rate(SF) Supply (SF) (SF) Rate (%) Rent ($PSF) (%)
1999 15,122,000 409,000 2,000 11.6 22.00 –2000 16,106,000 984,000 (319,000) 12.9 19.20 10.102001 17,243,000 1,137,000 (6,000) 19.2 19.30 9.852002 17,886,000 643,000 3,000 20.3 19.70 10.852003 16,369,000 (1,517,000) (142,000) 23.1 19.80 10.752004 16,505,000 136,000 189,000 21.8 19.80 10.502005 17,178,000 673,000 675,000 21.0 19.80 6.502006 17,829,000 651,000 552,000 20.2 19.80 8.252007 18,443,000 614,000 796,000 21.1 20.20 7.502008 19,433,000 990,000 506,000 21.6 20.50 –
INDUSTRIAL
Inventory New Absorption Vacancy Warehouse Land Cap Rate(SF) Supply (SF) (SF) Rate (%) Rent ($PSF) ($PSF) (%)
1999 232,293,000 9,000,000 2,163,000 5.0 4.30 – –2000 240,293,000 8,000,000 2,500,000 6.0 3.30 – –2001 245,732,000 5,439,000 464,000 7.6 3.20 1.38 9.752002 247,832,000 2,100,000 1,003,000 8.5 3.20 1.85 9.502003 248,874,000 1,042,000 (35,000) 8.9 3.20 1.40 9.002004 251,531,000 2,657,000 6,134,000 7.8 3.20 1.78 9.002005 254,559,000 3,028,000 7,636,000 5.8 3.20 1.25 8.502006 259,692,000 5,133,000 4,694,000 5.9 3.20 1.25 8.752007 264,948,000 5,256,000 2,397,000 6.6 3.25 1.50 7.002008 270,672,000 5,724,000 1,234,000 8.1 2.90 2.00 8.50
METROPOLITAN INDICATORS – 2009
• Gross Metro Product Percent Change: 1.0
• Change in Total Employment (000): (12.4)Percent Change: (1.2)
• Unemployment Rate: 6.9
• Population (000): 2,132.0
Source: Moody’s Economy.com
CO L L I E R S I N T E RNAT I ONA L l U . S . R E A L E S TAT E R E V I EW 2 0 0 9
CONTACT: Jeff Bender • [email protected] l RESEARCH:MaryAnn Christenson • [email protected] 13
OFFICE
• While there was positive net absorption of 972,000 SF in 2007,2008 recorded a positive net absorption of 328,000 SF - one-third ofthe previous year’s total. The positive growth was in the Cincinnatisuburban office market where the market grew by 506,000 SF.
• In contrast to most office markets around the nation, Cincinnati’soffice rental rates showed some incline as downtown Class A rentsaveraged $23.60 per SF, compared to $22.30 per SF at year-end 2007.In the suburbs, rents edged up slightly from $20.20 per SF to$20.50 per SF.
• Medical facility construction was a strong niche sector in 2008.• New development continued along the I-71 corridor andWest Chester area, and the Cincinnati market receivedin total 990,000 SF of new office supply.
Office Outlook• New construction will be tenant-driven and will tend towardsthe consolidation of multiple offices into one building orcorporate campus.
• The degree of increase in the vacancy rate will depend uponthe continued severity of the economy as well as the completionof new tenant-driven construction.
• Office tenants will have the upper hand in lease negotiationsas owners will struggle to maintain occupancy in their buildings.
• Creative financial incentives will be deciding factors for companiesrelocating to and within the Cincinnati market.
• Sale bargains are expected to be found in the Cincinnati officeinvestment market for cash-ready investors.
INDUSTRIAL
• The vacancy rate increased from 6.6% at the end of 2007 to 8.1%at the end of 2008. Vacancy rose mostly as a result of new spacedelivered to the market.
• A total of over 5.7 million SF of new industrial product was deliveredto the Cincinnati market in 2008. New construction exceeded theprevious year’s for the fifth consecutive year and was the highestamount since 2000.
• Net absorption measured approximately 1.2 million SF.• A total of 3.7 million SF of bulk product was added in 2008 andalmost two-thirds of the space remained vacant at the end of 2008.
• The completion of the 657,600 SF distribution center for Home Depotwas the kickoff project for the 429-acre Corridor 75 Park in Monroe,the next large industrial development hub for Northern Cincinnati.
Industrial Outlook• The outlook for Cincinnati’s industrial market will depend onthe depth and length of the recession. However, the diversityof businesses in the region will protect it from the extremesof the fallout from the national economy.
• The market is expected to see little or no speculative constructionto begin in 2009.
• Landlords will be negotiating aggressively low deals to retain buildingoccupancy and backfill space.
• The infrastructure repair program of the new administration will havea positive impact on the attractiveness of the Cincinnati market as adistribution hub.
• Incentives from the state and local governments will continueto be a major factor in site location.

CLEVELAND, OHCO L L I E R S I N T E RNAT I ONA L l U . S . R E A L E S TAT E R E V I EW 2 0 0 9
DOWNTOWN OFFICE
Inventory New Absorption Vacancy ClassA Cap Rate(SF) Supply (SF) (SF) Rate (%) Rent ($PSF) (%)
1999 29,186,000 26,000 (134,000) 15.3 23.00 –2000 29,223,000 37,000 352,000 13.9 22.50 9.502001 29,223,000 0 (429,000) 14.0 21.20 10.002002 29,928,000 705,000 (1,285,000) 22.1 20.00 10.252003 29,943,000 15,000 (575,000) 23.5 20.50 13.852004 29,943,000 0 (79,000) 23.9 20.50 12.102005 29,943,000 0 45,000 21.2 20.90 10.252006 29,943,000 0 784,000 18.7 20.30 10.252007 29,943,000 0 107,000 17.0 20.00 9.002008 29,943,000 0 447,000 16.4 19.90 10.00
SUBURBAN OFFICE
Inventory New Absorption Vacancy ClassA Cap Rate(SF) Supply (SF) (SF) Rate (%) Rent ($PSF) (%)
1999 66,078,000 578,000 218,000 14.9 22.50 –2000 66,946,000 868,000 771,000 15.4 23.30 10.502001 67,372,000 426,000 173,000 17.1 22.00 10.502002 67,569,000 197,000 348,000 15.4 21.60 10.502003 67,679,000 110,000 (61,000) 18.3 20.90 10.502004 67,770,000 91,000 311,000 16.5 19.10 10.602005 67,886,000 116,000 107,000 11.6 21.00 10.602006 68,165,000 279,000 (381,000) 12.8 21.70 8.752007 68,779,000 614,000 391,000 11.2 20.60 8.502008 68,995,000 216,000 859,000 10.3 21.10 9.50
INDUSTRIAL
Inventory New Absorption Vacancy Warehouse Land Cap Rate(SF) Supply (SF) (SF) Rate (%) Rent ($PSF) ($PSF) (%)
1999 391,687,000 3,300,000 3,724,000 7.4 5.50 – –2000 393,586,000 1,899,000 (3,088,000) 8.9 5.50 – –2001 395,534,000 1,948,000 (7,162,000) 9.4 4.50 1.72 11.002002 397,275,000 1,741,000 (1,120,000) 9.6 3.50 1.95 9.502003 398,292,000 1,017,000 (5,682,000) 10.3 4.10 5.50 9.002004 400,676,000 2,384,000 2,372,000 10.1 3.60 1.14 10.802005 401,490,000 814,000 3,928,000 9.2 3.55 1.25 9.502006 401,736,000 246,000 (2,071,000) 9.1 3.74 1.37 8.502007 402,551,000 815,000 3,845,000 8.3 3.50 1.32 9.002008 403,430,000 879,000 2,689,000 7.4 3.00 1.32 10.25
METROPOLITAN INDICATORS – 2009
• Gross Metro Product Percent Change: 0.3
• Change in Total Employment (000): (16.6)Percent Change: (1.6)
• Unemployment Rate: 8.9
• Population (000): 2,080.4
Source: Moody’s Economy.com
14 CONTACT:Thomas Gustafson • [email protected] l RESEARCH:Asmaae Benmerzouga • [email protected]
OFFICE
• Office investment sales included Hub North Properties’ acquisition ofNorth Point Tower for $114 million and Florida-based Optima One’sacquisitions of One Cleveland Center for $86 million and 55 PublicSquare for $34 million.
• The newly completed Euclid Corridor project, a $220 millioninvestment in the seven-mile rapid transit “Healthline” connectingPublic Square to University Circle, is expected to generate $4 billionin investments along Euclid Ave.
• Huntington Bank leased 100,000 SF and will move its headquartersto the former BP Tower at 200 Public Square, a 20-year leaseagreement that included Huntington’s naming rights on thebuilding – an addition to the Cleveland skyline.
• The highest space in downtown Cleveland was occupied by the lawfirm Amin, Turocy & Calvin LLP, who leased for 14,000 SF on thetop floor of the 57-story Key Tower.
Office Outlook• The renovation of 668 Euclid, also known as the Atrium Office Plaza,is underway and slated for opening in 2010. The eight-story historicurban rehab will feature 65,000 square feet of mixed-used commercialspace and 236 luxury apartments. With anchor tenant WyseAdvertising slated to move in August 2009, the new 668 Euclid willbe a marquee downtown destination, and a complement to the newEuclid Corridor rapid transit line.
• The need for modern space in Cleveland’s CBD, coupled withseveral anchor tenants nearing lease expirations, still point topossible construction of a new downtown office tower.
INDUSTRIAL
• Sale transactions included Virginia-based Gladstone Commercial’sacquisition of 273,000 SF in a sale-leaseback deal for $15.3 million;STAG Capital’s purchase of 154,500 SF for $11 million; and FirstIndustrial Realty Trust’s acquisition of 257,000 SF of warehousefor $9.3 million.
• Six separate construction projects, mostly built on a speculative basis,added nearly 1.2 million SF of modern warehouse space mostly in theeast suburbs and Summit County.
• Geis Companies and Weston Real Estate collaborated to buy 200acres in Glenwillow, which resulted in the delivery of the DiamondBusiness Center, a 400,000 SF distribution center in Northeast Ohio’sfastest growing industrial market.
Industrial Outlook• Goodyear Tire and Rubber Co. will remain at its Akron Headquartersin the Northeast Ohio region. The California-based developerIndustrial Realty Group will renovate and expand the site into amodern, large-scale commercial complex.
• Backed by a state-awarded Job Ready Sites grant, Ray Fogg BuildingMethods is slated to redevelop the Euclid Industrial Park in Euclid,OH this summer. CSX and Norfolk & Southern railroads willserve the 80-acre former PMX plant. The park has potential toaccommodate 1.3 million SF of new construction.
• Approximately 2% of the market’s manufacturing, warehouse, anddistribution facilities greater than 200,000 SF is currently availablefor sale.
• Aclara RF Systems will be moving from Beachwood into an111,000-SF Solon building and will add 250 jobs with the assistanceof a job-creation grant.
COLUMBIA, SC
DOWNTOWN OFFICE
Inventory New Absorption Vacancy ClassA Cap Rate(SF) Supply (SF) (SF) Rate (%) Rent ($PSF) (%)
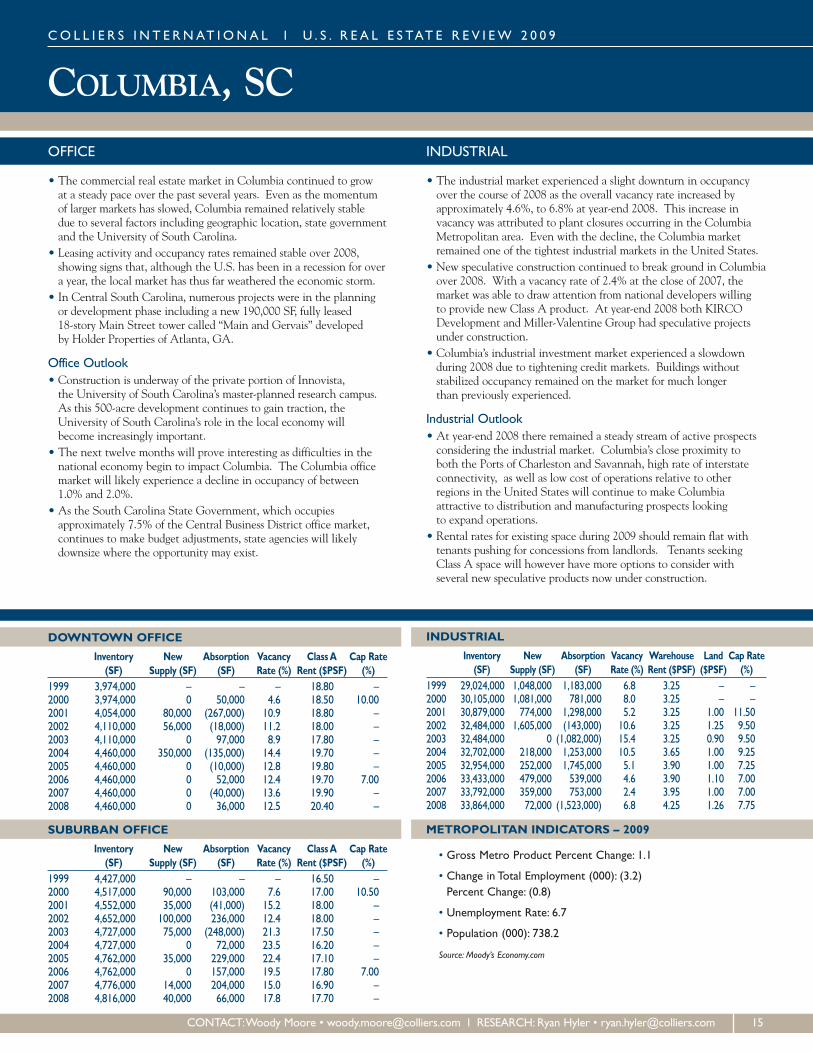
1999 3,974,000 – – – 18.80 –2000 3,974,000 0 50,000 4.6 18.50 10.002001 4,054,000 80,000 (267,000) 10.9 18.80 –2002 4,110,000 56,000 (18,000) 11.2 18.00 –2003 4,110,000 0 97,000 8.9 17.80 –2004 4,460,000 350,000 (135,000) 14.4 19.70 –2005 4,460,000 0 (10,000) 12.8 19.80 –2006 4,460,000 0 52,000 12.4 19.70 7.002007 4,460,000 0 (40,000) 13.6 19.90 –2008 4,460,000 0 36,000 12.5 20.40 –
SUBURBAN OFFICE
Inventory New Absorption Vacancy ClassA Cap Rate(SF) Supply (SF) (SF) Rate (%) Rent ($PSF) (%)
1999 4,427,000 – – – 16.50 –2000 4,517,000 90,000 103,000 7.6 17.00 10.502001 4,552,000 35,000 (41,000) 15.2 18.00 –2002 4,652,000 100,000 236,000 12.4 18.00 –2003 4,727,000 75,000 (248,000) 21.3 17.50 –2004 4,727,000 0 72,000 23.5 16.20 –2005 4,762,000 35,000 229,000 22.4 17.10 –2006 4,762,000 0 157,000 19.5 17.80 7.002007 4,776,000 14,000 204,000 15.0 16.90 –2008 4,816,000 40,000 66,000 17.8 17.70 –
INDUSTRIAL
Inventory New Absorption Vacancy Warehouse Land Cap Rate(SF) Supply (SF) (SF) Rate (%) Rent ($PSF) ($PSF) (%)
1999 29,024,000 1,048,000 1,183,000 6.8 3.25 – –2000 30,105,000 1,081,000 781,000 8.0 3.25 – –2001 30,879,000 774,000 1,298,000 5.2 3.25 1.00 11.502002 32,484,000 1,605,000 (143,000) 10.6 3.25 1.25 9.502003 32,484,000 0 (1,082,000) 15.4 3.25 0.90 9.502004 32,702,000 218,000 1,253,000 10.5 3.65 1.00 9.252005 32,954,000 252,000 1,745,000 5.1 3.90 1.00 7.252006 33,433,000 479,000 539,000 4.6 3.90 1.10 7.002007 33,792,000 359,000 753,000 2.4 3.95 1.00 7.002008 33,864,000 72,000 (1,523,000) 6.8 4.25 1.26 7.75
METROPOLITAN INDICATORS – 2009
• Gross Metro Product Percent Change: 1.1
• Change in Total Employment (000): (3.2)Percent Change: (0.8)
• Unemployment Rate: 6.7
• Population (000): 738.2
Source: Moody’s Economy.com
CO L L I E R S I N T E RNAT I ONA L l U . S . R E A L E S TAT E R E V I EW 2 0 0 9
CONTACT:Woody Moore • [email protected] l RESEARCH: Ryan Hyler • [email protected] 15
OFFICE
• The commercial real estate market in Columbia continued to growat a steady pace over the past several years. Even as the momentumof larger markets has slowed, Columbia remained relatively stabledue to several factors including geographic location, state governmentand the University of South Carolina.
• Leasing activity and occupancy rates remained stable over 2008,showing signs that, although the U.S. has been in a recession for overa year, the local market has thus far weathered the economic storm.
• In Central South Carolina, numerous projects were in the planningor development phase including a new 190,000 SF, fully leased18-story Main Street tower called “Main and Gervais” developedby Holder Properties of Atlanta, GA.
Office Outlook• Construction is underway of the private portion of Innovista,the University of South Carolina’s master-planned research campus.As this 500-acre development continues to gain traction, theUniversity of South Carolina’s role in the local economy willbecome increasingly important.
• The next twelve months will prove interesting as difficulties in thenational economy begin to impact Columbia. The Columbia officemarket will likely experience a decline in occupancy of between1.0% and 2.0%.
• As the South Carolina State Government, which occupiesapproximately 7.5% of the Central Business District office market,continues to make budget adjustments, state agencies will likelydownsize where the opportunity may exist.
INDUSTRIAL
• The industrial market experienced a slight downturn in occupancyover the course of 2008 as the overall vacancy rate increased byapproximately 4.6%, to 6.8% at year-end 2008. This increase invacancy was attributed to plant closures occurring in the ColumbiaMetropolitan area. Even with the decline, the Columbia marketremained one of the tightest industrial markets in the United States.
• New speculative construction continued to break ground in Columbiaover 2008. With a vacancy rate of 2.4% at the close of 2007, themarket was able to draw attention from national developers willingto provide new Class A product. At year-end 2008 both KIRCODevelopment and Miller-Valentine Group had speculative projectsunder construction.
• Columbia’s industrial investment market experienced a slowdownduring 2008 due to tightening credit markets. Buildings withoutstabilized occupancy remained on the market for much longerthan previously experienced.
Industrial Outlook• At year-end 2008 there remained a steady stream of active prospectsconsidering the industrial market. Columbia’s close proximity toboth the Ports of Charleston and Savannah, high rate of interstateconnectivity, as well as low cost of operations relative to otherregions in the United States will continue to make Columbiaattractive to distribution and manufacturing prospects lookingto expand operations.
• Rental rates for existing space during 2009 should remain flat withtenants pushing for concessions from landlords. Tenants seekingClass A space will however have more options to consider withseveral new speculative products now under construction.
COLUMBUS, OHCO L L I E R S I N T E RNAT I ONA L l U . S . R E A L E S TAT E R E V I EW 2 0 0 9
DOWNTOWN OFFICE
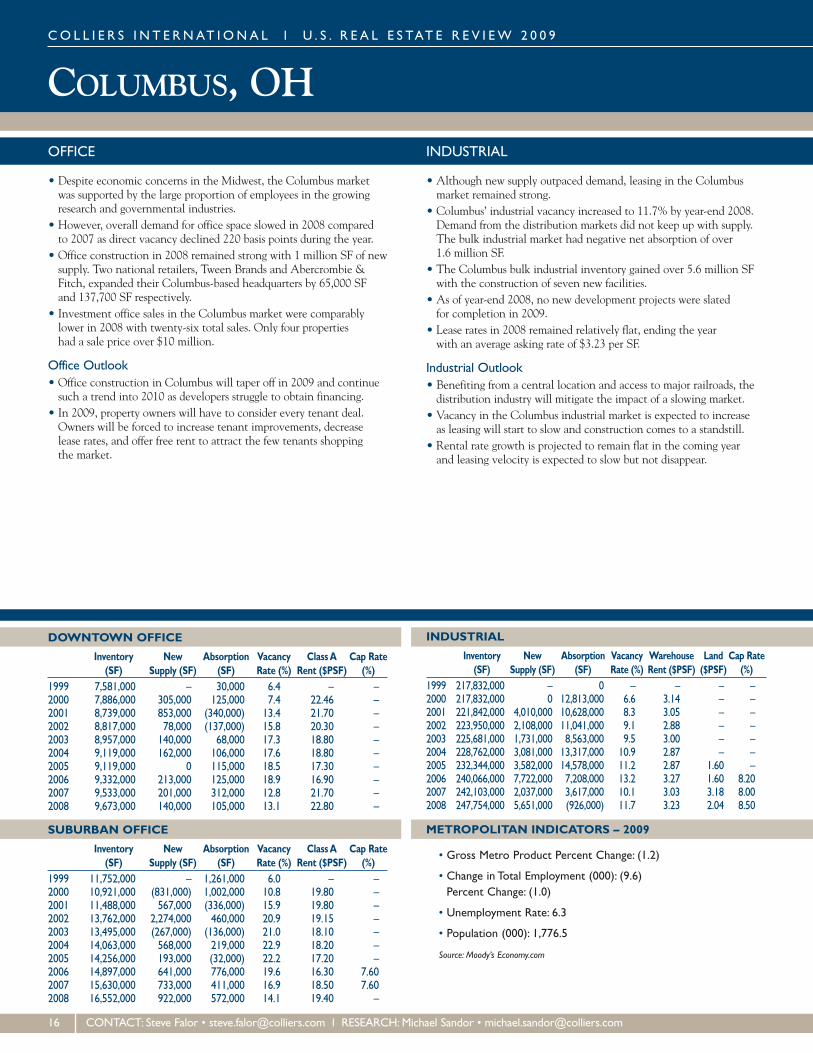
Inventory New Absorption Vacancy ClassA Cap Rate(SF) Supply (SF) (SF) Rate (%) Rent ($PSF) (%)
1999 7,581,000 – 30,000 6.4 – –2000 7,886,000 305,000 125,000 7.4 22.46 –2001 8,739,000 853,000 (340,000) 13.4 21.70 –2002 8,817,000 78,000 (137,000) 15.8 20.30 –2003 8,957,000 140,000 68,000 17.3 18.80 –2004 9,119,000 162,000 106,000 17.6 18.80 –2005 9,119,000 0 115,000 18.5 17.30 –2006 9,332,000 213,000 125,000 18.9 16.90 –2007 9,533,000 201,000 312,000 12.8 21.70 –2008 9,673,000 140,000 105,000 13.1 22.80 –
SUBURBAN OFFICE
Inventory New Absorption Vacancy ClassA Cap Rate(SF) Supply (SF) (SF) Rate (%) Rent ($PSF) (%)
1999 11,752,000 – 1,261,000 6.0 – –2000 10,921,000 (831,000) 1,002,000 10.8 19.80 –2001 11,488,000 567,000 (336,000) 15.9 19.80 –2002 13,762,000 2,274,000 460,000 20.9 19.15 –2003 13,495,000 (267,000) (136,000) 21.0 18.10 –2004 14,063,000 568,000 219,000 22.9 18.20 –2005 14,256,000 193,000 (32,000) 22.2 17.20 –2006 14,897,000 641,000 776,000 19.6 16.30 7.602007 15,630,000 733,000 411,000 16.9 18.50 7.602008 16,552,000 922,000 572,000 14.1 19.40 –
INDUSTRIAL
Inventory New Absorption Vacancy Warehouse Land Cap Rate(SF) Supply (SF) (SF) Rate (%) Rent ($PSF) ($PSF) (%)
1999 217,832,000 – 0 – – – –2000 217,832,000 0 12,813,000 6.6 3.14 – –2001 221,842,000 4,010,000 10,628,000 8.3 3.05 – –2002 223,950,000 2,108,000 11,041,000 9.1 2.88 – –2003 225,681,000 1,731,000 8,563,000 9.5 3.00 – –2004 228,762,000 3,081,000 13,317,000 10.9 2.87 – –2005 232,344,000 3,582,000 14,578,000 11.2 2.87 1.60 –2006 240,066,000 7,722,000 7,208,000 13.2 3.27 1.60 8.202007 242,103,000 2,037,000 3,617,000 10.1 3.03 3.18 8.002008 247,754,000 5,651,000 (926,000) 11.7 3.23 2.04 8.50
METROPOLITAN INDICATORS – 2009
• Gross Metro Product Percent Change: (1.2)
• Change in Total Employment (000): (9.6)Percent Change: (1.0)
• Unemployment Rate: 6.3
• Population (000): 1,776.5
Source: Moody’s Economy.com
16 CONTACT: Steve Falor • [email protected] l RESEARCH:Michael Sandor • [email protected]
OFFICE
• Despite economic concerns in the Midwest, the Columbus marketwas supported by the large proportion of employees in the growingresearch and governmental industries.
• However, overall demand for office space slowed in 2008 comparedto 2007 as direct vacancy declined 220 basis points during the year.
• Office construction in 2008 remained strong with 1 million SF of newsupply. Two national retailers, Tween Brands and Abercrombie &Fitch, expanded their Columbus-based headquarters by 65,000 SFand 137,700 SF respectively.
• Investment office sales in the Columbus market were comparablylower in 2008 with twenty-six total sales. Only four propertieshad a sale price over $10 million.
Office Outlook• Office construction in Columbus will taper off in 2009 and continuesuch a trend into 2010 as developers struggle to obtain financing.
• In 2009, property owners will have to consider every tenant deal.Owners will be forced to increase tenant improvements, decreaselease rates, and offer free rent to attract the few tenants shoppingthe market.
INDUSTRIAL
• Although new supply outpaced demand, leasing in the Columbusmarket remained strong.
• Columbus’ industrial vacancy increased to 11.7% by year-end 2008.Demand from the distribution markets did not keep up with supply.The bulk industrial market had negative net absorption of over1.6 million SF.
• The Columbus bulk industrial inventory gained over 5.6 million SFwith the construction of seven new facilities.
• As of year-end 2008, no new development projects were slatedfor completion in 2009.
• Lease rates in 2008 remained relatively flat, ending the yearwith an average asking rate of $3.23 per SF.
Industrial Outlook• Benefiting from a central location and access to major railroads, thedistribution industry will mitigate the impact of a slowing market.
• Vacancy in the Columbus industrial market is expected to increaseas leasing will start to slow and construction comes to a standstill.
• Rental rate growth is projected to remain flat in the coming yearand leasing velocity is expected to slow but not disappear.
DALLAS/FT. WORTH, TX
DOWNTOWN OFFICE
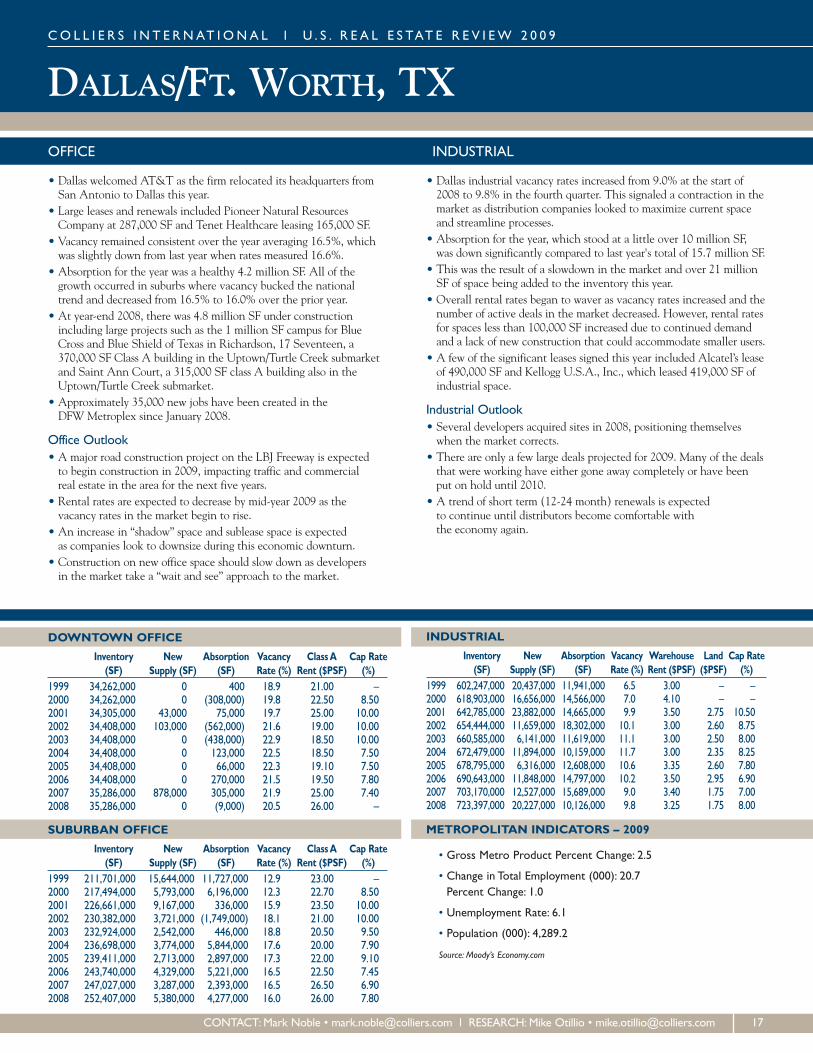
Inventory New Absorption Vacancy ClassA Cap Rate(SF) Supply (SF) (SF) Rate (%) Rent ($PSF) (%)
1999 34,262,000 0 400 18.9 21.00 –2000 34,262,000 0 (308,000) 19.8 22.50 8.502001 34,305,000 43,000 75,000 19.7 25.00 10.002002 34,408,000 103,000 (562,000) 21.6 19.00 10.002003 34,408,000 0 (438,000) 22.9 18.50 10.002004 34,408,000 0 123,000 22.5 18.50 7.502005 34,408,000 0 66,000 22.3 19.10 7.502006 34,408,000 0 270,000 21.5 19.50 7.802007 35,286,000 878,000 305,000 21.9 25.00 7.402008 35,286,000 0 (9,000) 20.5 26.00 –
SUBURBAN OFFICE
Inventory New Absorption Vacancy ClassA Cap Rate(SF) Supply (SF) (SF) Rate (%) Rent ($PSF) (%)
1999 211,701,000 15,644,000 11,727,000 12.9 23.00 –2000 217,494,000 5,793,000 6,196,000 12.3 22.70 8.502001 226,661,000 9,167,000 336,000 15.9 23.50 10.002002 230,382,000 3,721,000 (1,749,000) 18.1 21.00 10.002003 232,924,000 2,542,000 446,000 18.8 20.50 9.502004 236,698,000 3,774,000 5,844,000 17.6 20.00 7.902005 239,411,000 2,713,000 2,897,000 17.3 22.00 9.102006 243,740,000 4,329,000 5,221,000 16.5 22.50 7.452007 247,027,000 3,287,000 2,393,000 16.5 26.50 6.902008 252,407,000 5,380,000 4,277,000 16.0 26.00 7.80
INDUSTRIAL
Inventory New Absorption Vacancy Warehouse Land Cap Rate(SF) Supply (SF) (SF) Rate (%) Rent ($PSF) ($PSF) (%)
1999 602,247,000 20,437,000 11,941,000 6.5 3.00 – –2000 618,903,000 16,656,000 14,566,000 7.0 4.10 – –2001 642,785,000 23,882,000 14,665,000 9.9 3.50 2.75 10.502002 654,444,000 11,659,000 18,302,000 10.1 3.00 2.60 8.752003 660,585,000 6,141,000 11,619,000 11.1 3.00 2.50 8.002004 672,479,000 11,894,000 10,159,000 11.7 3.00 2.35 8.252005 678,795,000 6,316,000 12,608,000 10.6 3.35 2.60 7.802006 690,643,000 11,848,000 14,797,000 10.2 3.50 2.95 6.902007 703,170,000 12,527,000 15,689,000 9.0 3.40 1.75 7.002008 723,397,000 20,227,000 10,126,000 9.8 3.25 1.75 8.00
METROPOLITAN INDICATORS – 2009
• Gross Metro Product Percent Change: 2.5
• Change in Total Employment (000): 20.7Percent Change: 1.0
• Unemployment Rate: 6.1
• Population (000): 4,289.2
Source: Moody’s Economy.com
CO L L I E R S I N T E RNAT I ONA L l U . S . R E A L E S TAT E R E V I EW 2 0 0 9
CONTACT:Mark Noble • [email protected] l RESEARCH:Mike Otillio • [email protected] 17
OFFICE
• Dallas welcomed AT&T as the firm relocated its headquarters fromSan Antonio to Dallas this year.
• Large leases and renewals included Pioneer Natural ResourcesCompany at 287,000 SF and Tenet Healthcare leasing 165,000 SF.
• Vacancy remained consistent over the year averaging 16.5%, whichwas slightly down from last year when rates measured 16.6%.
• Absorption for the year was a healthy 4.2 million SF. All of thegrowth occurred in suburbs where vacancy bucked the nationaltrend and decreased from 16.5% to 16.0% over the prior year.
• At year-end 2008, there was 4.8 million SF under constructionincluding large projects such as the 1 million SF campus for BlueCross and Blue Shield of Texas in Richardson, 17 Seventeen, a370,000 SF Class A building in the Uptown/Turtle Creek submarketand Saint Ann Court, a 315,000 SF class A building also in theUptown/Turtle Creek submarket.
• Approximately 35,000 new jobs have been created in theDFWMetroplex since January 2008.
Office Outlook• A major road construction project on the LBJ Freeway is expectedto begin construction in 2009, impacting traffic and commercialreal estate in the area for the next five years.
• Rental rates are expected to decrease by mid-year 2009 as thevacancy rates in the market begin to rise.
• An increase in “shadow” space and sublease space is expectedas companies look to downsize during this economic downturn.
• Construction on new office space should slow down as developersin the market take a “wait and see” approach to the market.
INDUSTRIAL
• Dallas industrial vacancy rates increased from 9.0% at the start of2008 to 9.8% in the fourth quarter. This signaled a contraction in themarket as distribution companies looked to maximize current spaceand streamline processes.
• Absorption for the year, which stood at a little over 10 million SF,was down significantly compared to last year's total of 15.7 million SF.
• This was the result of a slowdown in the market and over 21 millionSF of space being added to the inventory this year.
• Overall rental rates began to waver as vacancy rates increased and thenumber of active deals in the market decreased. However, rental ratesfor spaces less than 100,000 SF increased due to continued demandand a lack of new construction that could accommodate smaller users.
• A few of the significant leases signed this year included Alcatel’s leaseof 490,000 SF and Kellogg U.S.A., Inc., which leased 419,000 SF ofindustrial space.
Industrial Outlook• Several developers acquired sites in 2008, positioning themselveswhen the market corrects.
• There are only a few large deals projected for 2009. Many of the dealsthat were working have either gone away completely or have beenput on hold until 2010.
• A trend of short term (12-24 month) renewals is expectedto continue until distributors become comfortable withthe economy again.
DENVER, COCO L L I E R S I N T E RNAT I ONA L l U . S . R E A L E S TAT E R E V I EW 2 0 0 9
DOWNTOWN OFFICE
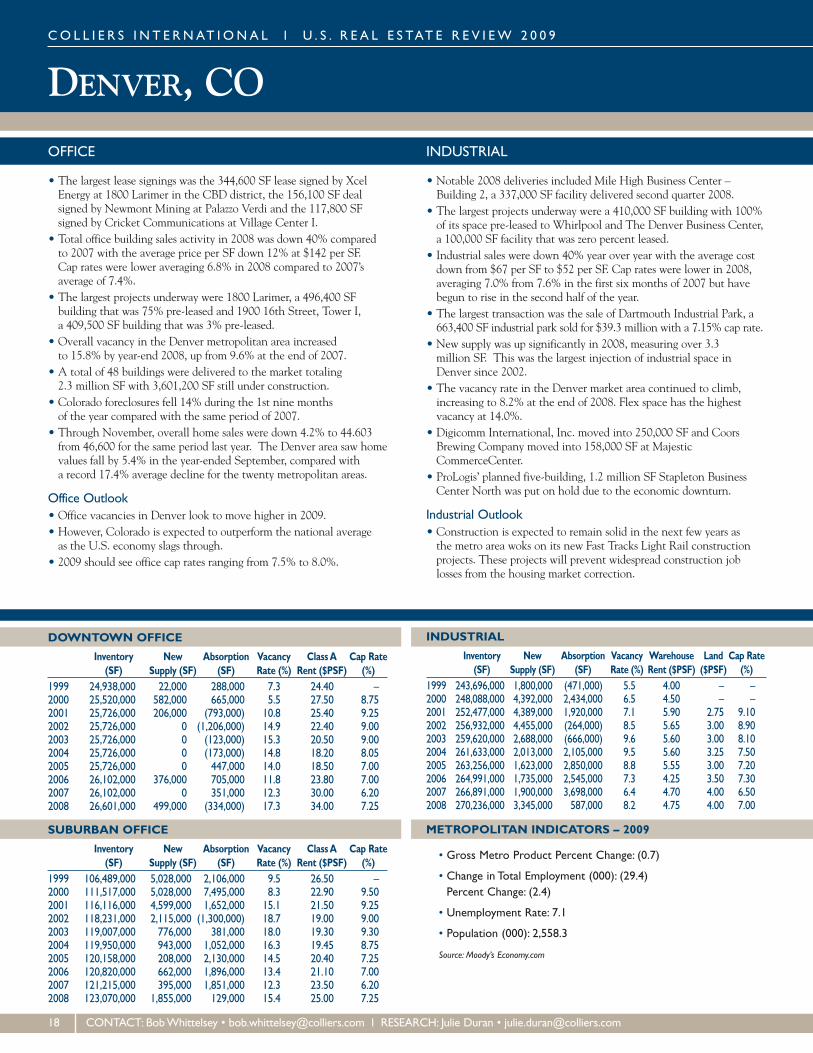
Inventory New Absorption Vacancy ClassA Cap Rate(SF) Supply (SF) (SF) Rate (%) Rent ($PSF) (%)
1999 24,938,000 22,000 288,000 7.3 24.40 –2000 25,520,000 582,000 665,000 5.5 27.50 8.752001 25,726,000 206,000 (793,000) 10.8 25.40 9.252002 25,726,000 0 (1,206,000) 14.9 22.40 9.002003 25,726,000 0 (123,000) 15.3 20.50 9.002004 25,726,000 0 (173,000) 14.8 18.20 8.052005 25,726,000 0 447,000 14.0 18.50 7.002006 26,102,000 376,000 705,000 11.8 23.80 7.002007 26,102,000 0 351,000 12.3 30.00 6.202008 26,601,000 499,000 (334,000) 17.3 34.00 7.25
SUBURBAN OFFICE
Inventory New Absorption Vacancy ClassA Cap Rate(SF) Supply (SF) (SF) Rate (%) Rent ($PSF) (%)
1999 106,489,000 5,028,000 2,106,000 9.5 26.50 –2000 111,517,000 5,028,000 7,495,000 8.3 22.90 9.502001 116,116,000 4,599,000 1,652,000 15.1 21.50 9.252002 118,231,000 2,115,000 (1,300,000) 18.7 19.00 9.002003 119,007,000 776,000 381,000 18.0 19.30 9.302004 119,950,000 943,000 1,052,000 16.3 19.45 8.752005 120,158,000 208,000 2,130,000 14.5 20.40 7.252006 120,820,000 662,000 1,896,000 13.4 21.10 7.002007 121,215,000 395,000 1,851,000 12.3 23.50 6.202008 123,070,000 1,855,000 129,000 15.4 25.00 7.25
INDUSTRIAL
Inventory New Absorption Vacancy Warehouse Land Cap Rate(SF) Supply (SF) (SF) Rate (%) Rent ($PSF) ($PSF) (%)
1999 243,696,000 1,800,000 (471,000) 5.5 4.00 – –2000 248,088,000 4,392,000 2,434,000 6.5 4.50 – –2001 252,477,000 4,389,000 1,920,000 7.1 5.90 2.75 9.102002 256,932,000 4,455,000 (264,000) 8.5 5.65 3.00 8.902003 259,620,000 2,688,000 (666,000) 9.6 5.60 3.00 8.102004 261,633,000 2,013,000 2,105,000 9.5 5.60 3.25 7.502005 263,256,000 1,623,000 2,850,000 8.8 5.55 3.00 7.202006 264,991,000 1,735,000 2,545,000 7.3 4.25 3.50 7.302007 266,891,000 1,900,000 3,698,000 6.4 4.70 4.00 6.502008 270,236,000 3,345,000 587,000 8.2 4.75 4.00 7.00
METROPOLITAN INDICATORS – 2009
• Gross Metro Product Percent Change: (0.7)
• Change in Total Employment (000): (29.4)Percent Change: (2.4)
• Unemployment Rate: 7.1
• Population (000): 2,558.3
Source: Moody’s Economy.com
18 CONTACT: BobWhittelsey • [email protected] l RESEARCH: Julie Duran • [email protected]
OFFICE
• The largest lease signings was the 344,600 SF lease signed by XcelEnergy at 1800 Larimer in the CBD district, the 156,100 SF dealsigned by Newmont Mining at Palazzo Verdi and the 117,800 SFsigned by Cricket Communications at Village Center I.
• Total office building sales activity in 2008 was down 40% comparedto 2007 with the average price per SF down 12% at $142 per SF.Cap rates were lower averaging 6.8% in 2008 compared to 2007’saverage of 7.4%.
• The largest projects underway were 1800 Larimer, a 496,400 SFbuilding that was 75% pre-leased and 1900 16th Street, Tower I,a 409,500 SF building that was 3% pre-leased.
• Overall vacancy in the Denver metropolitan area increasedto 15.8% by year-end 2008, up from 9.6% at the end of 2007.
• A total of 48 buildings were delivered to the market totaling2.3 million SF with 3,601,200 SF still under construction.
• Colorado foreclosures fell 14% during the 1st nine monthsof the year compared with the same period of 2007.
• Through November, overall home sales were down 4.2% to 44.603from 46,600 for the same period last year. The Denver area saw homevalues fall by 5.4% in the year-ended September, compared witha record 17.4% average decline for the twenty metropolitan areas.
Office Outlook• Office vacancies in Denver look to move higher in 2009.• However, Colorado is expected to outperform the national averageas the U.S. economy slags through.
• 2009 should see office cap rates ranging from 7.5% to 8.0%.
INDUSTRIAL
• Notable 2008 deliveries included Mile High Business Center –Building 2, a 337,000 SF facility delivered second quarter 2008.
• The largest projects underway were a 410,000 SF building with 100%of its space pre-leased to Whirlpool and The Denver Business Center,a 100,000 SF facility that was zero percent leased.
• Industrial sales were down 40% year over year with the average costdown from $67 per SF to $52 per SF. Cap rates were lower in 2008,averaging 7.0% from 7.6% in the first six months of 2007 but havebegun to rise in the second half of the year.
• The largest transaction was the sale of Dartmouth Industrial Park, a663,400 SF industrial park sold for $39.3 million with a 7.15% cap rate.
• New supply was up significantly in 2008, measuring over 3.3million SF. This was the largest injection of industrial space inDenver since 2002.
• The vacancy rate in the Denver market area continued to climb,increasing to 8.2% at the end of 2008. Flex space has the highestvacancy at 14.0%.
• Digicomm International, Inc. moved into 250,000 SF and CoorsBrewing Company moved into 158,000 SF at MajesticCommerceCenter.
• ProLogis’ planned five-building, 1.2 million SF Stapleton BusinessCenter North was put on hold due to the economic downturn.
Industrial Outlook• Construction is expected to remain solid in the next few years asthe metro area woks on its new Fast Tracks Light Rail constructionprojects. These projects will prevent widespread construction joblosses from the housing market correction.
DETROIT, MI
DOWNTOWN OFFICE
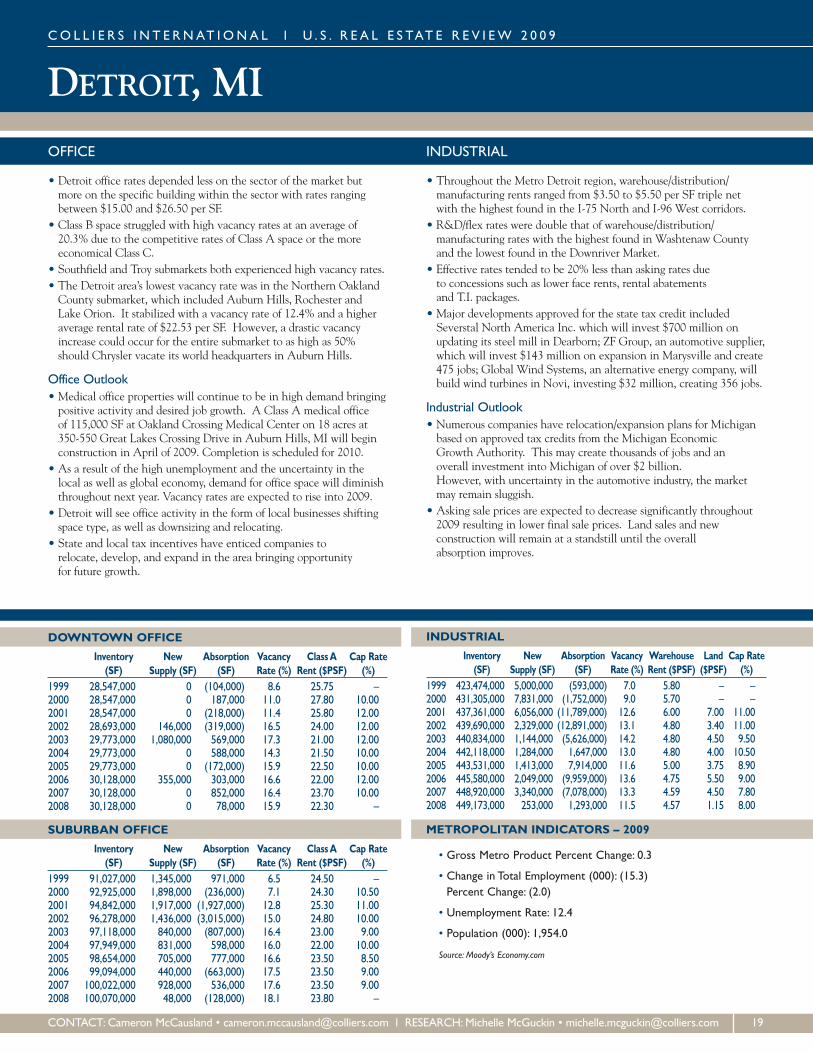
Inventory New Absorption Vacancy ClassA Cap Rate(SF) Supply (SF) (SF) Rate (%) Rent ($PSF) (%)
1999 28,547,000 0 (104,000) 8.6 25.75 –2000 28,547,000 0 187,000 11.0 27.80 10.002001 28,547,000 0 (218,000) 11.4 25.80 12.002002 28,693,000 146,000 (319,000) 16.5 24.00 12.002003 29,773,000 1,080,000 569,000 17.3 21.00 12.002004 29,773,000 0 588,000 14.3 21.50 10.002005 29,773,000 0 (172,000) 15.9 22.50 10.002006 30,128,000 355,000 303,000 16.6 22.00 12.002007 30,128,000 0 852,000 16.4 23.70 10.002008 30,128,000 0 78,000 15.9 22.30 –
SUBURBAN OFFICE
Inventory New Absorption Vacancy ClassA Cap Rate(SF) Supply (SF) (SF) Rate (%) Rent ($PSF) (%)
1999 91,027,000 1,345,000 971,000 6.5 24.50 –2000 92,925,000 1,898,000 (236,000) 7.1 24.30 10.502001 94,842,000 1,917,000 (1,927,000) 12.8 25.30 11.002002 96,278,000 1,436,000 (3,015,000) 15.0 24.80 10.002003 97,118,000 840,000 (807,000) 16.4 23.00 9.002004 97,949,000 831,000 598,000 16.0 22.00 10.002005 98,654,000 705,000 777,000 16.6 23.50 8.502006 99,094,000 440,000 (663,000) 17.5 23.50 9.002007 100,022,000 928,000 536,000 17.6 23.50 9.002008 100,070,000 48,000 (128,000) 18.1 23.80 –
INDUSTRIAL
Inventory New Absorption Vacancy Warehouse Land Cap Rate(SF) Supply (SF) (SF) Rate (%) Rent ($PSF) ($PSF) (%)
1999 423,474,000 5,000,000 (593,000) 7.0 5.80 – –2000 431,305,000 7,831,000 (1,752,000) 9.0 5.70 – –2001 437,361,000 6,056,000 (11,789,000) 12.6 6.00 7.00 11.002002 439,690,000 2,329,000 (12,891,000) 13.1 4.80 3.40 11.002003 440,834,000 1,144,000 (5,626,000) 14.2 4.80 4.50 9.502004 442,118,000 1,284,000 1,647,000 13.0 4.80 4.00 10.502005 443,531,000 1,413,000 7,914,000 11.6 5.00 3.75 8.902006 445,580,000 2,049,000 (9,959,000) 13.6 4.75 5.50 9.002007 448,920,000 3,340,000 (7,078,000) 13.3 4.59 4.50 7.802008 449,173,000 253,000 1,293,000 11.5 4.57 1.15 8.00
METROPOLITAN INDICATORS – 2009
• Gross Metro Product Percent Change: 0.3
• Change in Total Employment (000): (15.3)Percent Change: (2.0)
• Unemployment Rate: 12.4
• Population (000): 1,954.0
Source: Moody’s Economy.com
CO L L I E R S I N T E RNAT I ONA L l U . S . R E A L E S TAT E R E V I EW 2 0 0 9
CONTACT: Cameron McCausland • [email protected] l RESEARCH:Michelle McGuckin • [email protected] 19
OFFICE
• Detroit office rates depended less on the sector of the market butmore on the specific building within the sector with rates rangingbetween $15.00 and $26.50 per SF.
• Class B space struggled with high vacancy rates at an average of20.3% due to the competitive rates of Class A space or the moreeconomical Class C.
• Southfield and Troy submarkets both experienced high vacancy rates.• The Detroit area’s lowest vacancy rate was in the Northern OaklandCounty submarket, which included Auburn Hills, Rochester andLake Orion. It stabilized with a vacancy rate of 12.4% and a higheraverage rental rate of $22.53 per SF. However, a drastic vacancyincrease could occur for the entire submarket to as high as 50%should Chrysler vacate its world headquarters in Auburn Hills.
Office Outlook• Medical office properties will continue to be in high demand bringingpositive activity and desired job growth. A Class A medical officeof 115,000 SF at Oakland Crossing Medical Center on 18 acres at350-550 Great Lakes Crossing Drive in Auburn Hills, MI will beginconstruction in April of 2009. Completion is scheduled for 2010.
• As a result of the high unemployment and the uncertainty in thelocal as well as global economy, demand for office space will diminishthroughout next year. Vacancy rates are expected to rise into 2009.
• Detroit will see office activity in the form of local businesses shiftingspace type, as well as downsizing and relocating.
• State and local tax incentives have enticed companies torelocate, develop, and expand in the area bringing opportunityfor future growth.
INDUSTRIAL
• Throughout the Metro Detroit region, warehouse/distribution/manufacturing rents ranged from $3.50 to $5.50 per SF triple netwith the highest found in the I-75 North and I-96 West corridors.
• R&D/flex rates were double that of warehouse/distribution/manufacturing rates with the highest found in Washtenaw Countyand the lowest found in the Downriver Market.
• Effective rates tended to be 20% less than asking rates dueto concessions such as lower face rents, rental abatementsand T.I. packages.
• Major developments approved for the state tax credit includedSeverstal North America Inc. which will invest $700 million onupdating its steel mill in Dearborn; ZF Group, an automotive supplier,which will invest $143 million on expansion in Marysville and create475 jobs; Global Wind Systems, an alternative energy company, willbuild wind turbines in Novi, investing $32 million, creating 356 jobs.
Industrial Outlook• Numerous companies have relocation/expansion plans for Michiganbased on approved tax credits from the Michigan EconomicGrowth Authority. This may create thousands of jobs and anoverall investment into Michigan of over $2 billion.However, with uncertainty in the automotive industry, the marketmay remain sluggish.
• Asking sale prices are expected to decrease significantly throughout2009 resulting in lower final sale prices. Land sales and newconstruction will remain at a standstill until the overallabsorption improves.
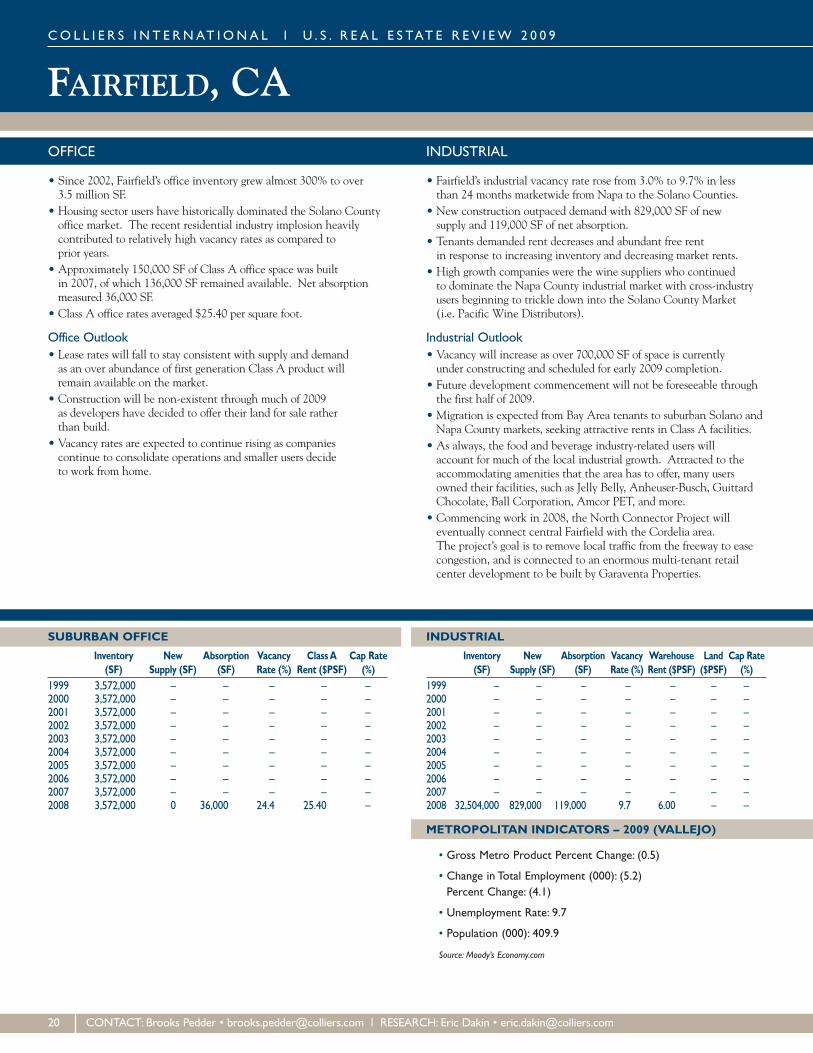
CO L L I E R S I N T E RNAT I ONA L l U . S . R E A L E S TAT E R E V I EW 2 0 0 9
SUBURBAN OFFICE
Inventory New Absorption Vacancy ClassA Cap Rate(SF) Supply (SF) (SF) Rate (%) Rent ($PSF) (%)
1999 3,572,000 – – – – –2000 3,572,000 – – – – –2001 3,572,000 – – – – –2002 3,572,000 – – – – –2003 3,572,000 – – – – –2004 3,572,000 – – – – –2005 3,572,000 – – – – –2006 3,572,000 – – – – –2007 3,572,000 – – – – –2008 3,572,000 0 36,000 24.4 25.40 –
INDUSTRIAL
Inventory New Absorption Vacancy Warehouse Land Cap Rate(SF) Supply (SF) (SF) Rate (%) Rent ($PSF) ($PSF) (%)
1999 – – – – – – –2000 – – – – – – –2001 – – – – – – –2002 – – – – – – –2003 – – – – – – –2004 – – – – – – –2005 – – – – – – –2006 – – – – – – –2007 – – – – – – –2008 32,504,000 829,000 119,000 9.7 6.00 – –
METROPOLITAN INDICATORS – 2009 (VALLEJO)
• Gross Metro Product Percent Change: (0.5)
• Change in Total Employment (000): (5.2)Percent Change: (4.1)
• Unemployment Rate: 9.7
• Population (000): 409.9
Source: Moody’s Economy.com
20 CONTACT: Brooks Pedder • [email protected] l RESEARCH: Eric Dakin • [email protected]
OFFICE
• Since 2002, Fairfield’s office inventory grew almost 300% to over3.5 million SF.
• Housing sector users have historically dominated the Solano Countyoffice market. The recent residential industry implosion heavilycontributed to relatively high vacancy rates as compared toprior years.
• Approximately 150,000 SF of Class A office space was builtin 2007, of which 136,000 SF remained available. Net absorptionmeasured 36,000 SF.
• Class A office rates averaged $25.40 per square foot.
Office Outlook• Lease rates will fall to stay consistent with supply and demandas an over abundance of first generation Class A product willremain available on the market.
• Construction will be non-existent through much of 2009as developers have decided to offer their land for sale ratherthan build.
• Vacancy rates are expected to continue rising as companiescontinue to consolidate operations and smaller users decideto work from home.
INDUSTRIAL
• Fairfield’s industrial vacancy rate rose from 3.0% to 9.7% in lessthan 24 months marketwide from Napa to the Solano Counties.
• New construction outpaced demand with 829,000 SF of newsupply and 119,000 SF of net absorption.
• Tenants demanded rent decreases and abundant free rentin response to increasing inventory and decreasing market rents.
• High growth companies were the wine suppliers who continuedto dominate the Napa County industrial market with cross-industryusers beginning to trickle down into the Solano County Market(i.e. Pacific Wine Distributors).
Industrial Outlook• Vacancy will increase as over 700,000 SF of space is currentlyunder constructing and scheduled for early 2009 completion.
• Future development commencement will not be foreseeable throughthe first half of 2009.
• Migration is expected from Bay Area tenants to suburban Solano andNapa County markets, seeking attractive rents in Class A facilities.
• As always, the food and beverage industry-related users willaccount for much of the local industrial growth. Attracted to theaccommodating amenities that the area has to offer, many usersowned their facilities, such as Jelly Belly, Anheuser-Busch, GuittardChocolate, Ball Corporation, Amcor PET, and more.
• Commencing work in 2008, the North Connector Project willeventually connect central Fairfield with the Cordelia area.The project’s goal is to remove local traffic from the freeway to easecongestion, and is connected to an enormous multi-tenant retailcenter development to be built by Garaventa Properties.
FAIRFIELD, CA
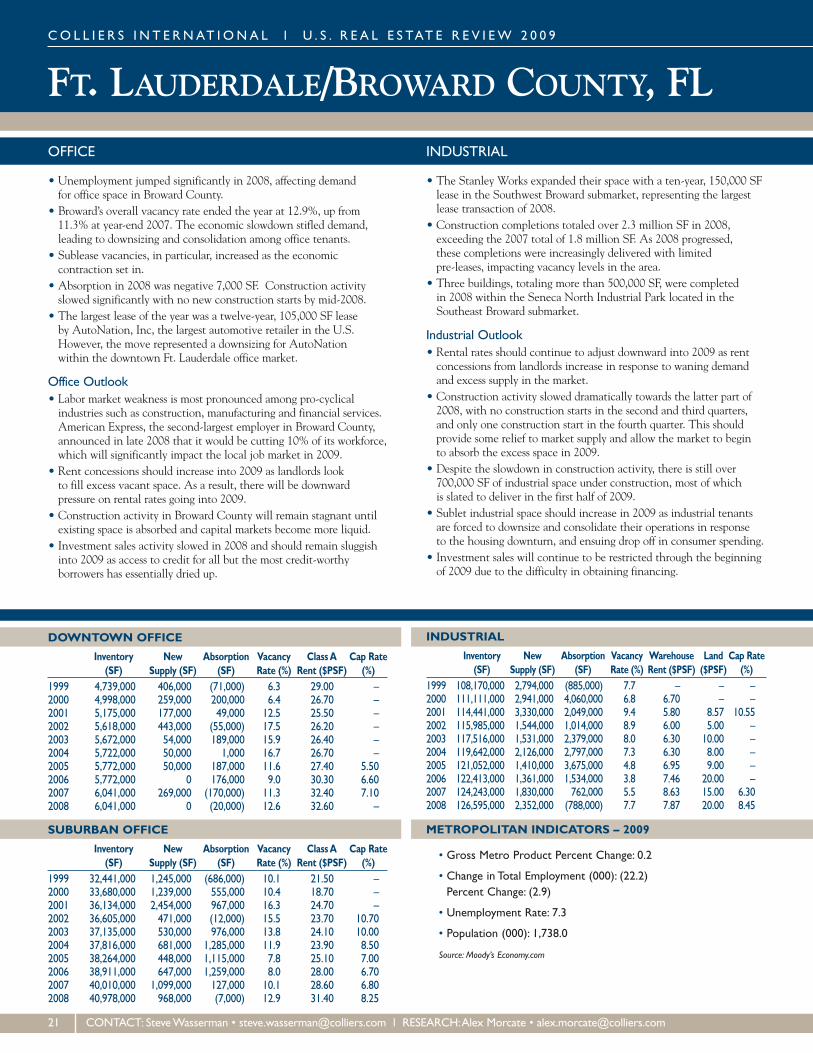
FT. LAUDERDALE/BROWARD COUNTY, FLCO L L I E R S I N T E RNAT I ONA L l U . S . R E A L E S TAT E R E V I EW 2 0 0 9
DOWNTOWN OFFICE
Inventory New Absorption Vacancy ClassA Cap Rate(SF) Supply (SF) (SF) Rate (%) Rent ($PSF) (%)
1999 4,739,000 406,000 (71,000) 6.3 29.00 –2000 4,998,000 259,000 200,000 6.4 26.70 –2001 5,175,000 177,000 49,000 12.5 25.50 –2002 5,618,000 443,000 (55,000) 17.5 26.20 –2003 5,672,000 54,000 189,000 15.9 26.40 –2004 5,722,000 50,000 1,000 16.7 26.70 –2005 5,772,000 50,000 187,000 11.6 27.40 5.502006 5,772,000 0 176,000 9.0 30.30 6.602007 6,041,000 269,000 (170,000) 11.3 32.40 7.102008 6,041,000 0 (20,000) 12.6 32.60 –
SUBURBAN OFFICE
Inventory New Absorption Vacancy ClassA Cap Rate(SF) Supply (SF) (SF) Rate (%) Rent ($PSF) (%)
1999 32,441,000 1,245,000 (686,000) 10.1 21.50 –2000 33,680,000 1,239,000 555,000 10.4 18.70 –2001 36,134,000 2,454,000 967,000 16.3 24.70 –2002 36,605,000 471,000 (12,000) 15.5 23.70 10.702003 37,135,000 530,000 976,000 13.8 24.10 10.002004 37,816,000 681,000 1,285,000 11.9 23.90 8.502005 38,264,000 448,000 1,115,000 7.8 25.10 7.002006 38,911,000 647,000 1,259,000 8.0 28.00 6.702007 40,010,000 1,099,000 127,000 10.1 28.60 6.802008 40,978,000 968,000 (7,000) 12.9 31.40 8.25
INDUSTRIAL
Inventory New Absorption Vacancy Warehouse Land Cap Rate(SF) Supply (SF) (SF) Rate (%) Rent ($PSF) ($PSF) (%)
1999 108,170,000 2,794,000 (885,000) 7.7 – – –2000 111,111,000 2,941,000 4,060,000 6.8 6.70 – –2001 114,441,000 3,330,000 2,049,000 9.4 5.80 8.57 10.552002 115,985,000 1,544,000 1,014,000 8.9 6.00 5.00 –2003 117,516,000 1,531,000 2,379,000 8.0 6.30 10.00 –2004 119,642,000 2,126,000 2,797,000 7.3 6.30 8.00 –2005 121,052,000 1,410,000 3,675,000 4.8 6.95 9.00 –2006 122,413,000 1,361,000 1,534,000 3.8 7.46 20.00 –2007 124,243,000 1,830,000 762,000 5.5 8.63 15.00 6.302008 126,595,000 2,352,000 (788,000) 7.7 7.87 20.00 8.45
METROPOLITAN INDICATORS – 2009
• Gross Metro Product Percent Change: 0.2
• Change in Total Employment (000): (22.2)Percent Change: (2.9)
• Unemployment Rate: 7.3
• Population (000): 1,738.0
Source: Moody’s Economy.com
21 CONTACT: SteveWasserman • [email protected] l RESEARCH:Alex Morcate • [email protected]
OFFICE
• Unemployment jumped significantly in 2008, affecting demandfor office space in Broward County.
• Broward’s overall vacancy rate ended the year at 12.9%, up from11.3% at year-end 2007. The economic slowdown stifled demand,leading to downsizing and consolidation among office tenants.
• Sublease vacancies, in particular, increased as the economiccontraction set in.
• Absorption in 2008 was negative 7,000 SF. Construction activityslowed significantly with no new construction starts by mid-2008.
• The largest lease of the year was a twelve-year, 105,000 SF leaseby AutoNation, Inc, the largest automotive retailer in the U.S.However, the move represented a downsizing for AutoNationwithin the downtown Ft. Lauderdale office market.
Office Outlook• Labor market weakness is most pronounced among pro-cyclicalindustries such as construction, manufacturing and financial services.American Express, the second-largest employer in Broward County,announced in late 2008 that it would be cutting 10% of its workforce,which will significantly impact the local job market in 2009.
• Rent concessions should increase into 2009 as landlords lookto fill excess vacant space. As a result, there will be downwardpressure on rental rates going into 2009.
• Construction activity in Broward County will remain stagnant untilexisting space is absorbed and capital markets become more liquid.
• Investment sales activity slowed in 2008 and should remain sluggishinto 2009 as access to credit for all but the most credit-worthyborrowers has essentially dried up.
INDUSTRIAL
• The Stanley Works expanded their space with a ten-year, 150,000 SFlease in the Southwest Broward submarket, representing the largestlease transaction of 2008.
• Construction completions totaled over 2.3 million SF in 2008,exceeding the 2007 total of 1.8 million SF. As 2008 progressed,these completions were increasingly delivered with limitedpre-leases, impacting vacancy levels in the area.
• Three buildings, totaling more than 500,000 SF, were completedin 2008 within the Seneca North Industrial Park located in theSoutheast Broward submarket.
Industrial Outlook• Rental rates should continue to adjust downward into 2009 as rentconcessions from landlords increase in response to waning demandand excess supply in the market.
• Construction activity slowed dramatically towards the latter part of2008, with no construction starts in the second and third quarters,and only one construction start in the fourth quarter. This shouldprovide some relief to market supply and allow the market to beginto absorb the excess space in 2009.
• Despite the slowdown in construction activity, there is still over700,000 SF of industrial space under construction, most of whichis slated to deliver in the first half of 2009.
• Sublet industrial space should increase in 2009 as industrial tenantsare forced to downsize and consolidate their operations in responseto the housing downturn, and ensuing drop off in consumer spending.
• Investment sales will continue to be restricted through the beginningof 2009 due to the difficulty in obtaining financing.

FRESNO, CA
DOWNTOWN OFFICE
Inventory New Absorption Vacancy ClassA Cap Rate(SF) Supply (SF) (SF) Rate (%) Rent ($PSF) (%)
1999 2,086,000 – – – 19.50 –2000 2,086,000 0 150,000 12.3 15.60 11.002001 2,196,000 110,000 149,000 10.9 15.60 12.002002 2,343,000 147,000 86,000 12.7 18.00 10.752003 2,845,000 502,000 440,000 13.7 19.20 9.002004 2,931,000 86,000 101,000 10.6 22.80 8.502005 2,929,000 (2,000) (19,000) 11.2 23.00 7.502006 2,977,000 48,000 157,000 7.3 24.00 9.002007 3,061,000 84,000 12,000 9.5 27.60 8.002008 3,092,000 31,000 63,000 8.3 26.40 8.50
SUBURBAN OFFICE
Inventory New Absorption Vacancy ClassA Cap Rate(SF) Supply (SF) (SF) Rate (%) Rent ($PSF) (%)
1999 12,672,000 213,000 160,000 12.0 23.50 –2000 12,975,000 303,000 830,000 11.3 19.20 10.002001 13,536,000 561,000 694,000 10.4 19.20 10.252002 14,706,000 1,170,000 1,343,000 8.1 16.20 9.002003 14,765,000 59,000 60,000 7.0 19.20 8.402004 15,684,000 919,000 601,000 7.9 25.20 8.002005 16,029,000 345,000 417,000 6.3 26.40 7.002006 16,702,000 673,000 544,000 8.8 26.40 7.252007 17,435,000 733,000 364,000 11.9 27.60 8.002008 17,553,000 118,000 (141,000) 13.3 27.00 8.00
INDUSTRIAL
Inventory New Absorption Vacancy Warehouse Land Cap Rate(SF) Supply (SF) (SF) Rate (%) Rent ($PSF) ($PSF) (%)
1999 44,064,000 750,000 2,800,000 8.6 3.60 – –2000 45,064,000 1,000,000 1,200,000 6.0 3.20 – –2001 45,264,000 200,000 100,000 8.0 3.40 2.25 9.002002 45,664,000 400,000 0 9.0 3.20 2.50 8.502003 46,464,000 800,000 (30,000) 10.8 3.20 2.50 8.502004 46,864,000 400,000 20,000 11.6 3.20 3.00 7.752005 47,664,000 800,000 1,923,000 9.1 3.20 4.25 7.752006 48,104,000 440,000 786,000 7.6 3.20 4.00 8.002007 48,204,000 100,000 1,393,000 4.6 4.08 7.00 7.502008 48,454,000 250,000 (1,545,000) 6.2 3.84 4.00 8.00
METROPOLITAN INDICATORS – 2009
• Gross Metro Product Percent Change: (2.0)
• Change in Total Employment (000): (9.5)Percent Change: (3.1)
• Unemployment Rate: 15.1
• Population (000): 927.9
Source: Moody’s Economy.com
CO L L I E R S I N T E RNAT I ONA L l U . S . R E A L E S TAT E R E V I EW 2 0 0 9
CONTACT:Mike Schuh • [email protected] l RESEARCH:Debbie Kidd • [email protected] 22
OFFICE
• New construction, which had been so robust from 2004 to 2007,decreased dramatically with only about 150,000 SF added duringthe year.
• The overall vacancy rate, which had been as low as 6.5% to 7.0%in 2005 to 2006, rose to 12.5%.
• There was a significant increase in sublease space as home builders, titlecompanies and mortgage companies downsized or went out of business.
• Sale transactions decreased dramatically as financing became largelyunavailable. Lease transactions also decreased dramatically and thelease terms have decreased as well. Many tenants renegotiated theirexisting leases.
Office Outlook• California’s Central Valley, including Fresno, will continue to seevacancy rates increase/stabilize while lease rates continue to fall.
• Medical services will continue to remain one of the few positive andmost active fields in our market, reflecting the aging demographicsof the population and Fresno’s role as a medical services hub givenits centralized location within California’s Central Valley.
• New speculative construction will remain at a standstill as thereis too much existing vacant product. The housing market continuesto be one of the hardest hit in the United States.
• Land values and investment properties continue to decreaseas obtaining commercial financing remains a huge obstacle.
• Many tenants will use the existing market conditions to renegotiateexisting leases. Very little business expansion is expected anytime soon in the Central Valley. Due to the ongoing budget crisisin California.
INDUSTRIAL
• Because of its central location, the Central California Regionbenefited from the consolidation of multiple warehouse locationsinto a single distribution center in this region.
• Labor costs and real estate operating costs in the Central Californiaregion were the lowest in California.
• This region evolved into a predominately distribution-orientedhub with over 75% of the space in this region being new Class Awarehouse space.
• Like the national economy, this region witnessed the demandfor warehouse space drop in the second half of 2008.
• Tenants and buyers became opportunistic by consummating leasesand sales well below historical figures.
• The Fresno area benefited from the recent influx of capital and thecompletion of infrastructure projects in recent years. These includedtwo new freeways, a new Fresno-Yosemite International Airportconcourse, new SaveMart Arena, and San Francisco Giants’ newtriple-A baseball stadium in downtown Fresno.
• Land values declined to levels very attractive to new industriesand others seeking expansion or construction of a new facility.
• Water technology industries, such as drip-irrigation, rapidly expandedin this region and contributed the last technologies to this region’sagricultural industry.
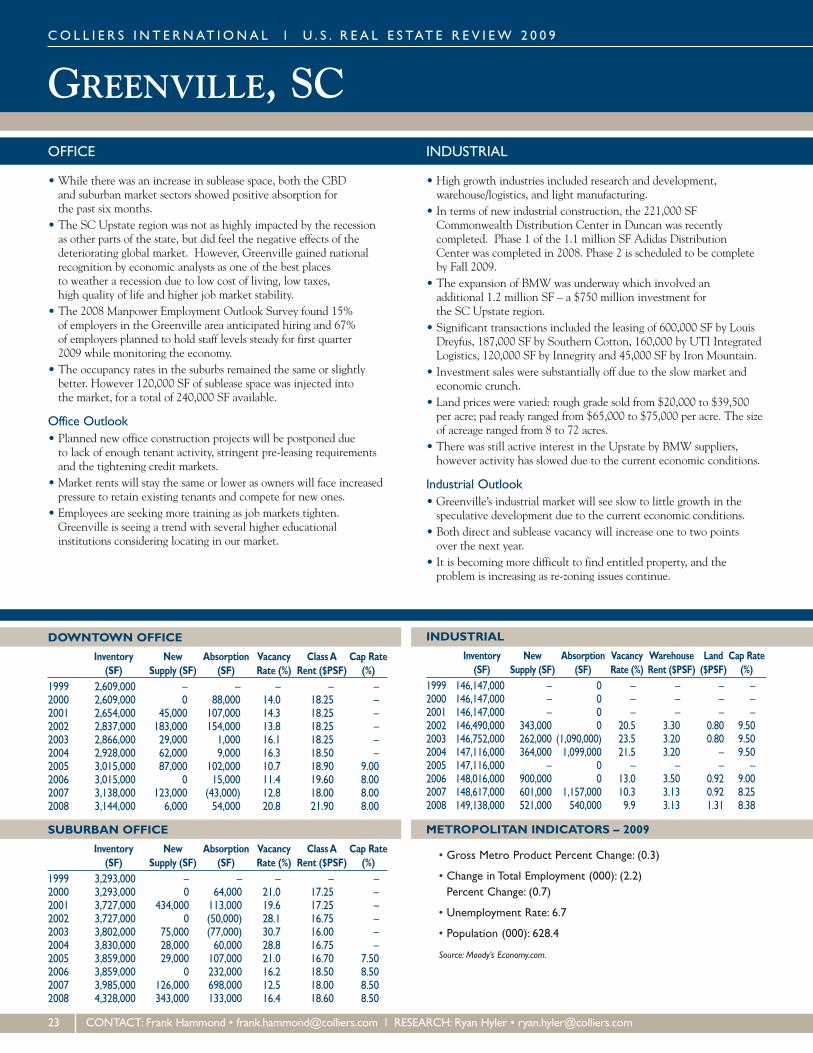
GREENVILLE, SCCO L L I E R S I N T E RNAT I ONA L l U . S . R E A L E S TAT E R E V I EW 2 0 0 9
DOWNTOWN OFFICE
Inventory New Absorption Vacancy ClassA Cap Rate(SF) Supply (SF) (SF) Rate (%) Rent ($PSF) (%)
1999 2,609,000 – – – – –2000 2,609,000 0 88,000 14.0 18.25 –2001 2,654,000 45,000 107,000 14.3 18.25 –2002 2,837,000 183,000 154,000 13.8 18.25 –2003 2,866,000 29,000 1,000 16.1 18.25 –2004 2,928,000 62,000 9,000 16.3 18.50 –2005 3,015,000 87,000 102,000 10.7 18.90 9.002006 3,015,000 0 15,000 11.4 19.60 8.002007 3,138,000 123,000 (43,000) 12.8 18.00 8.002008 3,144,000 6,000 54,000 20.8 21.90 8.00
SUBURBAN OFFICE
Inventory New Absorption Vacancy ClassA Cap Rate(SF) Supply (SF) (SF) Rate (%) Rent ($PSF) (%)
1999 3,293,000 – – – – –2000 3,293,000 0 64,000 21.0 17.25 –2001 3,727,000 434,000 113,000 19.6 17.25 –2002 3,727,000 0 (50,000) 28.1 16.75 –2003 3,802,000 75,000 (77,000) 30.7 16.00 –2004 3,830,000 28,000 60,000 28.8 16.75 –2005 3,859,000 29,000 107,000 21.0 16.70 7.502006 3,859,000 0 232,000 16.2 18.50 8.502007 3,985,000 126,000 698,000 12.5 18.00 8.502008 4,328,000 343,000 133,000 16.4 18.60 8.50
INDUSTRIAL
Inventory New Absorption Vacancy Warehouse Land Cap Rate(SF) Supply (SF) (SF) Rate (%) Rent ($PSF) ($PSF) (%)
1999 146,147,000 – 0 – – – –2000 146,147,000 – 0 – – – –2001 146,147,000 – 0 – – – –2002 146,490,000 343,000 0 20.5 3.30 0.80 9.502003 146,752,000 262,000 (1,090,000) 23.5 3.20 0.80 9.502004 147,116,000 364,000 1,099,000 21.5 3.20 – 9.502005 147,116,000 – 0 – – – –2006 148,016,000 900,000 0 13.0 3.50 0.92 9.002007 148,617,000 601,000 1,157,000 10.3 3.13 0.92 8.252008 149,138,000 521,000 540,000 9.9 3.13 1.31 8.38
METROPOLITAN INDICATORS – 2009
• Gross Metro Product Percent Change: (0.3)
• Change in Total Employment (000): (2.2)Percent Change: (0.7)
• Unemployment Rate: 6.7
• Population (000): 628.4
Source: Moody’s Economy.com.
23 CONTACT: Frank Hammond • [email protected] l RESEARCH: Ryan Hyler • [email protected]
OFFICE
• While there was an increase in sublease space, both the CBDand suburban market sectors showed positive absorption forthe past six months.
• The SC Upstate region was not as highly impacted by the recessionas other parts of the state, but did feel the negative effects of thedeteriorating global market. However, Greenville gained nationalrecognition by economic analysts as one of the best placesto weather a recession due to low cost of living, low taxes,high quality of life and higher job market stability.
• The 2008 Manpower Employment Outlook Survey found 15%of employers in the Greenville area anticipated hiring and 67%of employers planned to hold staff levels steady for first quarter2009 while monitoring the economy.
• The occupancy rates in the suburbs remained the same or slightlybetter. However 120,000 SF of sublease space was injected intothe market, for a total of 240,000 SF available.
Office Outlook• Planned new office construction projects will be postponed dueto lack of enough tenant activity, stringent pre-leasing requirementsand the tightening credit markets.
• Market rents will stay the same or lower as owners will face increasedpressure to retain existing tenants and compete for new ones.
• Employees are seeking more training as job markets tighten.Greenville is seeing a trend with several higher educationalinstitutions considering locating in our market.
INDUSTRIAL
• High growth industries included research and development,warehouse/logistics, and light manufacturing.
• In terms of new industrial construction, the 221,000 SFCommonwealth Distribution Center in Duncan was recentlycompleted. Phase 1 of the 1.1 million SF Adidas DistributionCenter was completed in 2008. Phase 2 is scheduled to be completeby Fall 2009.
• The expansion of BMW was underway which involved anadditional 1.2 million SF – a $750 million investment forthe SC Upstate region.
• Significant transactions included the leasing of 600,000 SF by LouisDreyfus, 187,000 SF by Southern Cotton, 160,000 by UTI IntegratedLogistics, 120,000 SF by Innegrity and 45,000 SF by Iron Mountain.
• Investment sales were substantially off due to the slow market andeconomic crunch.
• Land prices were varied: rough grade sold from $20,000 to $39,500per acre; pad ready ranged from $65,000 to $75,000 per acre. The sizeof acreage ranged from 8 to 72 acres.
• There was still active interest in the Upstate by BMW suppliers,however activity has slowed due to the current economic conditions.
Industrial Outlook• Greenville’s industrial market will see slow to little growth in thespeculative development due to the current economic conditions.
• Both direct and sublease vacancy will increase one to two pointsover the next year.
• It is becoming more difficult to find entitled property, and theproblem is increasing as re-zoning issues continue.
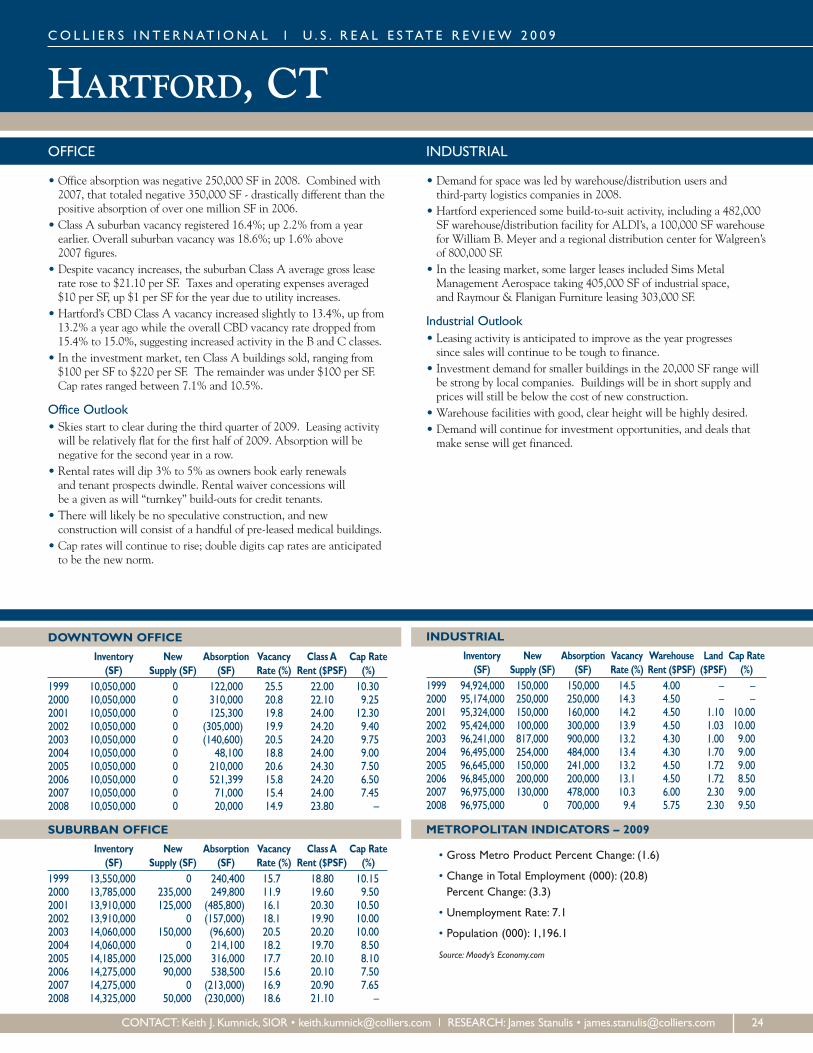
HARTFORD, CT
DOWNTOWN OFFICE
Inventory New Absorption Vacancy ClassA Cap Rate(SF) Supply (SF) (SF) Rate (%) Rent ($PSF) (%)
1999 10,050,000 0 122,000 25.5 22.00 10.302000 10,050,000 0 310,000 20.8 22.10 9.252001 10,050,000 0 125,300 19.8 24.00 12.302002 10,050,000 0 (305,000) 19.9 24.20 9.402003 10,050,000 0 (140,600) 20.5 24.20 9.752004 10,050,000 0 48,100 18.8 24.00 9.002005 10,050,000 0 210,000 20.6 24.30 7.502006 10,050,000 0 521,399 15.8 24.20 6.502007 10,050,000 0 71,000 15.4 24.00 7.452008 10,050,000 0 20,000 14.9 23.80 –
SUBURBAN OFFICE
Inventory New Absorption Vacancy ClassA Cap Rate(SF) Supply (SF) (SF) Rate (%) Rent ($PSF) (%)
1999 13,550,000 0 240,400 15.7 18.80 10.152000 13,785,000 235,000 249,800 11.9 19.60 9.502001 13,910,000 125,000 (485,800) 16.1 20.30 10.502002 13,910,000 0 (157,000) 18.1 19.90 10.002003 14,060,000 150,000 (96,600) 20.5 20.20 10.002004 14,060,000 0 214,100 18.2 19.70 8.502005 14,185,000 125,000 316,000 17.7 20.10 8.102006 14,275,000 90,000 538,500 15.6 20.10 7.502007 14,275,000 0 (213,000) 16.9 20.90 7.652008 14,325,000 50,000 (230,000) 18.6 21.10 –
INDUSTRIAL
Inventory New Absorption Vacancy Warehouse Land Cap Rate(SF) Supply (SF) (SF) Rate (%) Rent ($PSF) ($PSF) (%)
1999 94,924,000 150,000 150,000 14.5 4.00 – –2000 95,174,000 250,000 250,000 14.3 4.50 – –2001 95,324,000 150,000 160,000 14.2 4.50 1.10 10.002002 95,424,000 100,000 300,000 13.9 4.50 1.03 10.002003 96,241,000 817,000 900,000 13.2 4.30 1.00 9.002004 96,495,000 254,000 484,000 13.4 4.30 1.70 9.002005 96,645,000 150,000 241,000 13.2 4.50 1.72 9.002006 96,845,000 200,000 200,000 13.1 4.50 1.72 8.502007 96,975,000 130,000 478,000 10.3 6.00 2.30 9.002008 96,975,000 0 700,000 9.4 5.75 2.30 9.50
METROPOLITAN INDICATORS – 2009
• Gross Metro Product Percent Change: (1.6)
• Change in Total Employment (000): (20.8)Percent Change: (3.3)
• Unemployment Rate: 7.1
• Population (000): 1,196.1
Source: Moody’s Economy.com
CO L L I E R S I N T E RNAT I ONA L l U . S . R E A L E S TAT E R E V I EW 2 0 0 9
CONTACT: Keith J. Kumnick, SIOR • [email protected] l RESEARCH: James Stanulis • [email protected] 24
OFFICE
• Office absorption was negative 250,000 SF in 2008. Combined with2007, that totaled negative 350,000 SF - drastically different than thepositive absorption of over one million SF in 2006.
• Class A suburban vacancy registered 16.4%; up 2.2% from a yearearlier. Overall suburban vacancy was 18.6%; up 1.6% above2007 figures.
• Despite vacancy increases, the suburban Class A average gross leaserate rose to $21.10 per SF. Taxes and operating expenses averaged$10 per SF, up $1 per SF for the year due to utility increases.
• Hartford’s CBD Class A vacancy increased slightly to 13.4%, up from13.2% a year ago while the overall CBD vacancy rate dropped from15.4% to 15.0%, suggesting increased activity in the B and C classes.
• In the investment market, ten Class A buildings sold, ranging from$100 per SF to $220 per SF. The remainder was under $100 per SF.Cap rates ranged between 7.1% and 10.5%.
Office Outlook• Skies start to clear during the third quarter of 2009. Leasing activitywill be relatively flat for the first half of 2009. Absorption will benegative for the second year in a row.
• Rental rates will dip 3% to 5% as owners book early renewalsand tenant prospects dwindle. Rental waiver concessions willbe a given as will “turnkey” build-outs for credit tenants.
• There will likely be no speculative construction, and newconstruction will consist of a handful of pre-leased medical buildings.
• Cap rates will continue to rise; double digits cap rates are anticipatedto be the new norm.
INDUSTRIAL
• Demand for space was led by warehouse/distribution users andthird-party logistics companies in 2008.
• Hartford experienced some build-to-suit activity, including a 482,000SF warehouse/distribution facility for ALDI’s, a 100,000 SF warehousefor William B. Meyer and a regional distribution center for Walgreen’sof 800,000 SF.
• In the leasing market, some larger leases included Sims MetalManagement Aerospace taking 405,000 SF of industrial space,and Raymour & Flanigan Furniture leasing 303,000 SF.
Industrial Outlook• Leasing activity is anticipated to improve as the year progressessince sales will continue to be tough to finance.
• Investment demand for smaller buildings in the 20,000 SF range willbe strong by local companies. Buildings will be in short supply andprices will still be below the cost of new construction.
• Warehouse facilities with good, clear height will be highly desired.• Demand will continue for investment opportunities, and deals thatmake sense will get financed.
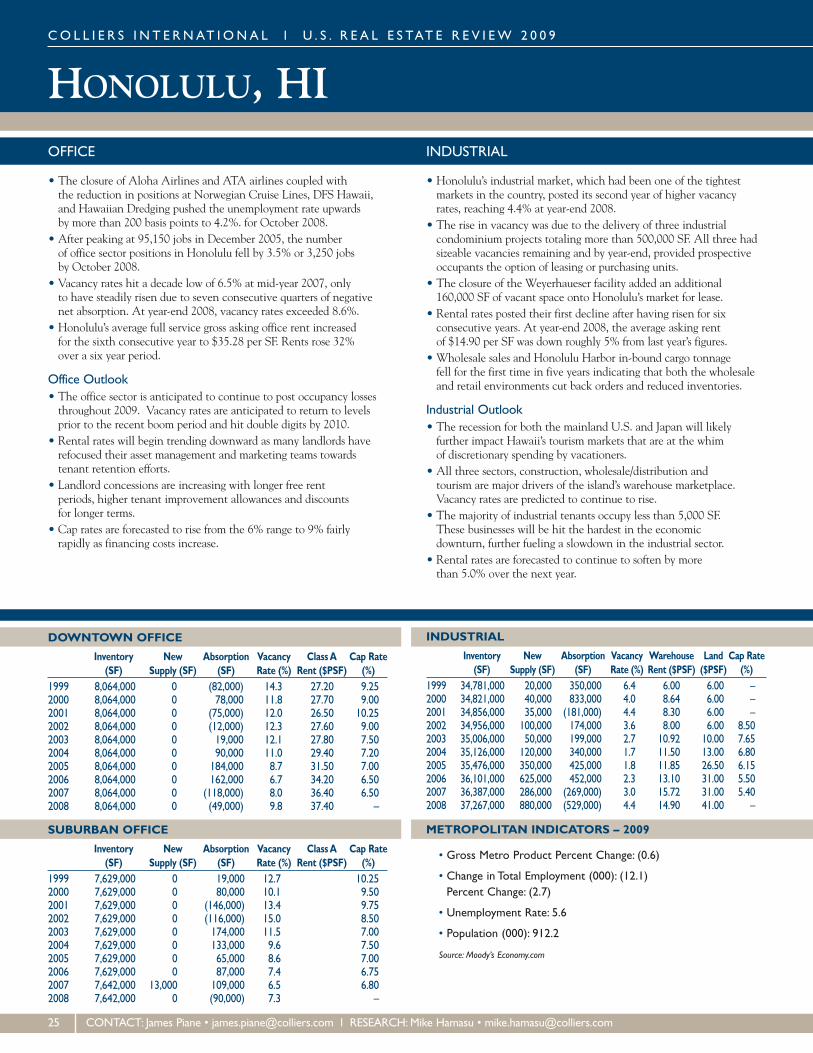
HONOLULU, HICO L L I E R S I N T E RNAT I ONA L l U . S . R E A L E S TAT E R E V I EW 2 0 0 9
DOWNTOWN OFFICE
Inventory New Absorption Vacancy ClassA Cap Rate(SF) Supply (SF) (SF) Rate (%) Rent ($PSF) (%)
1999 8,064,000 0 (82,000) 14.3 27.20 9.252000 8,064,000 0 78,000 11.8 27.70 9.002001 8,064,000 0 (75,000) 12.0 26.50 10.252002 8,064,000 0 (12,000) 12.3 27.60 9.002003 8,064,000 0 19,000 12.1 27.80 7.502004 8,064,000 0 90,000 11.0 29.40 7.202005 8,064,000 0 184,000 8.7 31.50 7.002006 8,064,000 0 162,000 6.7 34.20 6.502007 8,064,000 0 (118,000) 8.0 36.40 6.502008 8,064,000 0 (49,000) 9.8 37.40 –
SUBURBAN OFFICE
Inventory New Absorption Vacancy ClassA Cap Rate(SF) Supply (SF) (SF) Rate (%) Rent ($PSF) (%)
1999 7,629,000 0 19,000 12.7 10.252000 7,629,000 0 80,000 10.1 9.502001 7,629,000 0 (146,000) 13.4 9.752002 7,629,000 0 (116,000) 15.0 8.502003 7,629,000 0 174,000 11.5 7.002004 7,629,000 0 133,000 9.6 7.502005 7,629,000 0 65,000 8.6 7.002006 7,629,000 0 87,000 7.4 6.752007 7,642,000 13,000 109,000 6.5 6.802008 7,642,000 0 (90,000) 7.3 –
INDUSTRIAL
Inventory New Absorption Vacancy Warehouse Land Cap Rate(SF) Supply (SF) (SF) Rate (%) Rent ($PSF) ($PSF) (%)
1999 34,781,000 20,000 350,000 6.4 6.00 6.00 –2000 34,821,000 40,000 833,000 4.0 8.64 6.00 –2001 34,856,000 35,000 (181,000) 4.4 8.30 6.00 –2002 34,956,000 100,000 174,000 3.6 8.00 6.00 8.502003 35,006,000 50,000 199,000 2.7 10.92 10.00 7.652004 35,126,000 120,000 340,000 1.7 11.50 13.00 6.802005 35,476,000 350,000 425,000 1.8 11.85 26.50 6.152006 36,101,000 625,000 452,000 2.3 13.10 31.00 5.502007 36,387,000 286,000 (269,000) 3.0 15.72 31.00 5.402008 37,267,000 880,000 (529,000) 4.4 14.90 41.00 –
METROPOLITAN INDICATORS – 2009
• Gross Metro Product Percent Change: (0.6)
• Change in Total Employment (000): (12.1)Percent Change: (2.7)
• Unemployment Rate: 5.6
• Population (000): 912.2
Source: Moody’s Economy.com
25 CONTACT: James Piane • [email protected] l RESEARCH:Mike Hamasu • [email protected]
OFFICE
• The closure of Aloha Airlines and ATA airlines coupled withthe reduction in positions at Norwegian Cruise Lines, DFS Hawaii,and Hawaiian Dredging pushed the unemployment rate upwardsby more than 200 basis points to 4.2%. for October 2008.
• After peaking at 95,150 jobs in December 2005, the numberof office sector positions in Honolulu fell by 3.5% or 3,250 jobsby October 2008.
• Vacancy rates hit a decade low of 6.5% at mid-year 2007, onlyto have steadily risen due to seven consecutive quarters of negativenet absorption. At year-end 2008, vacancy rates exceeded 8.6%.
• Honolulu’s average full service gross asking office rent increasedfor the sixth consecutive year to $35.28 per SF. Rents rose 32%over a six year period.
Office Outlook• The office sector is anticipated to continue to post occupancy lossesthroughout 2009. Vacancy rates are anticipated to return to levelsprior to the recent boom period and hit double digits by 2010.
• Rental rates will begin trending downward as many landlords haverefocused their asset management and marketing teams towardstenant retention efforts.
• Landlord concessions are increasing with longer free rentperiods, higher tenant improvement allowances and discountsfor longer terms.
• Cap rates are forecasted to rise from the 6% range to 9% fairlyrapidly as financing costs increase.
INDUSTRIAL
• Honolulu’s industrial market, which had been one of the tightestmarkets in the country, posted its second year of higher vacancyrates, reaching 4.4% at year-end 2008.
• The rise in vacancy was due to the delivery of three industrialcondominium projects totaling more than 500,000 SF. All three hadsizeable vacancies remaining and by year-end, provided prospectiveoccupants the option of leasing or purchasing units.
• The closure of the Weyerhaueser facility added an additional160,000 SF of vacant space onto Honolulu’s market for lease.
• Rental rates posted their first decline after having risen for sixconsecutive years. At year-end 2008, the average asking rentof $14.90 per SF was down roughly 5% from last year’s figures.
• Wholesale sales and Honolulu Harbor in-bound cargo tonnagefell for the first time in five years indicating that both the wholesaleand retail environments cut back orders and reduced inventories.
Industrial Outlook• The recession for both the mainland U.S. and Japan will likelyfurther impact Hawaii’s tourism markets that are at the whimof discretionary spending by vacationers.
• All three sectors, construction, wholesale/distribution andtourism are major drivers of the island’s warehouse marketplace.Vacancy rates are predicted to continue to rise.
• The majority of industrial tenants occupy less than 5,000 SF.These businesses will be hit the hardest in the economicdownturn, further fueling a slowdown in the industrial sector.
• Rental rates are forecasted to continue to soften by morethan 5.0% over the next year.
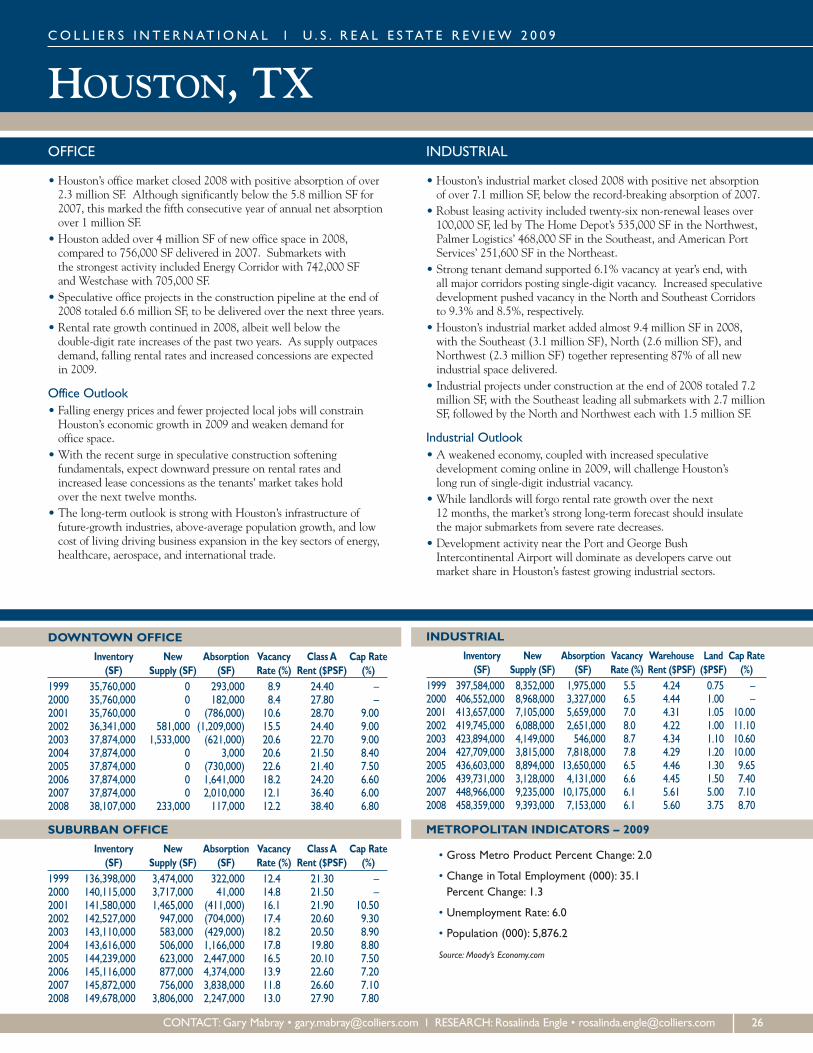
HOUSTON, TX
DOWNTOWN OFFICE
Inventory New Absorption Vacancy ClassA Cap Rate(SF) Supply (SF) (SF) Rate (%) Rent ($PSF) (%)
1999 35,760,000 0 293,000 8.9 24.40 –2000 35,760,000 0 182,000 8.4 27.80 –2001 35,760,000 0 (786,000) 10.6 28.70 9.002002 36,341,000 581,000 (1,209,000) 15.5 24.40 9.002003 37,874,000 1,533,000 (621,000) 20.6 22.70 9.002004 37,874,000 0 3,000 20.6 21.50 8.402005 37,874,000 0 (730,000) 22.6 21.40 7.502006 37,874,000 0 1,641,000 18.2 24.20 6.602007 37,874,000 0 2,010,000 12.1 36.40 6.002008 38,107,000 233,000 117,000 12.2 38.40 6.80
SUBURBAN OFFICE
Inventory New Absorption Vacancy ClassA Cap Rate(SF) Supply (SF) (SF) Rate (%) Rent ($PSF) (%)
1999 136,398,000 3,474,000 322,000 12.4 21.30 –2000 140,115,000 3,717,000 41,000 14.8 21.50 –2001 141,580,000 1,465,000 (411,000) 16.1 21.90 10.502002 142,527,000 947,000 (704,000) 17.4 20.60 9.302003 143,110,000 583,000 (429,000) 18.2 20.50 8.902004 143,616,000 506,000 1,166,000 17.8 19.80 8.802005 144,239,000 623,000 2,447,000 16.5 20.10 7.502006 145,116,000 877,000 4,374,000 13.9 22.60 7.202007 145,872,000 756,000 3,838,000 11.8 26.60 7.102008 149,678,000 3,806,000 2,247,000 13.0 27.90 7.80
INDUSTRIAL
Inventory New Absorption Vacancy Warehouse Land Cap Rate(SF) Supply (SF) (SF) Rate (%) Rent ($PSF) ($PSF) (%)
1999 397,584,000 8,352,000 1,975,000 5.5 4.24 0.75 –2000 406,552,000 8,968,000 3,327,000 6.5 4.44 1.00 –2001 413,657,000 7,105,000 5,659,000 7.0 4.31 1.05 10.002002 419,745,000 6,088,000 2,651,000 8.0 4.22 1.00 11.102003 423,894,000 4,149,000 546,000 8.7 4.34 1.10 10.602004 427,709,000 3,815,000 7,818,000 7.8 4.29 1.20 10.002005 436,603,000 8,894,000 13,650,000 6.5 4.46 1.30 9.652006 439,731,000 3,128,000 4,131,000 6.6 4.45 1.50 7.402007 448,966,000 9,235,000 10,175,000 6.1 5.61 5.00 7.102008 458,359,000 9,393,000 7,153,000 6.1 5.60 3.75 8.70
METROPOLITAN INDICATORS – 2009
• Gross Metro Product Percent Change: 2.0
• Change in Total Employment (000): 35.1Percent Change: 1.3
• Unemployment Rate: 6.0
• Population (000): 5,876.2
Source: Moody’s Economy.com
CO L L I E R S I N T E RNAT I ONA L l U . S . R E A L E S TAT E R E V I EW 2 0 0 9
CONTACT: Gary Mabray • [email protected] l RESEARCH: Rosalinda Engle • [email protected] 26
OFFICE
• Houston’s office market closed 2008 with positive absorption of over2.3 million SF. Although significantly below the 5.8 million SF for2007, this marked the fifth consecutive year of annual net absorptionover 1 million SF.
• Houston added over 4 million SF of new office space in 2008,compared to 756,000 SF delivered in 2007. Submarkets withthe strongest activity included Energy Corridor with 742,000 SFand Westchase with 705,000 SF.
• Speculative office projects in the construction pipeline at the end of2008 totaled 6.6 million SF, to be delivered over the next three years.
• Rental rate growth continued in 2008, albeit well below thedouble-digit rate increases of the past two years. As supply outpacesdemand, falling rental rates and increased concessions are expectedin 2009.
Office Outlook• Falling energy prices and fewer projected local jobs will constrainHouston’s economic growth in 2009 and weaken demand foroffice space.
• With the recent surge in speculative construction softeningfundamentals, expect downward pressure on rental rates andincreased lease concessions as the tenants’ market takes holdover the next twelve months.
• The long-term outlook is strong with Houston’s infrastructure offuture-growth industries, above-average population growth, and lowcost of living driving business expansion in the key sectors of energy,healthcare, aerospace, and international trade.
INDUSTRIAL
• Houston’s industrial market closed 2008 with positive net absorptionof over 7.1 million SF, below the record-breaking absorption of 2007.
• Robust leasing activity included twenty-six non-renewal leases over100,000 SF, led by The Home Depot’s 535,000 SF in the Northwest,Palmer Logistics’ 468,000 SF in the Southeast, and American PortServices’ 251,600 SF in the Northeast.
• Strong tenant demand supported 6.1% vacancy at year’s end, withall major corridors posting single-digit vacancy. Increased speculativedevelopment pushed vacancy in the North and Southeast Corridorsto 9.3% and 8.5%, respectively.
• Houston’s industrial market added almost 9.4 million SF in 2008,with the Southeast (3.1 million SF), North (2.6 million SF), andNorthwest (2.3 million SF) together representing 87% of all newindustrial space delivered.
• Industrial projects under construction at the end of 2008 totaled 7.2million SF, with the Southeast leading all submarkets with 2.7 millionSF, followed by the North and Northwest each with 1.5 million SF.
Industrial Outlook• A weakened economy, coupled with increased speculativedevelopment coming online in 2009, will challenge Houston’slong run of single-digit industrial vacancy.
• While landlords will forgo rental rate growth over the next12 months, the market’s strong long-term forecast should insulatethe major submarkets from severe rate decreases.
• Development activity near the Port and George BushIntercontinental Airport will dominate as developers carve outmarket share in Houston’s fastest growing industrial sectors.
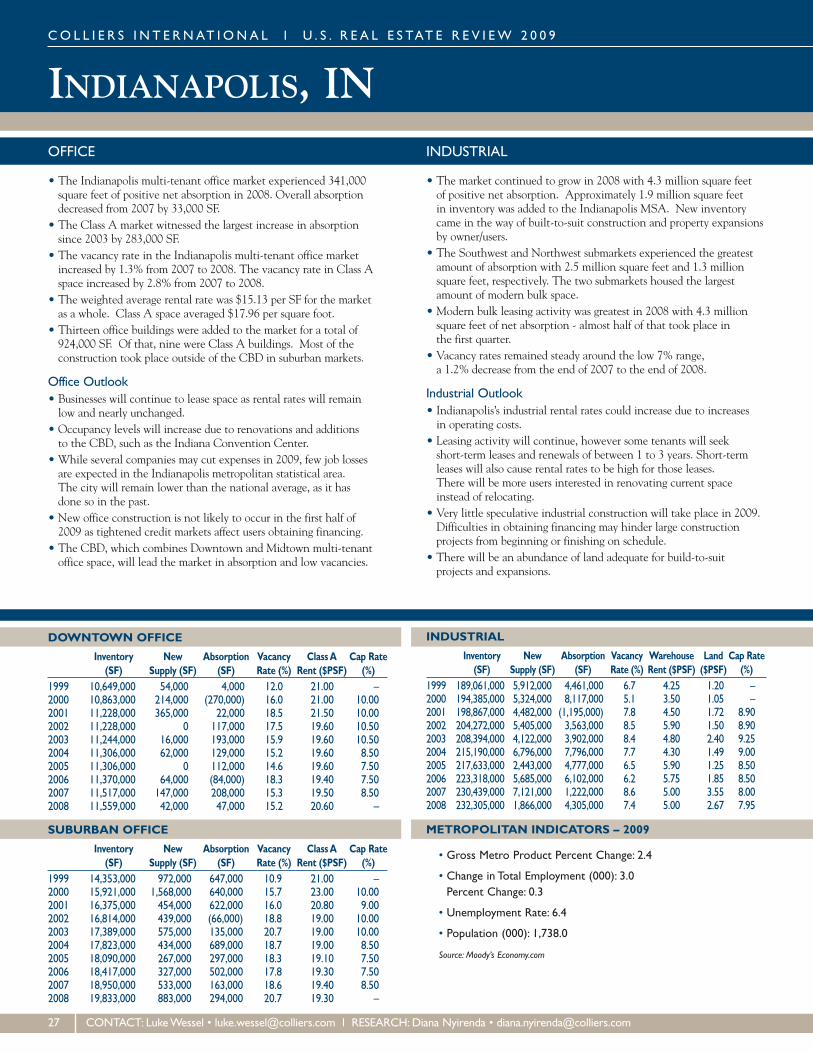
INDIANAPOLIS, INCO L L I E R S I N T E RNAT I ONA L l U . S . R E A L E S TAT E R E V I EW 2 0 0 9
DOWNTOWN OFFICE
Inventory New Absorption Vacancy ClassA Cap Rate(SF) Supply (SF) (SF) Rate (%) Rent ($PSF) (%)
1999 10,649,000 54,000 4,000 12.0 21.00 –2000 10,863,000 214,000 (270,000) 16.0 21.00 10.002001 11,228,000 365,000 22,000 18.5 21.50 10.002002 11,228,000 0 117,000 17.5 19.60 10.502003 11,244,000 16,000 193,000 15.9 19.60 10.502004 11,306,000 62,000 129,000 15.2 19.60 8.502005 11,306,000 0 112,000 14.6 19.60 7.502006 11,370,000 64,000 (84,000) 18.3 19.40 7.502007 11,517,000 147,000 208,000 15.3 19.50 8.502008 11,559,000 42,000 47,000 15.2 20.60 –
SUBURBAN OFFICE
Inventory New Absorption Vacancy ClassA Cap Rate(SF) Supply (SF) (SF) Rate (%) Rent ($PSF) (%)
1999 14,353,000 972,000 647,000 10.9 21.00 –2000 15,921,000 1,568,000 640,000 15.7 23.00 10.002001 16,375,000 454,000 622,000 16.0 20.80 9.002002 16,814,000 439,000 (66,000) 18.8 19.00 10.002003 17,389,000 575,000 135,000 20.7 19.00 10.002004 17,823,000 434,000 689,000 18.7 19.00 8.502005 18,090,000 267,000 297,000 18.3 19.10 7.502006 18,417,000 327,000 502,000 17.8 19.30 7.502007 18,950,000 533,000 163,000 18.6 19.40 8.502008 19,833,000 883,000 294,000 20.7 19.30 –
INDUSTRIAL
Inventory New Absorption Vacancy Warehouse Land Cap Rate(SF) Supply (SF) (SF) Rate (%) Rent ($PSF) ($PSF) (%)
1999 189,061,000 5,912,000 4,461,000 6.7 4.25 1.20 –2000 194,385,000 5,324,000 8,117,000 5.1 3.50 1.05 –2001 198,867,000 4,482,000 (1,195,000) 7.8 4.50 1.72 8.902002 204,272,000 5,405,000 3,563,000 8.5 5.90 1.50 8.902003 208,394,000 4,122,000 3,902,000 8.4 4.80 2.40 9.252004 215,190,000 6,796,000 7,796,000 7.7 4.30 1.49 9.002005 217,633,000 2,443,000 4,777,000 6.5 5.90 1.25 8.502006 223,318,000 5,685,000 6,102,000 6.2 5.75 1.85 8.502007 230,439,000 7,121,000 1,222,000 8.6 5.00 3.55 8.002008 232,305,000 1,866,000 4,305,000 7.4 5.00 2.67 7.95
METROPOLITAN INDICATORS – 2009
• Gross Metro Product Percent Change: 2.4
• Change in Total Employment (000): 3.0Percent Change: 0.3
• Unemployment Rate: 6.4
• Population (000): 1,738.0
Source: Moody’s Economy.com
27 CONTACT: LukeWessel • [email protected] l RESEARCH:Diana Nyirenda • [email protected]
OFFICE
• The Indianapolis multi-tenant office market experienced 341,000square feet of positive net absorption in 2008. Overall absorptiondecreased from 2007 by 33,000 SF.
• The Class A market witnessed the largest increase in absorptionsince 2003 by 283,000 SF.
• The vacancy rate in the Indianapolis multi-tenant office marketincreased by 1.3% from 2007 to 2008. The vacancy rate in Class Aspace increased by 2.8% from 2007 to 2008.
• The weighted average rental rate was $15.13 per SF for the marketas a whole. Class A space averaged $17.96 per square foot.
• Thirteen office buildings were added to the market for a total of924,000 SF. Of that, nine were Class A buildings. Most of theconstruction took place outside of the CBD in suburban markets.
Office Outlook• Businesses will continue to lease space as rental rates will remainlow and nearly unchanged.
• Occupancy levels will increase due to renovations and additionsto the CBD, such as the Indiana Convention Center.
• While several companies may cut expenses in 2009, few job lossesare expected in the Indianapolis metropolitan statistical area.The city will remain lower than the national average, as it hasdone so in the past.
• New office construction is not likely to occur in the first half of2009 as tightened credit markets affect users obtaining financing.
• The CBD, which combines Downtown and Midtown multi-tenantoffice space, will lead the market in absorption and low vacancies.
INDUSTRIAL
• The market continued to grow in 2008 with 4.3 million square feetof positive net absorption. Approximately 1.9 million square feetin inventory was added to the Indianapolis MSA. New inventorycame in the way of built-to-suit construction and property expansionsby owner/users.
• The Southwest and Northwest submarkets experienced the greatestamount of absorption with 2.5 million square feet and 1.3 millionsquare feet, respectively. The two submarkets housed the largestamount of modern bulk space.
• Modern bulk leasing activity was greatest in 2008 with 4.3 millionsquare feet of net absorption - almost half of that took place inthe first quarter.
• Vacancy rates remained steady around the low 7% range,a 1.2% decrease from the end of 2007 to the end of 2008.
Industrial Outlook• Indianapolis’s industrial rental rates could increase due to increasesin operating costs.
• Leasing activity will continue, however some tenants will seekshort-term leases and renewals of between 1 to 3 years. Short-termleases will also cause rental rates to be high for those leases.There will be more users interested in renovating current spaceinstead of relocating.
• Very little speculative industrial construction will take place in 2009.Difficulties in obtaining financing may hinder large constructionprojects from beginning or finishing on schedule.
• There will be an abundance of land adequate for build-to-suitprojects and expansions.
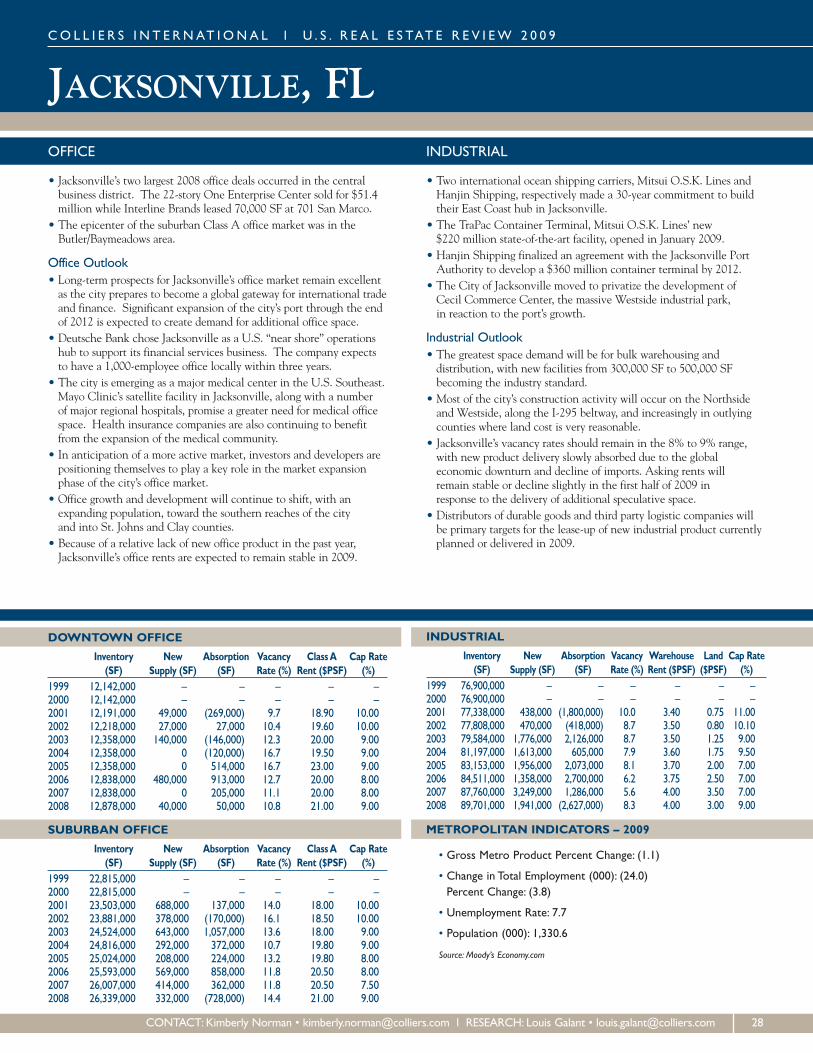
JACKSONVILLE, FL
DOWNTOWN OFFICE
Inventory New Absorption Vacancy ClassA Cap Rate(SF) Supply (SF) (SF) Rate (%) Rent ($PSF) (%)
1999 12,142,000 – – – – –2000 12,142,000 – – – – –2001 12,191,000 49,000 (269,000) 9.7 18.90 10.002002 12,218,000 27,000 27,000 10.4 19.60 10.002003 12,358,000 140,000 (146,000) 12.3 20.00 9.002004 12,358,000 0 (120,000) 16.7 19.50 9.002005 12,358,000 0 514,000 16.7 23.00 9.002006 12,838,000 480,000 913,000 12.7 20.00 8.002007 12,838,000 0 205,000 11.1 20.00 8.002008 12,878,000 40,000 50,000 10.8 21.00 9.00
SUBURBAN OFFICE
Inventory New Absorption Vacancy ClassA Cap Rate(SF) Supply (SF) (SF) Rate (%) Rent ($PSF) (%)
1999 22,815,000 – – – – –2000 22,815,000 – – – – –2001 23,503,000 688,000 137,000 14.0 18.00 10.002002 23,881,000 378,000 (170,000) 16.1 18.50 10.002003 24,524,000 643,000 1,057,000 13.6 18.00 9.002004 24,816,000 292,000 372,000 10.7 19.80 9.002005 25,024,000 208,000 224,000 13.2 19.80 8.002006 25,593,000 569,000 858,000 11.8 20.50 8.002007 26,007,000 414,000 362,000 11.8 20.50 7.502008 26,339,000 332,000 (728,000) 14.4 21.00 9.00
INDUSTRIAL
Inventory New Absorption Vacancy Warehouse Land Cap Rate(SF) Supply (SF) (SF) Rate (%) Rent ($PSF) ($PSF) (%)
1999 76,900,000 – – – – – –2000 76,900,000 – – – – – –2001 77,338,000 438,000 (1,800,000) 10.0 3.40 0.75 11.002002 77,808,000 470,000 (418,000) 8.7 3.50 0.80 10.102003 79,584,000 1,776,000 2,126,000 8.7 3.50 1.25 9.002004 81,197,000 1,613,000 605,000 7.9 3.60 1.75 9.502005 83,153,000 1,956,000 2,073,000 8.1 3.70 2.00 7.002006 84,511,000 1,358,000 2,700,000 6.2 3.75 2.50 7.002007 87,760,000 3,249,000 1,286,000 5.6 4.00 3.50 7.002008 89,701,000 1,941,000 (2,627,000) 8.3 4.00 3.00 9.00
METROPOLITAN INDICATORS – 2009
• Gross Metro Product Percent Change: (1.1)
• Change in Total Employment (000): (24.0)Percent Change: (3.8)
• Unemployment Rate: 7.7
• Population (000): 1,330.6
Source: Moody’s Economy.com
CO L L I E R S I N T E RNAT I ONA L l U . S . R E A L E S TAT E R E V I EW 2 0 0 9
CONTACT: Kimberly Norman • [email protected] l RESEARCH: Louis Galant • [email protected] 28
OFFICE
• Jacksonville’s two largest 2008 office deals occurred in the centralbusiness district. The 22-story One Enterprise Center sold for $51.4million while Interline Brands leased 70,000 SF at 701 San Marco.
• The epicenter of the suburban Class A office market was in theButler/Baymeadows area.
Office Outlook• Long-term prospects for Jacksonville’s office market remain excellentas the city prepares to become a global gateway for international tradeand finance. Significant expansion of the city’s port through the endof 2012 is expected to create demand for additional office space.
• Deutsche Bank chose Jacksonville as a U.S. “near shore” operationshub to support its financial services business. The company expectsto have a 1,000-employee office locally within three years.
• The city is emerging as a major medical center in the U.S. Southeast.Mayo Clinic’s satellite facility in Jacksonville, along with a numberof major regional hospitals, promise a greater need for medical officespace. Health insurance companies are also continuing to benefitfrom the expansion of the medical community.
• In anticipation of a more active market, investors and developers arepositioning themselves to play a key role in the market expansionphase of the city’s office market.
• Office growth and development will continue to shift, with anexpanding population, toward the southern reaches of the cityand into St. Johns and Clay counties.
• Because of a relative lack of new office product in the past year,Jacksonville’s office rents are expected to remain stable in 2009.
INDUSTRIAL
• Two international ocean shipping carriers, Mitsui O.S.K. Lines andHanjin Shipping, respectively made a 30-year commitment to buildtheir East Coast hub in Jacksonville.
• The TraPac Container Terminal, Mitsui O.S.K. Lines’ new$220 million state-of-the-art facility, opened in January 2009.
• Hanjin Shipping finalized an agreement with the Jacksonville PortAuthority to develop a $360 million container terminal by 2012.
• The City of Jacksonville moved to privatize the development ofCecil Commerce Center, the massive Westside industrial park,in reaction to the port’s growth.
Industrial Outlook• The greatest space demand will be for bulk warehousing anddistribution, with new facilities from 300,000 SF to 500,000 SFbecoming the industry standard.
• Most of the city’s construction activity will occur on the Northsideand Westside, along the I-295 beltway, and increasingly in outlyingcounties where land cost is very reasonable.
• Jacksonville’s vacancy rates should remain in the 8% to 9% range,with new product delivery slowly absorbed due to the globaleconomic downturn and decline of imports. Asking rents willremain stable or decline slightly in the first half of 2009 inresponse to the delivery of additional speculative space.
• Distributors of durable goods and third party logistic companies willbe primary targets for the lease-up of new industrial product currentlyplanned or delivered in 2009.

KANSAS CITY, MO-KSCO L L I E R S I N T E RNAT I ONA L l U . S . R E A L E S TAT E R E V I EW 2 0 0 9
DOWNTOWN OFFICE
Inventory New Absorption Vacancy ClassA Cap Rate(SF) Supply (SF) (SF) Rate (%) Rent ($PSF) (%)
1999 9,980,000 241,000 333,000 10.3 21.30 –2000 9,980,000 0 20,000 10.1 21.70 10.002001 10,255,000 275,000 9,000 12.5 20.90 –2002 10,525,000 270,000 (299,000) 17.5 21.00 –2003 11,049,000 524,000 (167,000) 23.0 20.35 10.002004 10,925,000 (124,000) (369,000) 25.5 20.35 10.002005 11,295,000 370,000 220,000 26.0 20.50 9.252006 11,390,000 95,000 440,000 22.7 20.20 8.502007 11,193,000 (197,000) 4,000 21.3 20.40 7.002008 11,193,000 0 23,000 21.1 20.00 7.50
SUBURBAN OFFICE
Inventory New Absorption Vacancy ClassA Cap Rate(SF) Supply (SF) (SF) Rate (%) Rent ($PSF) (%)
1999 27,392,000 1,231,000 1,164,000 6.3 23.50 –2000 29,092,000 1,700,000 914,000 8.7 22.40 9.002001 30,679,000 1,587,000 159,000 12.9 22.10 10.002002 31,366,000 687,000 (1,561,000) 19.8 21.70 11.002003 32,030,000 664,000 433,000 20.1 21.60 10.002004 32,488,000 458,000 860,000 18.6 20.90 8.002005 32,865,000 377,000 846,000 16.9 20.10 8.002006 33,688,000 823,000 746,000 16.7 20.90 8.002007 34,253,000 565,000 1,358,000 14.1 22.40 7.002008 35,316,000 1,063,000 303,000 15.9 22.70 7.50
INDUSTRIAL
Inventory New Absorption Vacancy Warehouse Land Cap Rate(SF) Supply (SF) (SF) Rate (%) Rent ($PSF) ($PSF) (%)
1999 159,889,000 3,667,000 3,527,000 4.8 3.80 – –2000 165,204,000 5,315,000 4,185,000 5.4 4.40 – –2001 168,520,000 3,316,000 (2,690,000) 8.8 4.40 1.70 10.002002 171,239,000 2,719,000 1,782,000 9.2 3.80 1.70 9.752003 172,440,000 1,201,000 (769,000) 10.3 3.80 1.70 9.752004 174,222,000 1,782,000 3,884,000 9.0 3.80 1.80 9.002005 176,391,000 2,169,000 1,749,000 9.1 3.95 1.80 8.252006 177,893,000 1,502,000 3,108,000 8.1 4.10 2.00 7.002007 180,668,000 2,775,000 4,939,000 6.8 4.15 2.00 7.002008 183,847,000 3,179,000 3,408,000 6.6 4.35 2.25 7.60
METROPOLITAN INDICATORS – 2009
• Gross Metro Product Percent Change: 1.3
• Change in Total Employment (000): (11.1)Percent Change: (1.1)
• Unemployment Rate: 6.9
• Population (000): 2,009.2
Source: Moody’s Economy.com
29 CONTACT: Frazier Bell • [email protected] l RESEARCH: Carolyn Bagnall • [email protected]
OFFICE
• The Kansas City office market performed well in the first halfof 2008 but slowed significantly in the second half.
• The downtown market was stable in 2008, but its vacancy remainedhigher than the national average.
• In the suburban markets, new construction outpaced absorptionand as a result, vacancy edged upward.
• Suburban new construction completions totaled over 1 million SF.This was the greatest amount since 2001.
• Kansas City’s largest investment transaction of 2008 was the sale ofthe 650,000 SF Shook Hardy & Bacon building for $247 per SF.
• In the housing market, the average sale price of a home in Novemberwas $168,000. This was down 7.5% compared to one year earlier.
• Major growth companies in the Kansas City area included Burns& McDonnell, Cerner Corporation, and Garmin International.
• Downtown continued to undergo a major revitalization. SprintArena opened in 2007, and the Kansas City Live entertainmentdistrict opened in 2007 – 2008. The Kauffman Performing ArtsCenter was under construction.
Office Outlook• In 2009, construction will total 810,000 SF, but at least 65%will be occupied at completion.
• A regional emphasis on an Animal Health Corridor willgenerate growth for biosciences and agribusiness.
INDUSTRIAL
• Kansas City’s industrial market began 2008 with three strong quartersbut ended with negative net absorption in the final period.
• Overall industrial net absorption for the year totaled just over3.4 million SF.
• Modern distribution space accounted for 40% of the year’s increasedoccupancy.
• HRPT Properties Trust of Newton, Massachusetts purchaseda portfolio that included 800,000 SF of industrial space.
• During the last five years, most construction was in build-to-suitprojects. However, a speculative 600,000 SF distribution buildingwas completed at the end of the year.
• Development slowed and product under construction at the endof the year totaled just 431,000 SF.
• Three new intermodal facilities and recent distribution constructionmarked Kansas City’s transition to a prominent regional and nationaldistribution hub.
Industrial Outlook• The market is likely to be soft in the first half of 2009. A handfulof companies have already announced closures.
• On the plus side, Coleman Company announced it will placea 1.1 million SF distribution facility in Johnson County, to becompleted late in 2009.
• Both Ford and GM have automotive plants here, so KC will bevulnerable to changes in the auto industry.
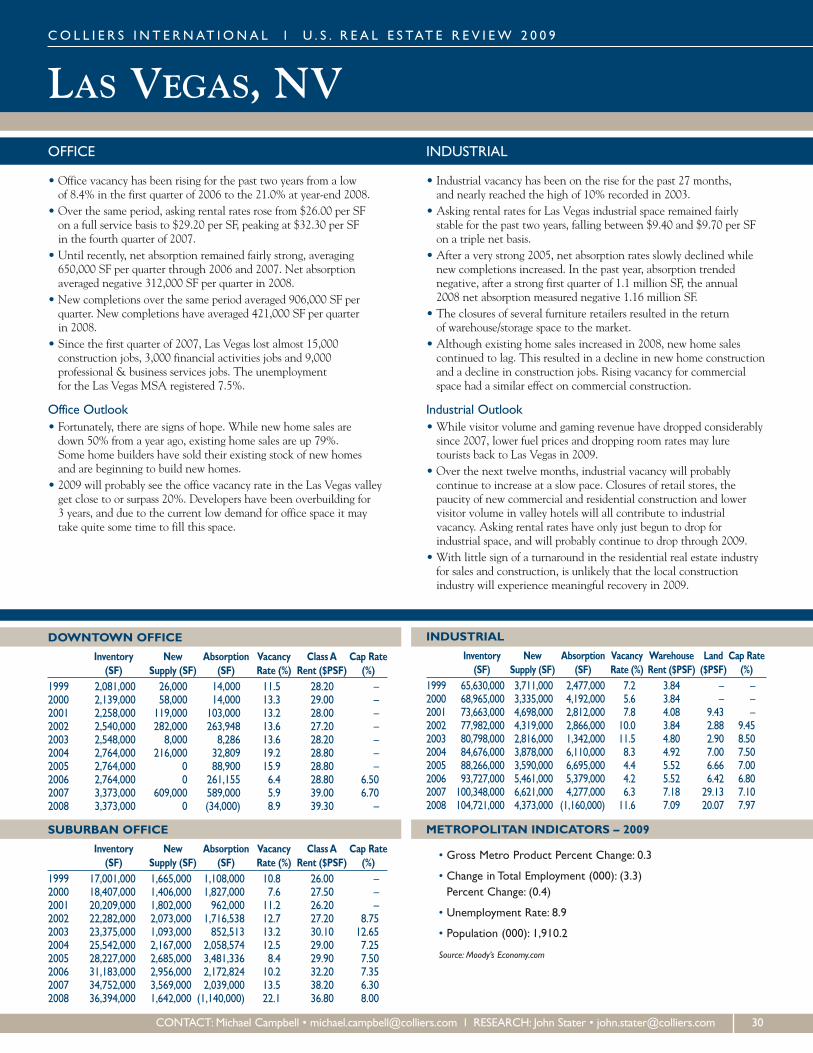
LAS VEGAS, NV
DOWNTOWN OFFICE
Inventory New Absorption Vacancy ClassA Cap Rate(SF) Supply (SF) (SF) Rate (%) Rent ($PSF) (%)
1999 2,081,000 26,000 14,000 11.5 28.20 –2000 2,139,000 58,000 14,000 13.3 29.00 –2001 2,258,000 119,000 103,000 13.2 28.00 –2002 2,540,000 282,000 263,948 13.6 27.20 –2003 2,548,000 8,000 8,286 13.6 28.20 –2004 2,764,000 216,000 32,809 19.2 28.80 –2005 2,764,000 0 88,900 15.9 28.80 –2006 2,764,000 0 261,155 6.4 28.80 6.502007 3,373,000 609,000 589,000 5.9 39.00 6.702008 3,373,000 0 (34,000) 8.9 39.30 –
SUBURBAN OFFICE
Inventory New Absorption Vacancy ClassA Cap Rate(SF) Supply (SF) (SF) Rate (%) Rent ($PSF) (%)
1999 17,001,000 1,665,000 1,108,000 10.8 26.00 –2000 18,407,000 1,406,000 1,827,000 7.6 27.50 –2001 20,209,000 1,802,000 962,000 11.2 26.20 –2002 22,282,000 2,073,000 1,716,538 12.7 27.20 8.752003 23,375,000 1,093,000 852,513 13.2 30.10 12.652004 25,542,000 2,167,000 2,058,574 12.5 29.00 7.252005 28,227,000 2,685,000 3,481,336 8.4 29.90 7.502006 31,183,000 2,956,000 2,172,824 10.2 32.20 7.352007 34,752,000 3,569,000 2,039,000 13.5 38.20 6.302008 36,394,000 1,642,000 (1,140,000) 22.1 36.80 8.00
INDUSTRIAL
Inventory New Absorption Vacancy Warehouse Land Cap Rate(SF) Supply (SF) (SF) Rate (%) Rent ($PSF) ($PSF) (%)
1999 65,630,000 3,711,000 2,477,000 7.2 3.84 – –2000 68,965,000 3,335,000 4,192,000 5.6 3.84 – –2001 73,663,000 4,698,000 2,812,000 7.8 4.08 9.43 –2002 77,982,000 4,319,000 2,866,000 10.0 3.84 2.88 9.452003 80,798,000 2,816,000 1,342,000 11.5 4.80 2.90 8.502004 84,676,000 3,878,000 6,110,000 8.3 4.92 7.00 7.502005 88,266,000 3,590,000 6,695,000 4.4 5.52 6.66 7.002006 93,727,000 5,461,000 5,379,000 4.2 5.52 6.42 6.802007 100,348,000 6,621,000 4,277,000 6.3 7.18 29.13 7.102008 104,721,000 4,373,000 (1,160,000) 11.6 7.09 20.07 7.97
METROPOLITAN INDICATORS – 2009
• Gross Metro Product Percent Change: 0.3
• Change in Total Employment (000): (3.3)Percent Change: (0.4)
• Unemployment Rate: 8.9
• Population (000): 1,910.2
Source: Moody’s Economy.com
CO L L I E R S I N T E RNAT I ONA L l U . S . R E A L E S TAT E R E V I EW 2 0 0 9
CONTACT:Michael Campbell • [email protected] l RESEARCH: John Stater • [email protected] 30
OFFICE
• Office vacancy has been rising for the past two years from a lowof 8.4% in the first quarter of 2006 to the 21.0% at year-end 2008.
• Over the same period, asking rental rates rose from $26.00 per SFon a full service basis to $29.20 per SF, peaking at $32.30 per SFin the fourth quarter of 2007.
• Until recently, net absorption remained fairly strong, averaging650,000 SF per quarter through 2006 and 2007. Net absorptionaveraged negative 312,000 SF per quarter in 2008.
• New completions over the same period averaged 906,000 SF perquarter. New completions have averaged 421,000 SF per quarterin 2008.
• Since the first quarter of 2007, Las Vegas lost almost 15,000construction jobs, 3,000 financial activities jobs and 9,000professional & business services jobs. The unemploymentfor the Las Vegas MSA registered 7.5%.
Office Outlook• Fortunately, there are signs of hope. While new home sales aredown 50% from a year ago, existing home sales are up 79%.Some home builders have sold their existing stock of new homesand are beginning to build new homes.
• 2009 will probably see the office vacancy rate in the Las Vegas valleyget close to or surpass 20%. Developers have been overbuilding for3 years, and due to the current low demand for office space it maytake quite some time to fill this space.
INDUSTRIAL
• Industrial vacancy has been on the rise for the past 27 months,and nearly reached the high of 10% recorded in 2003.
• Asking rental rates for Las Vegas industrial space remained fairlystable for the past two years, falling between $9.40 and $9.70 per SFon a triple net basis.
• After a very strong 2005, net absorption rates slowly declined whilenew completions increased. In the past year, absorption trendednegative, after a strong first quarter of 1.1 million SF, the annual2008 net absorption measured negative 1.16 million SF.
• The closures of several furniture retailers resulted in the returnof warehouse/storage space to the market.
• Although existing home sales increased in 2008, new home salescontinued to lag. This resulted in a decline in new home constructionand a decline in construction jobs. Rising vacancy for commercialspace had a similar effect on commercial construction.
Industrial Outlook• While visitor volume and gaming revenue have dropped considerablysince 2007, lower fuel prices and dropping room rates may luretourists back to Las Vegas in 2009.
• Over the next twelve months, industrial vacancy will probablycontinue to increase at a slow pace. Closures of retail stores, thepaucity of new commercial and residential construction and lowervisitor volume in valley hotels will all contribute to industrialvacancy. Asking rental rates have only just begun to drop forindustrial space, and will probably continue to drop through 2009.
• With little sign of a turnaround in the residential real estate industryfor sales and construction, is unlikely that the local constructionindustry will experience meaningful recovery in 2009.

LITTLE ROCK, ARCO L L I E R S I N T E RNAT I ONA L l U . S . R E A L E S TAT E R E V I EW 2 0 0 9
DOWNTOWN OFFICE
Inventory New Absorption Vacancy ClassA Cap Rate(SF) Supply (SF) (SF) Rate (%) Rent ($PSF) (%)
1999 5,826,000 – – – – –2000 5,826,000 – – – – –2001 5,826,000 – – – – –2002 5,826,000 – – – – –2003 5,826,000 – – – – –2004 5,879,000 53,000 149,000 14.7 14.10 –2005 5,717,000 (162,000) 173,000 15.2 14.20 8.752006 5,669,000 (48,000) 84,000 12.3 14.80 8.752007 5,669,000 0 120,000 10.9 15.20 8.752008 5,669,000 0 (47,000) 12.9 15.80 8.75
SUBURBAN OFFICE
Inventory New Absorption Vacancy ClassA Cap Rate(SF) Supply (SF) (SF) Rate (%) Rent ($PSF) (%)
1999 7,109,000 – – – – –2000 7,109,000 – – – – –2001 7,109,000 – – – – –2002 7,109,000 – – – – –2003 7,109,000 – – – – –2004 7,129,000 20,000 (39,000) 8.8 – –2005 7,189,000 60,000 117,000 8.8 17.90 –2006 7,232,000 43,000 80,000 9.8 17.90 9.002007 7,270,000 38,000 25,000 9.9 18.00 9.002008 7,270,000 0 (171,000) 12.7 18.30 9.00
INDUSTRIAL
Inventory New Absorption Vacancy Warehouse Land Cap Rate(SF) Supply (SF) (SF) Rate (%) Rent ($PSF) ($PSF) (%)
1999 – – – – – – –2000 – – – – – – –2001 – – – – – – –2002 – – – – – – –2003 – – – – – – –2004 16,833,000 215,000 327,000 12.5 3.80 2.50 8.002005 16,987,000 154,000 14,000 13.3 3.25 1.95 8.252006 16,987,000 0 449,000 10.3 3.25 2.00 8.252007 16,987,000 0 191,000 16.7 3.13 2.00 8.502008 17,305,000 318,000 621,000 12.9 3.25 2.48 9.00
METROPOLITAN INDICATORS – 2009
• Gross Metro Product Percent Change: 1.2
• Change in Total Employment (000): (0.4)Percent Change: (0.1)
• Unemployment Rate: 4.6
• Population (000): 682.4
Source: Moody’s Economy.com
31 CONTACT: Steve Lane • [email protected] l RESEARCH:Marolyn Dorman • [email protected]
OFFICE
• Fueling growth in Little Rock’s office market were thevocational/technical school, health care, and work-out law firmsectors. Growing companies included Bluecross/Blueshield andSouthwest Power Pool.
• The city benefited from new infrastructure initiatives includingthe redesign of the I-630/I-430 interchange.
• New office developments in 2008 included the Bank of Ozarks andthe Hotels and Engineering School at the University of ArkansasLittle Rock.
• There was an adequate supply of Class A and Class B office spacein the market, and the overall office vacancy rate registered 12.8%at year-end.
• Significant office sales transactions in the year included the sale ofthe Mountaire property and of the Fellowship Bible Church property.
• Office land sales prices were flat and the volume of saleswere stagnant.
INDUSTRIAL
• The wind energy industry was strong in Little Rock’s industrialmarket. Polymarin announced a $20 million capital investmentwith 830 new wind energy jobs at the Port of Little Rock.
• Additionally, Wind Water Technology, a supplier to Polymarin,decided to locate in the same facility at the Port of Little Rock.
• Polymarin, Wind Water Technology and LM Glasfiber positionedLittle Rock and the region as a major player in advancedmanufacturing for the wind energy industry representing over$1 billion in new capital investment since 2006.
• 40 year-old manufacturing facilities are plentiful in the Little Rockmarket area
• A large lease transaction occurring in the year was CHEP U.S.A.which leased 60,000 SF in Maumelle, Arkansas for a ten-year term.
• Little Rock’s industrial land prices remained flat with very littlesales activity occurring in the year.
Industrial Outlook• Man Industries purchased 155 acres south of the Port of Little Rock,spurring the construction of a $100 million facility that will employ250 people.
• Little or no space coming to market in 2009 due to high vacancy.

LOS ANGELES, CA
DOWNTOWN OFFICE
Inventory New Absorption Vacancy ClassA Cap Rate(SF) Supply (SF) (SF) Rate (%) Rent ($PSF) (%)
1999 31,369,000 (100,000) (622,000) 18.9 24.00 8.702000 31,369,000 0 (88,000) 19.4 24.50 9.002001 31,443,000 74,000 478,000 18.4 24.60 9.002002 31,443,000 0 (67,000) 19.5 24.00 9.002003 31,443,000 0 (86,000) 19.8 24.20 8.202004 31,443,000 0 162,000 20.3 25.20 7.502005 31,498,000 55,000 1,186,000 16.3 27.70 6.502006 31,498,000 0 48,000 15.8 34.40 6.002007 31,498,000 0 441,000 14.4 37.10 5.002008 31,598,000 100,000 (526,000) 14.8 37.60 5.00
SUBURBAN OFFICE
Inventory New Absorption Vacancy ClassA Cap Rate(SF) Supply (SF) (SF) Rate (%) Rent ($PSF) (%)
1999 141,120,000 5,788,000 6,654,000 11.9 28.00 9.002000 149,191,000 8,071,000 11,159,000 11.9 31.00 8.752001 152,131,000 2,940,000 (2,938,000) 14.2 30.30 8.752002 154,997,000 2,866,000 (1,864,000) 16.7 29.00 8.502003 156,348,000 1,351,000 1,252,000 17.0 28.30 7.752004 156,863,000 515,000 2,944,000 14.0 29.30 7.302005 157,657,000 794,000 5,042,000 10.7 30.10 6.402006 158,475,000 818,000 3,636,000 9.4 32.40 6.002007 160,318,000 1,843,000 287,000 10.5 40.20 5.102008 161,539,000 1,221,000 (2,024,000) 12.5 38.00 5.20
INDUSTRIAL
Inventory New Absorption Vacancy Warehouse Land Cap Rate(SF) Supply (SF) (SF) Rate (%) Rent ($PSF) ($PSF) (%)
1999 658,448,000 26,408,000 38,090,000 5.4 6.60 – 9.102000 693,485,000 35,037,000 44,337,000 4.4 6.10 – 9.302001 723,289,000 29,804,000 14,628,000 6.3 6.60 5.00 8.502002 731,512,000 8,223,000 6,233,000 6.4 7.00 12.00 8.252003 738,619,000 7,107,000 11,085,000 3.6 6.40 13.00 7.752004 745,502,000 6,883,000 10,951,000 2.8 6.50 13.80 7.602005 751,975,000 6,473,000 11,075,000 2.7 6.85 25.00 6.502006 756,813,000 4,838,000 5,037,000 2.6 7.67 30.00 6.202007 760,658,000 3,845,000 897,000 3.0 8.04 30.00 6.302008 763,126,000 2,468,000 (5,796,000) 3.8 7.32 30.50 6.20
METROPOLITAN INDICATORS – 2009
• Gross Metro Product Percent Change: (3.2)
• Change in Total Employment (000): (127.8)Percent Change: (3.1)
• Unemployment Rate: 10.1
• Population (000): 9,942.6
Source: Moody’s Economy.com
CO L L I E R S I N T E RNAT I ONA L l U . S . R E A L E S TAT E R E V I EW 2 0 0 9
CONTACT:Martin Pupil • [email protected] l RESEARCH: Susan Bloomfield • [email protected] 32
OFFICE
• At year-end 2008, the overall vacancy rate in Los Angeles Countywas 12.9%. Submarket vacancy rates ranged from 9% in WestLos Angeles to 14% in the South Bay.
• Asking rental rates peaked in early 2008 and have been fallingever since.
• Net absorption in 2008 was approximately negative 2.5 million SFas the downturn in the mortgage finance industry spread toother sectors.
• As a more economically diverse area now than it was in theearly 1990s when the county was heavily aerospace-centric, theLos Angeles office market is not expected to see office vacancieshit the same highs as in the 1990s.
• County voters passed Measure R in November authorizing a half-centsales tax countywide to finance approximately $40 billion in localtransportation projects over the next 30 years.
Office Outlook• Asking rental rates are expected to decline through most of 2009as the economy is forecast to weaken further.
• The much-anticipated opening of the second phase of AEG’s L.A.Live project and the already constituted mass transit infrastructure inDTLA is expected to keep tenant interest in downtown Los Angeleshigh despite the economic downturn.
• Cap rates are expected to increase even higher from the recordlows of the past few years as distressed property sales become morecommon in 2009.
• It is expected that most proposed office projects will be shelvedindefinitely as the credit markets remain in a state of turmoil.
INDUSTRIAL
• Los Angeles’ total vacancy rate increased from 3.0% at year-end 2007to 3.8% at year-end 2008. Submarket vacancy rates ranged from 3.1%in the San Fernando Valley to 4.9% in the San Gabriel Valley.
• Industrial rents dropped since the beginning of 2008 from $8.04 perSF to $7.32 per square foot.
• Construction materials and furniture facilities were the loss leadersin giving up the warehouse space, but as the economy deteriorated,weakness appeared in almost all business segments. Only businessesin storage space and food processing showed some growth.
• Construction activity was down 62% since the end of 2007.Even projects that were expected to move forward have beenplaced on permanent hold as the economy worsened.
• A drop off in commodity prices that hit all time highs in the beginningof the third quarter gave many businesses a much needed cost break,however, the lack of credit availability overshadowed any savings.
Industrial Outlook• Vacancy rates are expected to rise through 2009. As buildings sit onthe market longer, Los Angeles will see rental rates fall faster than inrecent quarters. Increases in sublease space will only help acceleratethe fall in asking rents.
• Frozen credit markets and a contracting economy caused manycompanies to scale back space, especially in the larger asset classof over 100,000 SF. This is expected to accelerate in the near termand will continue to put upward pressure on vacancy rates.
• A flight to quality buildings in desirable locations by the ports mayhelp mitigate any large increases to vacancy in areas like South Bayand Central Los Angeles, but inland areas like the San Gabriel Valleywill remain weaker in 2009.
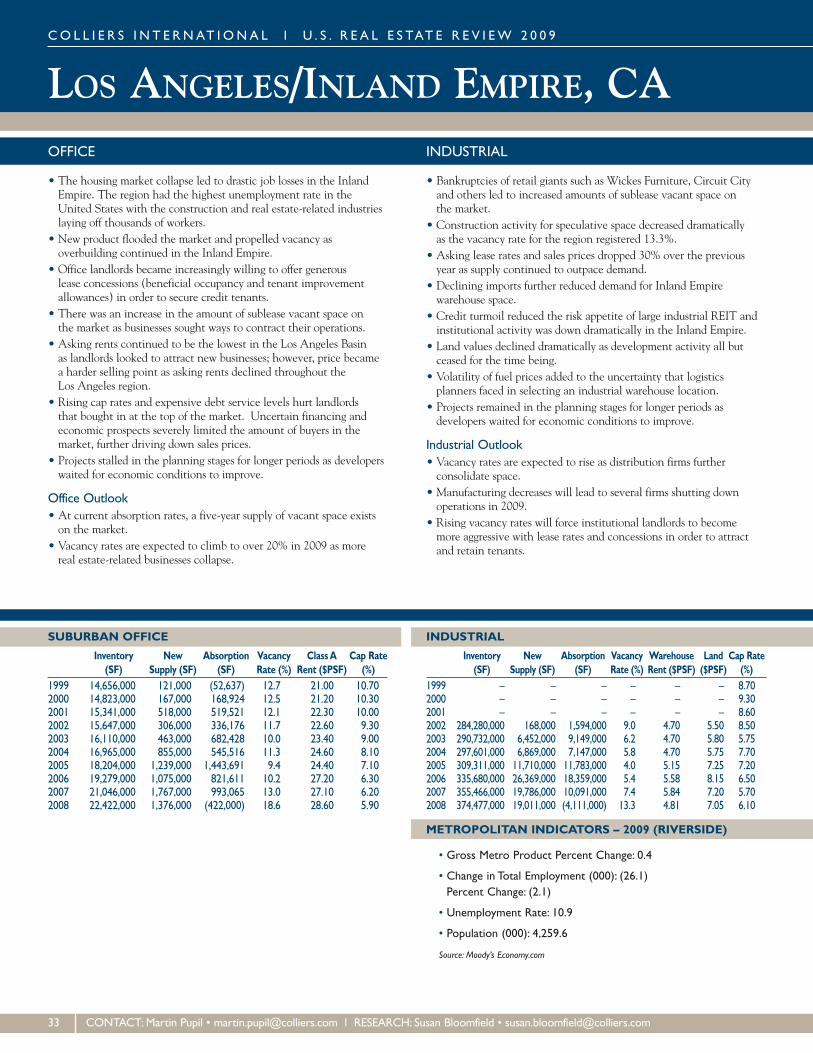
LOS ANGELES/INLAND EMPIRE, CACO L L I E R S I N T E RNAT I ONA L l U . S . R E A L E S TAT E R E V I EW 2 0 0 9
SUBURBAN OFFICE
Inventory New Absorption Vacancy ClassA Cap Rate(SF) Supply (SF) (SF) Rate (%) Rent ($PSF) (%)
1999 14,656,000 121,000 (52,637) 12.7 21.00 10.702000 14,823,000 167,000 168,924 12.5 21.20 10.302001 15,341,000 518,000 519,521 12.1 22.30 10.002002 15,647,000 306,000 336,176 11.7 22.60 9.302003 16,110,000 463,000 682,428 10.0 23.40 9.002004 16,965,000 855,000 545,516 11.3 24.60 8.102005 18,204,000 1,239,000 1,443,691 9.4 24.40 7.102006 19,279,000 1,075,000 821,611 10.2 27.20 6.302007 21,046,000 1,767,000 993,065 13.0 27.10 6.202008 22,422,000 1,376,000 (422,000) 18.6 28.60 5.90
INDUSTRIAL
Inventory New Absorption Vacancy Warehouse Land Cap Rate(SF) Supply (SF) (SF) Rate (%) Rent ($PSF) ($PSF) (%)
1999 – – – – – – 8.702000 – – – – – – 9.302001 – – – – – – 8.602002 284,280,000 168,000 1,594,000 9.0 4.70 5.50 8.502003 290,732,000 6,452,000 9,149,000 6.2 4.70 5.80 5.752004 297,601,000 6,869,000 7,147,000 5.8 4.70 5.75 7.702005 309,311,000 11,710,000 11,783,000 4.0 5.15 7.25 7.202006 335,680,000 26,369,000 18,359,000 5.4 5.58 8.15 6.502007 355,466,000 19,786,000 10,091,000 7.4 5.84 7.20 5.702008 374,477,000 19,011,000 (4,111,000) 13.3 4.81 7.05 6.10
METROPOLITAN INDICATORS – 2009 (RIVERSIDE)
• Gross Metro Product Percent Change: 0.4
• Change in Total Employment (000): (26.1)Percent Change: (2.1)
• Unemployment Rate: 10.9
• Population (000): 4,259.6
Source: Moody’s Economy.com
33 CONTACT:Martin Pupil • [email protected] l RESEARCH: Susan Bloomfield • [email protected]
OFFICE
• The housing market collapse led to drastic job losses in the InlandEmpire. The region had the highest unemployment rate in theUnited States with the construction and real estate-related industrieslaying off thousands of workers.
• New product flooded the market and propelled vacancy asoverbuilding continued in the Inland Empire.
• Office landlords became increasingly willing to offer generouslease concessions (beneficial occupancy and tenant improvementallowances) in order to secure credit tenants.
• There was an increase in the amount of sublease vacant space onthe market as businesses sought ways to contract their operations.
• Asking rents continued to be the lowest in the Los Angeles Basinas landlords looked to attract new businesses; however, price becamea harder selling point as asking rents declined throughout theLos Angeles region.
• Rising cap rates and expensive debt service levels hurt landlordsthat bought in at the top of the market. Uncertain financing andeconomic prospects severely limited the amount of buyers in themarket, further driving down sales prices.
• Projects stalled in the planning stages for longer periods as developerswaited for economic conditions to improve.
Office Outlook• At current absorption rates, a five-year supply of vacant space existson the market.
• Vacancy rates are expected to climb to over 20% in 2009 as morereal estate-related businesses collapse.
INDUSTRIAL
• Bankruptcies of retail giants such as Wickes Furniture, Circuit Cityand others led to increased amounts of sublease vacant space onthe market.
• Construction activity for speculative space decreased dramaticallyas the vacancy rate for the region registered 13.3%.
• Asking lease rates and sales prices dropped 30% over the previousyear as supply continued to outpace demand.
• Declining imports further reduced demand for Inland Empirewarehouse space.
• Credit turmoil reduced the risk appetite of large industrial REIT andinstitutional activity was down dramatically in the Inland Empire.
• Land values declined dramatically as development activity all butceased for the time being.
• Volatility of fuel prices added to the uncertainty that logisticsplanners faced in selecting an industrial warehouse location.
• Projects remained in the planning stages for longer periods asdevelopers waited for economic conditions to improve.
Industrial Outlook• Vacancy rates are expected to rise as distribution firms furtherconsolidate space.
• Manufacturing decreases will lead to several firms shutting downoperations in 2009.
• Rising vacancy rates will force institutional landlords to becomemore aggressive with lease rates and concessions in order to attractand retain tenants.
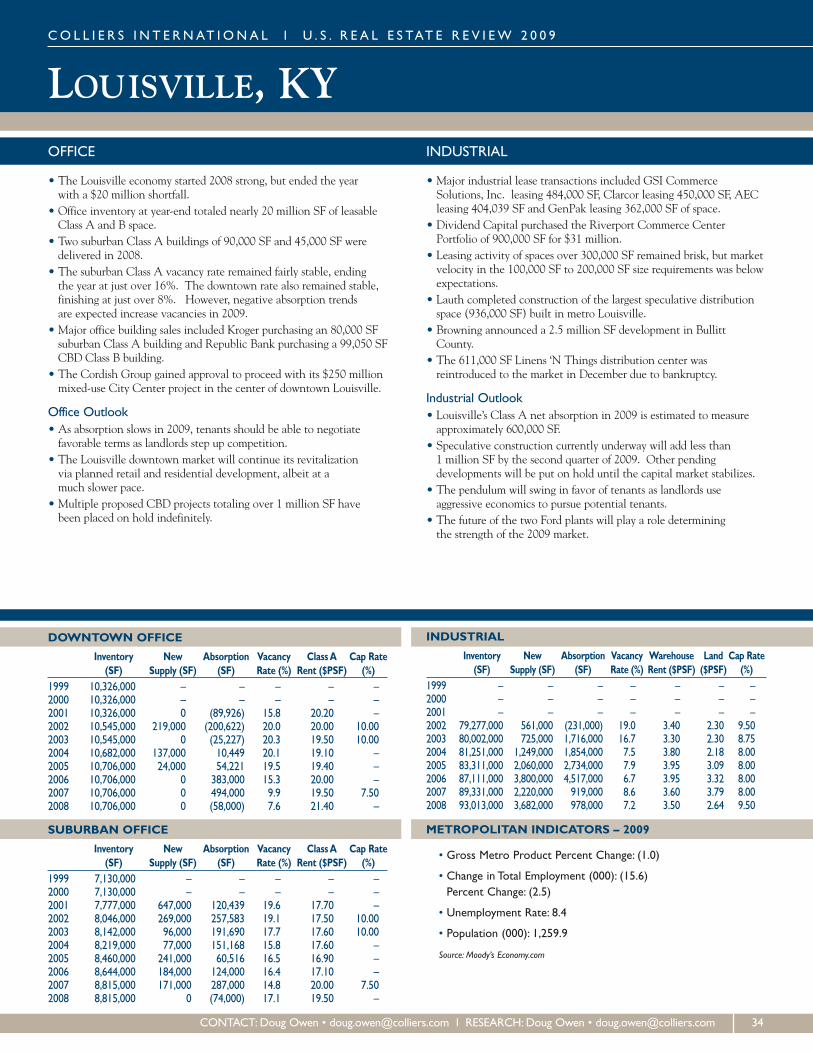
LOUISVILLE, KYCO L L I E R S I N T E RNAT I ONA L l U . S . R E A L E S TAT E R E V I EW 2 0 0 9
CONTACT:Doug Owen • [email protected] l RESEARCH:Doug Owen • [email protected] 34
OFFICE
• The Louisville economy started 2008 strong, but ended the yearwith a $20 million shortfall.
• Office inventory at year-end totaled nearly 20 million SF of leasableClass A and B space.
• Two suburban Class A buildings of 90,000 SF and 45,000 SF weredelivered in 2008.
• The suburban Class A vacancy rate remained fairly stable, endingthe year at just over 16%. The downtown rate also remained stable,finishing at just over 8%. However, negative absorption trendsare expected increase vacancies in 2009.
• Major office building sales included Kroger purchasing an 80,000 SFsuburban Class A building and Republic Bank purchasing a 99,050 SFCBD Class B building.
• The Cordish Group gained approval to proceed with its $250 millionmixed-use City Center project in the center of downtown Louisville.
Office Outlook• As absorption slows in 2009, tenants should be able to negotiatefavorable terms as landlords step up competition.
• The Louisville downtown market will continue its revitalizationvia planned retail and residential development, albeit at amuch slower pace.
• Multiple proposed CBD projects totaling over 1 million SF havebeen placed on hold indefinitely.
INDUSTRIAL
• Major industrial lease transactions included GSI CommerceSolutions, Inc. leasing 484,000 SF, Clarcor leasing 450,000 SF, AECleasing 404,039 SF and GenPak leasing 362,000 SF of space.
• Dividend Capital purchased the Riverport Commerce CenterPortfolio of 900,000 SF for $31 million.
• Leasing activity of spaces over 300,000 SF remained brisk, but marketvelocity in the 100,000 SF to 200,000 SF size requirements was belowexpectations.
• Lauth completed construction of the largest speculative distributionspace (936,000 SF) built in metro Louisville.
• Browning announced a 2.5 million SF development in BullittCounty.
• The 611,000 SF Linens ‘N Things distribution center wasreintroduced to the market in December due to bankruptcy.
Industrial Outlook• Louisville’s Class A net absorption in 2009 is estimated to measureapproximately 600,000 SF.
• Speculative construction currently underway will add less than1 million SF by the second quarter of 2009. Other pendingdevelopments will be put on hold until the capital market stabilizes.
• The pendulum will swing in favor of tenants as landlords useaggressive economics to pursue potential tenants.
• The future of the two Ford plants will play a role determiningthe strength of the 2009 market.
DOWNTOWN OFFICE
Inventory New Absorption Vacancy ClassA Cap Rate(SF) Supply (SF) (SF) Rate (%) Rent ($PSF) (%)
1999 10,326,000 – – – – –2000 10,326,000 – – – – –2001 10,326,000 0 (89,926) 15.8 20.20 –2002 10,545,000 219,000 (200,622) 20.0 20.00 10.002003 10,545,000 0 (25,227) 20.3 19.50 10.002004 10,682,000 137,000 10,449 20.1 19.10 –2005 10,706,000 24,000 54,221 19.5 19.40 –2006 10,706,000 0 383,000 15.3 20.00 –2007 10,706,000 0 494,000 9.9 19.50 7.502008 10,706,000 0 (58,000) 7.6 21.40 –
SUBURBAN OFFICE
Inventory New Absorption Vacancy ClassA Cap Rate(SF) Supply (SF) (SF) Rate (%) Rent ($PSF) (%)
1999 7,130,000 – – – – –2000 7,130,000 – – – – –2001 7,777,000 647,000 120,439 19.6 17.70 –2002 8,046,000 269,000 257,583 19.1 17.50 10.002003 8,142,000 96,000 191,690 17.7 17.60 10.002004 8,219,000 77,000 151,168 15.8 17.60 –2005 8,460,000 241,000 60,516 16.5 16.90 –2006 8,644,000 184,000 124,000 16.4 17.10 –2007 8,815,000 171,000 287,000 14.8 20.00 7.502008 8,815,000 0 (74,000) 17.1 19.50 –
INDUSTRIAL
Inventory New Absorption Vacancy Warehouse Land Cap Rate(SF) Supply (SF) (SF) Rate (%) Rent ($PSF) ($PSF) (%)
1999 – – – – – – –2000 – – – – – – –2001 – – – – – – –2002 79,277,000 561,000 (231,000) 19.0 3.40 2.30 9.502003 80,002,000 725,000 1,716,000 16.7 3.30 2.30 8.752004 81,251,000 1,249,000 1,854,000 7.5 3.80 2.18 8.002005 83,311,000 2,060,000 2,734,000 7.9 3.95 3.09 8.002006 87,111,000 3,800,000 4,517,000 6.7 3.95 3.32 8.002007 89,331,000 2,220,000 919,000 8.6 3.60 3.79 8.002008 93,013,000 3,682,000 978,000 7.2 3.50 2.64 9.50
METROPOLITAN INDICATORS – 2009
• Gross Metro Product Percent Change: (1.0)
• Change in Total Employment (000): (15.6)Percent Change: (2.5)
• Unemployment Rate: 8.4
• Population (000): 1,259.9
Source: Moody’s Economy.com
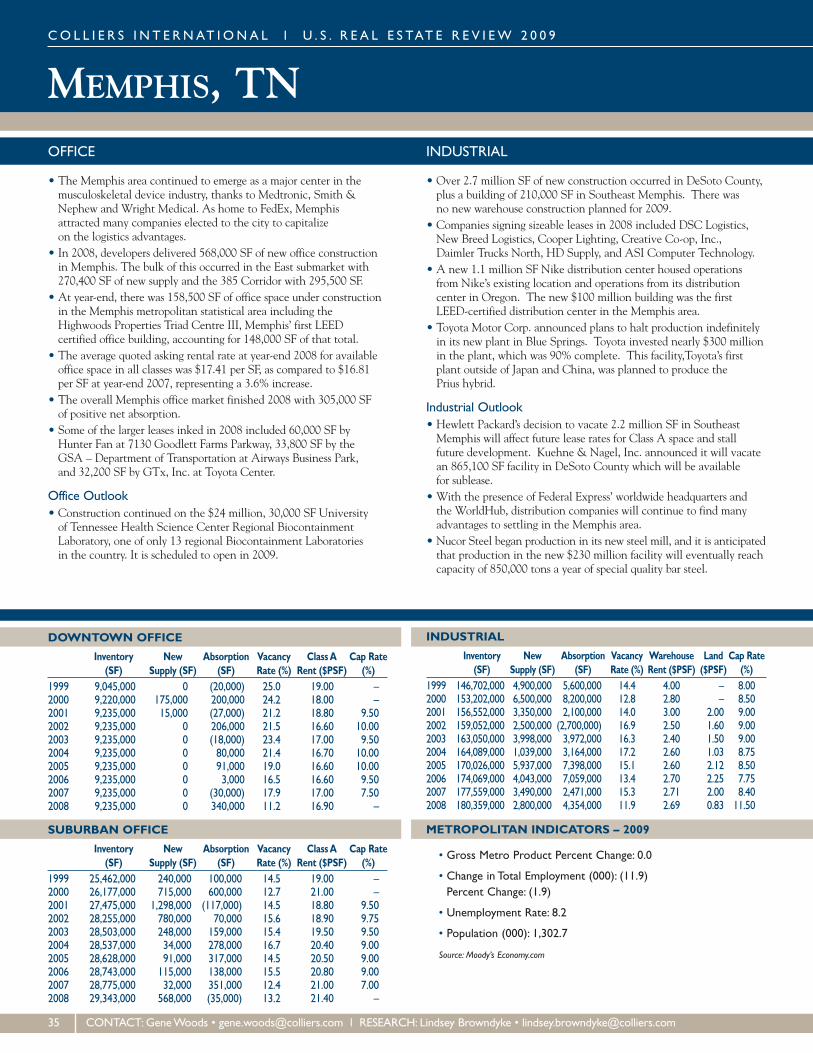
MEMPHIS, TNCO L L I E R S I N T E RNAT I ONA L l U . S . R E A L E S TAT E R E V I EW 2 0 0 9
DOWNTOWN OFFICE
Inventory New Absorption Vacancy ClassA Cap Rate(SF) Supply (SF) (SF) Rate (%) Rent ($PSF) (%)
1999 9,045,000 0 (20,000) 25.0 19.00 –2000 9,220,000 175,000 200,000 24.2 18.00 –2001 9,235,000 15,000 (27,000) 21.2 18.80 9.502002 9,235,000 0 206,000 21.5 16.60 10.002003 9,235,000 0 (18,000) 23.4 17.00 9.502004 9,235,000 0 80,000 21.4 16.70 10.002005 9,235,000 0 91,000 19.0 16.60 10.002006 9,235,000 0 3,000 16.5 16.60 9.502007 9,235,000 0 (30,000) 17.9 17.00 7.502008 9,235,000 0 340,000 11.2 16.90 –
SUBURBAN OFFICE
Inventory New Absorption Vacancy ClassA Cap Rate(SF) Supply (SF) (SF) Rate (%) Rent ($PSF) (%)
1999 25,462,000 240,000 100,000 14.5 19.00 –2000 26,177,000 715,000 600,000 12.7 21.00 –2001 27,475,000 1,298,000 (117,000) 14.5 18.80 9.502002 28,255,000 780,000 70,000 15.6 18.90 9.752003 28,503,000 248,000 159,000 15.4 19.50 9.502004 28,537,000 34,000 278,000 16.7 20.40 9.002005 28,628,000 91,000 317,000 14.5 20.50 9.002006 28,743,000 115,000 138,000 15.5 20.80 9.002007 28,775,000 32,000 351,000 12.4 21.00 7.002008 29,343,000 568,000 (35,000) 13.2 21.40 –
INDUSTRIAL
Inventory New Absorption Vacancy Warehouse Land Cap Rate(SF) Supply (SF) (SF) Rate (%) Rent ($PSF) ($PSF) (%)
1999 146,702,000 4,900,000 5,600,000 14.4 4.00 – 8.002000 153,202,000 6,500,000 8,200,000 12.8 2.80 – 8.502001 156,552,000 3,350,000 2,100,000 14.0 3.00 2.00 9.002002 159,052,000 2,500,000 (2,700,000) 16.9 2.50 1.60 9.002003 163,050,000 3,998,000 3,972,000 16.3 2.40 1.50 9.002004 164,089,000 1,039,000 3,164,000 17.2 2.60 1.03 8.752005 170,026,000 5,937,000 7,398,000 15.1 2.60 2.12 8.502006 174,069,000 4,043,000 7,059,000 13.4 2.70 2.25 7.752007 177,559,000 3,490,000 2,471,000 15.3 2.71 2.00 8.402008 180,359,000 2,800,000 4,354,000 11.9 2.69 0.83 11.50
METROPOLITAN INDICATORS – 2009
• Gross Metro Product Percent Change: 0.0
• Change in Total Employment (000): (11.9)Percent Change: (1.9)
• Unemployment Rate: 8.2
• Population (000): 1,302.7
Source: Moody’s Economy.com
35 CONTACT: GeneWoods • [email protected] l RESEARCH: Lindsey Browndyke • [email protected]
OFFICE
• The Memphis area continued to emerge as a major center in themusculoskeletal device industry, thanks to Medtronic, Smith &Nephew and Wright Medical. As home to FedEx, Memphisattracted many companies elected to the city to capitalizeon the logistics advantages.
• In 2008, developers delivered 568,000 SF of new office constructionin Memphis. The bulk of this occurred in the East submarket with270,400 SF of new supply and the 385 Corridor with 295,500 SF.
• At year-end, there was 158,500 SF of office space under constructionin the Memphis metropolitan statistical area including theHighwoods Properties Triad Centre III, Memphis’ first LEEDcertified office building, accounting for 148,000 SF of that total.
• The average quoted asking rental rate at year-end 2008 for availableoffice space in all classes was $17.41 per SF, as compared to $16.81per SF at year-end 2007, representing a 3.6% increase.
• The overall Memphis office market finished 2008 with 305,000 SFof positive net absorption.
• Some of the larger leases inked in 2008 included 60,000 SF byHunter Fan at 7130 Goodlett Farms Parkway, 33,800 SF by theGSA – Department of Transportation at Airways Business Park,and 32,200 SF by GTx, Inc. at Toyota Center.
Office Outlook• Construction continued on the $24 million, 30,000 SF Universityof Tennessee Health Science Center Regional BiocontainmentLaboratory, one of only 13 regional Biocontainment Laboratoriesin the country. It is scheduled to open in 2009.
INDUSTRIAL
• Over 2.7 million SF of new construction occurred in DeSoto County,plus a building of 210,000 SF in Southeast Memphis. There wasno new warehouse construction planned for 2009.
• Companies signing sizeable leases in 2008 included DSC Logistics,New Breed Logistics, Cooper Lighting, Creative Co-op, Inc.,Daimler Trucks North, HD Supply, and ASI Computer Technology.
• A new 1.1 million SF Nike distribution center housed operationsfrom Nike’s existing location and operations from its distributioncenter in Oregon. The new $100 million building was the firstLEED-certified distribution center in the Memphis area.
• Toyota Motor Corp. announced plans to halt production indefinitelyin its new plant in Blue Springs. Toyota invested nearly $300 millionin the plant, which was 90% complete. This facility,Toyota’s firstplant outside of Japan and China, was planned to produce thePrius hybrid.
Industrial Outlook• Hewlett Packard’s decision to vacate 2.2 million SF in SoutheastMemphis will affect future lease rates for Class A space and stallfuture development. Kuehne & Nagel, Inc. announced it will vacatean 865,100 SF facility in DeSoto County which will be availablefor sublease.
• With the presence of Federal Express’ worldwide headquarters andthe WorldHub, distribution companies will continue to find manyadvantages to settling in the Memphis area.
• Nucor Steel began production in its new steel mill, and it is anticipatedthat production in the new $230 million facility will eventually reachcapacity of 850,000 tons a year of special quality bar steel.
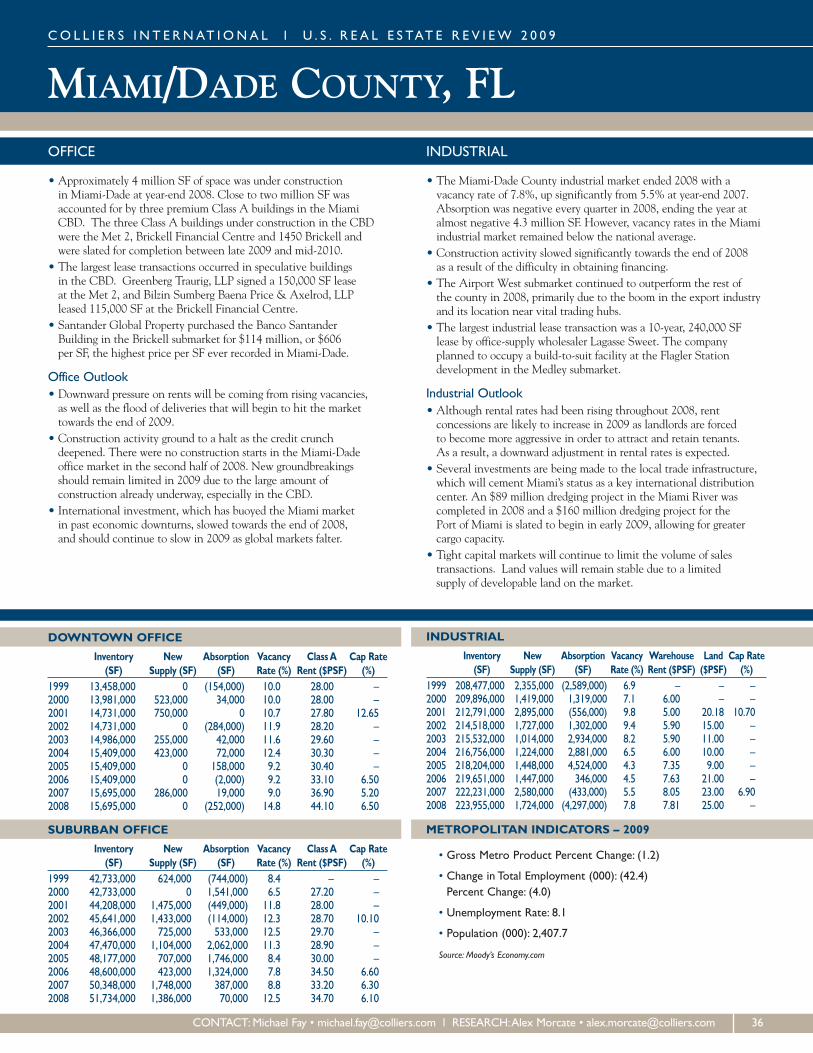
MIAMI/DADE COUNTY, FL
DOWNTOWN OFFICE
Inventory New Absorption Vacancy ClassA Cap Rate(SF) Supply (SF) (SF) Rate (%) Rent ($PSF) (%)
1999 13,458,000 0 (154,000) 10.0 28.00 –2000 13,981,000 523,000 34,000 10.0 28.00 –2001 14,731,000 750,000 0 10.7 27.80 12.652002 14,731,000 0 (284,000) 11.9 28.20 –2003 14,986,000 255,000 42,000 11.6 29.60 –2004 15,409,000 423,000 72,000 12.4 30.30 –2005 15,409,000 0 158,000 9.2 30.40 –2006 15,409,000 0 (2,000) 9.2 33.10 6.502007 15,695,000 286,000 19,000 9.0 36.90 5.202008 15,695,000 0 (252,000) 14.8 44.10 6.50
SUBURBAN OFFICE
Inventory New Absorption Vacancy ClassA Cap Rate(SF) Supply (SF) (SF) Rate (%) Rent ($PSF) (%)
1999 42,733,000 624,000 (744,000) 8.4 – –2000 42,733,000 0 1,541,000 6.5 27.20 –2001 44,208,000 1,475,000 (449,000) 11.8 28.00 –2002 45,641,000 1,433,000 (114,000) 12.3 28.70 10.102003 46,366,000 725,000 533,000 12.5 29.70 –2004 47,470,000 1,104,000 2,062,000 11.3 28.90 –2005 48,177,000 707,000 1,746,000 8.4 30.00 –2006 48,600,000 423,000 1,324,000 7.8 34.50 6.602007 50,348,000 1,748,000 387,000 8.8 33.20 6.302008 51,734,000 1,386,000 70,000 12.5 34.70 6.10
INDUSTRIAL
Inventory New Absorption Vacancy Warehouse Land Cap Rate(SF) Supply (SF) (SF) Rate (%) Rent ($PSF) ($PSF) (%)
1999 208,477,000 2,355,000 (2,589,000) 6.9 – – –2000 209,896,000 1,419,000 1,319,000 7.1 6.00 – –2001 212,791,000 2,895,000 (556,000) 9.8 5.00 20.18 10.702002 214,518,000 1,727,000 1,302,000 9.4 5.90 15.00 –2003 215,532,000 1,014,000 2,934,000 8.2 5.90 11.00 –2004 216,756,000 1,224,000 2,881,000 6.5 6.00 10.00 –2005 218,204,000 1,448,000 4,524,000 4.3 7.35 9.00 –2006 219,651,000 1,447,000 346,000 4.5 7.63 21.00 –2007 222,231,000 2,580,000 (433,000) 5.5 8.05 23.00 6.902008 223,955,000 1,724,000 (4,297,000) 7.8 7.81 25.00 –
METROPOLITAN INDICATORS – 2009
• Gross Metro Product Percent Change: (1.2)
• Change in Total Employment (000): (42.4)Percent Change: (4.0)
• Unemployment Rate: 8.1
• Population (000): 2,407.7
Source: Moody’s Economy.com
CO L L I E R S I N T E RNAT I ONA L l U . S . R E A L E S TAT E R E V I EW 2 0 0 9
CONTACT:Michael Fay • [email protected] l RESEARCH:Alex Morcate • [email protected] 36
OFFICE
• Approximately 4 million SF of space was under constructionin Miami-Dade at year-end 2008. Close to two million SF wasaccounted for by three premium Class A buildings in the MiamiCBD. The three Class A buildings under construction in the CBDwere the Met 2, Brickell Financial Centre and 1450 Brickell andwere slated for completion between late 2009 and mid-2010.
• The largest lease transactions occurred in speculative buildingsin the CBD. Greenberg Traurig, LLP signed a 150,000 SF leaseat the Met 2, and Bilzin Sumberg Baena Price & Axelrod, LLPleased 115,000 SF at the Brickell Financial Centre.
• Santander Global Property purchased the Banco SantanderBuilding in the Brickell submarket for $114 million, or $606per SF, the highest price per SF ever recorded in Miami-Dade.
Office Outlook• Downward pressure on rents will be coming from rising vacancies,as well as the flood of deliveries that will begin to hit the markettowards the end of 2009.
• Construction activity ground to a halt as the credit crunchdeepened. There were no construction starts in the Miami-Dadeoffice market in the second half of 2008. New groundbreakingsshould remain limited in 2009 due to the large amount ofconstruction already underway, especially in the CBD.
• International investment, which has buoyed the Miami marketin past economic downturns, slowed towards the end of 2008,and should continue to slow in 2009 as global markets falter.
INDUSTRIAL
• The Miami-Dade County industrial market ended 2008 with avacancy rate of 7.8%, up significantly from 5.5% at year-end 2007.Absorption was negative every quarter in 2008, ending the year atalmost negative 4.3 million SF. However, vacancy rates in the Miamiindustrial market remained below the national average.
• Construction activity slowed significantly towards the end of 2008as a result of the difficulty in obtaining financing.
• The Airport West submarket continued to outperform the rest ofthe county in 2008, primarily due to the boom in the export industryand its location near vital trading hubs.
• The largest industrial lease transaction was a 10-year, 240,000 SFlease by office-supply wholesaler Lagasse Sweet. The companyplanned to occupy a build-to-suit facility at the Flagler Stationdevelopment in the Medley submarket.
Industrial Outlook• Although rental rates had been rising throughout 2008, rentconcessions are likely to increase in 2009 as landlords are forcedto become more aggressive in order to attract and retain tenants.As a result, a downward adjustment in rental rates is expected.
• Several investments are being made to the local trade infrastructure,which will cement Miami’s status as a key international distributioncenter. An $89 million dredging project in the Miami River wascompleted in 2008 and a $160 million dredging project for thePort of Miami is slated to begin in early 2009, allowing for greatercargo capacity.
• Tight capital markets will continue to limit the volume of salestransactions. Land values will remain stable due to a limitedsupply of developable land on the market.

MILWAUKEE, WICO L L I E R S I N T E RNAT I ONA L l U . S . R E A L E S TAT E R E V I EW 2 0 0 9
DOWNTOWN OFFICE
Inventory New Absorption Vacancy ClassA Cap Rate(SF) Supply (SF) (SF) Rate (%) Rent ($PSF) (%)
1999 9,798,000 167,000 105,000 15.7 – –2000 9,913,000 115,000 74,000 15.0 23.50 9.002001 9,913,000 0 (976,000) 14.5 23.00 10.002002 10,108,000 195,000 250,000 9.3 23.00 10.002003 10,629,000 521,000 1,003,000 10.7 23.00 9.502004 10,629,000 0 121,000 9.9 22.00 9.502005 10,629,000 0 (1,029,000) 11.9 22.00 7.502006 10,629,000 0 494,000 14.1 22.00 7.502007 10,629,000 0 322,000 14.7 22.00 8.002008 10,629,000 0 (177,000) 17.5 22.00 8.00
SUBURBAN OFFICE
Inventory New Absorption Vacancy ClassA Cap Rate(SF) Supply (SF) (SF) Rate (%) Rent ($PSF) (%)
1999 14,612,000 550,000 110,000 10.9 – –2000 15,129,000 517,000 318,000 9.1 21.50 9.002001 15,723,000 594,000 371,000 1.5 21.00 10.002002 15,929,000 206,000 0 11.9 21.00 10.002003 16,429,000 500,000 918,000 10.8 21.00 9.502004 16,929,000 500,000 1,398,000 8.3 21.00 9.502005 16,951,000 22,000 (341,000) 8.9 21.00 8.002006 16,951,000 0 16,000 12.0 21.00 8.002007 17,825,000 874,000 1,275,000 11.3 21.00 8.002008 17,825,000 0 (247,000) 16.4 21.00 8.00
INDUSTRIAL
Inventory New Absorption Vacancy Warehouse Land Cap Rate(SF) Supply (SF) (SF) Rate (%) Rent ($PSF) ($PSF) (%)
1999 253,833,000 2,000,000 3,750,000 2.9 4.00 – –2000 256,833,000 3,000,000 4,000,000 3.7 4.00 – –2001 259,333,000 2,500,000 1,200,000 6.0 4.00 1.75 10.502002 260,833,000 1,500,000 (1,500,000) 7.7 4.00 2.05 10.102003 266,153,000 5,320,000 14,376,000 6.7 4.30 2.00 9.502004 272,641,000 6,488,000 4,933,000 7.1 4.30 2.25 9.252005 273,680,000 1,039,000 537,000 7.2 4.20 1.72 8.502006 276,530,000 2,850,000 (650,000) 7.7 4.20 1.85 8.252007 278,830,000 2,300,000 1,300,000 7.4 4.30 1.75 8.502008 279,700,000 870,000 (2,150,000) 7.9 4.25 2.50 8.75
METROPOLITAN INDICATORS – 2009
• Gross Metro Product Percent Change: 1.5
• Change in Total Employment (000): (11.9)Percent Change: (1.4)
• Unemployment Rate: 5.2
• Population (000): 1,551.3
Source: Moody’s Economy.com
37 CONTACT:David Barry • [email protected] l RESEARCH:Nicole Benish • [email protected]
OFFICE
• Milwaukee witnessed very few large lease deals during the courseof the year, the most notable of which was a 40,000 SF lease.
• The downtown vacancy rate for Class A space remained low, butdevelopers were skeptical of the market, evident in the fact thatthere was no new downtown construction and only one newspeculative building over 100,000 SF (45% leased beforeconstruction) in the suburbs.
• Several significant office tenants in downtown and the suburbscontinued to renew their leases.
• The most notable investment sale was the 95%-leased Class AMilwaukee Center in downtown Milwaukee for less than $150 per SF.
• Infrastructure changes included the zoo interchange reconstruction,the south I-94 interchange initiative and light rail initiative.
• There continued to be increasing scrutiny on rezoning in many areasand developers steered toward in-fill developments rather than largerbusiness parks.
• Milwaukee office land prices remained stable with increased volume.
Office Outlook• The office market will continue to be slow in 2009 due todemand and financing, but developers will be looking to repositionfunctionally obsolescent real estate to office use.
• Several large tenants have leases expiring in coming years, whichcould promote new office construction.
• No one group – law, accounting, engineering, medical – is leadingany kind of growth and until that changes, demand and new supplyin the office market will stall.
INDUSTRIAL
• Printing, financial processing, crane manufacturing and large-scaledistribution grew the most in Milwaukee, while other heavymanufacturing industries witnessed low growth. Quad/Graphics,S.C. Johnson & Co., Joy Global and Michels Pipeline continuedtheir growth.
• Completion of the $1 billion Marquette freeway interchange andcommencement of improvements on the South I-94 corridor fromChicago to Milwaukee and planned improvements to the I-94West corridor were the newest infrastructure initiatives in this area.
• New developments included speculative 325,000 SF and 125,000 SFbuildings by HSA in Racine and a 55-acre industrial park inMenomonee Falls for First Industrial REIT, with QuadGraphicsas the anchor.
• One of the most significant transactions of 2008 was the $6.8 millionsale/leaseback of a 126,000 SF Franklin Business Park industrialproperty in mid-December.
• Companies such as Abbott Labs, Uline and Consolidated Grocerscontinued to migrate from northern Illinois to Kenosha Countyin southeast Wisconsin.
• Availability of large blocks of industrial space or large land siteswas limited, but there continued to be strong interest in freewaycorridor sites.
Industrial Outlook• Prices and lease rates will remain stable in 2009 and may increaseas the economy recovers.
• There will be little to no speculative development in 2009,but numerous large users will complete new buildings.

MINNEAPOLIS, MN
DOWNTOWN OFFICE
Inventory New Absorption Vacancy ClassA Cap Rate(SF) Supply (SF) (SF) Rate (%) Rent ($PSF) (%)
1999 21,219,000 0 370,000 7.1 28.40 –2000 22,146,000 927,000 573,000 7.2 28.70 9.002001 24,062,000 1,916,000 513,000 12.2 27.60 9.502002 24,990,000 928,000 (1,400,000) 20.3 23.50 9.502003 24,766,000 (224,000) (35,000) 21.9 25.10 9.502004 24,766,000 0 (323,000) 22.5 26.00 8.002005 24,766,000 0 485,000 20.6 24.70 7.502006 24,422,000 (344,000) 293,000 18.3 24.40 6.902007 24,422,000 0 191,000 16.7 26.40 7.502008 24,422,000 0 390,000 14.8 27.20 8.00
SUBURBAN OFFICE
Inventory New Absorption Vacancy ClassA Cap Rate(SF) Supply (SF) (SF) Rate (%) Rent ($PSF) (%)
1999 37,472,000 1,154,000 366,000 10.5 26.00 –2000 39,286,000 1,814,000 1,489,000 12.7 27.50 9.502001 41,388,000 2,102,000 1,664,000 17.6 27.00 10.502002 42,727,000 1,339,000 180,000 20.3 23.50 10.002003 42,727,000 0 2,038,000 20.8 27.40 9.502004 42,858,000 131,000 473,000 19.9 26.30 8.002005 42,760,000 (98,000) 1,115,000 17.1 23.20 7.502006 42,877,000 117,000 500,000 16.2 24.00 7.502007 43,601,000 724,000 639,000 16.1 26.60 7.752008 43,934,000 333,000 (908,000) 18.8 27.90 8.00
INDUSTRIAL
Inventory New Absorption Vacancy Warehouse Land Cap Rate(SF) Supply (SF) (SF) Rate (%) Rent ($PSF) ($PSF) (%)
1999 103,401,000 3,600,000 2,870,000 8.6 4.60 – –2000 105,601,000 2,200,000 1,846,000 9.4 4.70 – –2001 108,864,000 3,263,000 1,084,000 13.4 4.30 3.00 10.502002 111,848,000 2,984,000 1,546,000 17.0 4.40 3.00 9.752003 112,048,000 200,000 1,673,000 12.4 4.10 3.00 9.002004 112,178,000 130,000 113,000 14.8 4.25 3.00 8.002005 113,970,000 1,792,000 4,918,000 11.8 4.30 5.00 8.602006 115,412,000 1,442,000 2,796,000 10.5 4.55 7.23 7.502007 116,820,000 1,408,000 943,000 10.6 4.80 5.00 7.502008 117,000,000 180,000 (235,000) 10.4 4.50 3.28 8.50
METROPOLITAN INDICATORS – 2009
• Gross Metro Product Percent Change: 1.9
• Change in Total Employment (000): (2.9)Percent Change: (0.2)
• Unemployment Rate: 5.9
• Population (000): 3,278.1
Source: Moody’s Economy.com
CO L L I E R S I N T E RNAT I ONA L l U . S . R E A L E S TAT E R E V I EW 2 0 0 9
CONTACT: Jeffrey LaFavre • [email protected] l RESEARCH: Jim Mayland • [email protected] 38
OFFICE
• Minneapolis office net absorption was flat, but vacancy rates climbeddue to new construction, particularly in the Southwest metro area.
• All planned speculative development was put on hold indefinitely.• Minneapolis’ office-using employment declined for the first timein five years.
• Office investment transactions declined by 55% and the2008 median cap rate rose 125 basis points compared to 2007.
• High bank CBD office rents held firm, regardless ofmarket conditions.
Office Outlook• The Delta/Northwest merger will affect the Southeast metromarket as operations are consolidated from the two airlines.
• More sublease space is expected to come onto market as firms cutjobs or go under.
• Asking rates will decline as vacancies continue to rise.• The Minneapolis office market is not expected to see any speculativedevelopment until 2011.
INDUSTRIAL
• Manufacturing jobs continued to decline, affecting theindustrial market.
• There were a lot of spaces available on the market with tenantswilling to downsize if they were able find someone to take overtheir current space.
• There was 50% more small-user space on the market thanone year ago.
• Minneapolis saw little to no speculative industrial development.• With market uncertainty, industrial tenants sought shorterterms on renewals.
• Land prices started to decrease.• Throughout the year, a pricing gap existed between sellers and buyers,but started to close by year-end.
• Many new developments were scrapped or put on hold indefinitely.
Industrial Outlook• Landlords are looking at the industries their tenants are in andare proactively helping tenants.
• Starting to see seller financing for smaller deals
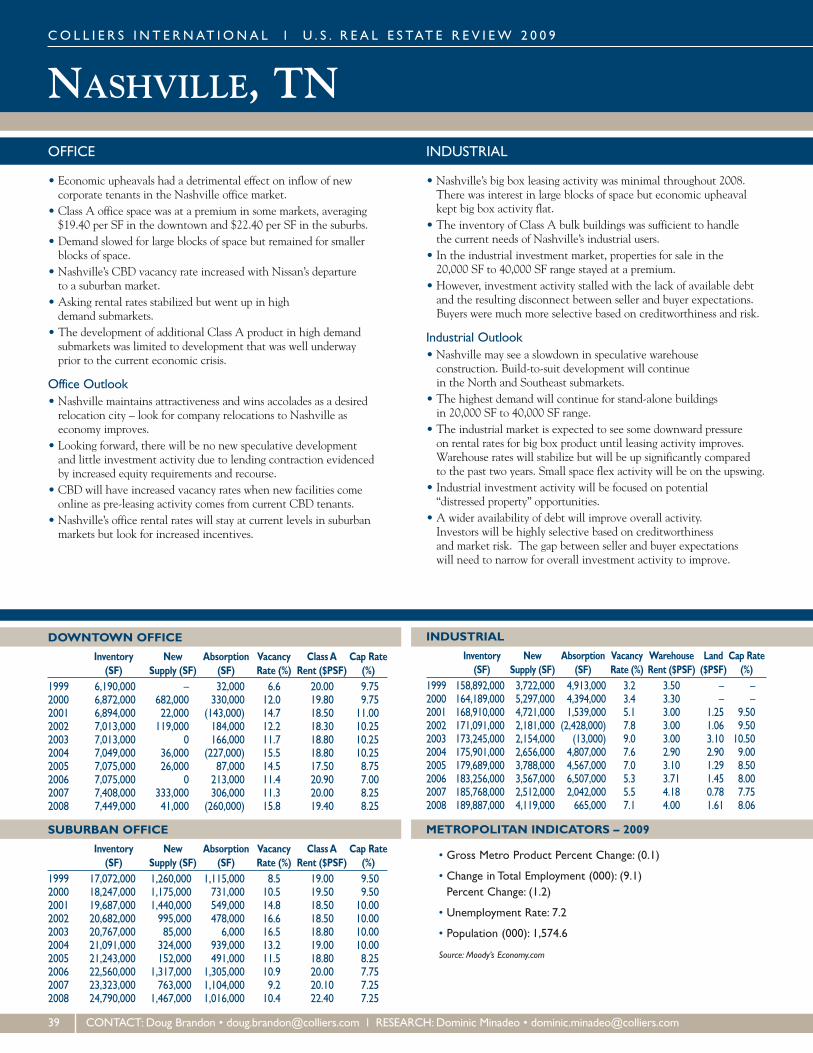
NASHVILLE, TNCO L L I E R S I N T E RNAT I ONA L l U . S . R E A L E S TAT E R E V I EW 2 0 0 9
DOWNTOWN OFFICE
Inventory New Absorption Vacancy ClassA Cap Rate(SF) Supply (SF) (SF) Rate (%) Rent ($PSF) (%)
1999 6,190,000 – 32,000 6.6 20.00 9.752000 6,872,000 682,000 330,000 12.0 19.80 9.752001 6,894,000 22,000 (143,000) 14.7 18.50 11.002002 7,013,000 119,000 184,000 12.2 18.30 10.252003 7,013,000 0 166,000 11.7 18.80 10.252004 7,049,000 36,000 (227,000) 15.5 18.80 10.252005 7,075,000 26,000 87,000 14.5 17.50 8.752006 7,075,000 0 213,000 11.4 20.90 7.002007 7,408,000 333,000 306,000 11.3 20.00 8.252008 7,449,000 41,000 (260,000) 15.8 19.40 8.25
SUBURBAN OFFICE
Inventory New Absorption Vacancy ClassA Cap Rate(SF) Supply (SF) (SF) Rate (%) Rent ($PSF) (%)
1999 17,072,000 1,260,000 1,115,000 8.5 19.00 9.502000 18,247,000 1,175,000 731,000 10.5 19.50 9.502001 19,687,000 1,440,000 549,000 14.8 18.50 10.002002 20,682,000 995,000 478,000 16.6 18.50 10.002003 20,767,000 85,000 6,000 16.5 18.80 10.002004 21,091,000 324,000 939,000 13.2 19.00 10.002005 21,243,000 152,000 491,000 11.5 18.80 8.252006 22,560,000 1,317,000 1,305,000 10.9 20.00 7.752007 23,323,000 763,000 1,104,000 9.2 20.10 7.252008 24,790,000 1,467,000 1,016,000 10.4 22.40 7.25
INDUSTRIAL
Inventory New Absorption Vacancy Warehouse Land Cap Rate(SF) Supply (SF) (SF) Rate (%) Rent ($PSF) ($PSF) (%)
1999 158,892,000 3,722,000 4,913,000 3.2 3.50 – –2000 164,189,000 5,297,000 4,394,000 3.4 3.30 – –2001 168,910,000 4,721,000 1,539,000 5.1 3.00 1.25 9.502002 171,091,000 2,181,000 (2,428,000) 7.8 3.00 1.06 9.502003 173,245,000 2,154,000 (13,000) 9.0 3.00 3.10 10.502004 175,901,000 2,656,000 4,807,000 7.6 2.90 2.90 9.002005 179,689,000 3,788,000 4,567,000 7.0 3.10 1.29 8.502006 183,256,000 3,567,000 6,507,000 5.3 3.71 1.45 8.002007 185,768,000 2,512,000 2,042,000 5.5 4.18 0.78 7.752008 189,887,000 4,119,000 665,000 7.1 4.00 1.61 8.06
METROPOLITAN INDICATORS – 2009
• Gross Metro Product Percent Change: (0.1)
• Change in Total Employment (000): (9.1)Percent Change: (1.2)
• Unemployment Rate: 7.2
• Population (000): 1,574.6
Source: Moody’s Economy.com
39 CONTACT:Doug Brandon • [email protected] l RESEARCH:Dominic Minadeo • [email protected]
OFFICE
• Economic upheavals had a detrimental effect on inflow of newcorporate tenants in the Nashville office market.
• Class A office space was at a premium in some markets, averaging$19.40 per SF in the downtown and $22.40 per SF in the suburbs.
• Demand slowed for large blocks of space but remained for smallerblocks of space.
• Nashville’s CBD vacancy rate increased with Nissan’s departureto a suburban market.
• Asking rental rates stabilized but went up in highdemand submarkets.
• The development of additional Class A product in high demandsubmarkets was limited to development that was well underwayprior to the current economic crisis.
Office Outlook• Nashville maintains attractiveness and wins accolades as a desiredrelocation city – look for company relocations to Nashville aseconomy improves.
• Looking forward, there will be no new speculative developmentand little investment activity due to lending contraction evidencedby increased equity requirements and recourse.
• CBD will have increased vacancy rates when new facilities comeonline as pre-leasing activity comes from current CBD tenants.
• Nashville’s office rental rates will stay at current levels in suburbanmarkets but look for increased incentives.
INDUSTRIAL
• Nashville’s big box leasing activity was minimal throughout 2008.There was interest in large blocks of space but economic upheavalkept big box activity flat.
• The inventory of Class A bulk buildings was sufficient to handlethe current needs of Nashville’s industrial users.
• In the industrial investment market, properties for sale in the20,000 SF to 40,000 SF range stayed at a premium.
• However, investment activity stalled with the lack of available debtand the resulting disconnect between seller and buyer expectations.Buyers were much more selective based on creditworthiness and risk.
Industrial Outlook• Nashville may see a slowdown in speculative warehouseconstruction. Build-to-suit development will continuein the North and Southeast submarkets.
• The highest demand will continue for stand-alone buildingsin 20,000 SF to 40,000 SF range.
• The industrial market is expected to see some downward pressureon rental rates for big box product until leasing activity improves.Warehouse rates will stabilize but will be up significantly comparedto the past two years. Small space flex activity will be on the upswing.
• Industrial investment activity will be focused on potential“distressed property” opportunities.
• A wider availability of debt will improve overall activity.Investors will be highly selective based on creditworthinessand market risk. The gap between seller and buyer expectationswill need to narrow for overall investment activity to improve.

NEW JERSEY – CENTRAL
SUBURBAN OFFICE
Inventory New Absorption Vacancy ClassA Cap Rate(SF) Supply (SF) (SF) Rate (%) Rent ($PSF) (%)
1999 91,990,000 3,651,000 3,010,000 9.4 29.00 –2000 93,767,000 1,777,000 2,524,000 6.0 26.90 9.502001 95,934,000 2,167,000 1,330,000 11.8 24.30 9.002002 98,433,000 2,499,000 (1,387,000) 15.3 23.50 8.752003 99,007,000 574,000 719,000 15.5 24.00 8.752004 99,537,000 530,000 1,717,000 14.2 25.50 7.752005 100,815,000 1,278,000 2,821,000 12.5 25.30 7.002006 101,646,000 831,000 218,000 13.0 25.50 7.002007 103,419,000 1,773,000 377,000 14.4 26.60 7.002008 103,955,000 536,000 (645,000) 15.5 27.10 7.50
INDUSTRIAL
Inventory New Absorption Vacancy Warehouse Land Cap Rate(SF) Supply (SF) (SF) Rate (%) Rent ($PSF) ($PSF) (%)
1999 253,307,000 3,675,000 3,927,000 7.2 5.20 – –2000 256,557,000 3,250,000 3,725,000 5.7 5.50 – –2001 263,712,000 7,155,000 1,479,000 7.0 5.00 4.00 9.002002 268,989,000 5,277,000 (2,031,000) 8.3 5.00 3.75 9.002003 269,848,000 859,000 7,137,000 5.9 4.50 5.00 8.002004 272,207,000 2,359,000 7,066,000 4.3 4.20 4.50 8.002005 278,844,000 6,637,000 709,000 6.6 4.70 18.00 8.002006 284,290,000 5,446,000 2,575,000 7.5 5.05 18.50 7.002007 288,070,000 3,780,000 4,641,000 8.1 5.28 1.65 7.002008 292,209,000 4,139,000 370,000 9.3 5.20 5.70 7.00
METROPOLITAN INDICATORS – 2009 (EDISON)
• Gross Metro Product Percent Change: 1.0
• Change in Total Employment (000): (17.7)Percent Change: (1.7)
• Unemployment Rate: 7.3
• Population (000): 2,347.2
Source: Moody’s Economy.com
CO L L I E R S I N T E RNAT I ONA L l U . S . R E A L E S TAT E R E V I EW 2 0 0 9
CONTACT: JonTesser • [email protected] l RESEARCH:Michael Gottilla • [email protected] 40
OFFICE
• Data center demand was a growth driver. Wall Street firms andNew Jersey’s life sciences companies began establishing these off-sitedata backup facilities. The Somerset and Brunswick/Piscataway/I-287submarkets were the chief beneficiaries of this trend.
• Fort Monmouth is scheduled to close by 2011. The process ofdetermining how to redevelop the fort has begun, however, therewas uncertainty as to what form that redevelopment would take.
• SL Green Realty Corp and Gramercy Capital Corp sold theirinterests in the North American headquarters for Sanofi-Aventis.Located on 150 acres, 55 Corporate Drive was purchased byInland American for $230 million and a 6.9% cap rate.
Office Outlook• New construction activity will decrease in 2009. Although thereis still plenty of developable land, the recession will reduce demandfor additional space. Asking rates will decrease, representinganother outgrowth of the recession.
• Life sciences and healthcare companies are relatively well insulatedagainst the downturn.
• The Princeton submarket should continue to show resilience in 2009.Despite the large volume of new space delivered in recent years,demand for space remained strong.
• The submarkets located near the Shore will not see as severe a dropoff in new construction as other submarkets. Retirees are moving tothe area in increasing numbers, and most new construction in thearea is medical office buildings developed to respond to the projecteddemand from that aging demographic.
INDUSTRIAL
• As evidenced by the drop in construction in the Exit 7A Submarket,secondary and tertiary submarkets have entered the “bust” phase.The abundance of available space in the Exit 8A submarket severelyreduced demand for space in outlying areas.
• Central New Jersey’s averaging asking rental rates began to slide.After cresting at $5.39 per SF in the fourth quarter of 2007, theaverage asking rental rate gradually decreased to $5.20 per SF bythe fourth quarter of 2008.
• Deal volume contracted since the start of the third quarter. A lackof financing and apprehension regarding the economy were the chiefcauses of the reduction.
• Matrix Development Group purchased Mid-Atlantic CorporateCenter, an 82-acre property of 13 buildings and 342,000 SF ofindustrial and flex space.
Industrial Outlook• Central New Jersey’s industrial market is heavily dependent uponconsumer spending since the majority of its space is distribution andwarehousing facilities. As consumer spending wanes, this marketwill feel the full force of slackening retail demand.
• Speculative projects have all but ceased to exist, a condition thatwill remain for at least several quarters. Build-to-suit projects willcomprise the majority of any new construction projects.
• Asking rents will continue their downhill trajectory. Over-supplyand diminishing demand will force asking rates downward.
• The conversion of industrial facilities to mixed use will acceleratein 2009. The redevelopment of the former Johnson & JohnsonNorth Brunswick Campus will be the prototypical example.
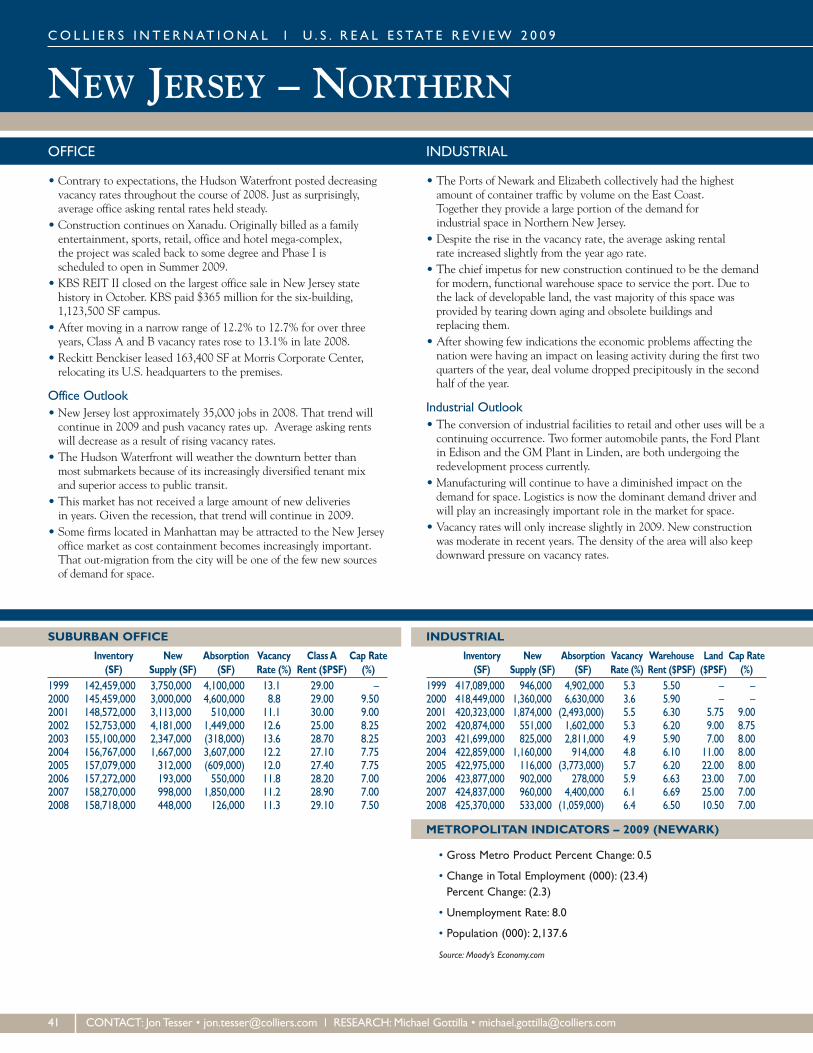
NEW JERSEY – NORTHERNCO L L I E R S I N T E RNAT I ONA L l U . S . R E A L E S TAT E R E V I EW 2 0 0 9
SUBURBAN OFFICE
Inventory New Absorption Vacancy ClassA Cap Rate(SF) Supply (SF) (SF) Rate (%) Rent ($PSF) (%)
1999 142,459,000 3,750,000 4,100,000 13.1 29.00 –2000 145,459,000 3,000,000 4,600,000 8.8 29.00 9.502001 148,572,000 3,113,000 510,000 11.1 30.00 9.002002 152,753,000 4,181,000 1,449,000 12.6 25.00 8.252003 155,100,000 2,347,000 (318,000) 13.6 28.70 8.252004 156,767,000 1,667,000 3,607,000 12.2 27.10 7.752005 157,079,000 312,000 (609,000) 12.0 27.40 7.752006 157,272,000 193,000 550,000 11.8 28.20 7.002007 158,270,000 998,000 1,850,000 11.2 28.90 7.002008 158,718,000 448,000 126,000 11.3 29.10 7.50
INDUSTRIAL
Inventory New Absorption Vacancy Warehouse Land Cap Rate(SF) Supply (SF) (SF) Rate (%) Rent ($PSF) ($PSF) (%)
1999 417,089,000 946,000 4,902,000 5.3 5.50 – –2000 418,449,000 1,360,000 6,630,000 3.6 5.90 – –2001 420,323,000 1,874,000 (2,493,000) 5.5 6.30 5.75 9.002002 420,874,000 551,000 1,602,000 5.3 6.20 9.00 8.752003 421,699,000 825,000 2,811,000 4.9 5.90 7.00 8.002004 422,859,000 1,160,000 914,000 4.8 6.10 11.00 8.002005 422,975,000 116,000 (3,773,000) 5.7 6.20 22.00 8.002006 423,877,000 902,000 278,000 5.9 6.63 23.00 7.002007 424,837,000 960,000 4,400,000 6.1 6.69 25.00 7.002008 425,370,000 533,000 (1,059,000) 6.4 6.50 10.50 7.00
METROPOLITAN INDICATORS – 2009 (NEWARK)
• Gross Metro Product Percent Change: 0.5
• Change in Total Employment (000): (23.4)Percent Change: (2.3)
• Unemployment Rate: 8.0
• Population (000): 2,137.6
Source: Moody’s Economy.com
41 CONTACT: JonTesser • [email protected] l RESEARCH:Michael Gottilla • [email protected]
OFFICE
• Contrary to expectations, the Hudson Waterfront posted decreasingvacancy rates throughout the course of 2008. Just as surprisingly,average office asking rental rates held steady.
• Construction continues on Xanadu. Originally billed as a familyentertainment, sports, retail, office and hotel mega-complex,the project was scaled back to some degree and Phase I isscheduled to open in Summer 2009.
• KBS REIT II closed on the largest office sale in New Jersey statehistory in October. KBS paid $365 million for the six-building,1,123,500 SF campus.
• After moving in a narrow range of 12.2% to 12.7% for over threeyears, Class A and B vacancy rates rose to 13.1% in late 2008.
• Reckitt Benckiser leased 163,400 SF at Morris Corporate Center,relocating its U.S. headquarters to the premises.
Office Outlook• New Jersey lost approximately 35,000 jobs in 2008. That trend willcontinue in 2009 and push vacancy rates up. Average asking rentswill decrease as a result of rising vacancy rates.
• The Hudson Waterfront will weather the downturn better thanmost submarkets because of its increasingly diversified tenant mixand superior access to public transit.
• This market has not received a large amount of new deliveriesin years. Given the recession, that trend will continue in 2009.
• Some firms located in Manhattan may be attracted to the New Jerseyoffice market as cost containment becomes increasingly important.That out-migration from the city will be one of the few new sourcesof demand for space.
INDUSTRIAL
• The Ports of Newark and Elizabeth collectively had the highestamount of container traffic by volume on the East Coast.Together they provide a large portion of the demand forindustrial space in Northern New Jersey.
• Despite the rise in the vacancy rate, the average asking rentalrate increased slightly from the year ago rate.
• The chief impetus for new construction continued to be the demandfor modern, functional warehouse space to service the port. Due tothe lack of developable land, the vast majority of this space wasprovided by tearing down aging and obsolete buildings andreplacing them.
• After showing few indications the economic problems affecting thenation were having an impact on leasing activity during the first twoquarters of the year, deal volume dropped precipitously in the secondhalf of the year.
Industrial Outlook• The conversion of industrial facilities to retail and other uses will be acontinuing occurrence. Two former automobile pants, the Ford Plantin Edison and the GM Plant in Linden, are both undergoing theredevelopment process currently.
• Manufacturing will continue to have a diminished impact on thedemand for space. Logistics is now the dominant demand driver andwill play an increasingly important role in the market for space.
• Vacancy rates will only increase slightly in 2009. New constructionwas moderate in recent years. The density of the area will also keepdownward pressure on vacancy rates.

NEW YORK, NY
MIDTOWN MANHATTAN OFFICE
Inventory New Absorption Vacancy ClassA Cap Rate(SF) Supply (SF) (SF) Rate (%) Rent ($PSF) (%)
1999 240,004,000 1,600,000 3,900,000 6.4 54.00 –2000 240,004,000 0 1,445,000 5.4 65.40 9.002001 240,859,000 855,000 (12,916,000) 10.4 61.30 8.002002 243,365,000 2,506,000 (573,000) 11.4 54.70 7.252003 245,263,000 1,898,000 888,000 11.8 52.40 6.752004 248,246,000 2,983,000 5,846,000 10.5 57.50 6.402005 251,381,000 3,135,000 7,065,000 8.0 59.60 5.002006 252,512,000 1,131,000 4,607,000 6.5 79.60 5.002007 254,883,000 2,371,000 1,476,000 6.8 95.00 4.002008 254,883,000 0 (8,658,000) 10.2 82.10 5.50
MIDTOWN SOUTH MANHATTAN OFFICE
Inventory New Absorption Vacancy ClassA Cap Rate(SF) Supply (SF) (SF) Rate (%) Rent ($PSF) (%)
1999 98,217,000 – – – – –2000 98,217,000 0 787,000 5.5 38.00 8.502001 98,217,000 0 (7,256,000) 12.9 43.80 9.002002 98,217,000 0 (998,000) 14.0 34.00 8.002003 98,217,000 0 1,460,000 12.5 27.60 7.002004 98,217,000 0 1,054,000 11.4 33.70 6.502005 98,217,000 0 3,114,000 8.3 36.00 5.302006 98,217,000 0 689,000 7.6 44.50 5.802007 98,339,000 122,000 (1,524,000) 9.3 60.10 5.302008 98,339,000 0 (2,080,000) 11.4 59.30 6.00
CO L L I E R S I N T E RNAT I ONA L l U . S . R E A L E S TAT E R E V I EW 2 0 0 9
CONTACT:Nicola Heryet • [email protected] l RESEARCH: Robert Sammons • [email protected] 42
OFFICE
NewYork, Midtown Manhattan• Financial service firms severely affected the Midtown office marketwith two of the largest, headquartered in Midtown, being swallowedup by others – Bear Stearns by JPMorgan Chase and LehmanBrothers by Barclays Bank.
• Class A vacancy climbed above 10.0% for the first time sinceNovember 2005. Class A sublease availability rose sharply, climbingmore than 150% in 2008 and was at its highest since August 2005.Class A direct availability stood at 10 million SF, a figure not seensince late 1996.
• The average asking rent continued to drop, falling almost 11% off itsrecord high of $99.22 per SF set in May 2008. That said, asking rentsbecame less relevant as most space was listed as negotiable and landlordswere open to reasonable deals from creditworthy tenants. Effectiverents were generally off 25% from their peak of late 2007/early 2008.
NewYork, Midtown Manhattan Outlook• Vacancy will continue to climb higher as blocks of space fromfinancial service firms and others are returned to the market.
• The average asking rent is expected to decline at least 25% to 30%in 2009 with effective rents facing an even sharper drop.
• New development will be dormant in 2009 except for those projectsalready underway including 11 Times Square (to be completed late inthe year) and 510 Madison Avenue (to be completed by the summer).
• There will be a number of lease expirations in 2009 which will helpkeep the market afloat; this could create a flight to quality as thosetenants with expiring leases in secondary locations are able to afforda better building in a better location.
NewYork, Midtown South Manhattan• Midtown South’s vacancy rate rose from 9.3% to 11.4%. The trendacross all submarkets was a tightening for the first half, then looserin the latter part of 2008. Hudson Square had Manhattan’s highestvacancy at over 23%.
• Several large blocks became available in Midtown South totalingover 1.8 million SF, contributing to the overall rise in vacancy.
• Overall asking rent increased $59.30 per SF, although most of thisincrease was during the first two quarters.
• Largest blocks of availability are currently at 532 Washington Street,with 750,000 SF, and 200 Fifth Avenue, with 400,000 SF.
• Demand was driven by companies seeking cheaper alternativesto Midtown and the emergence of a high tech/media clusterin the vicinity.
NewYork, Midtown South Manhattan Outlook• Continued relocations, especially among broadcast/media firms, areexpected for 2009 which may actually drive the vacancy rate lower,especially in Chelsea and Hudson Square.
• Asking rents across Midtown South will hold flat to somewhat lowerthough not decline nearly as steep as Midtown.
• Midtown South will not be immune to the “layoff bug” with financialand professional/business service firms affected.
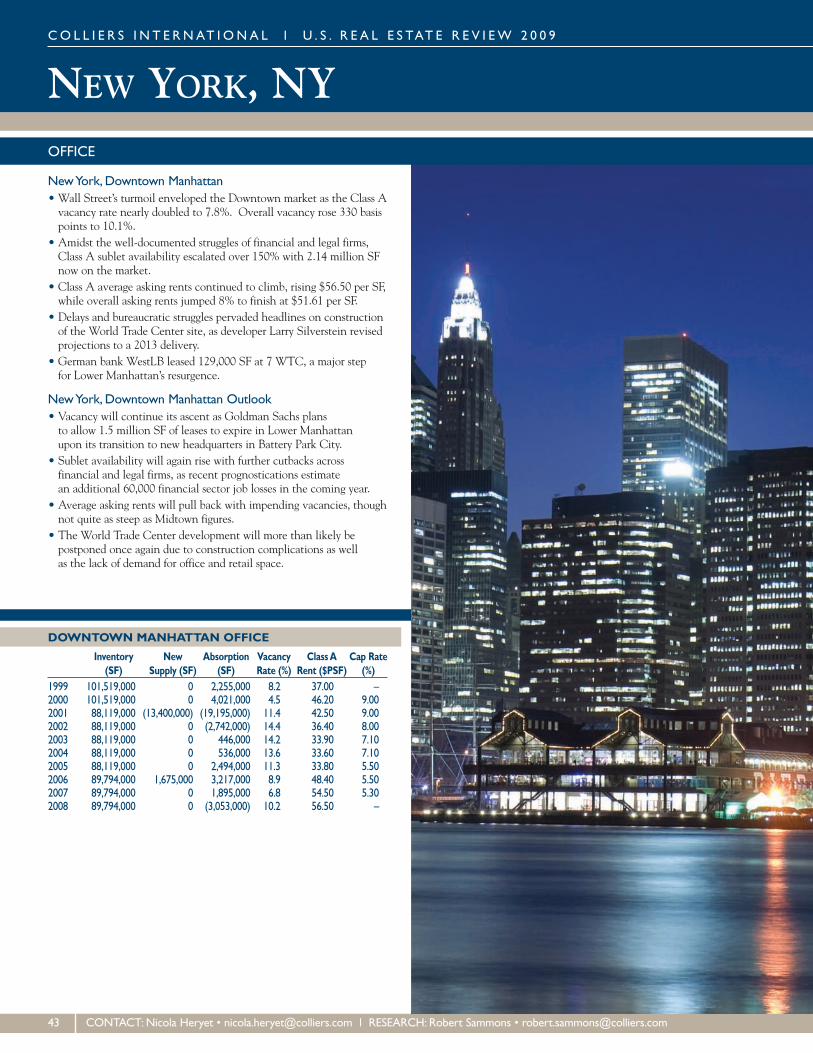
NEW YORK, NYCO L L I E R S I N T E RNAT I ONA L l U . S . R E A L E S TAT E R E V I EW 2 0 0 9
DOWNTOWN MANHATTAN OFFICE
Inventory New Absorption Vacancy ClassA Cap Rate(SF) Supply (SF) (SF) Rate (%) Rent ($PSF) (%)
1999 101,519,000 0 2,255,000 8.2 37.00 –2000 101,519,000 0 4,021,000 4.5 46.20 9.002001 88,119,000 (13,400,000) (19,195,000) 11.4 42.50 9.002002 88,119,000 0 (2,742,000) 14.4 36.40 8.002003 88,119,000 0 446,000 14.2 33.90 7.102004 88,119,000 0 536,000 13.6 33.60 7.102005 88,119,000 0 2,494,000 11.3 33.80 5.502006 89,794,000 1,675,000 3,217,000 8.9 48.40 5.502007 89,794,000 0 1,895,000 6.8 54.50 5.302008 89,794,000 0 (3,053,000) 10.2 56.50 –
43 CONTACT:Nicola Heryet • [email protected] l RESEARCH: Robert Sammons • [email protected]
OFFICE
NewYork, Downtown Manhattan• Wall Street’s turmoil enveloped the Downtown market as the Class Avacancy rate nearly doubled to 7.8%. Overall vacancy rose 330 basispoints to 10.1%.
• Amidst the well-documented struggles of financial and legal firms,Class A sublet availability escalated over 150% with 2.14 million SFnow on the market.
• Class A average asking rents continued to climb, rising $56.50 per SF,while overall asking rents jumped 8% to finish at $51.61 per SF.
• Delays and bureaucratic struggles pervaded headlines on constructionof the World Trade Center site, as developer Larry Silverstein revisedprojections to a 2013 delivery.
• German bank WestLB leased 129,000 SF at 7 WTC, a major stepfor Lower Manhattan’s resurgence.
NewYork, Downtown Manhattan Outlook• Vacancy will continue its ascent as Goldman Sachs plansto allow 1.5 million SF of leases to expire in Lower Manhattanupon its transition to new headquarters in Battery Park City.
• Sublet availability will again rise with further cutbacks acrossfinancial and legal firms, as recent prognostications estimatean additional 60,000 financial sector job losses in the coming year.
• Average asking rents will pull back with impending vacancies, thoughnot quite as steep as Midtown figures.
• The World Trade Center development will more than likely bepostponed once again due to construction complications as wellas the lack of demand for office and retail space.
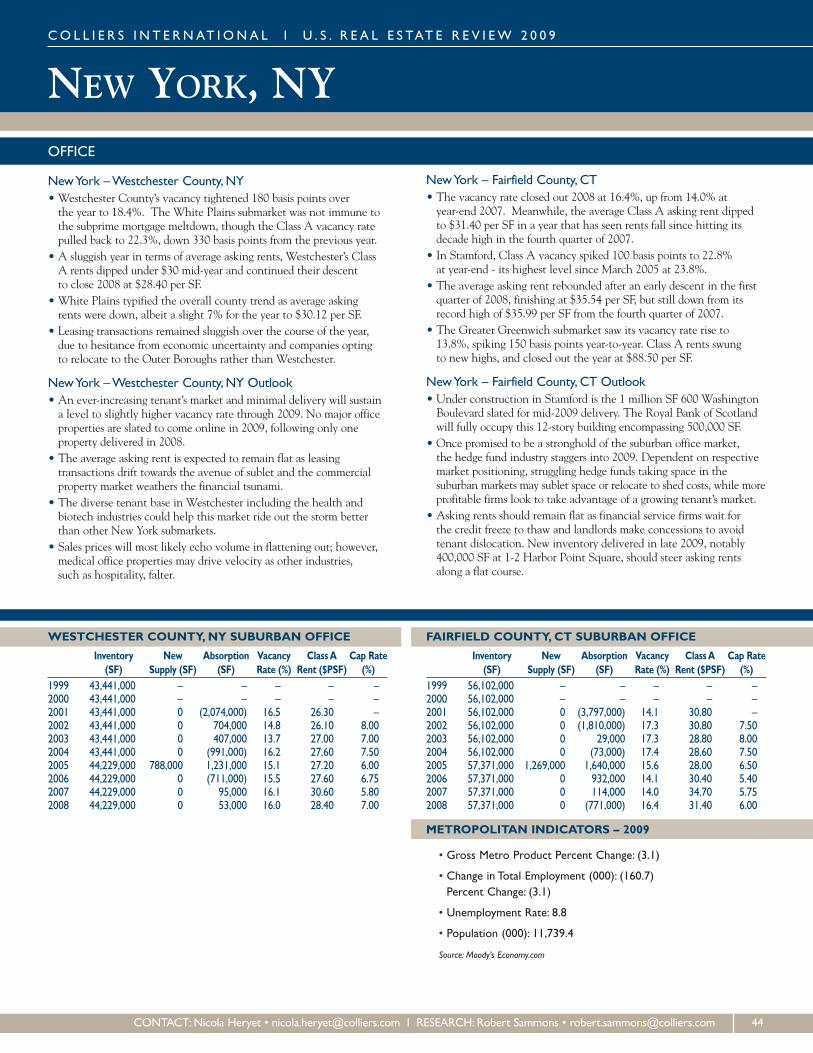
NEW YORK, NY
WESTCHESTER COUNTY, NY SUBURBAN OFFICE
Inventory New Absorption Vacancy ClassA Cap Rate(SF) Supply (SF) (SF) Rate (%) Rent ($PSF) (%)
1999 43,441,000 – – – – –2000 43,441,000 – – – – –2001 43,441,000 0 (2,074,000) 16.5 26.30 –2002 43,441,000 0 704,000 14.8 26.10 8.002003 43,441,000 0 407,000 13.7 27.00 7.002004 43,441,000 0 (991,000) 16.2 27.60 7.502005 44,229,000 788,000 1,231,000 15.1 27.20 6.002006 44,229,000 0 (711,000) 15.5 27.60 6.752007 44,229,000 0 95,000 16.1 30.60 5.802008 44,229,000 0 53,000 16.0 28.40 7.00
FAIRFIELD COUNTY, CT SUBURBAN OFFICE
Inventory New Absorption Vacancy ClassA Cap Rate(SF) Supply (SF) (SF) Rate (%) Rent ($PSF) (%)
1999 56,102,000 – – – – –2000 56,102,000 – – – – –2001 56,102,000 0 (3,797,000) 14.1 30.80 –2002 56,102,000 0 (1,810,000) 17.3 30.80 7.502003 56,102,000 0 29,000 17.3 28.80 8.002004 56,102,000 0 (73,000) 17.4 28.60 7.502005 57,371,000 1,269,000 1,640,000 15.6 28.00 6.502006 57,371,000 0 932,000 14.1 30.40 5.402007 57,371,000 0 114,000 14.0 34.70 5.752008 57,371,000 0 (771,000) 16.4 31.40 6.00
METROPOLITAN INDICATORS – 2009
• Gross Metro Product Percent Change: (3.1)
• Change in Total Employment (000): (160.7)Percent Change: (3.1)
• Unemployment Rate: 8.8
• Population (000): 11,739.4
Source: Moody’s Economy.com
CO L L I E R S I N T E RNAT I ONA L l U . S . R E A L E S TAT E R E V I EW 2 0 0 9
CONTACT:Nicola Heryet • [email protected] l RESEARCH: Robert Sammons • [email protected] 44
OFFICE
NewYork –Westchester County, NY• Westchester County’s vacancy tightened 180 basis points overthe year to 18.4%. The White Plains submarket was not immune tothe subprime mortgage meltdown, though the Class A vacancy ratepulled back to 22.3%, down 330 basis points from the previous year.
• A sluggish year in terms of average asking rents, Westchester’s ClassA rents dipped under $30 mid-year and continued their descentto close 2008 at $28.40 per SF.
• White Plains typified the overall county trend as average askingrents were down, albeit a slight 7% for the year to $30.12 per SF.
• Leasing transactions remained sluggish over the course of the year,due to hesitance from economic uncertainty and companies optingto relocate to the Outer Boroughs rather than Westchester.
NewYork –Westchester County, NY Outlook• An ever-increasing tenant’s market and minimal delivery will sustaina level to slightly higher vacancy rate through 2009. No major officeproperties are slated to come online in 2009, following only oneproperty delivered in 2008.
• The average asking rent is expected to remain flat as leasingtransactions drift towards the avenue of sublet and the commercialproperty market weathers the financial tsunami.
• The diverse tenant base in Westchester including the health andbiotech industries could help this market ride out the storm betterthan other New York submarkets.
• Sales prices will most likely echo volume in flattening out; however,medical office properties may drive velocity as other industries,such as hospitality, falter.
NewYork – Fairfield County, CT• The vacancy rate closed out 2008 at 16.4%, up from 14.0% atyear-end 2007. Meanwhile, the average Class A asking rent dippedto $31.40 per SF in a year that has seen rents fall since hitting itsdecade high in the fourth quarter of 2007.
• In Stamford, Class A vacancy spiked 100 basis points to 22.8%at year-end - its highest level since March 2005 at 23.8%.
• The average asking rent rebounded after an early descent in the firstquarter of 2008, finishing at $35.54 per SF, but still down from itsrecord high of $35.99 per SF from the fourth quarter of 2007.
• The Greater Greenwich submarket saw its vacancy rate rise to13.8%, spiking 150 basis points year-to-year. Class A rents swungto new highs, and closed out the year at $88.50 per SF.
NewYork – Fairfield County, CT Outlook• Under construction in Stamford is the 1 million SF 600 WashingtonBoulevard slated for mid-2009 delivery. The Royal Bank of Scotlandwill fully occupy this 12-story building encompassing 500,000 SF.
• Once promised to be a stronghold of the suburban office market,the hedge fund industry staggers into 2009. Dependent on respectivemarket positioning, struggling hedge funds taking space in thesuburban markets may sublet space or relocate to shed costs, while moreprofitable firms look to take advantage of a growing tenant’s market.
• Asking rents should remain flat as financial service firms wait forthe credit freeze to thaw and landlords make concessions to avoidtenant dislocation. New inventory delivered in late 2009, notably400,000 SF at 1-2 Harbor Point Square, should steer asking rentsalong a flat course.
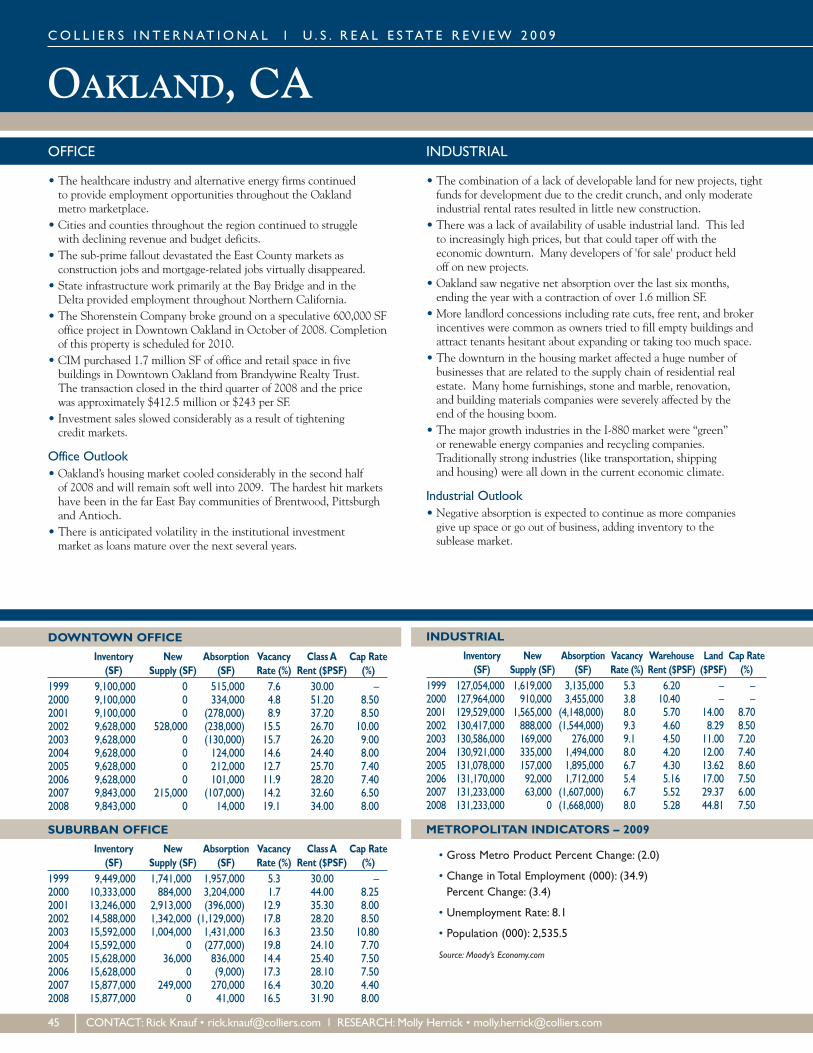
OAKLAND, CACO L L I E R S I N T E RNAT I ONA L l U . S . R E A L E S TAT E R E V I EW 2 0 0 9
DOWNTOWN OFFICE
Inventory New Absorption Vacancy ClassA Cap Rate(SF) Supply (SF) (SF) Rate (%) Rent ($PSF) (%)
1999 9,100,000 0 515,000 7.6 30.00 –2000 9,100,000 0 334,000 4.8 51.20 8.502001 9,100,000 0 (278,000) 8.9 37.20 8.502002 9,628,000 528,000 (238,000) 15.5 26.70 10.002003 9,628,000 0 (130,000) 15.7 26.20 9.002004 9,628,000 0 124,000 14.6 24.40 8.002005 9,628,000 0 212,000 12.7 25.70 7.402006 9,628,000 0 101,000 11.9 28.20 7.402007 9,843,000 215,000 (107,000) 14.2 32.60 6.502008 9,843,000 0 14,000 19.1 34.00 8.00
SUBURBAN OFFICE
Inventory New Absorption Vacancy ClassA Cap Rate(SF) Supply (SF) (SF) Rate (%) Rent ($PSF) (%)
1999 9,449,000 1,741,000 1,957,000 5.3 30.00 –2000 10,333,000 884,000 3,204,000 1.7 44.00 8.252001 13,246,000 2,913,000 (396,000) 12.9 35.30 8.002002 14,588,000 1,342,000 (1,129,000) 17.8 28.20 8.502003 15,592,000 1,004,000 1,431,000 16.3 23.50 10.802004 15,592,000 0 (277,000) 19.8 24.10 7.702005 15,628,000 36,000 836,000 14.4 25.40 7.502006 15,628,000 0 (9,000) 17.3 28.10 7.502007 15,877,000 249,000 270,000 16.4 30.20 4.402008 15,877,000 0 41,000 16.5 31.90 8.00
INDUSTRIAL
Inventory New Absorption Vacancy Warehouse Land Cap Rate(SF) Supply (SF) (SF) Rate (%) Rent ($PSF) ($PSF) (%)
1999 127,054,000 1,619,000 3,135,000 5.3 6.20 – –2000 127,964,000 910,000 3,455,000 3.8 10.40 – –2001 129,529,000 1,565,000 (4,148,000) 8.0 5.70 14.00 8.702002 130,417,000 888,000 (1,544,000) 9.3 4.60 8.29 8.502003 130,586,000 169,000 276,000 9.1 4.50 11.00 7.202004 130,921,000 335,000 1,494,000 8.0 4.20 12.00 7.402005 131,078,000 157,000 1,895,000 6.7 4.30 13.62 8.602006 131,170,000 92,000 1,712,000 5.4 5.16 17.00 7.502007 131,233,000 63,000 (1,607,000) 6.7 5.52 29.37 6.002008 131,233,000 0 (1,668,000) 8.0 5.28 44.81 7.50
METROPOLITAN INDICATORS – 2009
• Gross Metro Product Percent Change: (2.0)
• Change in Total Employment (000): (34.9)Percent Change: (3.4)
• Unemployment Rate: 8.1
• Population (000): 2,535.5
Source: Moody’s Economy.com
45 CONTACT: Rick Knauf • [email protected] l RESEARCH:Molly Herrick • [email protected]
OFFICE
• The healthcare industry and alternative energy firms continuedto provide employment opportunities throughout the Oaklandmetro marketplace.
• Cities and counties throughout the region continued to strugglewith declining revenue and budget deficits.
• The sub-prime fallout devastated the East County markets asconstruction jobs and mortgage-related jobs virtually disappeared.
• State infrastructure work primarily at the Bay Bridge and in theDelta provided employment throughout Northern California.
• The Shorenstein Company broke ground on a speculative 600,000 SFoffice project in Downtown Oakland in October of 2008. Completionof this property is scheduled for 2010.
• CIM purchased 1.7 million SF of office and retail space in fivebuildings in Downtown Oakland from Brandywine Realty Trust.The transaction closed in the third quarter of 2008 and the pricewas approximately $412.5 million or $243 per SF.
• Investment sales slowed considerably as a result of tighteningcredit markets.
Office Outlook• Oakland’s housing market cooled considerably in the second halfof 2008 and will remain soft well into 2009. The hardest hit marketshave been in the far East Bay communities of Brentwood, Pittsburghand Antioch.
• There is anticipated volatility in the institutional investmentmarket as loans mature over the next several years.
INDUSTRIAL
• The combination of a lack of developable land for new projects, tightfunds for development due to the credit crunch, and only moderateindustrial rental rates resulted in little new construction.
• There was a lack of availability of usable industrial land. This ledto increasingly high prices, but that could taper off with theeconomic downturn. Many developers of 'for sale' product heldoff on new projects.
• Oakland saw negative net absorption over the last six months,ending the year with a contraction of over 1.6 million SF.
• More landlord concessions including rate cuts, free rent, and brokerincentives were common as owners tried to fill empty buildings andattract tenants hesitant about expanding or taking too much space.
• The downturn in the housing market affected a huge number ofbusinesses that are related to the supply chain of residential realestate. Many home furnishings, stone and marble, renovation,and building materials companies were severely affected by theend of the housing boom.
• The major growth industries in the I-880 market were “green”or renewable energy companies and recycling companies.Traditionally strong industries (like transportation, shippingand housing) were all down in the current economic climate.
Industrial Outlook• Negative absorption is expected to continue as more companiesgive up space or go out of business, adding inventory to thesublease market.

ORANGE COUNTY, CA
SUBURBAN OFFICE
Inventory New Absorption Vacancy ClassA Cap Rate(SF) Supply (SF) (SF) Rate (%) Rent ($PSF) (%)
1999 64,564,000 – – – – 9.002000 64,564,000 – – – – 9.202001 68,086,000 3,522,000 (644,000) 17.7 31.10 9.102002 69,172,000 1,086,000 288,000 18.8 29.80 8.502003 70,179,000 1,007,000 2,918,000 16.2 27.40 7.752004 70,214,000 35,000 2,580,000 12.4 27.90 7.752005 70,320,000 106,000 3,021,000 8.0 31.30 6.502006 71,294,000 974,000 204,000 9.0 34.30 5.902007 74,422,000 3,128,000 (1,635,000) 15.2 38.30 5.702008 75,617,000 1,195,000 (1,560,000) 18.6 35.40 6.20
INDUSTRIAL
Inventory New Absorption Vacancy Warehouse Land Cap Rate(SF) Supply (SF) (SF) Rate (%) Rent ($PSF) ($PSF) (%)
1999 – – – – – – 8.502000 – – – – – – 8.402001 – – – – – – 8.902002 195,109,000 892,000 (1,458,000) 6.6 7.00 14.00 8.252003 196,332,000 1,223,000 2,083,000 6.6 7.20 17.00 7.602004 196,964,000 632,000 5,218,000 4.5 6.50 13.63 7.502005 197,474,000 510,000 2,667,000 3.6 7.20 23.00 7.002006 198,780,000 1,306,000 498,000 4.0 8.40 32.00 6.002007 199,906,000 1,126,000 613,000 3.9 8.58 32.00 6.302008 200,837,000 931,000 (885,000) 4.5 8.99 42.00 5.83
METROPOLITAN INDICATORS – 2009 (SANTA ANA)
• Gross Metro Product Percent Change: (1.1)
• Change in Total Employment (000): (52.6)Percent Change: (3.5)
• Unemployment Rate: 7.2
• Population (000): 3,044.2
Source: Moody’s Economy.com
CO L L I E R S I N T E RNAT I ONA L l U . S . R E A L E S TAT E R E V I EW 2 0 0 9
CONTACT:Martin Pupil • [email protected] l RESEARCH: Susan Bloomfield • [email protected] 46
OFFICE
• The collapse of the mortgage industry hit the office market hardwith vacancy rates increasing to 18% at year-end. After peakingat year-end 2007, asking rents declined by 6% in 2008.
• Net absorption in 2008 was approximately negative 1.6 million SFas the downturn in the mortgage finance industry spread to othersectors of the local economy.
• 2008 saw over 1 million SF delivered to the market with muchof this in the form of speculative office space.
• The large amount of available office space on the market allowedseveral large lease deals such as the Federal Deposit InsuranceCorporation taking over 200,000 SF in the Irvine Spectrum.
• The Irvine Spectrum emerged as the prime alternative to thetraditional Class A office building clusters near South Coast Metroand John Wayne Airport.
• The Orange County economy transitioned away from the mortgagefinance and real estate-centric economy of the past couple of decadesto one based on a more diverse array of business clusters.
• Like anywhere else in Southern California, Orange Countywas experimenting with dense, mixed-use development with majorprojects like Anaheim’s Platinum Triangle on the horizon.
Office Outlook• The office vacancy rate in Orange County is expected to climbover 20% and remain at a very high level in 2009 although themedical office sector is expected to perform better.
• The Orange County economy is in the process of transitioningto an economy based on a more diverse array of business clusters.This will make the region better off in the long-term.
INDUSTRIAL
• Slowing port volume and decreased manufacturing orders caused theOrange County vacancy rate to rise to nearly 5% by year-end 2008.
• Average asking rental rates remained the highest within theGreater Los Angeles Basin.
• 2008 saw the first decrease in average sales prices per SFin over a year.
• New construction remained constrained with only 698,000 SFdelivered to the industrial market in 2008.
• Net absorption in 2008 was approximately negative 1 million SFas the global economic slowdown began to affect the area’sindustrial market.
Industrial Outlook• Average asking rental rates are expected to continue to decreasein 2009 as demand declines in Orange County’s industrial market.
• Vacancy rates are expected to continue to increase to the 6% rangeas more space givebacks occur.
• The Orange County industrial market will continue to see steadydemand from local clothing manufacturers and defense contractors.
• Option ARM and Alt-A mortgage resets are expected to affect theOrange County housing market adversely towards the end of 2009.
• Cap rates are expected to increase even higher from the recordlows of the past few years as distressed property sales become morecommon in 2009.

ORLANDO, FLCO L L I E R S I N T E RNAT I ONA L l U . S . R E A L E S TAT E R E V I EW 2 0 0 9
DOWNTOWN OFFICE
Inventory New Absorption Vacancy ClassA Cap Rate(SF) Supply (SF) (SF) Rate (%) Rent ($PSF) (%)
1999 9,089,000 337,000 216,000 6.1 25.20 –2000 9,846,000 757,000 414,000 9.0 25.40 9.252001 9,932,000 86,000 (104,000) 12.0 25.30 9.252002 9,932,000 0 (149,000) 11.8 23.60 9.202003 10,152,000 220,000 135,000 12.5 22.80 9.702004 10,152,000 0 13,000 11.1 21.00 8.502005 10,417,000 265,000 81,000 11.9 24.00 8.002006 10,994,000 577,000 927,000 8.0 26.50 7.502007 11,020,000 26,000 323,000 8.5 27.90 6.502008 11,539,000 519,000 (81,000) 14.2 28.30 7.70
SUBURBAN OFFICE
Inventory New Absorption Vacancy ClassA Cap Rate(SF) Supply (SF) (SF) Rate (%) Rent ($PSF) (%)
1999 39,718,000 490,000 438,000 6.8 18.00 –2000 41,655,000 1,937,000 2,212,000 7.9 19.80 9.252001 44,268,000 2,613,000 672,000 11.6 20.60 9.252002 45,101,000 833,000 187,000 12.4 20.30 9.302003 45,819,000 718,000 (97,000) 14.1 20.20 9.702004 46,221,000 402,000 291,000 11.9 19.70 8.502005 46,544,000 323,000 1,204,000 8.9 19.00 9.002006 47,680,000 1,136,000 1,703,000 7.6 22.60 8.602007 49,294,000 1,614,000 402,000 9.9 25.10 6.502008 50,884,000 1,590,000 (272,000) 13.5 24.10 7.80
INDUSTRIAL
Inventory New Absorption Vacancy Warehouse Land Cap Rate(SF) Supply (SF) (SF) Rate (%) Rent ($PSF) ($PSF) (%)
1999 117,433,000 813,000 (339,000) 7.2 – – –2000 119,279,000 1,846,000 1,658,000 7.3 5.90 – –2001 122,859,000 3,580,000 2,859,000 9.4 4.20 3.00 9.752002 124,465,000 1,606,000 924,000 10.1 4.30 3.50 8.502003 125,892,000 1,427,000 (154,000) 11.6 4.10 2.60 9.152004 129,128,000 3,236,000 6,191,000 8.6 4.50 3.63 9.002005 130,978,000 1,850,000 2,909,000 8.1 4.75 4.00 8.402006 133,734,000 2,756,000 4,344,000 6.7 5.25 6.50 7.302007 137,137,000 3,403,000 2,197,000 6.2 5.84 4.50 7.002008 138,682,000 1,545,000 (2,665,000) 10.1 5.68 4.50 7.60
METROPOLITAN INDICATORS – 2009
• Gross Metro Product Percent Change: 0.7
• Change in Total Employment (000): (21.2)Percent Change: (1.9)
• Unemployment Rate: 7.4
• Population (000): 2,081.1
Source: Moody’s Economy.com
47 CONTACT:Matt Sullivan • [email protected] l RESEARCH:Danny Rice • [email protected]
OFFICE
• Office vacancy in the overall Orlando area ended 2008 up at 13.6%while rental rates fluctuated around the $23.00 per SF range.
• The Downtown submarket experienced a drastic 5.7% increasein vacancy since the fourth quarter of 2007 as the financial marketcontinued to struggle in today’s economic climate. In the suburbanoffice market, the average vacancy rate rose from 9.9% to 13.5%.
• Construction activity in the overall market was strong totalingaround 2.1 million SF for 2008. Unlike many other U.S. cities,Orlando witnessed new supply in the CBD.
• Darden Restaurants began construction this year on its new400,000 SF headquarters in the South Orlando submarket.Completion and move-in is expected by year-end 2009.
Office Outlook• In 2009, it is expected that the Orlando office market will remaincomparable to 2008 trends.
• Construction on the Medical City of Lake Nona has begun and isforecast to bring multiple new large medical tenants to the CentralFlorida region. Tenants will include UCF Medical School, BurnhamInstitute for Medical Research, Nemours Children’s Hospital andthe VA Hospital.
• The Orlando office market is forecast to experience level rentalrates throughout 2009. Vacancy will slightly climb as more financialcorporations and businesses close or downsize their offices to saveon costs.
• Construction activity will slowly diminish as investors and developerswait out the sluggish economy.
INDUSTRIAL
• After nearly two years of strong demand and growth, the Orlandoindustrial market began to feel the effects of the sluggish economy.
• By year-end 2008, the average rental rate for warehouse space settledto this year’s low of $5.68 per SF from its peak of $5.96 per SF duringthe second quarter. Flex space averaged $10.66 per SF at year’s end.
• Vacancy edged up each quarter to close 2008 at 10.1%, up from6.2% at the end of 2007. Annual net absorption measured morethan negative 2.6 million.
• Of the industrial submarkets, the Southeast and Southwestsubmarkets continued to be Central Florida’s dominant submarkets.
• International Corporate Park completed construction on threebuildings along SR 528, part of East Orange County.
Industrial Outlook• The industrial market in 2009 is forecast to see a minimal amountof space being delivered to the market. Approximately 378,000 SFis forecasted to be completed for the year.
• Orlando’s industrial rental rates will remain level to 2008 rates withcertain submarkets experiencing a drop in rates to adjust for a declinein demand.
• Vacancy will continue to creep upward each quarter, and is expectedto eventually level off near year-end 2009.
• The Southeast submarket is poised for growth in 2009. The majorityof the planned development in the Orlando MSA is focused in theSoutheast region of LeeVista and SR 417.
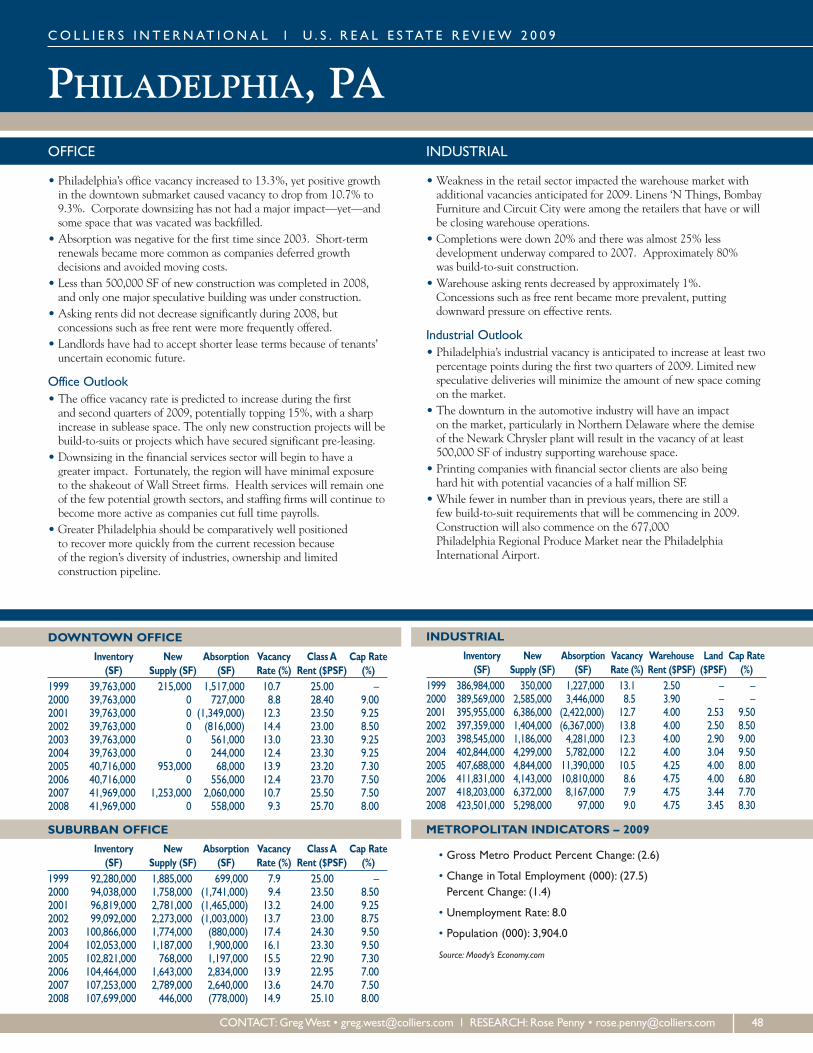
PHILADELPHIA, PA
DOWNTOWN OFFICE
Inventory New Absorption Vacancy ClassA Cap Rate(SF) Supply (SF) (SF) Rate (%) Rent ($PSF) (%)
1999 39,763,000 215,000 1,517,000 10.7 25.00 –2000 39,763,000 0 727,000 8.8 28.40 9.002001 39,763,000 0 (1,349,000) 12.3 23.50 9.252002 39,763,000 0 (816,000) 14.4 23.00 8.502003 39,763,000 0 561,000 13.0 23.30 9.252004 39,763,000 0 244,000 12.4 23.30 9.252005 40,716,000 953,000 68,000 13.9 23.20 7.302006 40,716,000 0 556,000 12.4 23.70 7.502007 41,969,000 1,253,000 2,060,000 10.7 25.50 7.502008 41,969,000 0 558,000 9.3 25.70 8.00
SUBURBAN OFFICE
Inventory New Absorption Vacancy ClassA Cap Rate(SF) Supply (SF) (SF) Rate (%) Rent ($PSF) (%)
1999 92,280,000 1,885,000 699,000 7.9 25.00 –2000 94,038,000 1,758,000 (1,741,000) 9.4 23.50 8.502001 96,819,000 2,781,000 (1,465,000) 13.2 24.00 9.252002 99,092,000 2,273,000 (1,003,000) 13.7 23.00 8.752003 100,866,000 1,774,000 (880,000) 17.4 24.30 9.502004 102,053,000 1,187,000 1,900,000 16.1 23.30 9.502005 102,821,000 768,000 1,197,000 15.5 22.90 7.302006 104,464,000 1,643,000 2,834,000 13.9 22.95 7.002007 107,253,000 2,789,000 2,640,000 13.6 24.70 7.502008 107,699,000 446,000 (778,000) 14.9 25.10 8.00
INDUSTRIAL
Inventory New Absorption Vacancy Warehouse Land Cap Rate(SF) Supply (SF) (SF) Rate (%) Rent ($PSF) ($PSF) (%)
1999 386,984,000 350,000 1,227,000 13.1 2.50 – –2000 389,569,000 2,585,000 3,446,000 8.5 3.90 – –2001 395,955,000 6,386,000 (2,422,000) 12.7 4.00 2.53 9.502002 397,359,000 1,404,000 (6,367,000) 13.8 4.00 2.50 8.502003 398,545,000 1,186,000 4,281,000 12.3 4.00 2.90 9.002004 402,844,000 4,299,000 5,782,000 12.2 4.00 3.04 9.502005 407,688,000 4,844,000 11,390,000 10.5 4.25 4.00 8.002006 411,831,000 4,143,000 10,810,000 8.6 4.75 4.00 6.802007 418,203,000 6,372,000 8,167,000 7.9 4.75 3.44 7.702008 423,501,000 5,298,000 97,000 9.0 4.75 3.45 8.30
METROPOLITAN INDICATORS – 2009
• Gross Metro Product Percent Change: (2.6)
• Change in Total Employment (000): (27.5)Percent Change: (1.4)
• Unemployment Rate: 8.0
• Population (000): 3,904.0
Source: Moody’s Economy.com
CO L L I E R S I N T E RNAT I ONA L l U . S . R E A L E S TAT E R E V I EW 2 0 0 9
CONTACT: GregWest • [email protected] l RESEARCH: Rose Penny • [email protected] 48
OFFICE
• Philadelphia’s office vacancy increased to 13.3%, yet positive growthin the downtown submarket caused vacancy to drop from 10.7% to9.3%. Corporate downsizing has not had a major impact—yet—andsome space that was vacated was backfilled.
• Absorption was negative for the first time since 2003. Short-termrenewals became more common as companies deferred growthdecisions and avoided moving costs.
• Less than 500,000 SF of new construction was completed in 2008,and only one major speculative building was under construction.
• Asking rents did not decrease significantly during 2008, butconcessions such as free rent were more frequently offered.
• Landlords have had to accept shorter lease terms because of tenants’uncertain economic future.
Office Outlook• The office vacancy rate is predicted to increase during the firstand second quarters of 2009, potentially topping 15%, with a sharpincrease in sublease space. The only new construction projects will bebuild-to-suits or projects which have secured significant pre-leasing.
• Downsizing in the financial services sector will begin to have agreater impact. Fortunately, the region will have minimal exposureto the shakeout of Wall Street firms. Health services will remain oneof the few potential growth sectors, and staffing firms will continue tobecome more active as companies cut full time payrolls.
• Greater Philadelphia should be comparatively well positionedto recover more quickly from the current recession becauseof the region’s diversity of industries, ownership and limitedconstruction pipeline.
INDUSTRIAL
• Weakness in the retail sector impacted the warehouse market withadditional vacancies anticipated for 2009. Linens ‘N Things, BombayFurniture and Circuit City were among the retailers that have or willbe closing warehouse operations.
• Completions were down 20% and there was almost 25% lessdevelopment underway compared to 2007. Approximately 80%was build-to-suit construction.
• Warehouse asking rents decreased by approximately 1%.Concessions such as free rent became more prevalent, puttingdownward pressure on effective rents.
Industrial Outlook• Philadelphia’s industrial vacancy is anticipated to increase at least twopercentage points during the first two quarters of 2009. Limited newspeculative deliveries will minimize the amount of new space comingon the market.
• The downturn in the automotive industry will have an impacton the market, particularly in Northern Delaware where the demiseof the Newark Chrysler plant will result in the vacancy of at least500,000 SF of industry supporting warehouse space.
• Printing companies with financial sector clients are also beinghard hit with potential vacancies of a half million SF.
• While fewer in number than in previous years, there are still afew build-to-suit requirements that will be commencing in 2009.Construction will also commence on the 677,000Philadelphia Regional Produce Market near the PhiladelphiaInternational Airport.

PHOENIX, AZCO L L I E R S I N T E RNAT I ONA L l U . S . R E A L E S TAT E R E V I EW 2 0 0 9
DOWNTOWN OFFICE
Inventory New Absorption Vacancy ClassA Cap Rate(SF) Supply (SF) (SF) Rate (%) Rent ($PSF) (%)
1999 18,188,000 399,000 (128,000) 9.2 29.40 –2000 18,202,000 14,000 (185,000) 10.5 22.00 –2001 19,328,000 1,126,000 (115,000) 17.0 21.80 –2002 19,328,000 0 (449,000) 18.6 18.40 10.402003 19,453,000 125,000 (109,000) 19.0 17.50 9.402004 19,621,000 168,000 111,000 18.3 19.40 8.252005 19,621,000 0 976,000 15.1 21.20 7.252006 19,621,000 0 1,165,000 10.6 21.40 7.502007 19,771,000 150,000 (188,000) 13.1 28.10 –2008 19,865,000 94,000 (102,000) 13.9 31.20 7.80
SUBURBAN OFFICE
Inventory New Absorption Vacancy ClassA Cap Rate(SF) Supply (SF) (SF) Rate (%) Rent ($PSF) (%)
1999 69,989,000 5,630,000 2,392,000 11.3 27.90 –2000 73,543,000 3,554,000 3,920,000 10.1 24.00 9.502001 78,944,000 5,401,000 1,785,000 16.9 24.00 9.852002 82,016,000 3,072,000 1,457,000 17.9 20.90 10.052003 83,701,000 1,685,000 2,618,000 16.1 20.10 9.002004 87,152,000 3,451,000 2,694,000 15.8 23.00 8.802005 89,934,000 2,782,000 5,676,000 13.5 22.70 7.852006 91,858,000 1,924,000 5,020,000 12.9 23.40 6.802007 98,334,000 6,476,000 2,693,000 14.5 28.20 6.202008 104,663,000 6,329,000 (781,000) 19.8 29.60 7.60
INDUSTRIAL
Inventory New Absorption Vacancy Warehouse Land Cap Rate(SF) Supply (SF) (SF) Rate (%) Rent ($PSF) ($PSF) (%)
1999 176,493,000 9,447,000 6,918,000 8.2 5.70 – –2000 182,202,000 5,709,000 5,069,000 8.3 4.00 – –2001 188,379,000 6,177,000 2,491,000 10.1 4.80 2.84 –2002 193,629,000 5,250,000 1,338,000 12.1 5.40 5.47 10.602003 196,529,000 2,900,000 215,000 13.2 5.90 4.50 9.902004 200,232,000 3,703,000 4,546,000 11.4 5.80 1.80 7.802005 204,601,000 4,369,000 8,766,000 9.5 6.30 4.58 7.702006 213,063,000 8,462,000 9,351,000 9.0 6.54 5.68 7.002007 219,891,000 6,828,000 4,733,000 10.1 5.98 15.46 7.102008 229,008,000 9,117,000 (2,588,000) 16.4 5.97 5.50 7.60
METROPOLITAN INDICATORS – 2009
• Gross Metro Product Percent Change: (0.7)
• Change in Total Employment (000): (73.7)Percent Change: (3.9)
• Unemployment Rate: 6.4
• Population (000): 4,353.3
Source: Moody’s Economy.com.
49 CONTACT: Bob Mulhern • [email protected] l RESEARCH:Matt DePinto • [email protected]
OFFICE
• Phoenix’s office absorption posted negative 1.25 million SF for 2008.• Office vacancy rates rose steadily during 2008 starting with 15.8%in the first quarter and ending the year with 19.1%.
• Office deliveries totaled 6.3 million SF at year-end, a slight dropfrom the 6.2 million SF witnessed in 2007. Under construction activitywas 3.63 million SF, off by nearly half at the same time last year.
• Office sales activity remained very slow. Investment sales volumeposted only $99 million with an average price of $169 per SF.
• Despite a diverse base, Phoenix suffered due to the housing marketcollapse. House prices were down over 28 % in 2008 which caused anextreme ripple effect throughout the area economy. New subdivisionland values declined along with retail and construction sectors.
• In the largest office transaction of the quarter, a 70,000 SF Class Aoffice building sold for $110.3 million, equating to $366.60 per SF.
Office Outlook• Construction will continue to decrease and absorption willcontinue to lag. Vacancy is expected to peak by the end of 2009.
• Downtown Phoenix’s infrastructure projects totaling over $6 billionhave spurred renewed interest in the downtown core. A newmixed-use project, CityScape will add a 550,000 SF office tower andsignificant retail components, with the office component complete byyear-end 2009. One Central Park East, a 26-story 480,000 SF officetower is expected to be done by the third quarter of 2009.
• Transit-oriented development zoning along the newly completed20-mile Metro light rail route is expected to boost potential newprojects and rehabilitation of existing properties.
INDUSTRIAL
• Phoenix’s industrial absorption posted a negative 2.59 million SFfor 2008. The fourth quarter negative rate nearly erased absorptiongains from last quarter.
• Industrial vacancy rates rose during 2008 starting with 10.1%in the first quarter and ending the year up at 16.4%.
• Industrial deliveries totaled 770,600 SF in the fourth quartercompared with 2.22 million in the last quarter of 2007.No construction activity was recorded for the fourth quarter of 2008.
• Industrial sales activity remained very slow. Total sales volume posted$103 million with the average price posting $85.66 per SF. Total salesvolume is about half of last quarter’s volume.
• In the largest industrial transaction of the quarter a 135,968 SFClass A warehouse property sold for $17.9million, or $131.65 per SF.
Industrial Outlook• New construction activity will be very slow for most of 2009.Vacancies should peak by mid-2010.
• Despite a slowdown of net in-migration, Phoenix ranked #2in population growth nationwide. The fundamentals of tourismand low housing costs should keep the Valley better situatedthan other metro areas.
• The Metro Light Rail should boost the industrial market as largeportions of East Phoenix and Tempe have industrial projects andvacant land to build. Transit-oriented development (TOD) zoningalong the route will stimulate new projects and rehabilitateexisting properties.
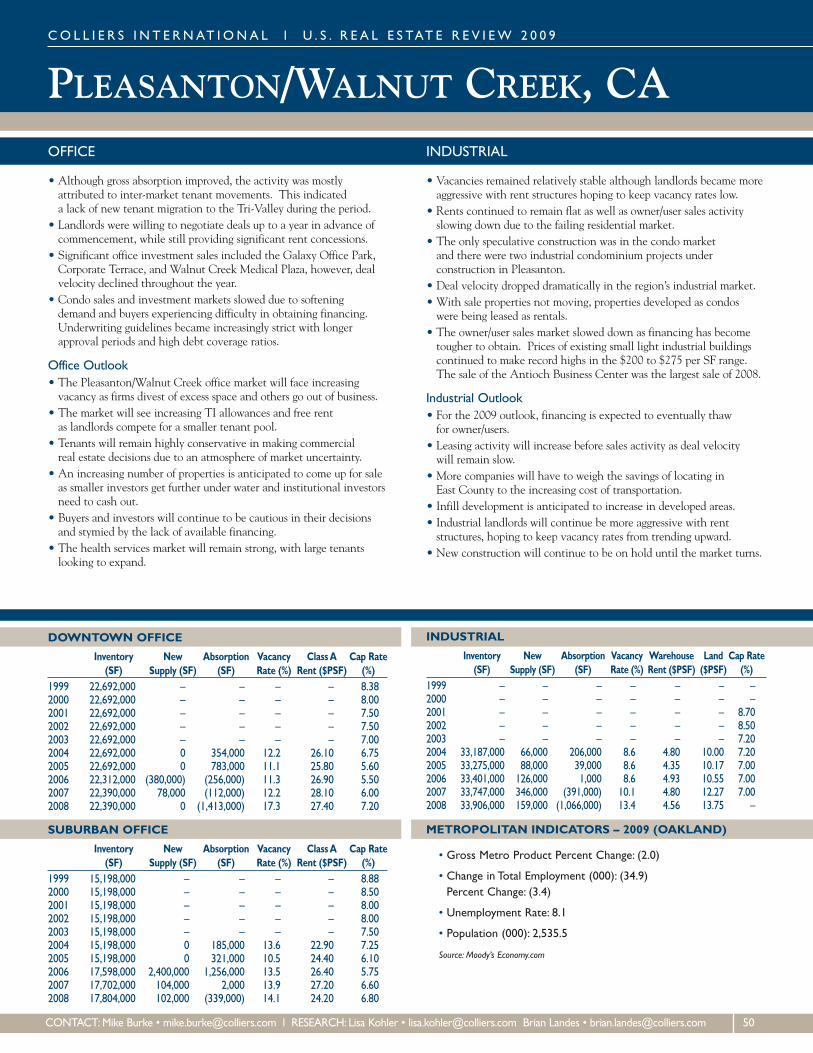
PLEASANTON/WALNUT CREEK, CA
DOWNTOWN OFFICE
Inventory New Absorption Vacancy ClassA Cap Rate(SF) Supply (SF) (SF) Rate (%) Rent ($PSF) (%)
1999 22,692,000 – – – – 8.382000 22,692,000 – – – – 8.002001 22,692,000 – – – – 7.502002 22,692,000 – – – – 7.502003 22,692,000 – – – – 7.002004 22,692,000 0 354,000 12.2 26.10 6.752005 22,692,000 0 783,000 11.1 25.80 5.602006 22,312,000 (380,000) (256,000) 11.3 26.90 5.502007 22,390,000 78,000 (112,000) 12.2 28.10 6.002008 22,390,000 0 (1,413,000) 17.3 27.40 7.20
SUBURBAN OFFICE
Inventory New Absorption Vacancy ClassA Cap Rate(SF) Supply (SF) (SF) Rate (%) Rent ($PSF) (%)
1999 15,198,000 – – – – 8.882000 15,198,000 – – – – 8.502001 15,198,000 – – – – 8.002002 15,198,000 – – – – 8.002003 15,198,000 – – – – 7.502004 15,198,000 0 185,000 13.6 22.90 7.252005 15,198,000 0 321,000 10.5 24.40 6.102006 17,598,000 2,400,000 1,256,000 13.5 26.40 5.752007 17,702,000 104,000 2,000 13.9 27.20 6.602008 17,804,000 102,000 (339,000) 14.1 24.20 6.80
INDUSTRIAL
Inventory New Absorption Vacancy Warehouse Land Cap Rate(SF) Supply (SF) (SF) Rate (%) Rent ($PSF) ($PSF) (%)
1999 – – – – – – –2000 – – – – – – –2001 – – – – – – 8.702002 – – – – – – 8.502003 – – – – – – 7.202004 33,187,000 66,000 206,000 8.6 4.80 10.00 7.202005 33,275,000 88,000 39,000 8.6 4.35 10.17 7.002006 33,401,000 126,000 1,000 8.6 4.93 10.55 7.002007 33,747,000 346,000 (391,000) 10.1 4.80 12.27 7.002008 33,906,000 159,000 (1,066,000) 13.4 4.56 13.75 –
METROPOLITAN INDICATORS – 2009 (OAKLAND)
• Gross Metro Product Percent Change: (2.0)
• Change in Total Employment (000): (34.9)Percent Change: (3.4)
• Unemployment Rate: 8.1
• Population (000): 2,535.5
Source: Moody’s Economy.com
CO L L I E R S I N T E RNAT I ONA L l U . S . R E A L E S TAT E R E V I EW 2 0 0 9
CONTACT:Mike Burke • [email protected] l RESEARCH: Lisa Kohler • [email protected] Brian Landes • [email protected] 50
OFFICE
• Although gross absorption improved, the activity was mostlyattributed to inter-market tenant movements. This indicateda lack of new tenant migration to the Tri-Valley during the period.
• Landlords were willing to negotiate deals up to a year in advance ofcommencement, while still providing significant rent concessions.
• Significant office investment sales included the Galaxy Office Park,Corporate Terrace, and Walnut Creek Medical Plaza, however, dealvelocity declined throughout the year.
• Condo sales and investment markets slowed due to softeningdemand and buyers experiencing difficulty in obtaining financing.Underwriting guidelines became increasingly strict with longerapproval periods and high debt coverage ratios.
Office Outlook• The Pleasanton/Walnut Creek office market will face increasingvacancy as firms divest of excess space and others go out of business.
• The market will see increasing TI allowances and free rentas landlords compete for a smaller tenant pool.
• Tenants will remain highly conservative in making commercialreal estate decisions due to an atmosphere of market uncertainty.
• An increasing number of properties is anticipated to come up for saleas smaller investors get further under water and institutional investorsneed to cash out.
• Buyers and investors will continue to be cautious in their decisionsand stymied by the lack of available financing.
• The health services market will remain strong, with large tenantslooking to expand.
INDUSTRIAL
• Vacancies remained relatively stable although landlords became moreaggressive with rent structures hoping to keep vacancy rates low.
• Rents continued to remain flat as well as owner/user sales activityslowing down due to the failing residential market.
• The only speculative construction was in the condo marketand there were two industrial condominium projects underconstruction in Pleasanton.
• Deal velocity dropped dramatically in the region’s industrial market.• With sale properties not moving, properties developed as condoswere being leased as rentals.
• The owner/user sales market slowed down as financing has becometougher to obtain. Prices of existing small light industrial buildingscontinued to make record highs in the $200 to $275 per SF range.The sale of the Antioch Business Center was the largest sale of 2008.
Industrial Outlook• For the 2009 outlook, financing is expected to eventually thawfor owner/users.
• Leasing activity will increase before sales activity as deal velocitywill remain slow.
• More companies will have to weigh the savings of locating inEast County to the increasing cost of transportation.
• Infill development is anticipated to increase in developed areas.• Industrial landlords will continue be more aggressive with rentstructures, hoping to keep vacancy rates from trending upward.
• New construction will continue to be on hold until the market turns.

PORTLAND, ORCO L L I E R S I N T E RNAT I ONA L l U . S . R E A L E S TAT E R E V I EW 2 0 0 9
DOWNTOWN OFFICE
Inventory New Absorption Vacancy ClassA Cap Rate(SF) Supply (SF) (SF) Rate (%) Rent ($PSF) (%)
1999 32,061,000 0 56,000 6.3 27.30 –2000 32,515,000 454,000 758,000 5.4 25.00 9.502001 32,585,000 70,000 (814,000) 11.3 27.00 9.502002 33,353,000 768,000 (214,000) 15.1 22.00 9.252003 33,541,000 188,000 212,000 12.7 21.00 8.252004 33,541,000 0 113,000 12.8 20.10 8.102005 33,541,000 0 104,000 12.7 20.50 7.002006 33,541,000 0 280,000 11.7 21.30 7.252007 33,541,000 0 1,399,000 8.5 23.60 6.202008 33,863,000 322,000 404,000 7.0 25.40 7.00
SUBURBAN OFFICE
Inventory New Absorption Vacancy ClassA Cap Rate(SF) Supply (SF) (SF) Rate (%) Rent ($PSF) (%)
1999 35,687,000 464,000 243,000 10.0 21.50 –2000 36,504,000 817,000 1,306,000 7.9 23.50 9.502001 37,858,000 1,354,000 (18,000) 12.0 23.00 9.502002 37,998,000 140,000 (794,000) 14.0 23.00 9.252003 39,544,000 1,546,000 (252,000) 17.3 21.00 8.102004 40,101,000 557,000 1,536,000 14.3 20.60 8.002005 40,345,000 244,000 1,369,000 10.9 21.80 8.002006 40,988,000 643,000 442,000 11.7 21.80 7.502007 41,312,000 324,000 884,000 11.6 23.90 6.502008 42,036,000 724,000 172,000 11.7 24.60 6.35
INDUSTRIAL
Inventory New Absorption Vacancy Warehouse Land Cap Rate(SF) Supply (SF) (SF) Rate (%) Rent ($PSF) ($PSF) (%)
1999 155,140,000 2,087,000 1,683,000 8.1 4.10 – –2000 156,553,000 1,413,000 2,466,000 4.8 3.50 – –2001 157,605,000 1,052,000 (1,219,000) 8.5 5.00 5.50 9.002002 158,541,000 936,000 455,000 16.4 5.00 5.00 9.002003 160,894,000 2,353,000 2,609,000 16.4 4.80 4.70 8.502004 162,007,000 1,113,000 5,001,000 13.9 4.60 4.40 8.002005 163,326,000 1,319,000 4,839,000 10.8 4.55 7.61 8.952006 165,852,000 2,526,000 4,189,000 9.6 4.71 6.51 7.652007 168,798,000 2,946,000 4,061,000 7.3 7.60 4.51 7.002008 170,417,000 1,619,000 1,167,000 6.7 5.52 9.20 6.73
METROPOLITAN INDICATORS – 2009
• Gross Metro Product Percent Change: 0.4
• Change in Total Employment (000): (25.3)Percent Change: (2.4)
• Unemployment Rate: 8.1
• Population (000): 2,246.9
Source: Moody’s Economy.com
51 CONTACT:Tom Lawwill • [email protected] l RESEARCH: Crispin Argento • [email protected]
OFFICE
• Educational and health services were Portland’s fastest growingindustries with 3.4% growth in 2008. Computer systems and designfollowed, with 1.3 % growth over last year.
• The largest leases signed in 2008 involved Regence BlueCrossBlueShield of Oregon taking 228,200 SF, Wells Fargo Bank leasing212,000 SF, and Stoel Rives leasing 168,300 SF. The largest salesincluded the $283 million purchase of U.S. Bancorp Tower byLaSalle Bank and a $63.1 million portfolio purchase of fourdowntown Portland landmark office buildings.
• Within the CBD, Corporate Class A office rates continued toincrease 10% to 11% per year, averaging about $28 per SF annually.
• Among the largest metro areas, Portland had one of the lowestforeclosure rates in the nation due to smart growth initiatives,controlled appreciation, and affordability of housing.
Office Outlook• 2009 vacancy rates are projected to increase slightly, especiallyin suburban submarkets. CBD and Central City vacancy willdecrease until new product is delivered in 2010.
• In October 2008, TriMet’sWestside Commuter Rail line opened,servicing suburban dwellers along the I-5 Corridor. In Septemberof 2009, the new MAX light rail line will open serving riders fromPortland to Clackamas County.
• 1.3 million SF of new office product will be delivered within theCBD between 2009 and 2012, many of which are LEED Certified.
• Portland plans to implement a revised citywide green building policyusing fee/rebate incentives to address climate change and create localeconomic growth.
INDUSTRIAL
• Primary metals manufacturing employment grew 1.5%, makingit Portland’s fastest growing industrial real estate related industry.
• Renewable energy firms in solar and wind focused on Oregon,including Solarworld, Solaicx, Sanyo, Vestas, etc.
• The weak dollar benefited Oregon exports during 2008, howeveryear-over-year marine TEU’s decreased 8.5%.
• In 2008, industrial vacancy rates increased to 7.1% from5.6% over last year.
• Over 1.7 million SF of new industrial product was deliveredin 2008. FedEx began construction on a state-of-the-art570,800 SF distribution hub in Portland.
• In November 2008, Oregon had 191,200 manufacturing jobsor 11% of total non-farm employment, compared with13.6 million or 9.6% for U.S.
Industrial Outlook• 2009-2010 is projected to remain relatively stable; vacancywill be between 8.5-9.5%
• Continued interest from renewable energy investments inOregon will help industrial real estate.
• The American Recovery and Reinvestment Act of 2009is estimated to bring 44,000 jobs to Oregon, with heavyinvestments in infrastructure, construction, and renewable energy.
• Tenant turnover will put additional stress on the industrial market,however many tenants will find lower rental rates, increasedconcessions, and favorable terms.
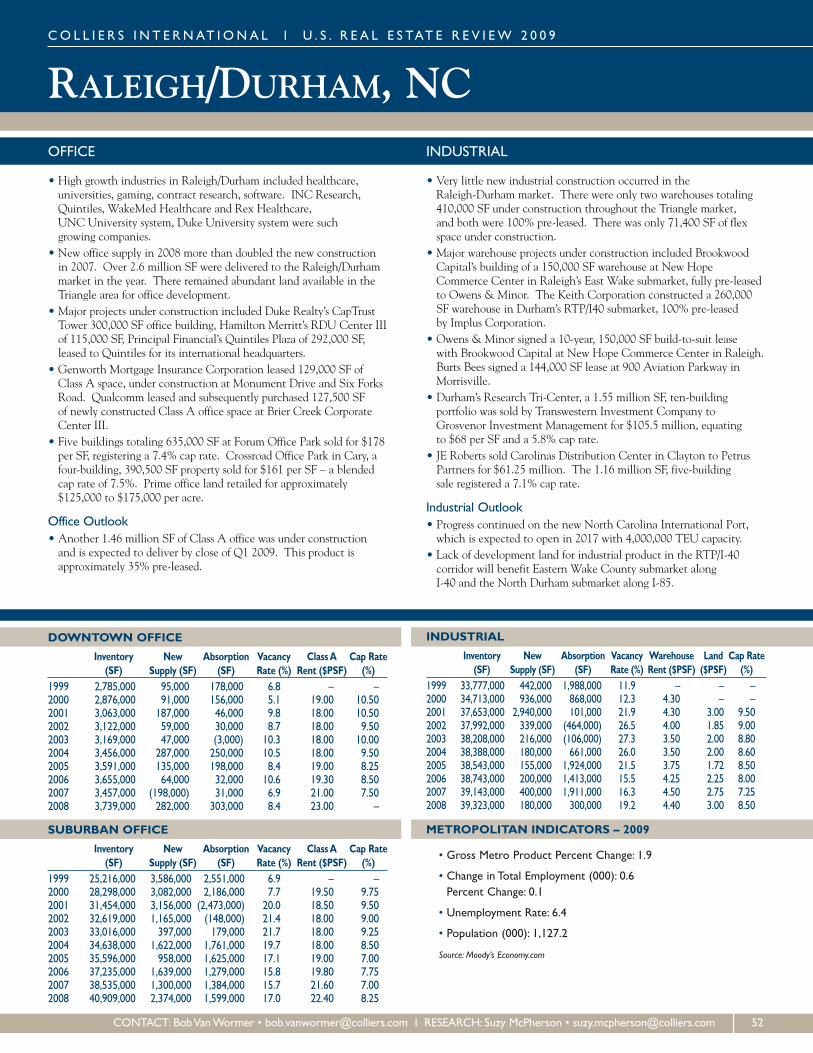
RALEIGH/DURHAM, NC
DOWNTOWN OFFICE
Inventory New Absorption Vacancy ClassA Cap Rate(SF) Supply (SF) (SF) Rate (%) Rent ($PSF) (%)
1999 2,785,000 95,000 178,000 6.8 – –2000 2,876,000 91,000 156,000 5.1 19.00 10.502001 3,063,000 187,000 46,000 9.8 18.00 10.502002 3,122,000 59,000 30,000 8.7 18.00 9.502003 3,169,000 47,000 (3,000) 10.3 18.00 10.002004 3,456,000 287,000 250,000 10.5 18.00 9.502005 3,591,000 135,000 198,000 8.4 19.00 8.252006 3,655,000 64,000 32,000 10.6 19.30 8.502007 3,457,000 (198,000) 31,000 6.9 21.00 7.502008 3,739,000 282,000 303,000 8.4 23.00 –
SUBURBAN OFFICE
Inventory New Absorption Vacancy ClassA Cap Rate(SF) Supply (SF) (SF) Rate (%) Rent ($PSF) (%)
1999 25,216,000 3,586,000 2,551,000 6.9 – –2000 28,298,000 3,082,000 2,186,000 7.7 19.50 9.752001 31,454,000 3,156,000 (2,473,000) 20.0 18.50 9.502002 32,619,000 1,165,000 (148,000) 21.4 18.00 9.002003 33,016,000 397,000 179,000 21.7 18.00 9.252004 34,638,000 1,622,000 1,761,000 19.7 18.00 8.502005 35,596,000 958,000 1,625,000 17.1 19.00 7.002006 37,235,000 1,639,000 1,279,000 15.8 19.80 7.752007 38,535,000 1,300,000 1,384,000 15.7 21.60 7.002008 40,909,000 2,374,000 1,599,000 17.0 22.40 8.25
INDUSTRIAL
Inventory New Absorption Vacancy Warehouse Land Cap Rate(SF) Supply (SF) (SF) Rate (%) Rent ($PSF) ($PSF) (%)
1999 33,777,000 442,000 1,988,000 11.9 – – –2000 34,713,000 936,000 868,000 12.3 4.30 – –2001 37,653,000 2,940,000 101,000 21.9 4.30 3.00 9.502002 37,992,000 339,000 (464,000) 26.5 4.00 1.85 9.002003 38,208,000 216,000 (106,000) 27.3 3.50 2.00 8.802004 38,388,000 180,000 661,000 26.0 3.50 2.00 8.602005 38,543,000 155,000 1,924,000 21.5 3.75 1.72 8.502006 38,743,000 200,000 1,413,000 15.5 4.25 2.25 8.002007 39,143,000 400,000 1,911,000 16.3 4.50 2.75 7.252008 39,323,000 180,000 300,000 19.2 4.40 3.00 8.50
METROPOLITAN INDICATORS – 2009
• Gross Metro Product Percent Change: 1.9
• Change in Total Employment (000): 0.6Percent Change: 0.1
• Unemployment Rate: 6.4
• Population (000): 1,127.2
Source: Moody’s Economy.com
CO L L I E R S I N T E RNAT I ONA L l U . S . R E A L E S TAT E R E V I EW 2 0 0 9
CONTACT: BobVanWormer • [email protected] l RESEARCH: Suzy McPherson • [email protected] 52
OFFICE
• High growth industries in Raleigh/Durham included healthcare,universities, gaming, contract research, software. INC Research,Quintiles, WakeMed Healthcare and Rex Healthcare,UNC University system, Duke University system were suchgrowing companies.
• New office supply in 2008 more than doubled the new constructionin 2007. Over 2.6 million SF were delivered to the Raleigh/Durhammarket in the year. There remained abundant land available in theTriangle area for office development.
• Major projects under construction included Duke Realty’s CapTrustTower 300,000 SF office building, Hamilton Merritt’s RDU Center IIIof 115,000 SF, Principal Financial’s Quintiles Plaza of 292,000 SF,leased to Quintiles for its international headquarters.
• Genworth Mortgage Insurance Corporation leased 129,000 SF ofClass A space, under construction at Monument Drive and Six ForksRoad. Qualcomm leased and subsequently purchased 127,500 SFof newly constructed Class A office space at Brier Creek CorporateCenter III.
• Five buildings totaling 635,000 SF at Forum Office Park sold for $178per SF, registering a 7.4% cap rate. Crossroad Office Park in Cary, afour-building, 390,500 SF property sold for $161 per SF – a blendedcap rate of 7.5%. Prime office land retailed for approximately$125,000 to $175,000 per acre.
Office Outlook• Another 1.46 million SF of Class A office was under constructionand is expected to deliver by close of Q1 2009. This product isapproximately 35% pre-leased.
INDUSTRIAL
• Very little new industrial construction occurred in theRaleigh-Durham market. There were only two warehouses totaling410,000 SF under construction throughout the Triangle market,and both were 100% pre-leased. There was only 71,400 SF of flexspace under construction.
• Major warehouse projects under construction included BrookwoodCapital’s building of a 150,000 SF warehouse at New HopeCommerce Center in Raleigh’s East Wake submarket, fully pre-leasedto Owens & Minor. The Keith Corporation constructed a 260,000SF warehouse in Durham’s RTP/I40 submarket, 100% pre-leasedby Implus Corporation.
• Owens & Minor signed a 10-year, 150,000 SF build-to-suit leasewith Brookwood Capital at New Hope Commerce Center in Raleigh.Burts Bees signed a 144,000 SF lease at 900 Aviation Parkway inMorrisville.
• Durham’s Research Tri-Center, a 1.55 million SF, ten-buildingportfolio was sold by Transwestern Investment Company toGrosvenor Investment Management for $105.5 million, equatingto $68 per SF and a 5.8% cap rate.
• JE Roberts sold Carolinas Distribution Center in Clayton to PetrusPartners for $61.25 million. The 1.16 million SF, five-buildingsale registered a 7.1% cap rate.
Industrial Outlook• Progress continued on the new North Carolina International Port,which is expected to open in 2017 with 4,000,000 TEU capacity.
• Lack of development land for industrial product in the RTP/I-40corridor will benefit Eastern Wake County submarket alongI-40 and the North Durham submarket along I-85.

RENO, NVCO L L I E R S I N T E RNAT I ONA L l U . S . R E A L E S TAT E R E V I EW 2 0 0 9
DOWNTOWN OFFICE
Inventory New Absorption Vacancy ClassA Cap Rate(SF) Supply (SF) (SF) Rate (%) Rent ($PSF) (%)
1999 1,318,000 – – – – –2000 1,318,000 – – – – –2001 1,318,000 0 (28,000) 13.8 – –2002 1,318,000 0 19,000 12.6 20.00 9.502003 1,318,000 0 22,000 11.3 20.50 9.502004 1,318,000 0 (24,000) 12.4 20.20 9.002005 1,318,000 0 (91,000) 17.9 21.00 8.902006 1,318,000 0 132,000 8.5 23.50 9.002007 1,318,000 0 (8,000) 17.8 22.90 7.502008 1,318,000 0 (23,000) 21.0 22.90 8.00
SUBURBAN OFFICE
Inventory New Absorption Vacancy ClassA Cap Rate(SF) Supply (SF) (SF) Rate (%) Rent ($PSF) (%)
1999 4,099,000 – – – – –2000 4,099,000 – – – – –2001 4,169,000 70,000 98,000 12.4 – –2002 4,395,000 226,000 317,000 10.3 20.60 9.002003 4,629,000 234,000 238,000 9.4 20.50 9.002004 4,902,000 273,000 79,000 13.3 21.10 8.002005 5,122,000 220,000 87,000 14.2 22.80 7.502006 5,122,000 0 31,000 12.3 24.00 7.002007 5,205,000 83,000 (85,000) 14.9 24.00 7.502008 5,312,000 107,000 (125,000) 18.7 22.80 7.75
INDUSTRIAL
Inventory New Absorption Vacancy Warehouse Land Cap Rate(SF) Supply (SF) (SF) Rate (%) Rent ($PSF) ($PSF) (%)
1999 – – – – – – –2000 – – – – – – –2001 57,300,000 2,543,000 1,526,000 8.8 3.70 2.50 8.752002 58,559,000 1,259,000 717,000 9.8 3.50 2.20 9.302003 59,651,000 1,092,000 269,000 10.9 3.50 2.20 8.602004 61,218,000 1,567,000 2,805,000 8.7 3.50 2.00 8.252005 62,822,000 1,604,000 1,986,000 6.2 3.50 3.75 7.502006 64,113,000 1,291,000 2,210,000 5.0 4.08 3.75 6.502007 68,432,000 4,319,000 1,658,000 8.9 4.32 3.88 6.752008 71,355,000 2,923,000 207,000 13.3 3.24 4.00 –
METROPOLITAN INDICATORS – 2009
• Gross Metro Product Percent Change: (1.8)
• Change in Total Employment (000): (7.0)Percent Change: (3.1)
• Unemployment Rate: 8.7
• Population (000): 419.8
Source: Moody’s Economy.com
53 CONTACT:Tim Ruffin • [email protected] l RESEARCH: Krystal Christiaens • [email protected]
OFFICE
• Housing-related industries continued to struggle or close up shop.Following the housing industry, mortgage companies, title companiesand engineering firms struggled as well.
• Other large companies not related to housing also downsizedto cut costs.
• There was minimal new office development in 2008. A 78,000 SFbuild-to-suit was completed for Employers Insurance, and threebuildings in the 10,000 SF range were completed for owners/userswith expansion space.
• Transaction velocity slowed in both the sales and leasing arena.The majority of the activity was from tenants downsizing or renewingtheir current leases.
• Reno’s office vacancy hit an all time high at 19.1% in 2008. In otherwords, one in every five offices in Reno was vacant.
• Lease rates dropped to the same rates as ten years ago when themarket began heating up.
• There were virtually no land sales as developers, who held mostof the land, realized if they sell, they cannot re-enter the market.
Office Outlook• Reno’s office vacancy will remain high as the growth of healthytenants will be offset by failing businesses.
• Absorption is expected to be flat for the same reason.• New construction will be non-existent except forbuilt-to-suit projects.
• Land prices are anticipated to fall, if land is sold.• Rents will stay flat with a slight uptick at the end of the 2009.
INDUSTRIAL
• Reno’s industrial vacancy rate climbed steadily in 2008 due to thecompletion of new construction. The year ended with an overallvacancy rate of 13.3%, up from 8.9% at year-end 2007.
• Migration from the Sparks industrial core to the outlying submarketsof McCarran or Stead continued to be a trend in the market.
• Overall, 2008 was slower than previous years, but absorptioncontinued to post positive growth as outside companies lookedto create a West Coast footprint.
• The biggest impact to the economy was to the transaction velocity.• Rental rates remained flat in 2008, but lease concessions suchas free rent, shorter lease terms and increased tenant improvementallowances were being dispensed more liberally than in past years.The average warehouse rental rate was $3.24 per SF at year-end 2008.
Industrial Outlook• Industrial vacancy rates will continue to slowly creep upwardas companies consolidate or close.
• Absorption will remain flat with low demand for space.• New industrial construction will be down until the existingvacancy space is absorbed.
• Rental rates are anticipated to stabilize slightly belowour current rates.
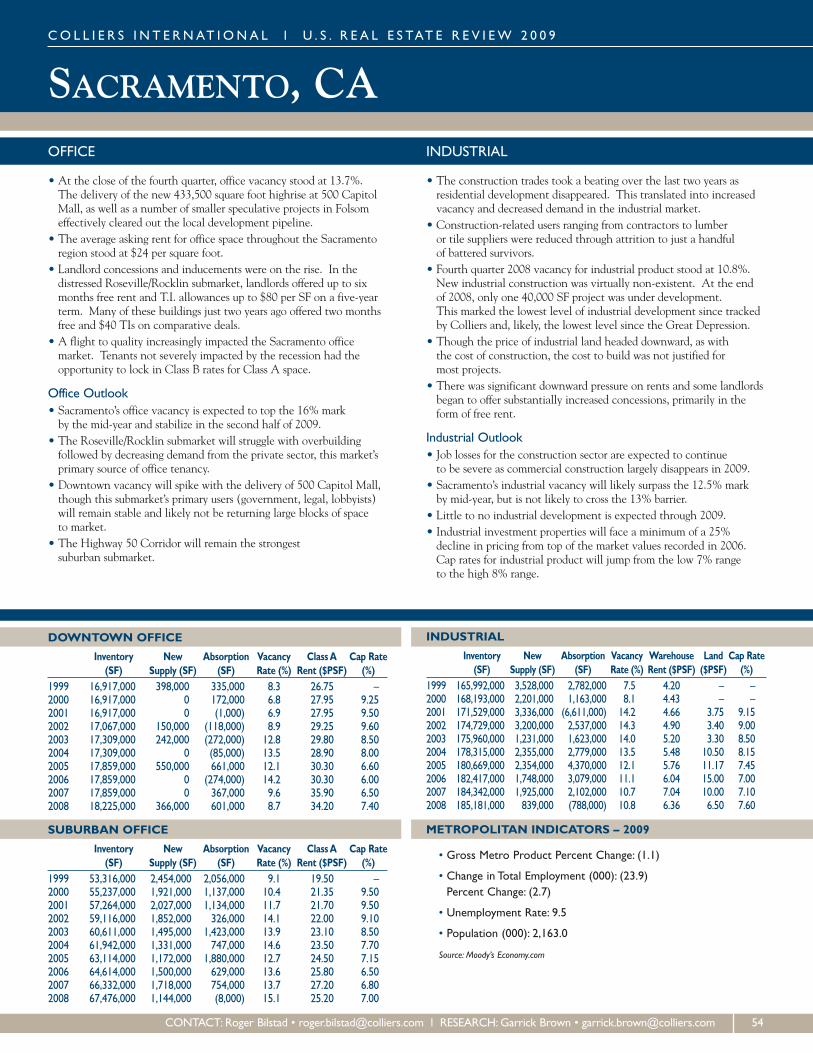
SACRAMENTO, CA
DOWNTOWN OFFICE
Inventory New Absorption Vacancy ClassA Cap Rate(SF) Supply (SF) (SF) Rate (%) Rent ($PSF) (%)
1999 16,917,000 398,000 335,000 8.3 26.75 –2000 16,917,000 0 172,000 6.8 27.95 9.252001 16,917,000 0 (1,000) 6.9 27.95 9.502002 17,067,000 150,000 (118,000) 8.9 29.25 9.602003 17,309,000 242,000 (272,000) 12.8 29.80 8.502004 17,309,000 0 (85,000) 13.5 28.90 8.002005 17,859,000 550,000 661,000 12.1 30.30 6.602006 17,859,000 0 (274,000) 14.2 30.30 6.002007 17,859,000 0 367,000 9.6 35.90 6.502008 18,225,000 366,000 601,000 8.7 34.20 7.40
SUBURBAN OFFICE
Inventory New Absorption Vacancy ClassA Cap Rate(SF) Supply (SF) (SF) Rate (%) Rent ($PSF) (%)
1999 53,316,000 2,454,000 2,056,000 9.1 19.50 –2000 55,237,000 1,921,000 1,137,000 10.4 21.35 9.502001 57,264,000 2,027,000 1,134,000 11.7 21.70 9.502002 59,116,000 1,852,000 326,000 14.1 22.00 9.102003 60,611,000 1,495,000 1,423,000 13.9 23.10 8.502004 61,942,000 1,331,000 747,000 14.6 23.50 7.702005 63,114,000 1,172,000 1,880,000 12.7 24.50 7.152006 64,614,000 1,500,000 629,000 13.6 25.80 6.502007 66,332,000 1,718,000 754,000 13.7 27.20 6.802008 67,476,000 1,144,000 (8,000) 15.1 25.20 7.00
INDUSTRIAL
Inventory New Absorption Vacancy Warehouse Land Cap Rate(SF) Supply (SF) (SF) Rate (%) Rent ($PSF) ($PSF) (%)
1999 165,992,000 3,528,000 2,782,000 7.5 4.20 – –2000 168,193,000 2,201,000 1,163,000 8.1 4.43 – –2001 171,529,000 3,336,000 (6,611,000) 14.2 4.66 3.75 9.152002 174,729,000 3,200,000 2,537,000 14.3 4.90 3.40 9.002003 175,960,000 1,231,000 1,623,000 14.0 5.20 3.30 8.502004 178,315,000 2,355,000 2,779,000 13.5 5.48 10.50 8.152005 180,669,000 2,354,000 4,370,000 12.1 5.76 11.17 7.452006 182,417,000 1,748,000 3,079,000 11.1 6.04 15.00 7.002007 184,342,000 1,925,000 2,102,000 10.7 7.04 10.00 7.102008 185,181,000 839,000 (788,000) 10.8 6.36 6.50 7.60
METROPOLITAN INDICATORS – 2009
• Gross Metro Product Percent Change: (1.1)
• Change in Total Employment (000): (23.9)Percent Change: (2.7)
• Unemployment Rate: 9.5
• Population (000): 2,163.0
Source: Moody’s Economy.com
CO L L I E R S I N T E RNAT I ONA L l U . S . R E A L E S TAT E R E V I EW 2 0 0 9
CONTACT: Roger Bilstad • [email protected] l RESEARCH:Garrick Brown • [email protected] 54
OFFICE
• At the close of the fourth quarter, office vacancy stood at 13.7%.The delivery of the new 433,500 square foot highrise at 500 CapitolMall, as well as a number of smaller speculative projects in Folsomeffectively cleared out the local development pipeline.
• The average asking rent for office space throughout the Sacramentoregion stood at $24 per square foot.
• Landlord concessions and inducements were on the rise. In thedistressed Roseville/Rocklin submarket, landlords offered up to sixmonths free rent and T.I. allowances up to $80 per SF on a five-yearterm. Many of these buildings just two years ago offered two monthsfree and $40 TIs on comparative deals.
• A flight to quality increasingly impacted the Sacramento officemarket. Tenants not severely impacted by the recession had theopportunity to lock in Class B rates for Class A space.
Office Outlook• Sacramento’s office vacancy is expected to top the 16% markby the mid-year and stabilize in the second half of 2009.
• The Roseville/Rocklin submarket will struggle with overbuildingfollowed by decreasing demand from the private sector, this market’sprimary source of office tenancy.
• Downtown vacancy will spike with the delivery of 500 Capitol Mall,though this submarket’s primary users (government, legal, lobbyists)will remain stable and likely not be returning large blocks of spaceto market.
• The Highway 50 Corridor will remain the strongestsuburban submarket.
INDUSTRIAL
• The construction trades took a beating over the last two years asresidential development disappeared. This translated into increasedvacancy and decreased demand in the industrial market.
• Construction-related users ranging from contractors to lumberor tile suppliers were reduced through attrition to just a handfulof battered survivors.
• Fourth quarter 2008 vacancy for industrial product stood at 10.8%.New industrial construction was virtually non-existent. At the endof 2008, only one 40,000 SF project was under development.This marked the lowest level of industrial development since trackedby Colliers and, likely, the lowest level since the Great Depression.
• Though the price of industrial land headed downward, as withthe cost of construction, the cost to build was not justified formost projects.
• There was significant downward pressure on rents and some landlordsbegan to offer substantially increased concessions, primarily in theform of free rent.
Industrial Outlook• Job losses for the construction sector are expected to continueto be severe as commercial construction largely disappears in 2009.
• Sacramento’s industrial vacancy will likely surpass the 12.5% markby mid-year, but is not likely to cross the 13% barrier.
• Little to no industrial development is expected through 2009.• Industrial investment properties will face a minimum of a 25%decline in pricing from top of the market values recorded in 2006.Cap rates for industrial product will jump from the low 7% rangeto the high 8% range.
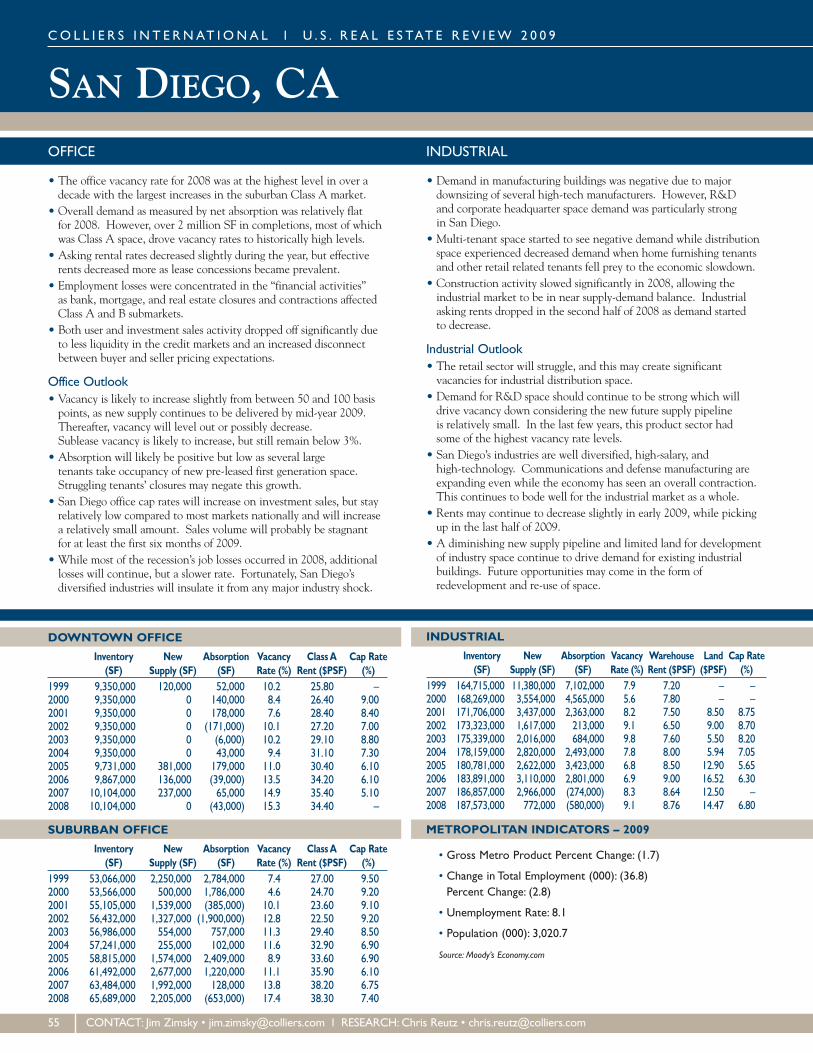
SAN DIEGO, CACO L L I E R S I N T E RNAT I ONA L l U . S . R E A L E S TAT E R E V I EW 2 0 0 9
DOWNTOWN OFFICE
Inventory New Absorption Vacancy ClassA Cap Rate(SF) Supply (SF) (SF) Rate (%) Rent ($PSF) (%)
1999 9,350,000 120,000 52,000 10.2 25.80 –2000 9,350,000 0 140,000 8.4 26.40 9.002001 9,350,000 0 178,000 7.6 28.40 8.402002 9,350,000 0 (171,000) 10.1 27.20 7.002003 9,350,000 0 (6,000) 10.2 29.10 8.802004 9,350,000 0 43,000 9.4 31.10 7.302005 9,731,000 381,000 179,000 11.0 30.40 6.102006 9,867,000 136,000 (39,000) 13.5 34.20 6.102007 10,104,000 237,000 65,000 14.9 35.40 5.102008 10,104,000 0 (43,000) 15.3 34.40 –
SUBURBAN OFFICE
Inventory New Absorption Vacancy ClassA Cap Rate(SF) Supply (SF) (SF) Rate (%) Rent ($PSF) (%)
1999 53,066,000 2,250,000 2,784,000 7.4 27.00 9.502000 53,566,000 500,000 1,786,000 4.6 24.70 9.202001 55,105,000 1,539,000 (385,000) 10.1 23.60 9.102002 56,432,000 1,327,000 (1,900,000) 12.8 22.50 9.202003 56,986,000 554,000 757,000 11.3 29.40 8.502004 57,241,000 255,000 102,000 11.6 32.90 6.902005 58,815,000 1,574,000 2,409,000 8.9 33.60 6.902006 61,492,000 2,677,000 1,220,000 11.1 35.90 6.102007 63,484,000 1,992,000 128,000 13.8 38.20 6.752008 65,689,000 2,205,000 (653,000) 17.4 38.30 7.40
INDUSTRIAL
Inventory New Absorption Vacancy Warehouse Land Cap Rate(SF) Supply (SF) (SF) Rate (%) Rent ($PSF) ($PSF) (%)
1999 164,715,000 11,380,000 7,102,000 7.9 7.20 – –2000 168,269,000 3,554,000 4,565,000 5.6 7.80 – –2001 171,706,000 3,437,000 2,363,000 8.2 7.50 8.50 8.752002 173,323,000 1,617,000 213,000 9.1 6.50 9.00 8.702003 175,339,000 2,016,000 684,000 9.8 7.60 5.50 8.202004 178,159,000 2,820,000 2,493,000 7.8 8.00 5.94 7.052005 180,781,000 2,622,000 3,423,000 6.8 8.50 12.90 5.652006 183,891,000 3,110,000 2,801,000 6.9 9.00 16.52 6.302007 186,857,000 2,966,000 (274,000) 8.3 8.64 12.50 –2008 187,573,000 772,000 (580,000) 9.1 8.76 14.47 6.80
METROPOLITAN INDICATORS – 2009
• Gross Metro Product Percent Change: (1.7)
• Change in Total Employment (000): (36.8)Percent Change: (2.8)
• Unemployment Rate: 8.1
• Population (000): 3,020.7
Source: Moody’s Economy.com
55 CONTACT: Jim Zimsky • [email protected] l RESEARCH: Chris Reutz • [email protected]
OFFICE
• The office vacancy rate for 2008 was at the highest level in over adecade with the largest increases in the suburban Class A market.
• Overall demand as measured by net absorption was relatively flatfor 2008. However, over 2 million SF in completions, most of whichwas Class A space, drove vacancy rates to historically high levels.
• Asking rental rates decreased slightly during the year, but effectiverents decreased more as lease concessions became prevalent.
• Employment losses were concentrated in the “financial activities”as bank, mortgage, and real estate closures and contractions affectedClass A and B submarkets.
• Both user and investment sales activity dropped off significantly dueto less liquidity in the credit markets and an increased disconnectbetween buyer and seller pricing expectations.
Office Outlook• Vacancy is likely to increase slightly from between 50 and 100 basispoints, as new supply continues to be delivered by mid-year 2009.Thereafter, vacancy will level out or possibly decrease.Sublease vacancy is likely to increase, but still remain below 3%.
• Absorption will likely be positive but low as several largetenants take occupancy of new pre-leased first generation space.Struggling tenants’ closures may negate this growth.
• San Diego office cap rates will increase on investment sales, but stayrelatively low compared to most markets nationally and will increasea relatively small amount. Sales volume will probably be stagnantfor at least the first six months of 2009.
• While most of the recession’s job losses occurred in 2008, additionallosses will continue, but a slower rate. Fortunately, San Diego’sdiversified industries will insulate it from any major industry shock.
INDUSTRIAL
• Demand in manufacturing buildings was negative due to majordownsizing of several high-tech manufacturers. However, R&Dand corporate headquarter space demand was particularly strongin San Diego.
• Multi-tenant space started to see negative demand while distributionspace experienced decreased demand when home furnishing tenantsand other retail related tenants fell prey to the economic slowdown.
• Construction activity slowed significantly in 2008, allowing theindustrial market to be in near supply-demand balance. Industrialasking rents dropped in the second half of 2008 as demand startedto decrease.
Industrial Outlook• The retail sector will struggle, and this may create significantvacancies for industrial distribution space.
• Demand for R&D space should continue to be strong which willdrive vacancy down considering the new future supply pipelineis relatively small. In the last few years, this product sector hadsome of the highest vacancy rate levels.
• San Diego’s industries are well diversified, high-salary, andhigh-technology. Communications and defense manufacturing areexpanding even while the economy has seen an overall contraction.This continues to bode well for the industrial market as a whole.
• Rents may continue to decrease slightly in early 2009, while pickingup in the last half of 2009.
• A diminishing new supply pipeline and limited land for developmentof industry space continue to drive demand for existing industrialbuildings. Future opportunities may come in the form ofredevelopment and re-use of space.
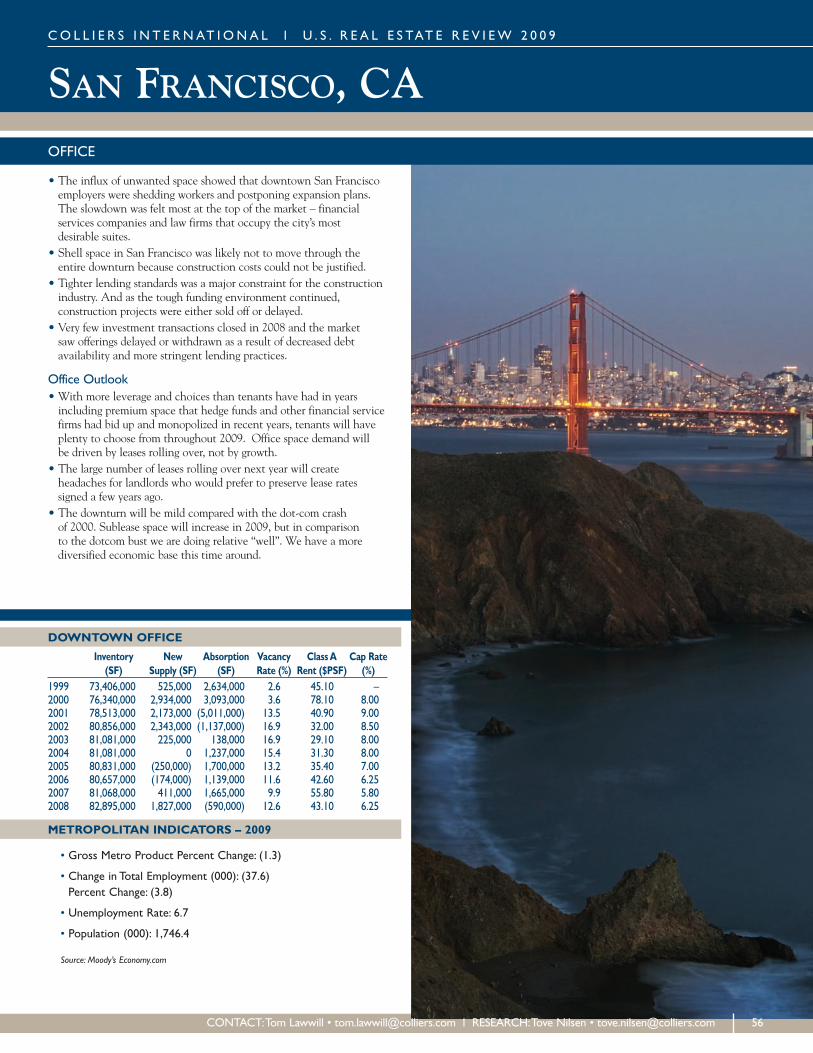
SAN FRANCISCO, CA
DOWNTOWN OFFICE
Inventory New Absorption Vacancy ClassA Cap Rate(SF) Supply (SF) (SF) Rate (%) Rent ($PSF) (%)
1999 73,406,000 525,000 2,634,000 2.6 45.10 –2000 76,340,000 2,934,000 3,093,000 3.6 78.10 8.002001 78,513,000 2,173,000 (5,011,000) 13.5 40.90 9.002002 80,856,000 2,343,000 (1,137,000) 16.9 32.00 8.502003 81,081,000 225,000 138,000 16.9 29.10 8.002004 81,081,000 0 1,237,000 15.4 31.30 8.002005 80,831,000 (250,000) 1,700,000 13.2 35.40 7.002006 80,657,000 (174,000) 1,139,000 11.6 42.60 6.252007 81,068,000 411,000 1,665,000 9.9 55.80 5.802008 82,895,000 1,827,000 (590,000) 12.6 43.10 6.25
METROPOLITAN INDICATORS – 2009
• Gross Metro Product Percent Change: (1.3)
• Change in Total Employment (000): (37.6)Percent Change: (3.8)
• Unemployment Rate: 6.7
• Population (000): 1,746.4
Source: Moody’s Economy.com
CO L L I E R S I N T E RNAT I ONA L l U . S . R E A L E S TAT E R E V I EW 2 0 0 9
CONTACT:Tom Lawwill • [email protected] l RESEARCH:Tove Nilsen • [email protected] 56
OFFICE
• The influx of unwanted space showed that downtown San Franciscoemployers were shedding workers and postponing expansion plans.The slowdown was felt most at the top of the market – financialservices companies and law firms that occupy the city’s mostdesirable suites.
• Shell space in San Francisco was likely not to move through theentire downturn because construction costs could not be justified.
• Tighter lending standards was a major constraint for the constructionindustry. And as the tough funding environment continued,construction projects were either sold off or delayed.
• Very few investment transactions closed in 2008 and the marketsaw offerings delayed or withdrawn as a result of decreased debtavailability and more stringent lending practices.
Office Outlook• With more leverage and choices than tenants have had in yearsincluding premium space that hedge funds and other financial servicefirms had bid up and monopolized in recent years, tenants will haveplenty to choose from throughout 2009. Office space demand willbe driven by leases rolling over, not by growth.
• The large number of leases rolling over next year will createheadaches for landlords who would prefer to preserve lease ratessigned a few years ago.
• The downturn will be mild compared with the dot-com crashof 2000. Sublease space will increase in 2009, but in comparisonto the dotcom bust we are doing relative “well”. We have a morediversified economic base this time around.
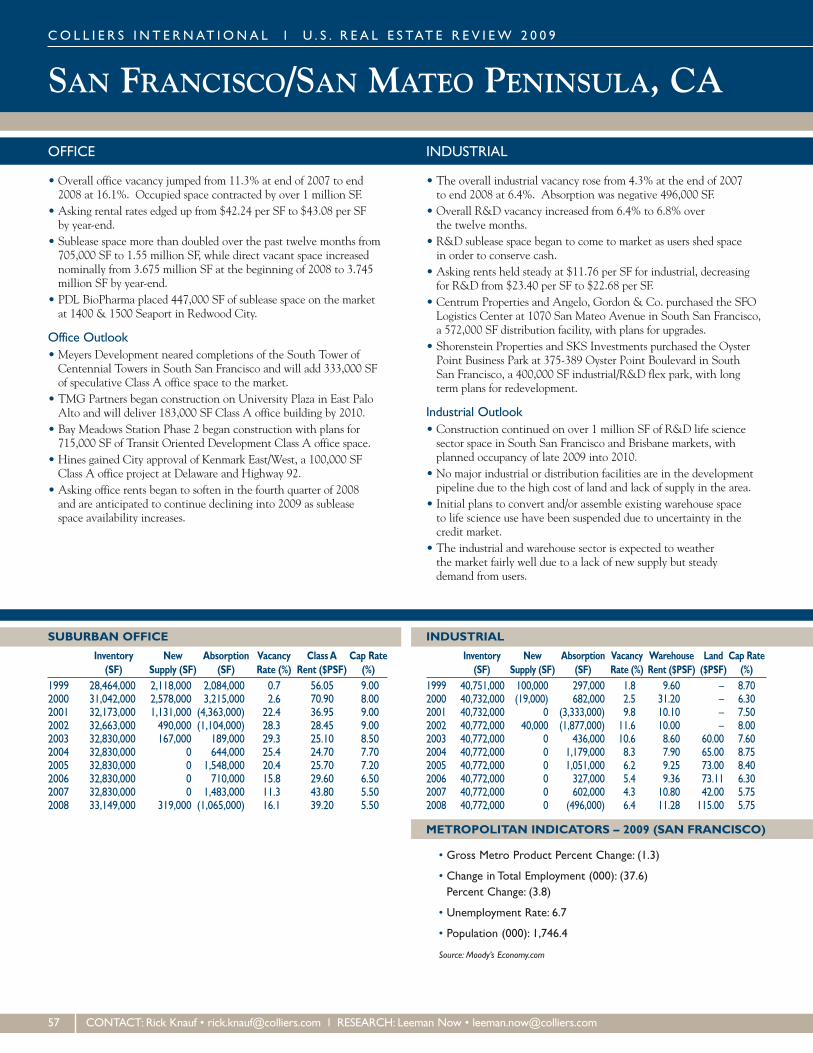
SAN FRANCISCO/SAN MATEO PENINSULA, CA
CO L L I E R S I N T E RNAT I ONA L l U . S . R E A L E S TAT E R E V I EW 2 0 0 9
SUBURBAN OFFICE
Inventory New Absorption Vacancy ClassA Cap Rate(SF) Supply (SF) (SF) Rate (%) Rent ($PSF) (%)
1999 28,464,000 2,118,000 2,084,000 0.7 56.05 9.002000 31,042,000 2,578,000 3,215,000 2.6 70.90 8.002001 32,173,000 1,131,000 (4,363,000) 22.4 36.95 9.002002 32,663,000 490,000 (1,104,000) 28.3 28.45 9.002003 32,830,000 167,000 189,000 29.3 25.10 8.502004 32,830,000 0 644,000 25.4 24.70 7.702005 32,830,000 0 1,548,000 20.4 25.70 7.202006 32,830,000 0 710,000 15.8 29.60 6.502007 32,830,000 0 1,483,000 11.3 43.80 5.502008 33,149,000 319,000 (1,065,000) 16.1 39.20 5.50
INDUSTRIAL
Inventory New Absorption Vacancy Warehouse Land Cap Rate(SF) Supply (SF) (SF) Rate (%) Rent ($PSF) ($PSF) (%)
1999 40,751,000 100,000 297,000 1.8 9.60 – 8.702000 40,732,000 (19,000) 682,000 2.5 31.20 – 6.302001 40,732,000 0 (3,333,000) 9.8 10.10 – 7.502002 40,772,000 40,000 (1,877,000) 11.6 10.00 – 8.002003 40,772,000 0 436,000 10.6 8.60 60.00 7.602004 40,772,000 0 1,179,000 8.3 7.90 65.00 8.752005 40,772,000 0 1,051,000 6.2 9.25 73.00 8.402006 40,772,000 0 327,000 5.4 9.36 73.11 6.302007 40,772,000 0 602,000 4.3 10.80 42.00 5.752008 40,772,000 0 (496,000) 6.4 11.28 115.00 5.75
METROPOLITAN INDICATORS – 2009 (SAN FRANCISCO)
• Gross Metro Product Percent Change: (1.3)
• Change in Total Employment (000): (37.6)Percent Change: (3.8)
• Unemployment Rate: 6.7
• Population (000): 1,746.4
Source: Moody’s Economy.com
57 CONTACT: Rick Knauf • [email protected] l RESEARCH: Leeman Now • [email protected]
OFFICE
• Overall office vacancy jumped from 11.3% at end of 2007 to end2008 at 16.1%. Occupied space contracted by over 1 million SF.
• Asking rental rates edged up from $42.24 per SF to $43.08 per SFby year-end.
• Sublease space more than doubled over the past twelve months from705,000 SF to 1.55 million SF, while direct vacant space increasednominally from 3.675 million SF at the beginning of 2008 to 3.745million SF by year-end.
• PDL BioPharma placed 447,000 SF of sublease space on the marketat 1400 & 1500 Seaport in Redwood City.
Office Outlook• Meyers Development neared completions of the South Tower ofCentennial Towers in South San Francisco and will add 333,000 SFof speculative Class A office space to the market.
• TMG Partners began construction on University Plaza in East PaloAlto and will deliver 183,000 SF Class A office building by 2010.
• Bay Meadows Station Phase 2 began construction with plans for715,000 SF of Transit Oriented Development Class A office space.
• Hines gained City approval of Kenmark East/West, a 100,000 SFClass A office project at Delaware and Highway 92.
• Asking office rents began to soften in the fourth quarter of 2008and are anticipated to continue declining into 2009 as subleasespace availability increases.
INDUSTRIAL
• The overall industrial vacancy rose from 4.3% at the end of 2007to end 2008 at 6.4%. Absorption was negative 496,000 SF.
• Overall R&D vacancy increased from 6.4% to 6.8% overthe twelve months.
• R&D sublease space began to come to market as users shed spacein order to conserve cash.
• Asking rents held steady at $11.76 per SF for industrial, decreasingfor R&D from $23.40 per SF to $22.68 per SF.
• Centrum Properties and Angelo, Gordon & Co. purchased the SFOLogistics Center at 1070 San Mateo Avenue in South San Francisco,a 572,000 SF distribution facility, with plans for upgrades.
• Shorenstein Properties and SKS Investments purchased the OysterPoint Business Park at 375-389 Oyster Point Boulevard in SouthSan Francisco, a 400,000 SF industrial/R&D flex park, with longterm plans for redevelopment.
Industrial Outlook• Construction continued on over 1 million SF of R&D life sciencesector space in South San Francisco and Brisbane markets, withplanned occupancy of late 2009 into 2010.
• No major industrial or distribution facilities are in the developmentpipeline due to the high cost of land and lack of supply in the area.
• Initial plans to convert and/or assemble existing warehouse spaceto life science use have been suspended due to uncertainty in thecredit market.
• The industrial and warehouse sector is expected to weatherthe market fairly well due to a lack of new supply but steadydemand from users.
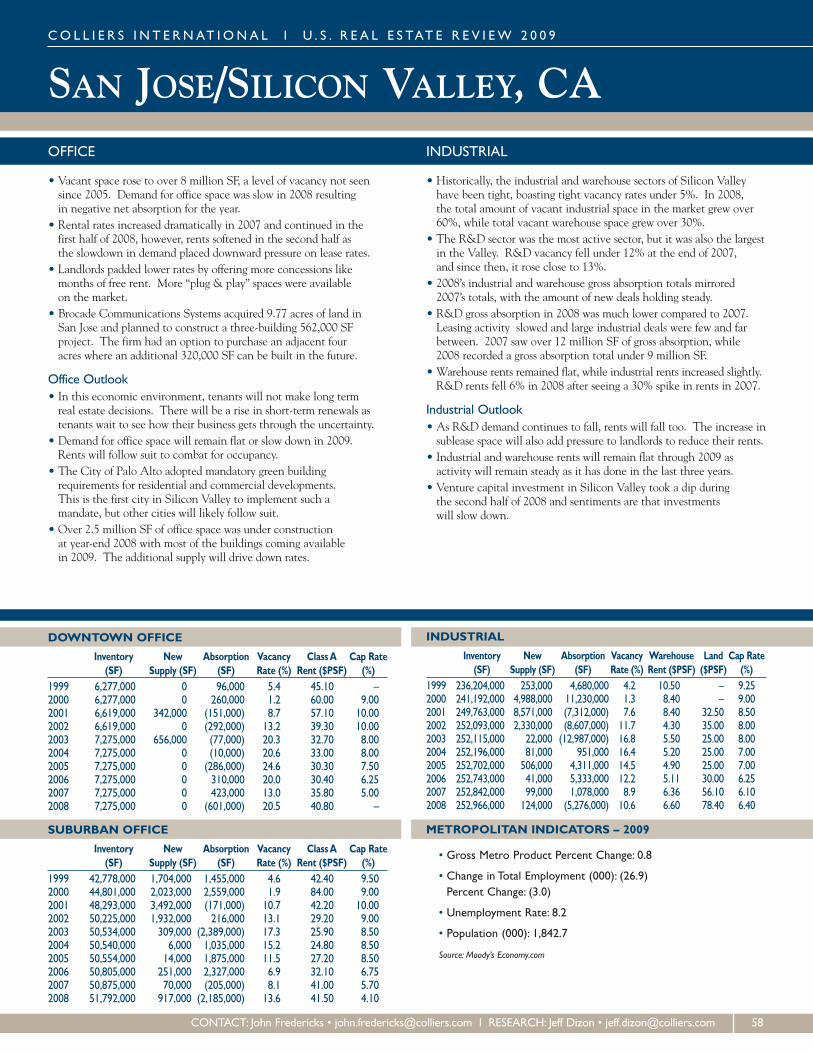
SAN JOSE/SILICON VALLEY, CA
DOWNTOWN OFFICE
Inventory New Absorption Vacancy ClassA Cap Rate(SF) Supply (SF) (SF) Rate (%) Rent ($PSF) (%)
1999 6,277,000 0 96,000 5.4 45.10 –2000 6,277,000 0 260,000 1.2 60.00 9.002001 6,619,000 342,000 (151,000) 8.7 57.10 10.002002 6,619,000 0 (292,000) 13.2 39.30 10.002003 7,275,000 656,000 (77,000) 20.3 32.70 8.002004 7,275,000 0 (10,000) 20.6 33.00 8.002005 7,275,000 0 (286,000) 24.6 30.30 7.502006 7,275,000 0 310,000 20.0 30.40 6.252007 7,275,000 0 423,000 13.0 35.80 5.002008 7,275,000 0 (601,000) 20.5 40.80 –
SUBURBAN OFFICE
Inventory New Absorption Vacancy ClassA Cap Rate(SF) Supply (SF) (SF) Rate (%) Rent ($PSF) (%)
1999 42,778,000 1,704,000 1,455,000 4.6 42.40 9.502000 44,801,000 2,023,000 2,559,000 1.9 84.00 9.002001 48,293,000 3,492,000 (171,000) 10.7 42.20 10.002002 50,225,000 1,932,000 216,000 13.1 29.20 9.002003 50,534,000 309,000 (2,389,000) 17.3 25.90 8.502004 50,540,000 6,000 1,035,000 15.2 24.80 8.502005 50,554,000 14,000 1,875,000 11.5 27.20 8.502006 50,805,000 251,000 2,327,000 6.9 32.10 6.752007 50,875,000 70,000 (205,000) 8.1 41.00 5.702008 51,792,000 917,000 (2,185,000) 13.6 41.50 4.10
INDUSTRIAL
Inventory New Absorption Vacancy Warehouse Land Cap Rate(SF) Supply (SF) (SF) Rate (%) Rent ($PSF) ($PSF) (%)
1999 236,204,000 253,000 4,680,000 4.2 10.50 – 9.252000 241,192,000 4,988,000 11,230,000 1.3 8.40 – 9.002001 249,763,000 8,571,000 (7,312,000) 7.6 8.40 32.50 8.502002 252,093,000 2,330,000 (8,607,000) 11.7 4.30 35.00 8.002003 252,115,000 22,000 (12,987,000) 16.8 5.50 25.00 8.002004 252,196,000 81,000 951,000 16.4 5.20 25.00 7.002005 252,702,000 506,000 4,311,000 14.5 4.90 25.00 7.002006 252,743,000 41,000 5,333,000 12.2 5.11 30.00 6.252007 252,842,000 99,000 1,078,000 8.9 6.36 56.10 6.102008 252,966,000 124,000 (5,276,000) 10.6 6.60 78.40 6.40
METROPOLITAN INDICATORS – 2009
• Gross Metro Product Percent Change: 0.8
• Change in Total Employment (000): (26.9)Percent Change: (3.0)
• Unemployment Rate: 8.2
• Population (000): 1,842.7
Source: Moody’s Economy.com
CO L L I E R S I N T E RNAT I ONA L l U . S . R E A L E S TAT E R E V I EW 2 0 0 9
CONTACT: John Fredericks • [email protected] l RESEARCH: Jeff Dizon • [email protected] 58
OFFICE
• Vacant space rose to over 8 million SF, a level of vacancy not seensince 2005. Demand for office space was slow in 2008 resultingin negative net absorption for the year.
• Rental rates increased dramatically in 2007 and continued in thefirst half of 2008, however, rents softened in the second half asthe slowdown in demand placed downward pressure on lease rates.
• Landlords padded lower rates by offering more concessions likemonths of free rent. More “plug & play” spaces were availableon the market.
• Brocade Communications Systems acquired 9.77 acres of land inSan Jose and planned to construct a three-building 562,000 SFproject. The firm had an option to purchase an adjacent fouracres where an additional 320,000 SF can be built in the future.
Office Outlook• In this economic environment, tenants will not make long termreal estate decisions. There will be a rise in short-term renewals astenants wait to see how their business gets through the uncertainty.
• Demand for office space will remain flat or slow down in 2009.Rents will follow suit to combat for occupancy.
• The City of Palo Alto adopted mandatory green buildingrequirements for residential and commercial developments.This is the first city in Silicon Valley to implement such amandate, but other cities will likely follow suit.
• Over 2.5 million SF of office space was under constructionat year-end 2008 with most of the buildings coming availablein 2009. The additional supply will drive down rates.
INDUSTRIAL
• Historically, the industrial and warehouse sectors of Silicon Valleyhave been tight, boasting tight vacancy rates under 5%. In 2008,the total amount of vacant industrial space in the market grew over60%, while total vacant warehouse space grew over 30%.
• The R&D sector was the most active sector, but it was also the largestin the Valley. R&D vacancy fell under 12% at the end of 2007,and since then, it rose close to 13%.
• 2008’s industrial and warehouse gross absorption totals mirrored2007’s totals, with the amount of new deals holding steady.
• R&D gross absorption in 2008 was much lower compared to 2007.Leasing activity slowed and large industrial deals were few and farbetween. 2007 saw over 12 million SF of gross absorption, while2008 recorded a gross absorption total under 9 million SF.
• Warehouse rents remained flat, while industrial rents increased slightly.R&D rents fell 6% in 2008 after seeing a 30% spike in rents in 2007.
Industrial Outlook• As R&D demand continues to fall, rents will fall too. The increase insublease space will also add pressure to landlords to reduce their rents.
• Industrial and warehouse rents will remain flat through 2009 asactivity will remain steady as it has done in the last three years.
• Venture capital investment in Silicon Valley took a dip duringthe second half of 2008 and sentiments are that investmentswill slow down.
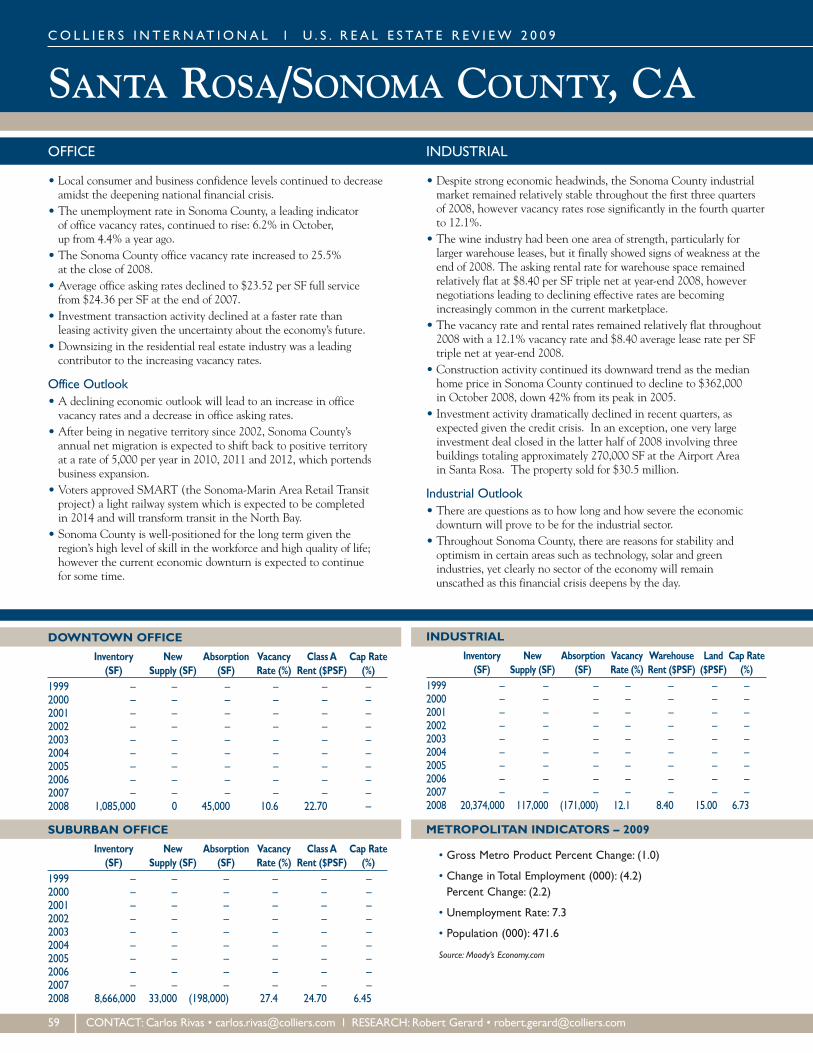
SANTA ROSA/SONOMA COUNTY, CACO L L I E R S I N T E RNAT I ONA L l U . S . R E A L E S TAT E R E V I EW 2 0 0 9
DOWNTOWN OFFICE
Inventory New Absorption Vacancy ClassA Cap Rate(SF) Supply (SF) (SF) Rate (%) Rent ($PSF) (%)
1999 – – – – – –2000 – – – – – –2001 – – – – – –2002 – – – – – –2003 – – – – – –2004 – – – – – –2005 – – – – – –2006 – – – – – –2007 – – – – – –2008 1,085,000 0 45,000 10.6 22.70 –
SUBURBAN OFFICE
Inventory New Absorption Vacancy ClassA Cap Rate(SF) Supply (SF) (SF) Rate (%) Rent ($PSF) (%)
1999 – – – – – –2000 – – – – – –2001 – – – – – –2002 – – – – – –2003 – – – – – –2004 – – – – – –2005 – – – – – –2006 – – – – – –2007 – – – – – –2008 8,666,000 33,000 (198,000) 27.4 24.70 6.45
INDUSTRIAL
Inventory New Absorption Vacancy Warehouse Land Cap Rate(SF) Supply (SF) (SF) Rate (%) Rent ($PSF) ($PSF) (%)
1999 – – – – – – –2000 – – – – – – –2001 – – – – – – –2002 – – – – – – –2003 – – – – – – –2004 – – – – – – –2005 – – – – – – –2006 – – – – – – –2007 – – – – – – –2008 20,374,000 117,000 (171,000) 12.1 8.40 15.00 6.73
METROPOLITAN INDICATORS – 2009
• Gross Metro Product Percent Change: (1.0)
• Change in Total Employment (000): (4.2)Percent Change: (2.2)
• Unemployment Rate: 7.3
• Population (000): 471.6
Source: Moody’s Economy.com
59 CONTACT: Carlos Rivas • [email protected] l RESEARCH: Robert Gerard • [email protected]
OFFICE
• Local consumer and business confidence levels continued to decreaseamidst the deepening national financial crisis.
• The unemployment rate in Sonoma County, a leading indicatorof office vacancy rates, continued to rise: 6.2% in October,up from 4.4% a year ago.
• The Sonoma County office vacancy rate increased to 25.5%at the close of 2008.
• Average office asking rates declined to $23.52 per SF full servicefrom $24.36 per SF at the end of 2007.
• Investment transaction activity declined at a faster rate thanleasing activity given the uncertainty about the economy’s future.
• Downsizing in the residential real estate industry was a leadingcontributor to the increasing vacancy rates.
Office Outlook• A declining economic outlook will lead to an increase in officevacancy rates and a decrease in office asking rates.
• After being in negative territory since 2002, Sonoma County’sannual net migration is expected to shift back to positive territoryat a rate of 5,000 per year in 2010, 2011 and 2012, which portendsbusiness expansion.
• Voters approved SMART (the Sonoma-Marin Area Retail Transitproject) a light railway system which is expected to be completedin 2014 and will transform transit in the North Bay.
• Sonoma County is well-positioned for the long term given theregion’s high level of skill in the workforce and high quality of life;however the current economic downturn is expected to continuefor some time.
INDUSTRIAL
• Despite strong economic headwinds, the Sonoma County industrialmarket remained relatively stable throughout the first three quartersof 2008, however vacancy rates rose significantly in the fourth quarterto 12.1%.
• The wine industry had been one area of strength, particularly forlarger warehouse leases, but it finally showed signs of weakness at theend of 2008. The asking rental rate for warehouse space remainedrelatively flat at $8.40 per SF triple net at year-end 2008, howevernegotiations leading to declining effective rates are becomingincreasingly common in the current marketplace.
• The vacancy rate and rental rates remained relatively flat throughout2008 with a 12.1% vacancy rate and $8.40 average lease rate per SFtriple net at year-end 2008.
• Construction activity continued its downward trend as the medianhome price in Sonoma County continued to decline to $362,000in October 2008, down 42% from its peak in 2005.
• Investment activity dramatically declined in recent quarters, asexpected given the credit crisis. In an exception, one very largeinvestment deal closed in the latter half of 2008 involving threebuildings totaling approximately 270,000 SF at the Airport Areain Santa Rosa. The property sold for $30.5 million.
Industrial Outlook• There are questions as to how long and how severe the economicdownturn will prove to be for the industrial sector.
• Throughout Sonoma County, there are reasons for stability andoptimism in certain areas such as technology, solar and greenindustries, yet clearly no sector of the economy will remainunscathed as this financial crisis deepens by the day.

SEATTLE/PUGET SOUND, WACO L L I E R S I N T E RNAT I ONA L l U . S . R E A L E S TAT E R E V I EW 2 0 0 9
DOWNTOWN OFFICE
Inventory New Absorption Vacancy ClassA Cap Rate(SF) Supply (SF) (SF) Rate (%) Rent ($PSF) (%)
1999 30,934,000 428,000 741,000 2.5 32.00 –2000 32,865,000 1,931,000 1,819,000 3.5 37.00 8.502001 34,852,000 1,987,000 (1,405,000) 12.6 35.00 8.252002 35,705,000 853,000 (45,000) 14.6 29.50 8.252003 36,550,000 845,000 311,000 15.3 26.30 8.002004 36,638,000 88,000 (167,000) 15.2 25.80 7.002005 36,638,000 0 763,000 12.8 25.20 6.502006 36,823,000 185,000 1,487,000 8.5 27.50 6.502007 37,215,000 392,000 471,000 8.4 32.30 5.802008 38,133,000 918,000 337,000 9.6 36.20 –
SUBURBAN OFFICE
Inventory New Absorption Vacancy ClassA Cap Rate(SF) Supply (SF) (SF) Rate (%) Rent ($PSF) (%)
1999 41,619,000 3,943,000 1,670,000 6.7 22.50 –2000 44,201,000 2,582,000 3,769,000 5.3 24.00 9.502001 47,739,000 3,538,000 (1,222,000) 15.6 25.00 9.502002 48,832,000 1,093,000 166,000 17.5 23.00 9.502003 49,042,000 210,000 (90,000) 17.6 22.90 8.752004 49,113,000 71,000 965,000 15.4 23.60 7.002005 49,509,000 396,000 2,031,000 12.0 21.80 6.502006 49,559,000 50,000 779,000 10.6 26.00 6.252007 51,869,000 2,310,000 1,300,000 11.0 31.00 5.262008 53,956,000 2,087,000 401,000 13.4 27.70 –
INDUSTRIAL
Inventory New Absorption Vacancy Warehouse Land Cap Rate(SF) Supply (SF) (SF) Rate (%) Rent ($PSF) ($PSF) (%)
1999 199,393,000 5,292,000 607,000 4.7 4.90 – –2000 200,109,000 716,000 643,000 5.2 4.60 – –2001 203,219,000 3,110,000 (4,646,000) 8.6 5.50 8.00 8.002002 204,368,000 1,149,000 (2,380,000) 10.4 5.50 9.70 8.002003 205,216,000 848,000 (1,057,000) 11.1 5.50 8.00 8.002004 208,340,000 3,124,000 6,496,000 9.3 5.50 6.00 7.852005 218,369,000 10,029,000 8,102,000 7.4 5.60 6.75 6.502006 222,588,000 4,219,000 5,595,000 6.5 6.36 7.50 6.502007 228,370,000 5,782,000 5,736,000 6.2 6.48 11.46 6.542008 229,726,000 1,356,000 2,864,000 5.9 6.57 15.49 –
METROPOLITAN INDICATORS – 2009
• Gross Metro Product Percent Change: 2.6
• Change in Total Employment (000): 1.2Percent Change: 0.1
• Unemployment Rate: 6.6
• Population (000): 2,611.1
Source: Moody’s Economy.com
60 CONTACT:ArvinVanderVeen • [email protected] l RESEARCH:Alana Ness • [email protected]
OFFICE
• During 2008, 918,000 SF of new construction was delivered to thedowntown with nearly half of the product pre-leased. 2001 wasthe last year to see such a high level of new construction with nearlytwo million SF delivered.
• ShareBuilder signed a 117,000 SF lease at the 83 King Buildingwith plans to occupy the space by March 2009.
• Pemco signed and occupied nearly 50,000 SF at Redstone CorporateCenter I in the Lynnwood submarket. Lynnwood continued to showsigns of positive growth with 135,000 SF absorbed at year-end 2008.
• Northend vacancy rates fell nearly 3.5 percent across the marketsince fourth quarter of 2007.
• The Eastside added 1.8 million SF to Puget Sound in 2008. Notableprojects included Tower 333 of 396,000 SF in the Bellevue CBDand Advanta Buildings A, B and C totaling 596,000 SF, occupiedby Microsoft in the I-90 submarket. T-Mobile leased 175,000 SFat Canyon Pointe in the Bothell submarket.
Office Outlook• Puget Sound’s vacancy rates are expected to post below nationalaverages during 2009 due in part to the large amount of technology-based companies with flagship locations in the Puget Sound.
• Expect landlords to offer more concessions before rates dropsignificantly as the market adjusts to a downshifting economy.
• Seventy-two percent of the 1.8 million square feet of expected2009 deliveries in the Eastside are pre-leased.
• 2009 may be a slow period for the office leasing and sales marketdue to the economy; however, it is an excellent opportunityfor investors to pick up prime property at a reduced price.
INDUSTRIAL
• Pierce County finished the year with 454,800 SF of absorption and10.2% vacancy. The new IKEA Distribution Center in Fredricksonwas the highlight with all 800,000 SF of its space occupied by theSwedish company.
• The Eastside ended the year with 258,000 SF of absorption, markedlyimproved from last year’s negative 34,300 SF. This market remainedstrong due to the lack of remaining sites and limited new construction.
• South Everett projects included the 218,000 SF Columbia Pacificbuilding and the Everett Commerce Center Building A of 100,000 SFof warehouse space.
• Despite posting 137,000 SF of negative absorption in the fourthquarter, the Kent Valley absorbed 191,000 SF in 2008. USPS leased200,000 SF of warehouse space at the Olympic Steamship Building.SeaTac posted the highest year-end vacancy rate at 13.2%.
• Seattle Iron & Metal signed a 141,000 SF lease at the Water Towerbuilding in the ‘South of Spokane Street’ submarket.
• Manufacturing buildings were still the tightest industrial productwith 1.92% vacancy in Seattle’s close-in market.
Industrial Outlook• With developers and investors facing tight lending opportunities,2009 may see many of the proposed projects placed on tentative hold.
• Manufacturing and distribution vacancy rates are expected to remainlow in the 3% range. The high-tech vacancy rate is due to rise fromthe 13.8% registered at year-end 2008.
• With a lack of financing for new construction and few remainingindustrially-zoned parcels of land, the Northend submarket shouldcontinue to show strength in a weak economy.
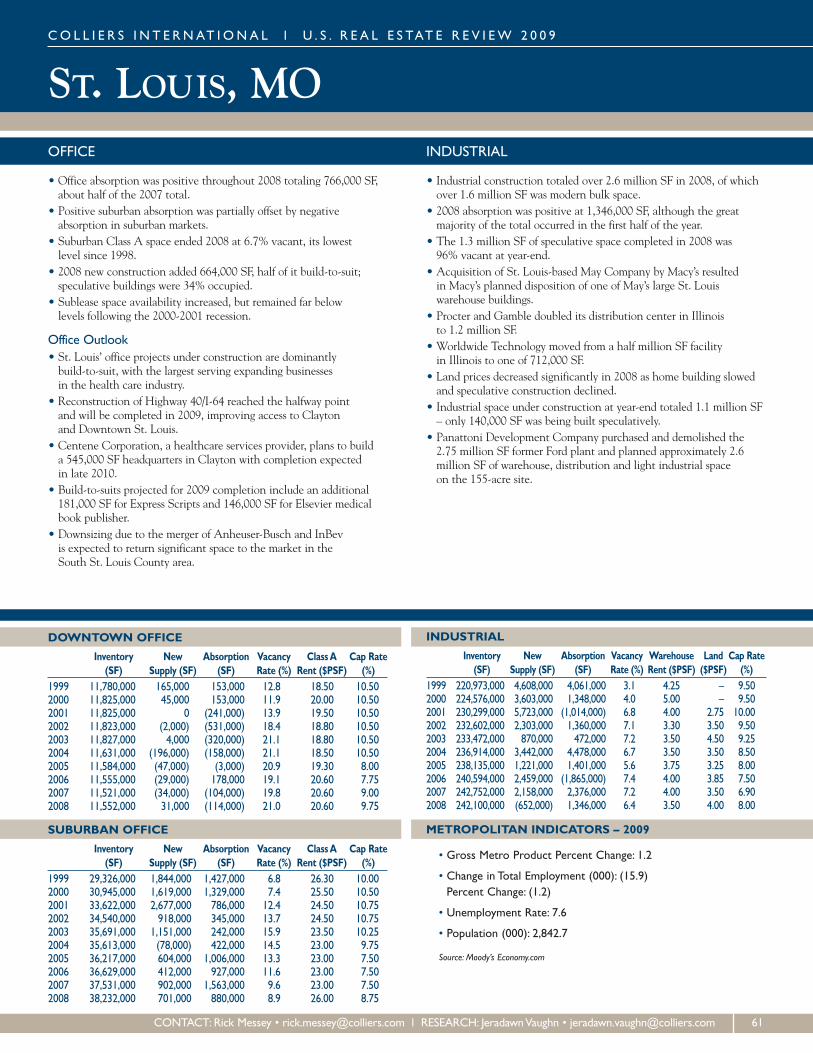
ST. LOUIS, MO
DOWNTOWN OFFICE
Inventory New Absorption Vacancy ClassA Cap Rate(SF) Supply (SF) (SF) Rate (%) Rent ($PSF) (%)
1999 11,780,000 165,000 153,000 12.8 18.50 10.502000 11,825,000 45,000 153,000 11.9 20.00 10.502001 11,825,000 0 (241,000) 13.9 19.50 10.502002 11,823,000 (2,000) (531,000) 18.4 18.80 10.502003 11,827,000 4,000 (320,000) 21.1 18.80 10.502004 11,631,000 (196,000) (158,000) 21.1 18.50 10.502005 11,584,000 (47,000) (3,000) 20.9 19.30 8.002006 11,555,000 (29,000) 178,000 19.1 20.60 7.752007 11,521,000 (34,000) (104,000) 19.8 20.60 9.002008 11,552,000 31,000 (114,000) 21.0 20.60 9.75
SUBURBAN OFFICE
Inventory New Absorption Vacancy ClassA Cap Rate(SF) Supply (SF) (SF) Rate (%) Rent ($PSF) (%)
1999 29,326,000 1,844,000 1,427,000 6.8 26.30 10.002000 30,945,000 1,619,000 1,329,000 7.4 25.50 10.502001 33,622,000 2,677,000 786,000 12.4 24.50 10.752002 34,540,000 918,000 345,000 13.7 24.50 10.752003 35,691,000 1,151,000 242,000 15.9 23.50 10.252004 35,613,000 (78,000) 422,000 14.5 23.00 9.752005 36,217,000 604,000 1,006,000 13.3 23.00 7.502006 36,629,000 412,000 927,000 11.6 23.00 7.502007 37,531,000 902,000 1,563,000 9.6 23.00 7.502008 38,232,000 701,000 880,000 8.9 26.00 8.75
INDUSTRIAL
Inventory New Absorption Vacancy Warehouse Land Cap Rate(SF) Supply (SF) (SF) Rate (%) Rent ($PSF) ($PSF) (%)
1999 220,973,000 4,608,000 4,061,000 3.1 4.25 – 9.502000 224,576,000 3,603,000 1,348,000 4.0 5.00 – 9.502001 230,299,000 5,723,000 (1,014,000) 6.8 4.00 2.75 10.002002 232,602,000 2,303,000 1,360,000 7.1 3.30 3.50 9.502003 233,472,000 870,000 472,000 7.2 3.50 4.50 9.252004 236,914,000 3,442,000 4,478,000 6.7 3.50 3.50 8.502005 238,135,000 1,221,000 1,401,000 5.6 3.75 3.25 8.002006 240,594,000 2,459,000 (1,865,000) 7.4 4.00 3.85 7.502007 242,752,000 2,158,000 2,376,000 7.2 4.00 3.50 6.902008 242,100,000 (652,000) 1,346,000 6.4 3.50 4.00 8.00
METROPOLITAN INDICATORS – 2009
• Gross Metro Product Percent Change: 1.2
• Change in Total Employment (000): (15.9)Percent Change: (1.2)
• Unemployment Rate: 7.6
• Population (000): 2,842.7
Source: Moody’s Economy.com
CO L L I E R S I N T E RNAT I ONA L l U . S . R E A L E S TAT E R E V I EW 2 0 0 9
CONTACT: Rick Messey • [email protected] l RESEARCH: JeradawnVaughn • [email protected] 61
OFFICE
• Office absorption was positive throughout 2008 totaling 766,000 SF,about half of the 2007 total.
• Positive suburban absorption was partially offset by negativeabsorption in suburban markets.
• Suburban Class A space ended 2008 at 6.7% vacant, its lowestlevel since 1998.
• 2008 new construction added 664,000 SF, half of it build-to-suit;speculative buildings were 34% occupied.
• Sublease space availability increased, but remained far belowlevels following the 2000-2001 recession.
Office Outlook• St. Louis’ office projects under construction are dominantlybuild-to-suit, with the largest serving expanding businessesin the health care industry.
• Reconstruction of Highway 40/I-64 reached the halfway pointand will be completed in 2009, improving access to Claytonand Downtown St. Louis.
• Centene Corporation, a healthcare services provider, plans to builda 545,000 SF headquarters in Clayton with completion expectedin late 2010.
• Build-to-suits projected for 2009 completion include an additional181,000 SF for Express Scripts and 146,000 SF for Elsevier medicalbook publisher.
• Downsizing due to the merger of Anheuser-Busch and InBevis expected to return significant space to the market in theSouth St. Louis County area.
INDUSTRIAL
• Industrial construction totaled over 2.6 million SF in 2008, of whichover 1.6 million SF was modern bulk space.
• 2008 absorption was positive at 1,346,000 SF, although the greatmajority of the total occurred in the first half of the year.
• The 1.3 million SF of speculative space completed in 2008 was96% vacant at year-end.
• Acquisition of St. Louis-based May Company by Macy’s resultedin Macy’s planned disposition of one of May’s large St. Louiswarehouse buildings.
• Procter and Gamble doubled its distribution center in Illinoisto 1.2 million SF.
• Worldwide Technology moved from a half million SF facilityin Illinois to one of 712,000 SF.
• Land prices decreased significantly in 2008 as home building slowedand speculative construction declined.
• Industrial space under construction at year-end totaled 1.1 million SF– only 140,000 SF was being built speculatively.
• Panattoni Development Company purchased and demolished the2.75 million SF former Ford plant and planned approximately 2.6million SF of warehouse, distribution and light industrial spaceon the 155-acre site.
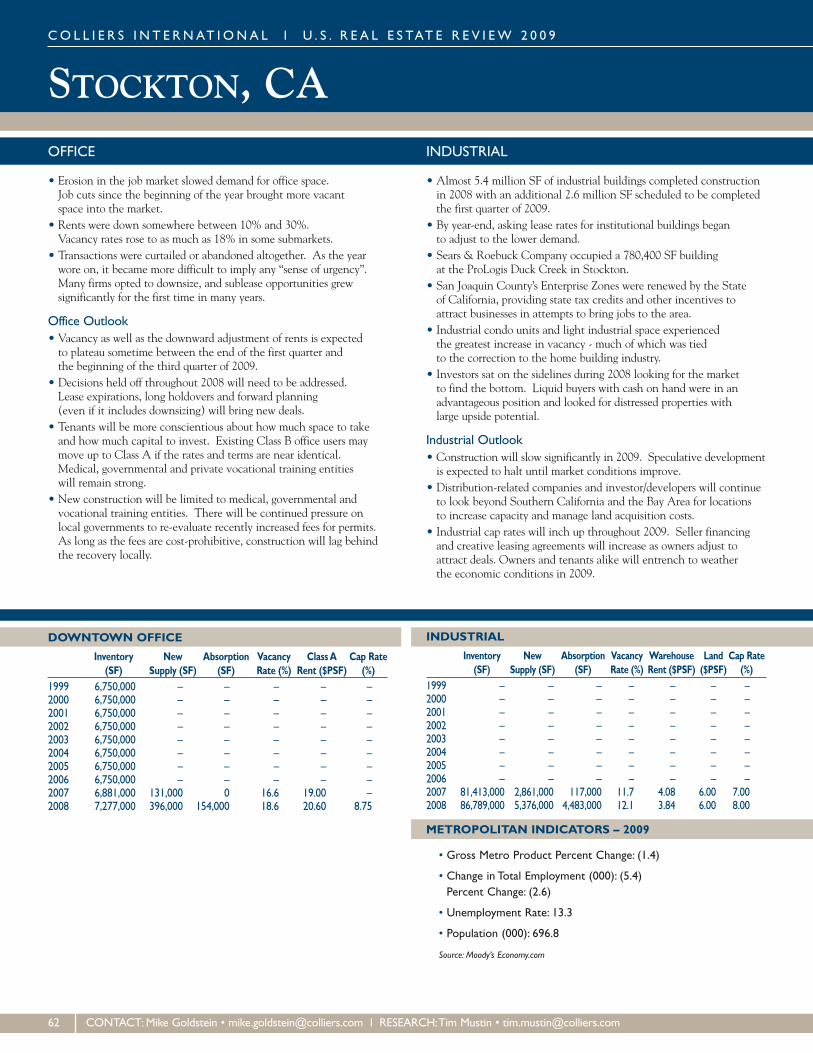
STOCKTON, CACO L L I E R S I N T E RNAT I ONA L l U . S . R E A L E S TAT E R E V I EW 2 0 0 9
DOWNTOWN OFFICE
Inventory New Absorption Vacancy ClassA Cap Rate(SF) Supply (SF) (SF) Rate (%) Rent ($PSF) (%)
1999 6,750,000 – – – – –2000 6,750,000 – – – – –2001 6,750,000 – – – – –2002 6,750,000 – – – – –2003 6,750,000 – – – – –2004 6,750,000 – – – – –2005 6,750,000 – – – – –2006 6,750,000 – – – – –2007 6,881,000 131,000 0 16.6 19.00 –2008 7,277,000 396,000 154,000 18.6 20.60 8.75
INDUSTRIAL
Inventory New Absorption Vacancy Warehouse Land Cap Rate(SF) Supply (SF) (SF) Rate (%) Rent ($PSF) ($PSF) (%)
1999 – – – – – – –2000 – – – – – – –2001 – – – – – – –2002 – – – – – – –2003 – – – – – – –2004 – – – – – – –2005 – – – – – – –2006 – – – – – – –2007 81,413,000 2,861,000 117,000 11.7 4.08 6.00 7.002008 86,789,000 5,376,000 4,483,000 12.1 3.84 6.00 8.00
METROPOLITAN INDICATORS – 2009
• Gross Metro Product Percent Change: (1.4)
• Change in Total Employment (000): (5.4)Percent Change: (2.6)
• Unemployment Rate: 13.3
• Population (000): 696.8
Source: Moody’s Economy.com
62 CONTACT:Mike Goldstein • [email protected] l RESEARCH:Tim Mustin • [email protected]
OFFICE
• Erosion in the job market slowed demand for office space.Job cuts since the beginning of the year brought more vacantspace into the market.
• Rents were down somewhere between 10% and 30%.Vacancy rates rose to as much as 18% in some submarkets.
• Transactions were curtailed or abandoned altogether. As the yearwore on, it became more difficult to imply any “sense of urgency”.Many firms opted to downsize, and sublease opportunities grewsignificantly for the first time in many years.
Office Outlook• Vacancy as well as the downward adjustment of rents is expectedto plateau sometime between the end of the first quarter andthe beginning of the third quarter of 2009.
• Decisions held off throughout 2008 will need to be addressed.Lease expirations, long holdovers and forward planning(even if it includes downsizing) will bring new deals.
• Tenants will be more conscientious about how much space to takeand how much capital to invest. Existing Class B office users maymove up to Class A if the rates and terms are near identical.Medical, governmental and private vocational training entitieswill remain strong.
• New construction will be limited to medical, governmental andvocational training entities. There will be continued pressure onlocal governments to re-evaluate recently increased fees for permits.As long as the fees are cost-prohibitive, construction will lag behindthe recovery locally.
INDUSTRIAL
• Almost 5.4 million SF of industrial buildings completed constructionin 2008 with an additional 2.6 million SF scheduled to be completedthe first quarter of 2009.
• By year-end, asking lease rates for institutional buildings beganto adjust to the lower demand.
• Sears & Roebuck Company occupied a 780,400 SF buildingat the ProLogis Duck Creek in Stockton.
• San Joaquin County’s Enterprise Zones were renewed by the Stateof California, providing state tax credits and other incentives toattract businesses in attempts to bring jobs to the area.
• Industrial condo units and light industrial space experiencedthe greatest increase in vacancy - much of which was tiedto the correction to the home building industry.
• Investors sat on the sidelines during 2008 looking for the marketto find the bottom. Liquid buyers with cash on hand were in anadvantageous position and looked for distressed properties withlarge upside potential.
Industrial Outlook• Construction will slow significantly in 2009. Speculative developmentis expected to halt until market conditions improve.
• Distribution-related companies and investor/developers will continueto look beyond Southern California and the Bay Area for locationsto increase capacity and manage land acquisition costs.
• Industrial cap rates will inch up throughout 2009. Seller financingand creative leasing agreements will increase as owners adjust toattract deals. Owners and tenants alike will entrench to weatherthe economic conditions in 2009.

CO L L I E R S I N T E RNAT I ONA L l U . S . R E A L E S TAT E R E V I EW 2 0 0 9
TAMPA BAY, FL
DOWNTOWN OFFICE
Inventory New Absorption Vacancy ClassA Cap Rate(SF) Supply (SF) (SF) Rate (%) Rent ($PSF) (%)
1999 8,430,000 0 93,900 10.8 20.30 –2000 8,430,000 0 (177,300) 12.9 20.70 9.252001 8,430,000 0 (113,000) 14.3 20.30 9.252002 8,430,000 0 (111,700) 15.6 20.20 9.002003 8,441,200 11,200 43,800 15.3 19.80 9.002004 8,441,200 0 33,500 14.9 20.40 8.502005 8,473,300 32,100 102,500 14.0 20.10 8.002006 8,473,300 0 (8,800) 14.1 21.40 8.002007 8,499,000 25,700 54,800 13.8 22.60 7.252008 8,499,000 0 (77,900) 14.7 22.50 8.00
SUBURBAN OFFICE
Inventory New Absorption Vacancy ClassA Cap Rate(SF) Supply (SF) (SF) Rate (%) Rent ($PSF) (%)
1999 57,572,900 2,557,000 816,900 7.3 20.50 –2000 59,907,700 2,334,800 331,400 10.4 21.40 9.252001 61,854,800 1,947,100 547,300 12.4 20.60 10.002002 62,511,900 657,100 967,600 11.7 20.00 10.502003 63,674,000 1,162,100 789,500 12.1 20.70 8.502004 65,329,200 1,655,200 1,534,500 12.0 20.80 8.502005 66,511,400 1,182,200 2,130,200 10.3 21.30 7.752006 67,582,000 1,070,600 1,988,800 8.8 24.00 7.852007 68,989,500 1,407,500 (3,900) 10.8 24.60 7.252008 70,379,000 1,389,500 (762,400) 13.7 24.70 7.75
INDUSTRIAL
Inventory New Absorption Vacancy Warehouse Land Cap Rate(SF) Supply (SF) (SF) Rate (%) Rent ($PSF) ($PSF) (%)
1999 175,703,000 968,200 – 4.0 4.50 – –2000 179,811,300 4,108,300 2,163,200 5.0 4.70 – –2001 184,261,100 4,449,800 1,864,400 6.3 4.50 2.00 –2002 185,953,800 1,692,700 1,647,900 6.3 4.20 2.50 9.382003 187,804,600 1,850,800 2,007,300 6.1 4.30 3.90 9.002004 188,769,400 964,800 1,110,700 6.0 4.30 5.00 8.502005 190,868,700 2,099,300 2,489,400 5.7 4.60 5.00 8.502006 194,067,200 3,198,500 5,077,200 4.7 5.50 5.50 8.002007 198,279,500 4,212,300 1,580,300 5.9 5.90 5.50 7.752008 201,359,000 3,079,500 (745,600) 7.8 5.50 4.75 8.13
METROPOLITAN INDICATORS – 2009
• Gross Metro Product Percent Change: (0.5)
• Change in Total Employment (000): (43.4)Percent Change: (3.4)
• Unemployment Rate: 8.1
• Population (000): 2,762.5
Source: Moody’s Economy.com
CONTACT: Russ Sampson • [email protected] l RESEARCH: KarenTemmen • [email protected] 63
OFFICE
• Class A office properties ended 2008 with a 15.7% vacancy rate,an increase over the 2007 year-end rate of 12.0%.
• Despite lackluster demand in 2008, nearly 1.4 million SF of newbuilding supply was completed. By year-end these new buildingshad a 55% vacancy rate.
• Thirty-two blocks of contiguous space of 50,000 SF and larger wereavailable at year-end, compared to 21 spaces at the end of 2007.
• Larger office leases included several universities leasing spacein multi-tenant office buildings located in the I-75 Corridor.Corinthian Colleges Inc. leased 114,600 SF, Nova SouthwesternUniversity leased 83,400 SF, and Remington College leased42,000 SF.
• Asking direct lease rates decreased throughout 2008 endingthe year at $21.02 per SF, compared to $21.32 at year-end 2007.
Office Outlook• Local unemployment rates will likely continue to increase throughmid-year 2009 due to the overall slowdown of the economy.
• Overall office lease rates will likely continue to decrease moderatelyuntil at least mid-year due to lackluster demand for office space.
• Year-end 2008 office space under construction totaled 430,700 SF.Only two properties were over 50,000 SF in size. This lower pipelinetotal may help moderate vacancy increases in 2009.
• Future tenants to lease multi-tenant office space may include privateuniversities and healthcare providers, as education and healthcareare the few industries that have continued to grow in the currenteconomic climate.
INDUSTRIAL
• Nearly every submarket was affected by the slowdown in demandbut the Polk County area had the strongest absorption in the region,measuring 1,771,500 SF annual absorption in 2008.
• Despite the lack of demand, new construction had a relatively hightotal of 3,080,000 SF. While lower than the 2007 new supply of 4.2million, the 2008 total was nearly the same as 2006. The new supplyhad a vacancy rate of 51%.
• Polk County new construction decreased dramatically to 726,000 SFin 2008, compared to nearly 2.1 million in 2007. This new supplyhad only a 9% vacancy rate by year-end. Meanwhile, the East SideTampa submarket recorded new supply of 1.7 million – 71% of whichwas vacant at year-end.
• The larger industrial lease transactions in 2008 all took place in PolkCounty. HH Gregg Co. leased 282,000 SF, Kuehne + Nagel leased140,900 SF, Pepsi Bottling Co. leased 109,200 SF, Land O’LakesPurina Feed leased 104,000 SF, PCA leased 100,000 SF, GTech Corp.leased 98,000, and Mattress Giant leased 83,900 SF.
• Asking lease rates decreased sharply in 2008. Warehouse rates ended2008 at $5.51 per SF, compared to $5.92 per SF at year-end 2007.Flex rates also fell from $9.98 per SF to $9.54 per SF over the year.
Industrial Outlook• Vacancy will likely continue to increase throughout much of 2009along with decreased net absorption and decreased asking lease rates.
• Current buildings under construction total 986,000 SF.• New construction starts are anticipated to be slower throughout2009 which may help to moderate vacancy.
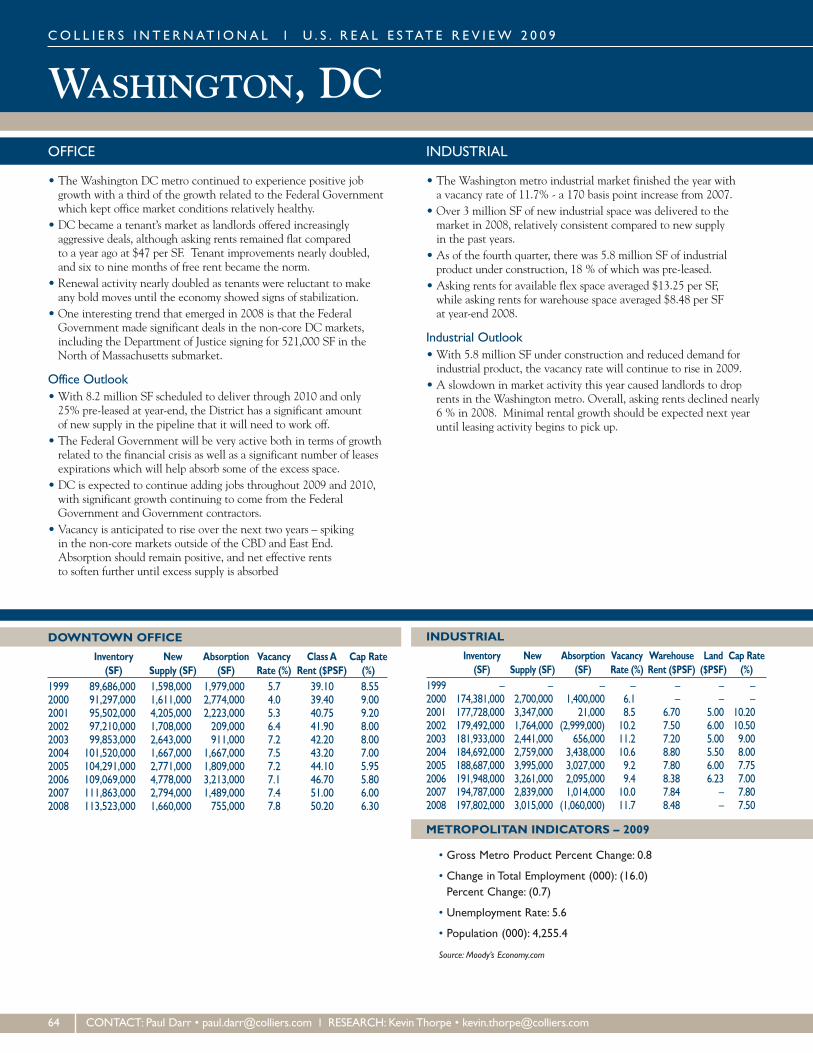
CO L L I E R S I N T E RNAT I ONA L l U . S . R E A L E S TAT E R E V I EW 2 0 0 9
WASHINGTON, DC
DOWNTOWN OFFICE
Inventory New Absorption Vacancy ClassA Cap Rate(SF) Supply (SF) (SF) Rate (%) Rent ($PSF) (%)
1999 89,686,000 1,598,000 1,979,000 5.7 39.10 8.552000 91,297,000 1,611,000 2,774,000 4.0 39.40 9.002001 95,502,000 4,205,000 2,223,000 5.3 40.75 9.202002 97,210,000 1,708,000 209,000 6.4 41.90 8.002003 99,853,000 2,643,000 911,000 7.2 42.20 8.002004 101,520,000 1,667,000 1,667,000 7.5 43.20 7.002005 104,291,000 2,771,000 1,809,000 7.2 44.10 5.952006 109,069,000 4,778,000 3,213,000 7.1 46.70 5.802007 111,863,000 2,794,000 1,489,000 7.4 51.00 6.002008 113,523,000 1,660,000 755,000 7.8 50.20 6.30
INDUSTRIAL
Inventory New Absorption Vacancy Warehouse Land Cap Rate(SF) Supply (SF) (SF) Rate (%) Rent ($PSF) ($PSF) (%)
1999 – – – – – – –2000 174,381,000 2,700,000 1,400,000 6.1 – – –2001 177,728,000 3,347,000 21,000 8.5 6.70 5.00 10.202002 179,492,000 1,764,000 (2,999,000) 10.2 7.50 6.00 10.502003 181,933,000 2,441,000 656,000 11.2 7.20 5.00 9.002004 184,692,000 2,759,000 3,438,000 10.6 8.80 5.50 8.002005 188,687,000 3,995,000 3,027,000 9.2 7.80 6.00 7.752006 191,948,000 3,261,000 2,095,000 9.4 8.38 6.23 7.002007 194,787,000 2,839,000 1,014,000 10.0 7.84 – 7.802008 197,802,000 3,015,000 (1,060,000) 11.7 8.48 – 7.50
METROPOLITAN INDICATORS – 2009
• Gross Metro Product Percent Change: 0.8
• Change in Total Employment (000): (16.0)Percent Change: (0.7)
• Unemployment Rate: 5.6
• Population (000): 4,255.4
Source: Moody’s Economy.com
64 CONTACT: Paul Darr • [email protected] l RESEARCH: KevinThorpe • [email protected]
OFFICE
• The Washington DC metro continued to experience positive jobgrowth with a third of the growth related to the Federal Governmentwhich kept office market conditions relatively healthy.
• DC became a tenant’s market as landlords offered increasinglyaggressive deals, although asking rents remained flat comparedto a year ago at $47 per SF. Tenant improvements nearly doubled,and six to nine months of free rent became the norm.
• Renewal activity nearly doubled as tenants were reluctant to makeany bold moves until the economy showed signs of stabilization.
• One interesting trend that emerged in 2008 is that the FederalGovernment made significant deals in the non-core DC markets,including the Department of Justice signing for 521,000 SF in theNorth of Massachusetts submarket.
Office Outlook• With 8.2 million SF scheduled to deliver through 2010 and only25% pre-leased at year-end, the District has a significant amountof new supply in the pipeline that it will need to work off.
• The Federal Government will be very active both in terms of growthrelated to the financial crisis as well as a significant number of leasesexpirations which will help absorb some of the excess space.
• DC is expected to continue adding jobs throughout 2009 and 2010,with significant growth continuing to come from the FederalGovernment and Government contractors.
• Vacancy is anticipated to rise over the next two years – spikingin the non-core markets outside of the CBD and East End.Absorption should remain positive, and net effective rentsto soften further until excess supply is absorbed
INDUSTRIAL
• The Washington metro industrial market finished the year witha vacancy rate of 11.7% - a 170 basis point increase from 2007.
• Over 3 million SF of new industrial space was delivered to themarket in 2008, relatively consistent compared to new supplyin the past years.
• As of the fourth quarter, there was 5.8 million SF of industrialproduct under construction, 18 % of which was pre-leased.
• Asking rents for available flex space averaged $13.25 per SF,while asking rents for warehouse space averaged $8.48 per SFat year-end 2008.
Industrial Outlook• With 5.8 million SF under construction and reduced demand forindustrial product, the vacancy rate will continue to rise in 2009.
• A slowdown in market activity this year caused landlords to droprents in the Washington metro. Overall, asking rents declined nearly6 % in 2008. Minimal rental growth should be expected next yearuntil leasing activity begins to pick up.

CO L L I E R S I N T E RNAT I ONA L l U . S . R E A L E S TAT E R E V I EW 2 0 0 9
WASHINGTON, DC
NORTHERNVA OFFICE
Inventory New Absorption Vacancy ClassA Cap Rate(SF) Supply (SF) (SF) Rate (%) Rent ($PSF) (%)
1999 108,414,000 10,036,000 8,642,000 4.9 30.50 10.052000 116,692,000 8,278,000 10,212,000 3.1 35.00 10.202001 125,514,000 8,822,000 (5,479,000) 14.2 34.00 10.802002 131,549,000 6,035,000 (34,000) 18.2 28.00 9.752003 133,486,000 1,937,000 3,068,000 16.3 26.75 8.752004 136,467,000 2,981,000 6,057,000 12.8 28.85 8.502005 138,639,000 2,172,000 3,920,000 10.6 30.30 7.502006 142,170,000 3,531,000 2,973,000 10.3 32.50 6.252007 145,258,000 3,088,000 1,971,000 11.3 30.60 5.702008 150,218,000 4,960,000 1,239,000 12.9 30.40 –
SUBURBAN MD OFFICE
Inventory New Absorption Vacancy ClassA Cap Rate(SF) Supply (SF) (SF) Rate (%) Rent ($PSF) (%)
1999 60,556,000 1,432,000 2,099,000 8.3 – 9.152000 62,667,000 2,111,000 3,008,000 6.0 32.00 9.252001 65,397,000 2,730,000 (242,000) 11.7 31.00 10.502002 67,802,000 2,405,000 313,000 15.7 28.50 9.002003 69,097,000 1,295,000 (27,000) 17.3 26.50 8.752004 70,448,000 1,351,000 2,743,000 13.6 26.10 7.502005 70,721,000 273,000 1,020,000 9.7 26.30 7.252006 71,330,000 609,000 339,000 9.9 27.20 6.502007 72,576,000 1,246,000 732,000 10.9 28.80 7.002008 73,498,000 922,000 (990,000) 11.0 30.50 6.60
METROPOLITAN INDICATORS – 2009
• Gross Metro Product Percent Change: 0.8
• Total Employment Increase/Decrease: (16.0)Percent Change: (0.7)
• Unemployment Rate: 5.6
• Population (000): 4,255.4
Source: Moody’s Economy.com
CONTACT: Paul Darr • [email protected] l RESEARCH: KevinThorpe • [email protected] 65
OFFICE
Washington, DC – NorthernVirginia• Northern Virginia experienced a tepid year. Absorption registeredjust over 1.2 million SF - less than half of the ten-year annual average,and vacancy rose by 200 basis points to 12.9% over twelve months.
• In addition to the vast presence of the Federal Government andrelated industries which drove the market, large corporations suchas Time Warner, Volkswagen and IBM continued to exhibit supportto the region by taking large long-term leases in new office product.
• The development pipeline slowed dramatically from the frenzy ofspeculative building that accounted for more than 12 million SFof new space added to the market since 2006.
• Office sales fell dramatically from $7.25 billion last yearto $775 million this year.
Washington, DC – NorthernVirginia Office Outlook• The construction pipeline slowing down over the next two years willrelieve the upward pressure on vacancy caused as a result of the newoffice supply since 2006. Over the next two years, only 1.8 millionSF of new product is scheduled to be delivered.
• The Federal Government will be very active over the next two yearsand the allocation of funds for the Department of Defense will affectthe future of the office market.
• Job growth will remain positive into 2010 due to growth ingovernment which will absorb some of the new vacant space.
• Outside the Beltway, vacancy will continue to rise in the near termand asking rents will fall as supply is high and demand is waning.Inside the Beltway vacancy should stay relatively flat but rents areexpected to drop slightly as landlords offer less in concessions.
Washington, DC – Suburban Maryland• Year-over-year vacancy inched up from 10.9% at year-end 2007 to11.0% at year-end 2008. For the past ten years, vacancy hoveredaround 10% so this marked an increased amount of empty officespace well up from historic averages.
• Similar to 2007, the rise in vacancy was attributed to the deliveryof available space to the market and numerous private sector tenantsdownsizing throughout the market.
• In 2008, 922,000 SF of new office space was added in suburbanMaryland, below the ten-year average of 1.2 million SF per annum.
• National Harbor, a $2.1 billion mixed-use waterfront destination,began delivering buildings in the Spring of 2008. The project willtotal over 7 million SF on 300-acres along the Potomac River.
Washington, DC – Suburban Maryland Office Outlook• Government activity was minimal in 2008, however, the newadministration is likely to fuel additional spending for life sciencesin the future which should function as a demand driver for space inthe health/medical sector.
• 1.8 million SF of office space is under construction and scheduledto deliver in 2009, 25 % pre-leased at year-end. The additional spacepaired with a reduction in demand will cause vacancy to remainon the rise throughout the year.
• Renewals and short-term leases will continue to be a popular optionin 2009. Recessionary conditions have caused numerous tenants todownsize and to enter into a “wait and see mode” in hopes that rentalrates will decline further. A rise in the amount of sublet space onthe market is anticipated for 2009.

WEST PALM BEACH, FLCO L L I E R S I N T E RNAT I ONA L l U . S . R E A L E S TAT E R E V I EW 2 0 0 9
DOWNTOWN OFFICE
Inventory New Absorption Vacancy ClassA Cap Rate(SF) Supply (SF) (SF) Rate (%) Rent ($PSF) (%)
1999 7,660,000 – – – – –2000 7,725,000 65,000 (176,000) 10.4 29.90 –2001 8,233,000 508,000 415,000 14.6 28.40 –2002 8,233,000 0 (26,000) 13.3 30.30 –2003 8,273,000 40,000 (37,000) 13.8 30.00 –2004 8,291,000 18,000 311,000 10.8 27.80 –2005 8,325,000 34,000 281,000 8.7 30.20 –2006 8,345,000 20,000 638,000 8.9 35.10 4.802007 8,393,000 48,000 (242,000) 9.6 34.20 6.102008 8,789,000 396,000 (199,000) 19.2 40.20 –
SUBURBAN OFFICE
Inventory New Absorption Vacancy ClassA Cap Rate(SF) Supply (SF) (SF) Rate (%) Rent ($PSF) (%)
1999 20,790,000 – – – – –2000 21,625,000 835,000 831,000 8.7 27.20 –2001 22,238,000 613,000 (226,000) 14.0 28.60 –2002 22,378,000 140,000 (286,000) 13.0 27.60 –2003 22,817,000 439,000 421,000 12.7 27.60 –2004 23,070,000 253,000 932,000 10.5 25.80 –2005 23,296,000 226,000 377,000 7.6 24.80 –2006 23,858,000 562,000 641,000 9.1 28.00 6.202007 24,488,000 630,000 (786,000) 14.8 30.80 6.302008 25,868,000 1,380,000 436,000 18.3 32.90 7.70
INDUSTRIAL
Inventory New Absorption Vacancy Warehouse Land Cap Rate(SF) Supply (SF) (SF) Rate (%) Rent ($PSF) ($PSF) (%)
1999 – – – – – – –2000 46,493,000 773,000 (45,000) 6.1 6.50 – –2001 47,213,000 720,000 229,000 6.1 6.80 – –2002 47,572,000 359,000 154,000 6.3 6.40 11.00 –2003 48,586,000 1,014,000 (103,000) 8.6 6.70 10.00 –2004 49,309,000 723,000 643,000 6.4 6.70 8.00 –2005 50,055,000 746,000 1,868,000 3.4 7.00 11.00 –2006 50,613,000 558,000 (116,000) 4.4 8.44 20.00 5.502007 50,941,000 328,000 (897,000) 6.6 9.25 12.88 6.302008 52,126,000 1,185,000 (154,000) 9.0 8.86 13.00 6.60
METROPOLITAN INDICATORS – 2009
• Gross Metro Product Percent Change: 0.0
• Change in Total Employment (000): (14.8)Percent Change: (2.6)
• Unemployment Rate: 8.4
• Population (000): 1,292.5
Source: Moody’s Economy.com
66 CONTACT: SteveWasserman • [email protected] l RESEARCH:Alex Morcate • [email protected]
OFFICE
• The Palm Beach market had a potential long-term growth driver inthe biotech industry which was spurred by tax incentives and grants.The Scripps Research Institute planned the move into an expanded350,000 SF facility in the Jupiter submarket for early 2009. The MaxPlanck Institute, the world’s largest non-university R&D institution,committed to build a facility adjacent to the Scripps facility.
• At year-end 2008, the Palm Beach County office market exhibitedabsorption of 237,000 SF and a vacancy rate of 18.6%.
• There was over 1.7 million SF of new supply delivered to the PalmBeach County office market, mostly in the West Palm Beach andBoca Raton submarkets. This was significantly higher than thenew supply added to the market in 2007, around 700,000 SF.
• The largest delivery in 2008 was the 296,000 SF CityPlace Towerin the CBD. The building was 65% pre-leased at year-end 2008.
Office Outlook• Demand for office space will continue to sputter in the coming yearas some of the larger submarkets like the West Palm Beach CBD,Palm Beach Gardens and Boca Raton rely heavily on the financialservices industry to provide a solid tenant base.
• Office construction in Palm Beach County will be limited giventhe large amount of available supply currently on the market.
• The prevalence of rent concessions should continue to rise into2009 due to the abundance of available space on the market.As a result, there will be downward pressure on rental rates.
• Sublet space availability in the Palm Beach office marketshould increase as office tenants look to downsize andconsolidate their space.
INDUSTRIAL
• Absorption in 2008 was negative for the third consecutive year.This resulted from an influx of close to 1.2 million SF of newindustrial space in 2008, as well as waning demand, particularlyin the fourth quarter.
• Construction activity in the Palm Beach industrial market groundedto a halt with virtually no projects under construction at year-end.
• The largest sales transaction of the year involved the sale of the347,500 SF Florida Atlantic University Research Park to HDGMansur Capital Group LLC for $100 million, or about $288 per SF.The research park, located in Boca Raton, was home to close to thirtytenants specializing in the biotech industry.
• Asking rents for industrial space declined throughout 2008 andaveraged $8.83 per SF triple net. However, Palm Beach still hadthe highest industrial rates of the three South Florida counties(Miami-Dade, Broward and Palm Beach).
Industrial Outlook• The Palm Beach industrial market stands to benefit from theemerging biotech industry. The establishment of the Scripps andMax Planck Research Institutes will create high-paying jobs andmay increase demand for R&D space in the area from otherbiotech companies.
• With a lack of new construction in the pipeline, vacancy shouldcome down once demand begins to pick up again. Sales activitywas down significantly in 2008 and should continue its sluggishpace into 2009 due to the state of the capital markets.
• Job losses may increase into 2009 under the weight of a correctinghousing market and tightening capital markets, and demand forindustrial space will continue to be negatively impacted.

U.S. NATIONAL MARKETS APPENDICES
www.colliers.com
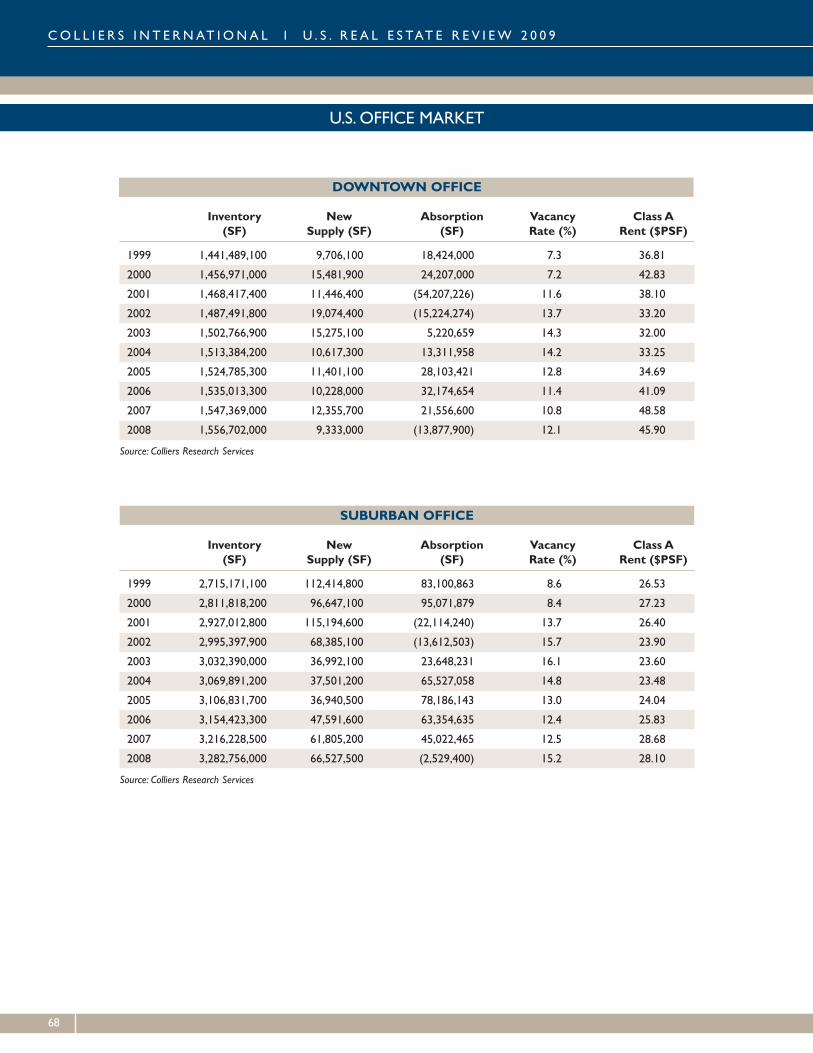
DOWNTOWN OFFICE
Inventory New Absorption Vacancy Class A(SF) Supply (SF) (SF) Rate (%) Rent ($PSF)
1999 1,441,489,100 9,706,100 18,424,000 7.3 36.81
2000 1,456,971,000 15,481,900 24,207,000 7.2 42.83
2001 1,468,417,400 11,446,400 (54,207,226) 11.6 38.10
2002 1,487,491,800 19,074,400 (15,224,274) 13.7 33.20
2003 1,502,766,900 15,275,100 5,220,659 14.3 32.00
2004 1,513,384,200 10,617,300 13,311,958 14.2 33.25
2005 1,524,785,300 11,401,100 28,103,421 12.8 34.69
2006 1,535,013,300 10,228,000 32,174,654 11.4 41.09
2007 1,547,369,000 12,355,700 21,556,600 10.8 48.58
2008 1,556,702,000 9,333,000 (13,877,900) 12.1 45.90
Source: Colliers Research Services
SUBURBAN OFFICE
Inventory New Absorption Vacancy Class A(SF) Supply (SF) (SF) Rate (%) Rent ($PSF)
1999 2,715,171,100 112,414,800 83,100,863 8.6 26.53
2000 2,811,818,200 96,647,100 95,071,879 8.4 27.23
2001 2,927,012,800 115,194,600 (22,114,240) 13.7 26.40
2002 2,995,397,900 68,385,100 (13,612,503) 15.7 23.90
2003 3,032,390,000 36,992,100 23,648,231 16.1 23.60
2004 3,069,891,200 37,501,200 65,527,058 14.8 23.48
2005 3,106,831,700 36,940,500 78,186,143 13.0 24.04
2006 3,154,423,300 47,591,600 63,354,635 12.4 25.83
2007 3,216,228,500 61,805,200 45,022,465 12.5 28.68
2008 3,282,756,000 66,527,500 (2,529,400) 15.2 28.10
Source: Colliers Research Services
CO L L I E R S I N T E RNAT I ONA L l U . S . R E A L E S TAT E R E V I EW 2 0 0 9
U.S. OFFICE MARKET
68
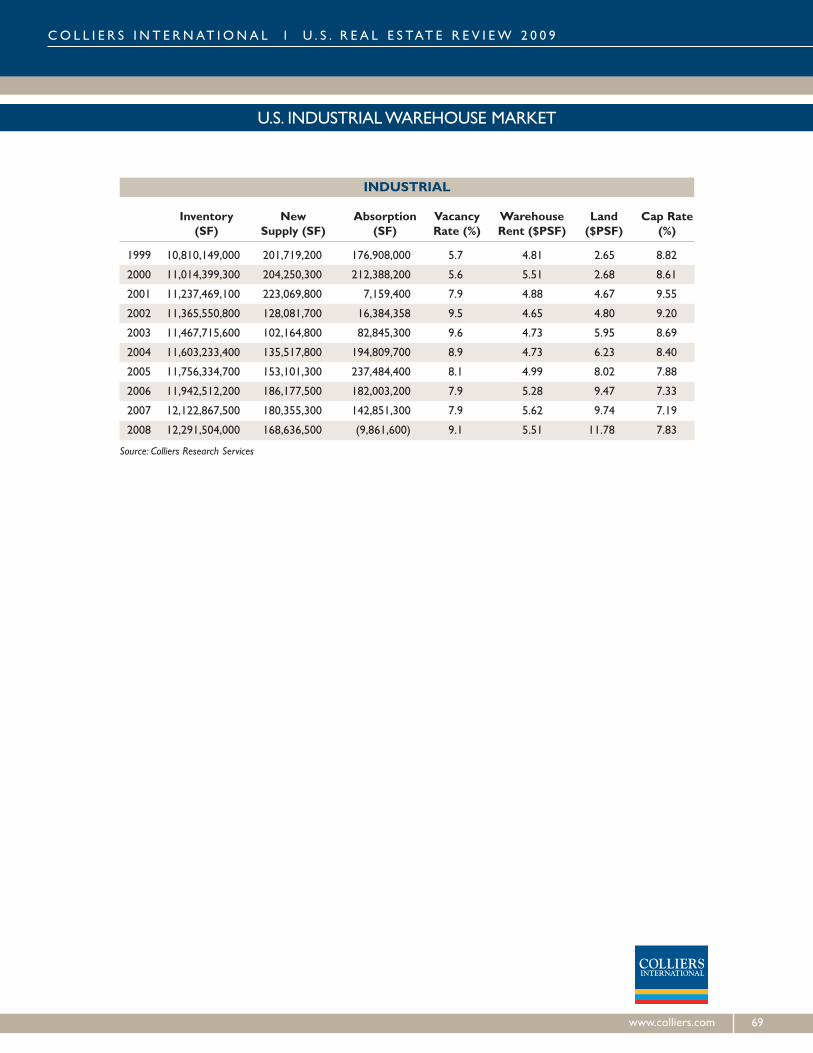
www.colliers.com 69
INDUSTRIAL
Inventory New Absorption Vacancy Warehouse Land Cap Rate(SF) Supply (SF) (SF) Rate (%) Rent ($PSF) ($PSF) (%)
1999 10,810,149,000 201,719,200 176,908,000 5.7 4.81 2.65 8.82
2000 11,014,399,300 204,250,300 212,388,200 5.6 5.51 2.68 8.61
2001 11,237,469,100 223,069,800 7,159,400 7.9 4.88 4.67 9.55
2002 11,365,550,800 128,081,700 16,384,358 9.5 4.65 4.80 9.20
2003 11,467,715,600 102,164,800 82,845,300 9.6 4.73 5.95 8.69
2004 11,603,233,400 135,517,800 194,809,700 8.9 4.73 6.23 8.40
2005 11,756,334,700 153,101,300 237,484,400 8.1 4.99 8.02 7.88
2006 11,942,512,200 186,177,500 182,003,200 7.9 5.28 9.47 7.33
2007 12,122,867,500 180,355,300 142,851,300 7.9 5.62 9.74 7.19
2008 12,291,504,000 168,636,500 (9,861,600) 9.1 5.51 11.78 7.83
Source: Colliers Research Services
CO L L I E R S I N T E RNAT I ONA L l U . S . R E A L E S TAT E R E V I EW 2 0 0 9
U.S. INDUSTRIALWAREHOUSE MARKET

70
CO L L I E R S I N T E RNAT I ONA L l U . S . R E A L E S TAT E R E V I EW 2 0 0 9
U.S. RETAIL CENTERS
Year-to-Date Sales Ending December 2005 2006 2007 2008 % Change (07/08)
All Stores 4,115,815 4,330,457 4,482,668 4,478,360 -0.1%
MotorVehicle and Parts Dealers 895,250 901,112 919,252 809,736 -11.9%
Gasoline Stations 388,261 404,485 445,212 489,252 9.9%
Food and Beverage Stores 519,292 541,688 560,649 589,512 5.1%
Grocery Stores 463,905 482,805 501,077 527,395 5.3%
Health and Personal Care Stores 208,376 224,169 237,437 247,022 4.0%
Building Material and Garden Equipment Stores 326,993 358,569 337,173 325,181 -3.6%
General Merchandise Stores 525,726 552,191 576,426 595,536 3.3%
Department Stores (excluding leased departments) 214,658 212,181 209,892 200,437 -4.5%
Clothing and Accessories Stores 201,682 214,732 224,651 220,795 -1.7%
Furniture, Home Furnishings, Electronics and Appliance Stores 211,733 230,168 230,016 220,692 -4.1%
Furniture and Home Furnishing Stores 111,293 121,190 118,657 109,180 -8.0%
Electronics and Appliance Stores 100,440 108,978 111,359 111,512 0.1%
Sporting Goods, Hobby, Book and Music Stores 81,853 87,200 87,324 88,327 1.1%
Miscellaneous Store Retailers 111,001 119,493 118,848 119,120 0.2%
Nonstore Retailers 249,011 270,498 303,423 314,384 3.6%
Food Services and Drinking Places 396,637 426,152 442,257 458,803 3.7%
Source: U.S. Census Bureau. All values are expressed in millions of U.S. dollars and are not seasonally adjusted.
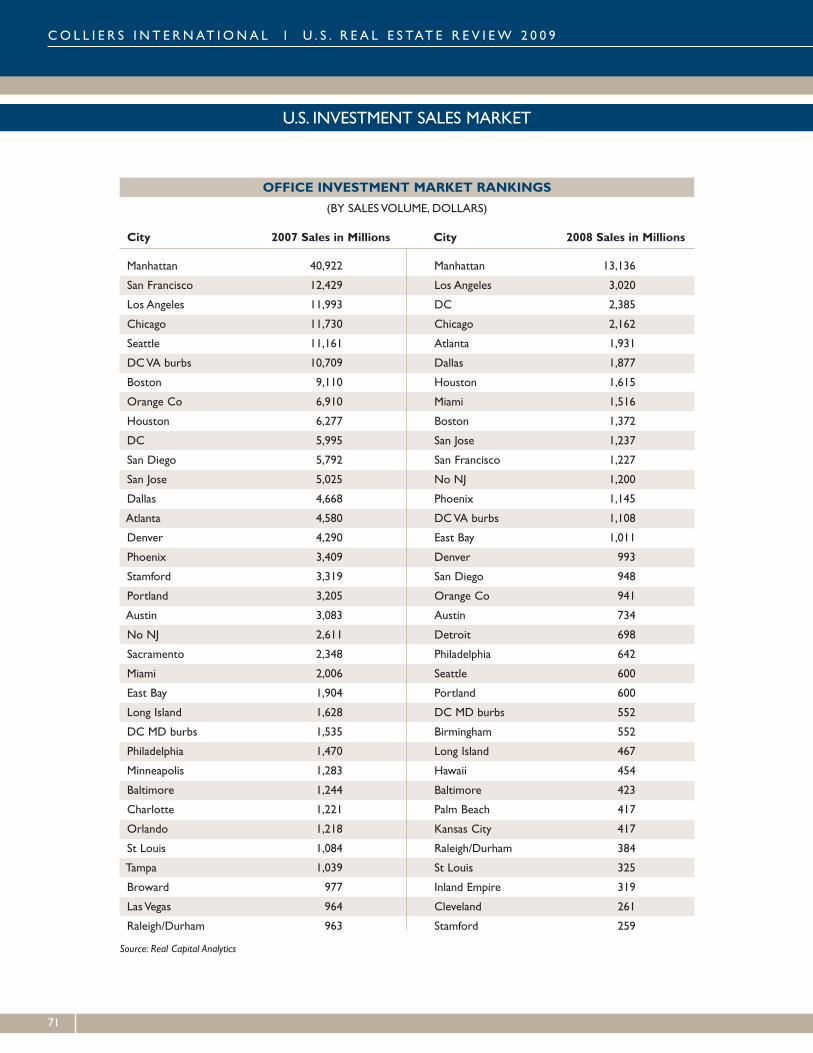
OFFICE INVESTMENT MARKET RANKINGS
(BY SALESVOLUME, DOLLARS)
City 2007 Sales in Millions City 2008 Sales in Millions
Manhattan 40,922 Manhattan 13,136
San Francisco 12,429 Los Angeles 3,020
Los Angeles 11,993 DC 2,385
Chicago 11,730 Chicago 2,162
Seattle 11,161 Atlanta 1,931
DCVA burbs 10,709 Dallas 1,877
Boston 9,110 Houston 1,615
Orange Co 6,910 Miami 1,516
Houston 6,277 Boston 1,372
DC 5,995 San Jose 1,237
San Diego 5,792 San Francisco 1,227
San Jose 5,025 No NJ 1,200
Dallas 4,668 Phoenix 1,145
Atlanta 4,580 DCVA burbs 1,108
Denver 4,290 East Bay 1,011
Phoenix 3,409 Denver 993
Stamford 3,319 San Diego 948
Portland 3,205 Orange Co 941
Austin 3,083 Austin 734
No NJ 2,611 Detroit 698
Sacramento 2,348 Philadelphia 642
Miami 2,006 Seattle 600
East Bay 1,904 Portland 600
Long Island 1,628 DC MD burbs 552
DC MD burbs 1,535 Birmingham 552
Philadelphia 1,470 Long Island 467
Minneapolis 1,283 Hawaii 454
Baltimore 1,244 Baltimore 423
Charlotte 1,221 Palm Beach 417
Orlando 1,218 Kansas City 417
St Louis 1,084 Raleigh/Durham 384
Tampa 1,039 St Louis 325
Broward 977 Inland Empire 319
Las Vegas 964 Cleveland 261
Raleigh/Durham 963 Stamford 259
Source: Real Capital Analytics
CO L L I E R S I N T E RNAT I ONA L l U . S . R E A L E S TAT E R E V I EW 2 0 0 9
U.S. INVESTMENT SALES MARKET
71
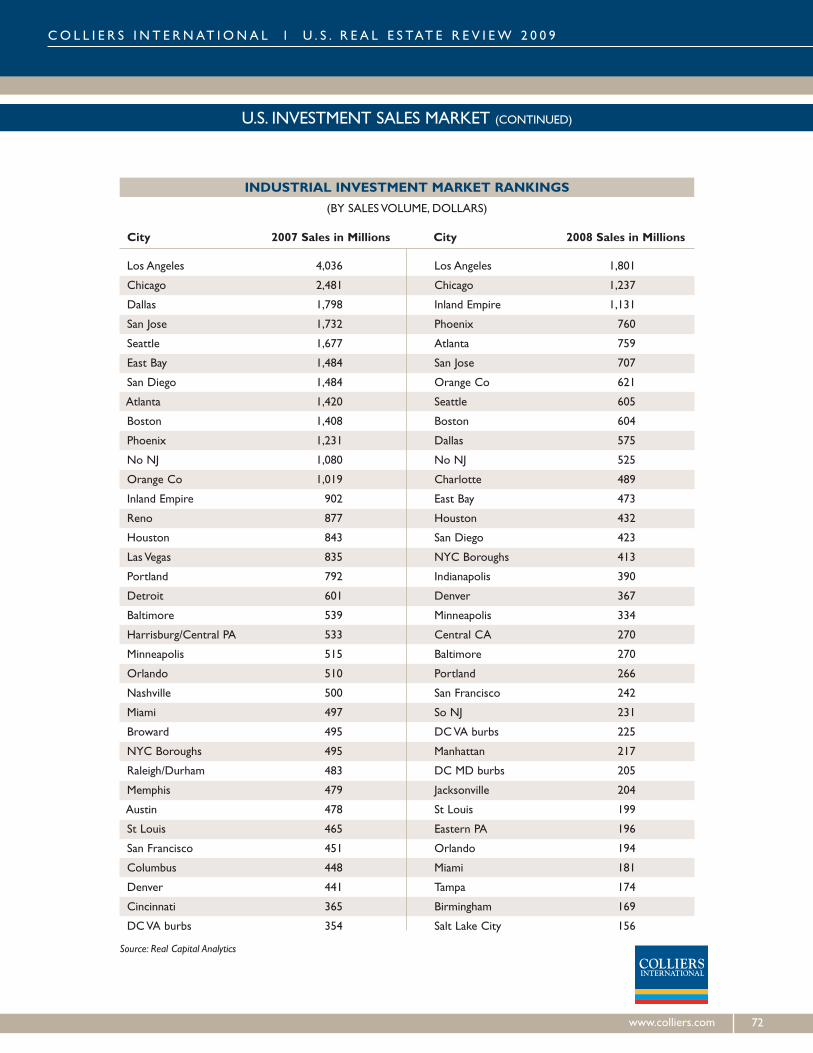
www.colliers.com 72
INDUSTRIAL INVESTMENT MARKET RANKINGS
(BY SALESVOLUME, DOLLARS)
City 2007 Sales in Millions City 2008 Sales in Millions
Los Angeles 4,036 Los Angeles 1,801
Chicago 2,481 Chicago 1,237
Dallas 1,798 Inland Empire 1,131
San Jose 1,732 Phoenix 760
Seattle 1,677 Atlanta 759
East Bay 1,484 San Jose 707
San Diego 1,484 Orange Co 621
Atlanta 1,420 Seattle 605
Boston 1,408 Boston 604
Phoenix 1,231 Dallas 575
No NJ 1,080 No NJ 525
Orange Co 1,019 Charlotte 489
Inland Empire 902 East Bay 473
Reno 877 Houston 432
Houston 843 San Diego 423
Las Vegas 835 NYC Boroughs 413
Portland 792 Indianapolis 390
Detroit 601 Denver 367
Baltimore 539 Minneapolis 334
Harrisburg/Central PA 533 Central CA 270
Minneapolis 515 Baltimore 270
Orlando 510 Portland 266
Nashville 500 San Francisco 242
Miami 497 So NJ 231
Broward 495 DCVA burbs 225
NYC Boroughs 495 Manhattan 217
Raleigh/Durham 483 DC MD burbs 205
Memphis 479 Jacksonville 204
Austin 478 St Louis 199
St Louis 465 Eastern PA 196
San Francisco 451 Orlando 194
Columbus 448 Miami 181
Denver 441 Tampa 174
Cincinnati 365 Birmingham 169
DCVA burbs 354 Salt Lake City 156
Source: Real Capital Analytics
CO L L I E R S I N T E RNAT I ONA L l U . S . R E A L E S TAT E R E V I EW 2 0 0 9
U.S. INVESTMENT SALES MARKET (CONTINUED)
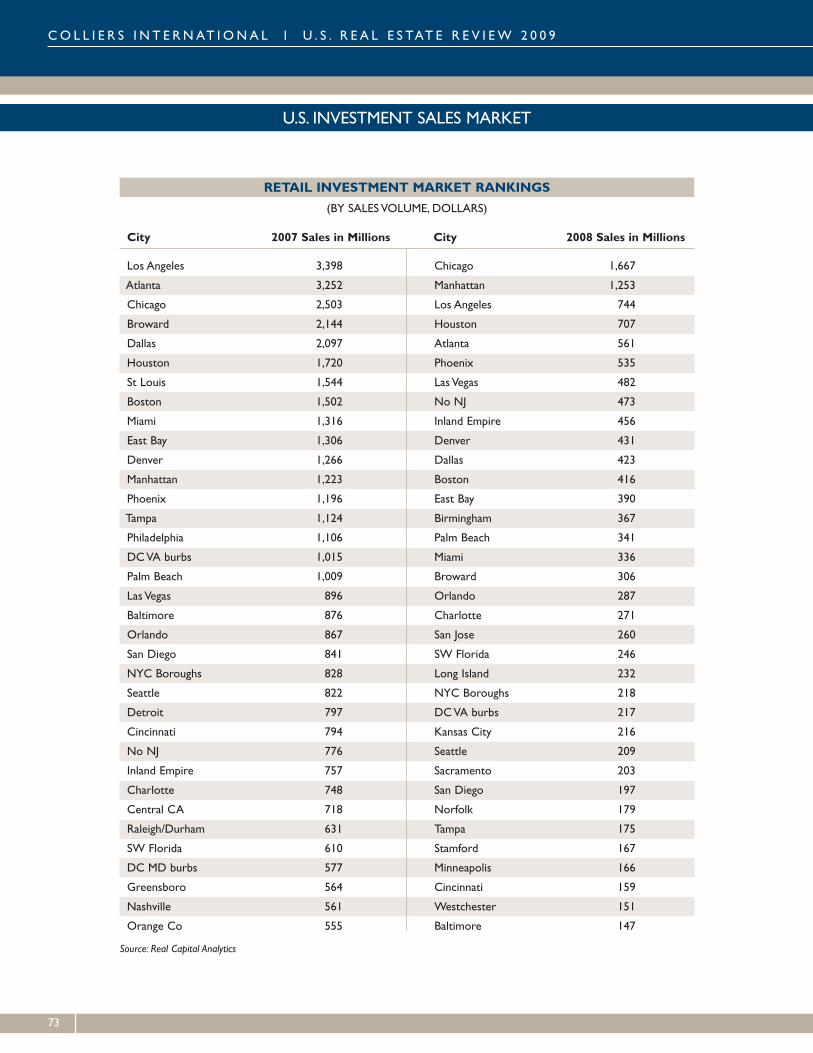
CO L L I E R S I N T E RNAT I ONA L l U . S . R E A L E S TAT E R E V I EW 2 0 0 9
U.S. INVESTMENT SALES MARKET
RETAIL INVESTMENT MARKET RANKINGS
(BY SALESVOLUME, DOLLARS)
City 2007 Sales in Millions City 2008 Sales in Millions
Los Angeles 3,398 Chicago 1,667
Atlanta 3,252 Manhattan 1,253
Chicago 2,503 Los Angeles 744
Broward 2,144 Houston 707
Dallas 2,097 Atlanta 561
Houston 1,720 Phoenix 535
St Louis 1,544 Las Vegas 482
Boston 1,502 No NJ 473
Miami 1,316 Inland Empire 456
East Bay 1,306 Denver 431
Denver 1,266 Dallas 423
Manhattan 1,223 Boston 416
Phoenix 1,196 East Bay 390
Tampa 1,124 Birmingham 367
Philadelphia 1,106 Palm Beach 341
DCVA burbs 1,015 Miami 336
Palm Beach 1,009 Broward 306
Las Vegas 896 Orlando 287
Baltimore 876 Charlotte 271
Orlando 867 San Jose 260
San Diego 841 SW Florida 246
NYC Boroughs 828 Long Island 232
Seattle 822 NYC Boroughs 218
Detroit 797 DCVA burbs 217
Cincinnati 794 Kansas City 216
No NJ 776 Seattle 209
Inland Empire 757 Sacramento 203
Charlotte 748 San Diego 197
Central CA 718 Norfolk 179
Raleigh/Durham 631 Tampa 175
SW Florida 610 Stamford 167
DC MD burbs 577 Minneapolis 166
Greensboro 564 Cincinnati 159
Nashville 561 Westchester 151
Orange Co 555 Baltimore 147
Source: Real Capital Analytics
73

CO L L I E R S I N T E RNAT I ONA L l U . S . R E A L E S TAT E R E V I EW 2 0 0 9
U.S. INVESTMENT SALES MARKET (CONTINUED)
MULTI-FAMILY INVESTMENT MARKET RANKINGS
(BY SALESVOLUME, DOLLARS)
City 2007 Sales in Millions City 2008 Sales in Millions
Manhattan 7,993 Manhattan 2,876
Los Angeles 6,238 Dallas 1,757
DCVA burbs 4,980 Atlanta 1,740
Atlanta 4,687 Houston 1,613
Phoenix 4,048 Seattle 1,569
Dallas 3,616 NYC Boroughs 1,370
Seattle 3,211 DC MD burbs 1,138
Houston 3,158 Los Angeles 1,108
Boston 3,006 Austin 1,074
Chicago 2,910 Raleigh/Durham 1,044
NYC Boroughs 2,318 Chicago 970
San Diego 2,297 San Diego 767
No NJ 1,876 San Jose 766
Baltimore 1,862 Denver 694
DC MD burbs 1,836 Orlando 639
Denver 1,811 DCVA burbs 575
San Jose 1,810 Phoenix 571
Orange Co 1,591 Sacramento 559
Inland Empire 1,588 Tampa 515
East Bay 1,499 Boston 488
San Francisco 1,475 Portland 454
DC 1,447 East Bay 421
Austin 1,364 No NJ 421
Charlotte 1,176 Orange Co 399
Orlando 1,162 San Antonio 394
Las Vegas 1,101 Baltimore 390
Broward 1,045 Nashville 356
Raleigh/Durham 953 San Francisco 349
Philadelphia 920 Las Vegas 332
Portland 897 Inland Empire 329
Tampa 855 Salt Lake City 329
So NJ 703 Minneapolis 298
Palm Beach 695 Philadelphia 295
Nashville 646 Columbus 292
Long Island 611 Columbia 291
Source: Real Capital Analytics
www.colliers.com 74
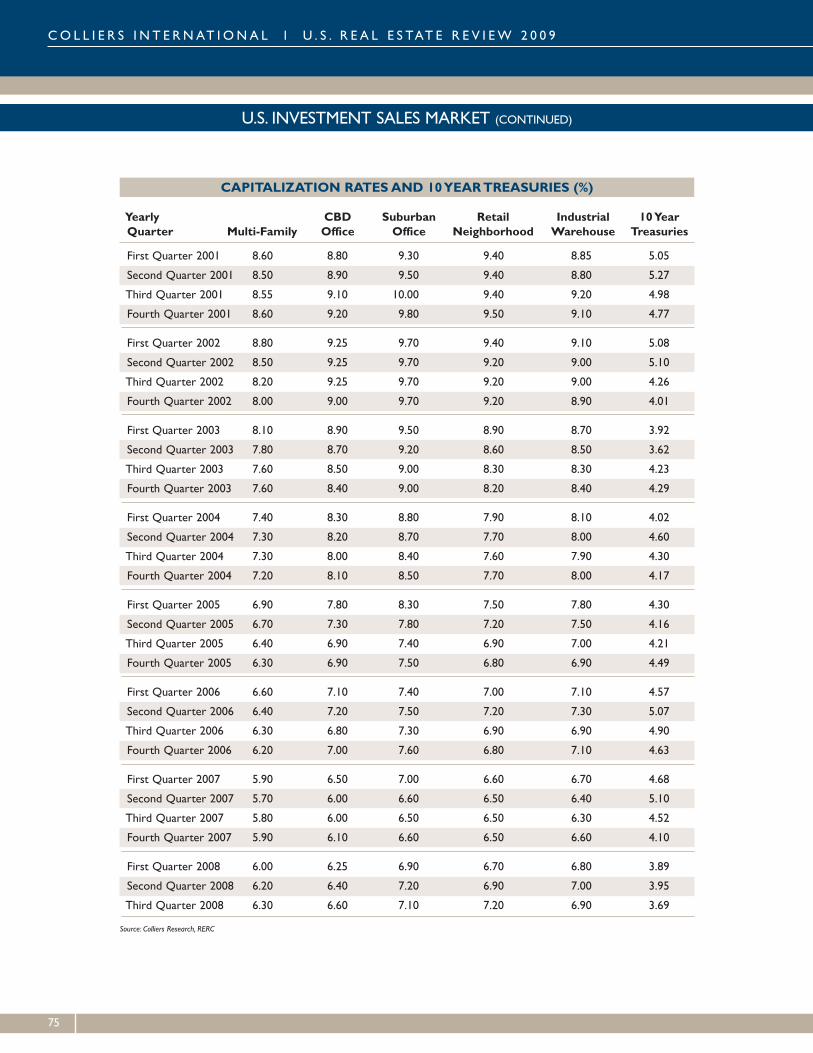
CAPITALIZATION RATESAND 10YEARTREASURIES (%)
Yearly CBD Suburban Retail Industrial 10YearQuarter Multi-Family Office Office Neighborhood Warehouse Treasuries
First Quarter 2001 8.60 8.80 9.30 9.40 8.85 5.05
Second Quarter 2001 8.50 8.90 9.50 9.40 8.80 5.27
Third Quarter 2001 8.55 9.10 10.00 9.40 9.20 4.98
Fourth Quarter 2001 8.60 9.20 9.80 9.50 9.10 4.77
First Quarter 2002 8.80 9.25 9.70 9.40 9.10 5.08
Second Quarter 2002 8.50 9.25 9.70 9.20 9.00 5.10
Third Quarter 2002 8.20 9.25 9.70 9.20 9.00 4.26
Fourth Quarter 2002 8.00 9.00 9.70 9.20 8.90 4.01
First Quarter 2003 8.10 8.90 9.50 8.90 8.70 3.92
Second Quarter 2003 7.80 8.70 9.20 8.60 8.50 3.62
Third Quarter 2003 7.60 8.50 9.00 8.30 8.30 4.23
Fourth Quarter 2003 7.60 8.40 9.00 8.20 8.40 4.29
First Quarter 2004 7.40 8.30 8.80 7.90 8.10 4.02
Second Quarter 2004 7.30 8.20 8.70 7.70 8.00 4.60
Third Quarter 2004 7.30 8.00 8.40 7.60 7.90 4.30
Fourth Quarter 2004 7.20 8.10 8.50 7.70 8.00 4.17
First Quarter 2005 6.90 7.80 8.30 7.50 7.80 4.30
Second Quarter 2005 6.70 7.30 7.80 7.20 7.50 4.16
Third Quarter 2005 6.40 6.90 7.40 6.90 7.00 4.21
Fourth Quarter 2005 6.30 6.90 7.50 6.80 6.90 4.49
First Quarter 2006 6.60 7.10 7.40 7.00 7.10 4.57
Second Quarter 2006 6.40 7.20 7.50 7.20 7.30 5.07
Third Quarter 2006 6.30 6.80 7.30 6.90 6.90 4.90
Fourth Quarter 2006 6.20 7.00 7.60 6.80 7.10 4.63
First Quarter 2007 5.90 6.50 7.00 6.60 6.70 4.68
Second Quarter 2007 5.70 6.00 6.60 6.50 6.40 5.10
Third Quarter 2007 5.80 6.00 6.50 6.50 6.30 4.52
Fourth Quarter 2007 5.90 6.10 6.60 6.50 6.60 4.10
First Quarter 2008 6.00 6.25 6.90 6.70 6.80 3.89
Second Quarter 2008 6.20 6.40 7.20 6.90 7.00 3.95
Third Quarter 2008 6.30 6.60 7.10 7.20 6.90 3.69
Source: Colliers Research, RERC
CO L L I E R S I N T E RNAT I ONA L l U . S . R E A L E S TAT E R E V I EW 2 0 0 9
U.S. INVESTMENT SALES MARKET (CONTINUED)
75
OFFICEInventory – Includes all existing multi or single tenant leased andowner-occupied office properties greater than or equal to 10,000square feet (net rentable area). In some larger markets this minimumsize threshold may vary up to 50,000 square feet. Does not includemedical or government buildings.
Vacancy Rate – Percentage of total inventory physically vacant as ofthe survey date including direct vacant and sublease space.
Absorption – Net change in physically occupied space over a givenperiod of time.
New Supply – Includes completed speculative and build-to-suitconstruction. New supply quoted on a net basis after anydemolitions or conversions.
Annual Quoted Rent – Includes all costs associated with occupyinga full floor in the mid-rise portion of a Class A building inclusive oftaxes, insurance, maintenance, janitorial and utilities (electricitysurcharges added where applicable). All office rents in thisreport are quoted on an annual, gross per square foot basis.Rent calculations do not include sublease space.
Cap Rate – (Or going-in cap rate) Capitalization rates in this surveyare based on multi-tenant institutional grade buildings fully leased atmarket rents. Cap rates are calculated by dividing net operatingincome (NOI) by purchase price.
Note: SF = Square Feet PSF = Per Square FootCBD = Central Business District
INDUSTRIALAbsorption – Net change in occupied space over a given period of time.
Bulk Space – 100,000 square feet or more with up to 10 percent officespace, the balance being general warehouse space with 20 to 36 footceiling heights. All loading is dock-height.
Flex Space – Single-story buildings having 10 to 18 foot ceilings withboth floor-height and dock-height loading. Includes wide variation inoffice space utilization, ranging from retail and personal service throughdistribution, light industrial and occasional heavy industrial use.
Inventory – Includes all existing multi or single tenant leased andowner-occupied industrial warehouse, light manufacturing, flex andR&D properties greater than or equal to 10,000 square feet.
Land Value – Land values are based on prime logistics/industriallocations and are based on approximately 3 acres of fully servicedentitled land.
New Construction – Includes completed speculative andbuild-to-suit construction. New construction quoted on a netbasis after any demolitions or conversions.
Service Space – Single story (or mezzanine) with 10 to 16 footceilings with frontage treatment on one side and dock-height loadingor grade level roll-up doors on the other. Less than 15% office.
Tech/R&D – One and two story, 10 to 15 foot ceiling heights withup to 50% office/dry lab space (remainder in wet lab, workshop, storageand other support), with dock-height and floor-height loading.
Triple Net Rent – Includes rent payable to the landlord and doesnot include additional expenses such as taxes, insurance, maintenance,janitorial and utilities. All industrial and high-tech/ R&D rents inthis report are quoted on an annual, triple net per square foot basisin U.S. dollars.
Vacancy Rate – Percentage of total inventory available (both vacantand occupied) as at the survey date including direct vacant andsublease space.
Warehouse – 50,000 square feet or more with up to 15 percent officespace, the balance being general warehouse space with 18 to 30 footceiling heights. All loading is dock-height.
RETAILCommunity Shopping Center – Usually configured as a strip oftenin a straight line or “L” or “U” shape. Anchor tenant is typically adiscount department store (i.e. Wal-Mart, Target), supermarket orsuper drug store. A community center typically offers a wider rangeof apparel and other soft goods than a neighborhood center does.Total gross leasable area is often between 100,000 and 400,000square feet.
Neighborhood Shopping Center – These centers are designed toprovide convenience shopping for the day-to-day needs of consumersin the immediate neighborhood. Anchors are likely to besupermarkets or drugstores. Other tenants might includestores providing sundries, snacks and personal services.Generally, neighborhood centers are 30,000-150,000 SF in sizeand are configured as strip centers without an enclosed walkwayor mall area, but may possibly have a canopy to connect the storefronts.
Power Center – These centers are designed to provide tremendousselection in a particular merchandise category at low prices.Anchors are likely to be category killers, home improvement stores,discount department stores, warehouse clubs or off-price stores.Generally, regional centers are 250,000-600,000 SF in size and areconfigured with several freestanding (unconnected) anchors and aminimal number of small specialty tenants.
Lifestyle Center – Nonanchored open-air specialty center withhigh concentration of mall-type fashion, home, restaurant andentertainment retailers.
Premier Fashion Streetfront – Destination retail corridor in urbancenter typically occupied by fashion retailers and able to commandtop rents.
Rents – All retail rents in this report are quoted on an annual, triplenet per square foot basis.
Note: SF = Square Feet PSF = Per Square Foot
76
CO L L I E R S I N T E RNAT I ONA L l U . S . R E A L E S TAT E R E V I EW 2 0 0 9
GLOSSARY
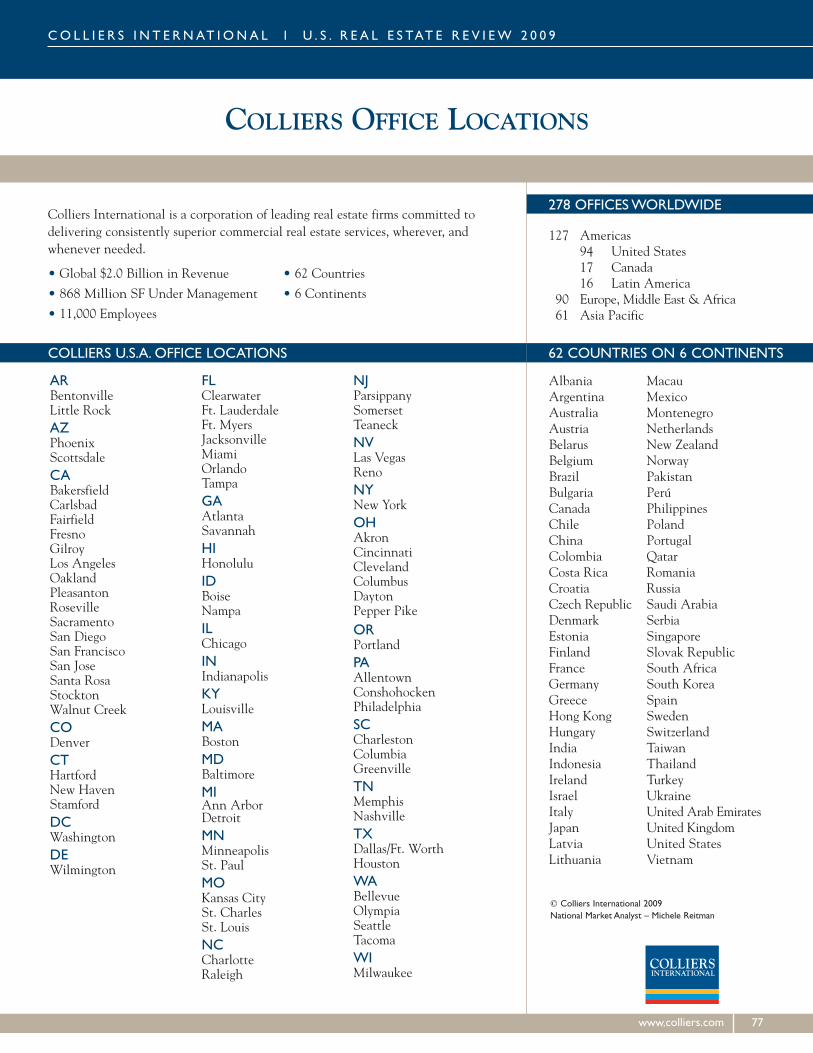
COLLIERS OFFICE LOCATIONS
CO L L I E R S I N T E RNAT I ONA L l U . S . R E A L E S TAT E R E V I EW 2 0 0 9
www.colliers.com 77
ARBentonvilleLittle RockAZPhoenixScottsdaleCABakersfieldCarlsbadFairfieldFresnoGilroyLos AngelesOaklandPleasantonRosevilleSacramentoSan DiegoSan FranciscoSan JoseSanta RosaStocktonWalnut CreekCODenverCTHartfordNew HavenStamfordDCWashingtonDEWilmington
FLClearwaterFt. LauderdaleFt. MyersJacksonvilleMiamiOrlandoTampaGAAtlantaSavannahHIHonoluluIDBoiseNampaILChicagoINIndianapolisKYLouisvilleMABostonMDBaltimoreMIAnn ArborDetroitMNMinneapolisSt. PaulMOKansas CitySt. CharlesSt. LouisNCCharlotteRaleigh
NJParsippanySomersetTeaneckNVLas VegasRenoNYNew YorkOHAkronCincinnatiClevelandColumbusDaytonPepper PikeORPortlandPAAllentownConshohockenPhiladelphiaSCCharlestonColumbiaGreenvilleTNMemphisNashvilleTXDallas/Ft. WorthHoustonWABellevueOlympiaSeattleTacomaWIMilwaukee
COLLIERS U.S.A. OFFICE LOCATIONS
Colliers International is a corporation of leading real estate firms committed todelivering consistently superior commercial real estate services, wherever, andwhenever needed.
• Global $2.0 Billion in Revenue • 62 Countries
• 868 Million SF Under Management • 6 Continents
• 11,000 Employees
278 OFFICESWORLDWIDE
127 Americas94 United States17 Canada16 Latin America
90 Europe, Middle East & Africa61 Asia Pacific
62 COUNTRIES ON 6 CONTINENTS
AlbaniaArgentinaAustraliaAustriaBelarusBelgiumBrazilBulgariaCanadaChileChinaColombiaCosta RicaCroatiaCzech RepublicDenmarkEstoniaFinlandFranceGermanyGreeceHong KongHungaryIndiaIndonesiaIrelandIsraelItalyJapanLatviaLithuania
MacauMexicoMontenegroNetherlandsNew ZealandNorwayPakistanPerúPhilippinesPolandPortugalQatarRomaniaRussiaSaudi ArabiaSerbiaSingaporeSlovak RepublicSouth AfricaSouth KoreaSpainSwedenSwitzerlandTaiwanThailandTurkeyUkraineUnited Arab EmiratesUnited KingdomUnited StatesVietnam
Colliers International 2009National Market Analyst – Michele Reitman

www.colliers.com