colliers 2012 q1 na industrial highlights
TRANSCRIPT
HIGHLIGHTSNORTH AMERICA
WWW.COLLIERS.COM
Q1 2012 | INDUSTRIAL
K.C. CONWAY EMD | Market Analytics
U.S. Industrial Trends•A U.S. manufacturing renaissance combined with growing agriculture and energy exports fuels
demand for industrial real estate.•Proximity to intermodal infrastructure, ports and resources influence investor demand for indus-
trial space.•High vacancy rates in some markets are propped up by functionally obsolete warehouses with low
clear heights or lack of rail access, which mask the need for new bulk warehouse construction.•East Coast industrial is poised for demand growth, with port traffic growing faster than the Gulf or
West Coast, and a Panama Canal expansion just around the corner. •Investor demand in non-core industrial is growing, as demonstrated by the recent $770 million
DEXUS Property Group portfolio sale.
Colliers International continues to believe that modern industrial property is an attractive asset class
MARKET INDICATORSRelative to prior period
U.S. INDUSTRIAL MARKETSUMMARY STATISTICS, Q1 2012
Industrial Real Estate Remains the Little Engine that Could
Q1 2012
Q2 2012*
VACANCY
NET ABSORPTION
CONSTRUCTION
RENTAL RATE
*Projected, relative to prior period
Vacancy Rate: 9.66% Change from Q4 2011: –0.12%
Absorption: 22.7 Million Square Feet
New Construction: 6.6 Million Square Feet
Under Construction: 36.4 Million Square Feet
Asking Rents Per Square Foot Average Warehouse/ Distribution Center: $4.72 Change from Q4 2010: 0.21%
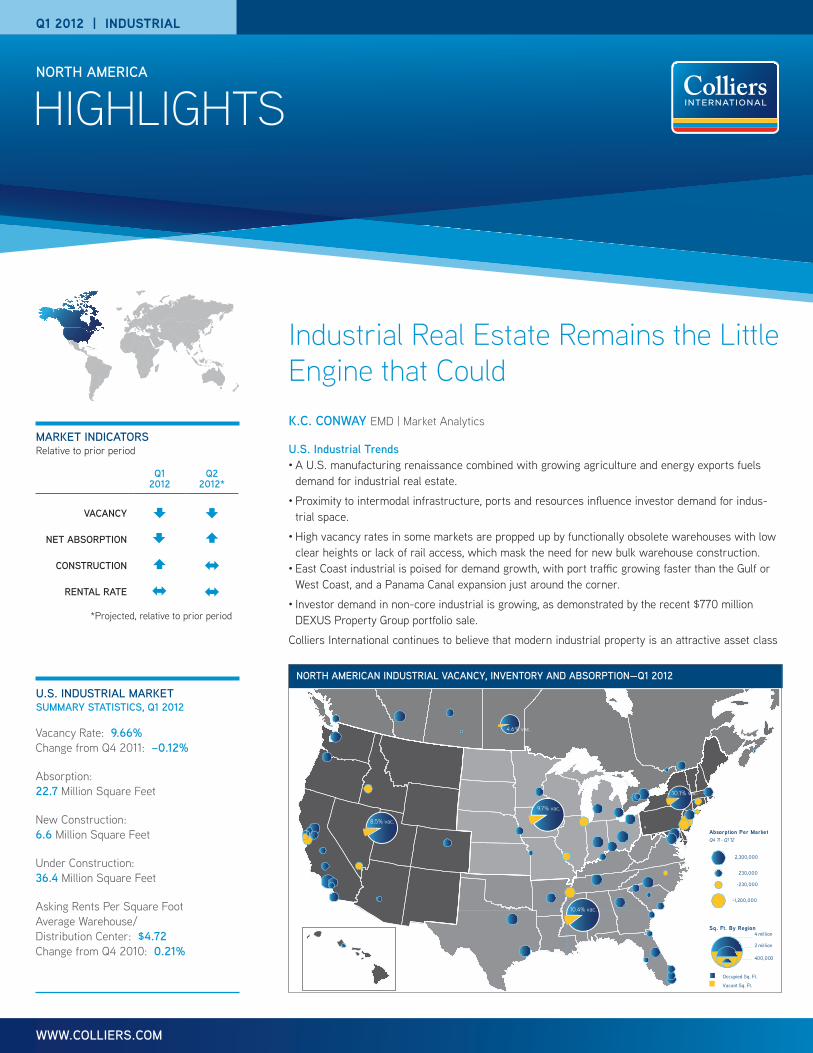
Sq. Ft. By Region
2.00000000e+009
1.00000000e+009
2.00000000e+008
Total_O�SF-Vacant_O�SFVacant_O�SF
Absorption Per MarketQ4 '11 - Q1 '12
2,300,000
230,000
-230,000
-1,200,000
4 million
2 million
400,000
Occupied Sq. Ft.
Vacant Sq. Ft.
8.5% vac.
9.7% vac.
10.4% vac.
10.1% vac.
4.6% vac.
NORTH AMERICAN INDUSTRIAL VACANCY, INVENTORY AND ABSORPTION—Q1 2012
P. 2 | COLLIERS INTERNATIONAL
HIGHLIGHTS | Q1 2012 | INDUSTRIAL | NORTH AMERICA
Manufacturing Is Leading the U.S. Recovery The growth in manufactur-ing industry is not just a good thing for manufacturing property demand: When goods are manufactured, they are also transported and stored be-fore they are sold. In fact, manufacturing growth has an eventual spillover effect to all property types, starting with warehouse and distribution properties.
Specialized Manufacturing Drives Regional Demand As modern manu-facturers become more specialized, they are often anchored to a certain region by the specialized resources they require. These resources might include the skilled labor found in cities with clusters of institutions of higher education; needed inputs such as rare-earth minerals, water and energy; and robust intermodal networks with accessible ports. The find-ings of a recent study by the Brookings Institute, “Locating American Manufacturing – Trends in the Geography of Production” highlight this trend.
•Since 1980, U.S. metropolitan areas have seen increasing specialization in manufacturing, but the specialties of each metro can vary greatly.
•There are six industry concentrations which gravitate to different met-ros: computers and electronics, transportation equipment, low-wage manufacturing, chemicals, machinery, and food production.
This increase in specialized manufacturing has translated into increased demand for industrial space. In Q1 2012, there was net positive absorption
Q1 2012 NORTH AMERICAN INDUSTRIAL OVERVIEW
MEASURE NORTH AMERICA CANADA UNITED STATES WEST/MIDWEST SOUTH NORTHEAST
# of MarketsInventory (SF)
7115,536.6
11 1,570.9
6013,965.7
327,569.4
194,105.3
92,291.0
% of NA Inventory 100% 10% 90% 49% 26% 15%
New Supply (Q1 ‘12 Million SF) 8.3 1.6 6.6 3.5 2.6 .06
% of NA New Supply 100% 19% 81% 42% 31% 8%
Vacancy % 9.14% 4.59% 9.66% 9.15% 10.37% 10.06
Absorption (Millions SF) 26.6 3.9 22.7 11.8 9.9 1.0
% of NA Inventory 100% 15% 85% 44% 37% 4%
Leadership Markets Calgary & Toronto (each with
>1.1 MSF of positive absorption)
Honolulu, Los Angeles, Orange County, CA (have
(5% vacancy)
Los Angeles, Columbus, OH, and
Indianapolis
Houston, Charlotte, Dallas,
Nashville & Orlando with
>1.1 MSF absorp
Baltimore & DC (positive
absorption)Long Island &
Pittsburgh (low vacancy)
Laggard Markets Halifax, Ottawa & Waterloo
(vacancy > 5%)
New Jersey & Chicago
Chicago, St. Louis, Las Vegas,
San Jose have negative absorp.
Atlanta has highest vacancy;
Memphis >1.0 MSF
negative absorp.
New Jersey & Philadelphia
in North America of 26.6 million square feet (MSF). This demand for in-dustrial space was not spread evenly across the continent, but was stron-gest in markets with the cluster of resources that modern manufactures require. For example, this alignment of resources is found in many Mid-Atlantic cities with a combination of a healthy transportation infrastruc-ture, affordable cost of living, access to materials and chemical manufacture, and an educated workforce.
Our overall U.S. outlook is bullish for manufacturing, intermodal transpor-tation, port activity, and thus for industrial real estate.
Transport Sector Growth Indicates Further Industrial Demand This U.S manufacturing renaissance has been propelled by lower American labor costs, a weaker dollar as compared with many other manufacturing na-tions, and lower natural gas prices.
Despite elevated energy prices and a contracting European economy, first-quarter earnings from bellwether manufacturing and shipping com-panies have improved. Transport firm CSX saw record Q1 earnings of $449 million, up 13.9 percent year-over-year. Shipping container traffic volumes and inter-modal activity have also improved. Georgia Ports Authority handled a record 2.37 million tons of cargo in March and con-tainer volume at the Port of Charleston rose by 12.0 percent to its highest level since October 2008.
HIGHLIGHTS | Q1 2012 | INDUSTRIAL | NORTH AMERICA
COLLIERS INTERNATIONAL | P. 3
Toronto and Calgary Drive Canada’s Absorption In Canada, a combination of limited new supply and strong demand from the energy and bulk mate-rials sectors has set the stage for low vacancy rates and strong absorp-tion. 3.9 MSF of Canadian industrial space was absorbed by occupiers. Together, Toronto and Calgary, which reported more than 1.1 MSF of net absorption each, provided more than half of the net absorption in the country. This is an especially noteworthy feat for Calgary, which makes up only eight percent of the nation’s inventory, yet contributed thirty percent to the national absorption.
Vacancy rates remain low in the 11 primary Canadian markets, averaging less than 5 percent. The overall Canadian vacancy rate declined from 4.7 percent in Q4 2011 to 4.6 percent in Q1 2012. Only three markets (Halifax, Ottawa and Waterloo) have vacancy rates above 5 percent.
Southern Demand Rises Despite Elevated Vacancies The combined nine-teen southern U.S. markets show a vacancy rate of 10.37 percent, which is the highest among all regions in North America. Yet, the southern U.S. markets contributed the most positive absorption of any region in North America, thanks to growing port traffic and strengthening manufacturing. Recent announcements have bolstered our outlook for southern industrial markets. These include jumps in container volume in Charleston, record port tonnage in Georgia, a new airport intermodal facility in Charlotte, a new roll-on/roll-off South American shipping service in Port Everglades,
and the selection of Richmond as the last port of call by CKYH Alliance’s Asian service.
One reason for the high vacancy rate in the South is the fact that much of the standing warehouse space in markets like Atlanta, Columbia and Savannah is functionally obsolete. Perhaps as much as 40 percent of warehouse space is unusable by modern occupiers, with low ceiling heights, limited rail access, or inadequate power supply. IDI, one of North America’s largest industrial developers, acknowledged this fact with a recent announcement to develop speculative bulk warehouse properties
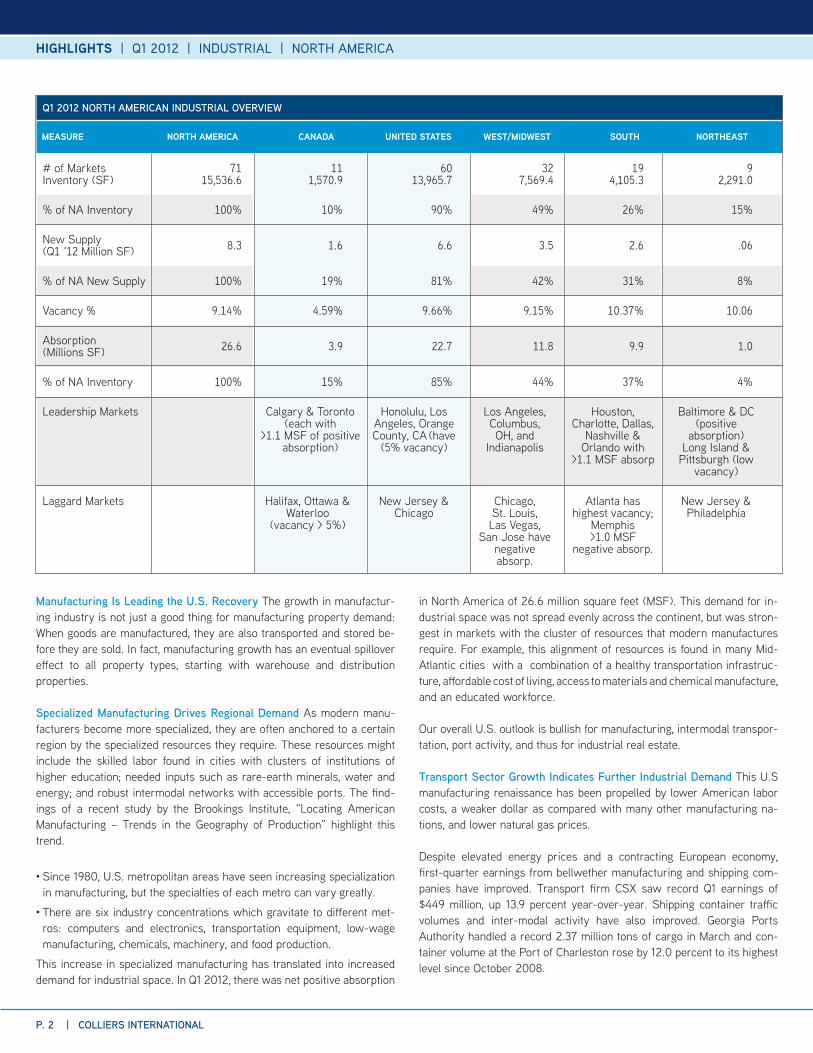
MANUFACTURING AT A GLANCE - APRIL 2012
INDEX SERIES INDEX APR SERIES INDEX MAR % POINT CHANGE DIRECTION RATE OF CHANGE TREND* (MONTHS)
PMI 53.5 54.8 -1.3 Growing Slower 34
New Orders 60.1 58.2 1.9 Growing Faster 37
Production 55.6 61.0 -5.4 Growing Slower 36
Employment 56.9 57.3 -0.4 Growing Slower 32
Supplier Deliveries 48.7 49.2 -0.5 Faster Faster 4
Inventories 46.0 48.5 -2.5 Contracting Faster 2
Customer’ Inventories 43.5 45.5 -2.0 Too low Faster 6
Prices 47.5 61.0 -13.5 Decreasing From Increasing 1
Backlog of Orders 47.0 49.5 -2.5 Contracting Faster 2
Exports 53.5 59.0 -5.5 Growing Slower 7
Imports 53.5 53.5 0.0 Growing Same 6
Growing Slower 36
Growing Slower 34
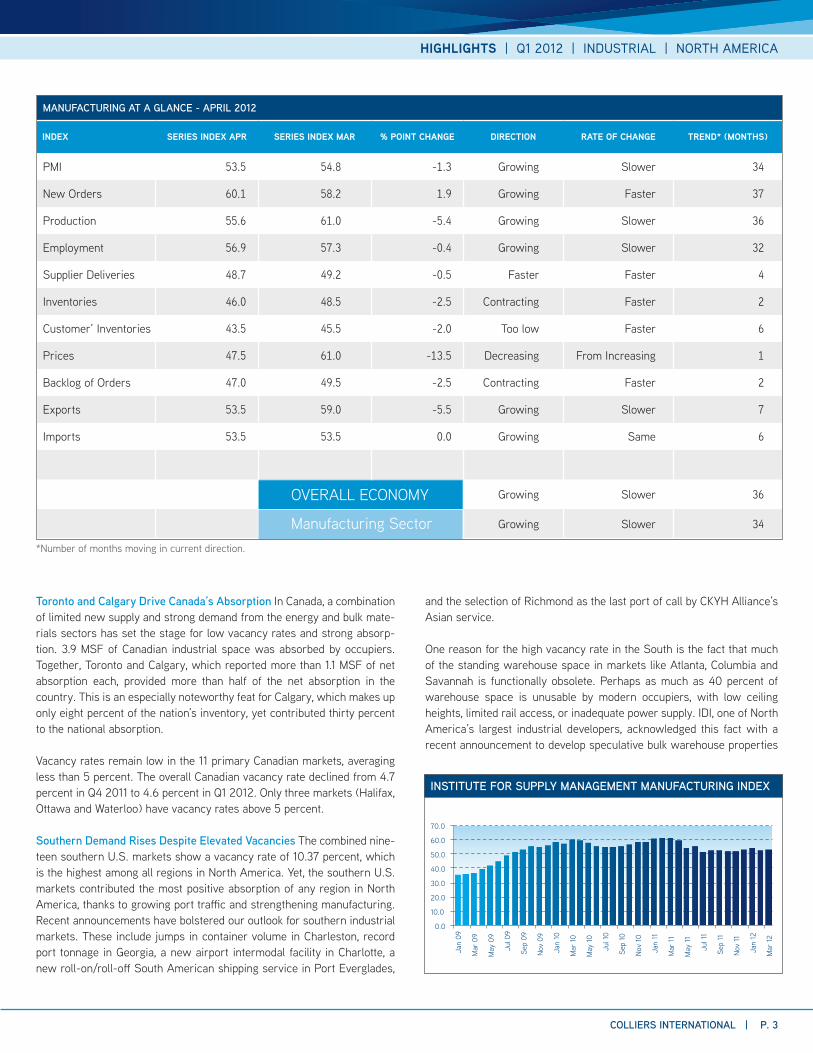
0.0
10.0
20.0
30.0
40.0
50.0
60.0
70.0
Jan
09
Mar
09
May
09
Jul 0
9
Sep
09
Nov
09
Jan
10
Mar
10
May
10
Jul 1
0
Sep
10
Nov
10
Jan
11
Mar
11
May
11
Jul 1
1
Sep
11
Nov
11
Jan
12
Mar
12
INSTITUTE FOR SUPPLY MANAGEMENT MANUFACTURING INDEX
OVERALL ECONOMY
Manufacturing Sector*Number of months moving in current direction.
P. 4 | COLLIERS INTERNATIONAL
HIGHLIGHTS | Q1 2012 | INDUSTRIAL | NORTH AMERICA
along I-20 West, Atlanta’s primary logistics corridor. Some initial observers doubted the need for such product in a market with a 13.3 percent vacancy rate. Yet, IDI’s decision was based on a careful analysis of the Atlanta market that showed a dearth of modern bulk warehouse space near this primary corridor.
East Coast Leads in Growing Port Traffic On both coasts the growing container traffic will sup-port new industrial property demand. According to PIERS, a leading shipping research firm, U.S. trade as measured in TEUs (Twenty-Foot Equivalent Units) was up 4.3 percent in 2011. The growth rate in container traffic among East Coast ports is now higher than the West Coast’s. East Coast ports posted a 5.5 percent year-over-year increase in container traffic in 2011, compared with a 3.0 percent increase in West Coast markets. In the East and Gulf coasts, growth opportu-nities lie in export trade: East Coast ports handle 48 percent of all U.S. export traffic. In contrast, the West Coast leads the nation in import trade with 54 percent of the import market share, with much of this traffic coming from Asia. Panama Canal Expansion Will Recalibrate U.S. Port Dynamics in 2014As the completion of the Panama Canal expansion project approaches in 2014, East Coast ports are making ready for the anticipated jump in traffic. In Savannah and Charleston, projects are underway to dredge deeper channels. Miami is working to upgrade its crane equipment. Florida ports are enhancing their roll-on, roll-off rail service. Right-to-work states from Virginia to Texas are automating port activities. Port authority directors along the East and Gulf coasts expect that warehouse demand will grow at double-digit rates in response to new larger vessels calling on their ports.
Northeast Region Most Exposed to European Woes The Northeast region is weak in comparison to the other regions, due in part to anemic trade flows inhibited by the European recession par-ticularly New York and Baltimore. As Europe wrestles with austerity measures and the United Kingdom endures a double-dip recession, warehouse demand growth will remain somewhat anemic in the Northeast.
The Northeast markets showed the least amount of net absorption in Q1 2012, with only 993,000 square feet. It was also the only region to not see a decline in warehouse vacancy. Overall va-cancy remained unchanged at 10.06 percent.
Two of the largest Northeast industrial markets, Central New Jersey and Philadelphia, each saw negative absorption in Q1 and have vacancy rates in excess of 10 percent. But the good news for this region is that there is little new supply being added to the market. Only 635,000 square feet of industrial property was delivered in Q1 2012. Central New Jersey and Philadelphia together saw only 150,000 square feet of new warehouse supply.
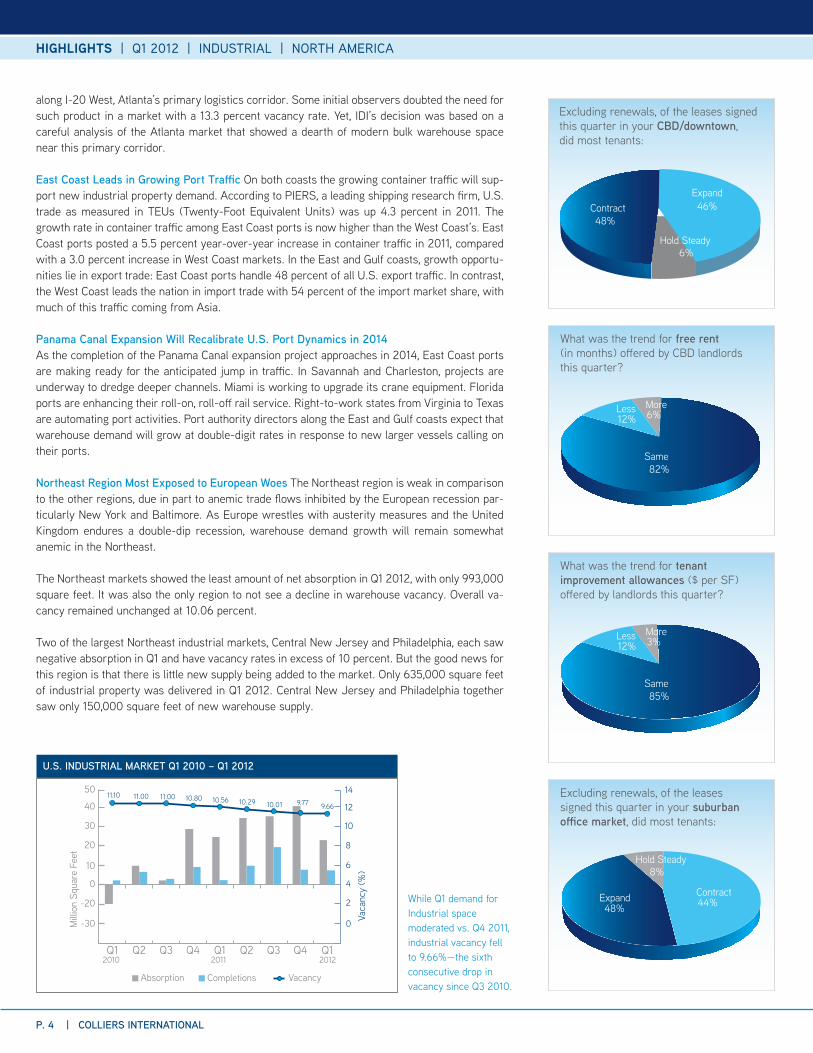
U.S. INDUSTRIAL MARKET Q1 2010 – Q1 2012
Mill
ion
Squa
reFe
et
Vaca
ncy
(%)
-30
-20
0
10
20
30
40
50
Q1Q4Q3Q2Q1Q4Q3Q2Q1
Absorption Completions Vacancy
2010 2011 2012
0
2
6
4
14
12
10
8
11.10 11.00 11.00 10.809.66
10.56 10.29 9.7710.01
48%46%
6%
Excluding renewals, of the leases signed this quarter in your CBD/downtown, did most tenants:
Contract Expand
Hold Steady
What was the trend for free rent (in months) o�ered by CBD landlords this quarter?
82%
12% 6%
Same
Less More
What was the trend for tenant improvement allowances ($ per SF) o�ered by landlords this quarter?
85%
12% 3%
Same
Less More
Excluding renewals, of the leases signed this quarter in your suburban o�ce market, did most tenants:
48%Expand 44%
Contract
8%Hold Steady
While Q1 demand for Industrial space moderated vs. Q4 2011, industrial vacancy fell to 9.66%—the sixth consecutive drop in vacancy since Q3 2010.
HIGHLIGHTS | Q1 2012 | INDUSTRIAL | NORTH AMERICA
COLLIERS INTERNATIONAL | P. 5
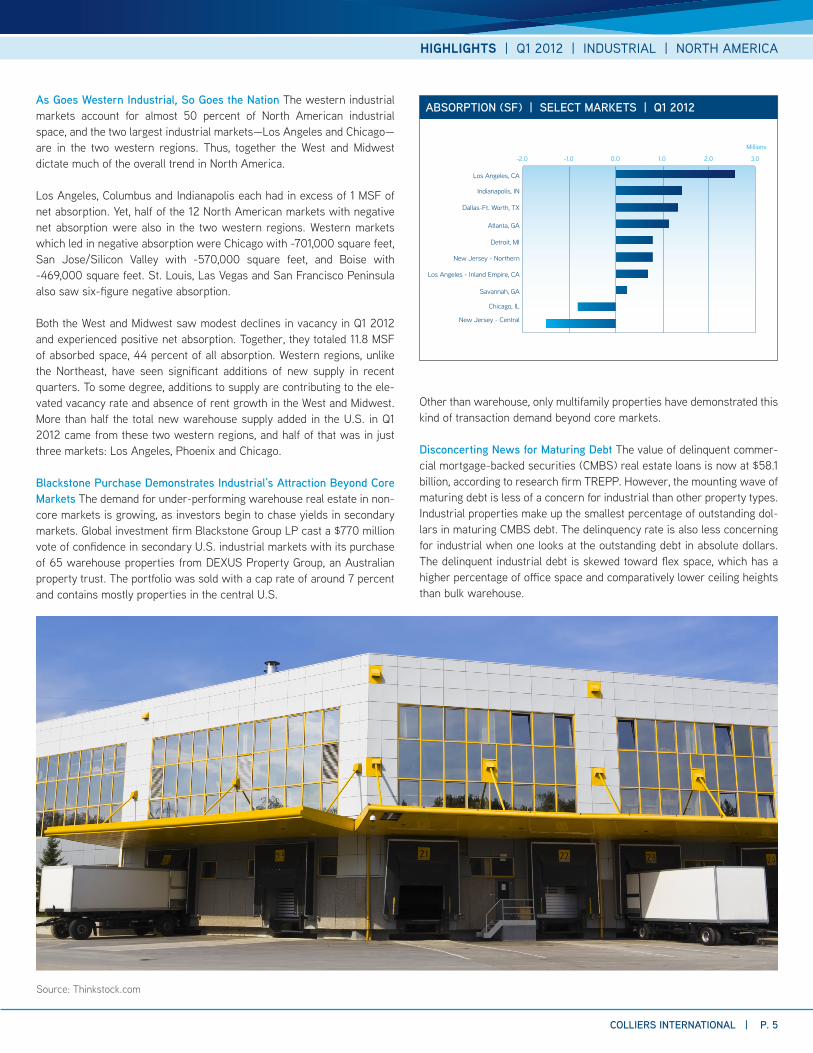
As Goes Western Industrial, So Goes the Nation The western industrial markets account for almost 50 percent of North American industrial space, and the two largest industrial markets—Los Angeles and Chicago—are in the two western regions. Thus, together the West and Midwest dictate much of the overall trend in North America.
Los Angeles, Columbus and Indianapolis each had in excess of 1 MSF of net absorption. Yet, half of the 12 North American markets with negative net absorption were also in the two western regions. Western markets which led in negative absorption were Chicago with -701,000 square feet, San Jose/Silicon Valley with -570,000 square feet, and Boise with -469,000 square feet. St. Louis, Las Vegas and San Francisco Peninsula also saw six-figure negative absorption.
Both the West and Midwest saw modest declines in vacancy in Q1 2012 and experienced positive net absorption. Together, they totaled 11.8 MSF of absorbed space, 44 percent of all absorption. Western regions, unlike the Northeast, have seen significant additions of new supply in recent quarters. To some degree, additions to supply are contributing to the ele-vated vacancy rate and absence of rent growth in the West and Midwest. More than half the total new warehouse supply added in the U.S. in Q1 2012 came from these two western regions, and half of that was in just three markets: Los Angeles, Phoenix and Chicago.
Blackstone Purchase Demonstrates Industrial’s Attraction Beyond Core Markets The demand for under-performing warehouse real estate in non-core markets is growing, as investors begin to chase yields in secondary markets. Global investment firm Blackstone Group LP cast a $770 million vote of confidence in secondary U.S. industrial markets with its purchase of 65 warehouse properties from DEXUS Property Group, an Australian property trust. The portfolio was sold with a cap rate of around 7 percent and contains mostly properties in the central U.S.
-2.0 -1.0 0.0 1.0 2.0
Savannah, GA
Chicago, IL
New Jersey - Central
Los Angeles - Inland Empire, CA
New Jersey - Northern
Detroit, MI
Atlanta, GA
Indianapolis, IN
Dallas-Ft. Worth, TX
Los Angeles, CA
3.0
Millions
ABSORPTION (SF) | SELECT MARKETS | Q1 2012
Other than warehouse, only multifamily properties have demonstrated this kind of transaction demand beyond core markets.
Disconcerting News for Maturing Debt The value of delinquent commer-cial mortgage-backed securities (CMBS) real estate loans is now at $58.1 billion, according to research firm TREPP. However, the mounting wave of maturing debt is less of a concern for industrial than other property types. Industrial properties make up the smallest percentage of outstanding dol-lars in maturing CMBS debt. The delinquency rate is also less concerning for industrial when one looks at the outstanding debt in absolute dollars. The delinquent industrial debt is skewed toward flex space, which has a higher percentage of office space and comparatively lower ceiling heights than bulk warehouse.
Source: Thinkstock.com
HIGHLIGHTS | Q1 2012 | INDUSTRIAL | NORTH AMERICA
COLLIERS INTERNATIONAL | P. 6
UNITED STATES | INDUSTRIAL SURVEY
MARKET
EXISTING INVENTORY (SF)
MAR. 31, 2012NEW CONSTRUCTION
Q1 2012 (SF)CURRENTLY UNDER CONSTRUCTION (SF)
NORTHEAST
Baltimore, MD 299,256,000 70,000 0
Boston, MA 154,142,000 0 1,548,000
Hartford, CT 97,098,000 0 220,000
Long Island, NY 163,756,000 0 0
New Jersey - Central 356,987,000 0 214,000
New Jersey - Northern 375,013,000 102,000 424,000
Philadelphia, PA 402,830,000 50,000 2,734,000
Pittsburgh, PA 167,454,000 115,000 73,000
Washington, DC 274,440,000 299,000 743,000
NORTHEAST TOTAL/AVERAGE 2,290,975,000 635,000 5,956,000
SOUTH
Atlanta, GA 602,043,000 28,000 1,664,000
Charleston, SC 31,992,000 325,000 300,000
Charlotte, NC 290,064,000 0 0
Columbia, SC 36,656,000 0 0
Dallas-Ft. Worth, TX 707,483,000 206,000 1,527,000
Ft. Lauderdale-Broward, FL 124,356,000 65,000 264,000
Greenville/Spartanburg, SC 174,015,000 0 950,000
Houston, TX 481,127,000 594,000 2,997,000
Jacksonville, FL 121,714,000 0 0
Little Rock, AR 45,011,000 0 497,000
Louisville, KY 178,444,000 0 0
Memphis, TN 210,849,000 235,000 1,270,000
Miami, FL 220,963,000 0 311,000
Nashville, TN 159,614,000 658,000 2,257,000
Orlando, FL 293,055,000 152,000 176,000
Raleigh, NC 113,220,000 0 106,000
Savannah, GA 44,421,000 295,000 0
Tampa Bay, FL 209,386,000 0 0
West Palm Beach, FL 60,886,000 0 13,000
SOUTH TOTAL/AVERAGE 4,105,298,000 2,558,000 12,331,000
P. 7 | COLLIERS INTERNATIONAL
HIGHLIGHTS | Q1 2012 | INDUSTRIAL | NORTH AMERICA
UNITED STATES | INDUSTRIAL SURVEY
MARKET
EXISTING INVENTORY (SF)
MAR. 31, 2012NEW CONSTRUCTION
Q1 2012 (SF)CURRENTLY UNDER CONSTRUCTION (SF)
MIDWEST
Chicago, IL 1,309,069,000 493,000 2,897,000
Cincinnati, OH 274,399,000 0 1,166,000
Cleveland, OH 417,767,000 0 0
Columbus, OH 213,419,000 0 898,000
Detroit, MI 499,473,000 68,000 0
Grand Rapids, MI 112,917,000 329,000 239,000
Indianapolis, IN 282,808,000 0 292,000
Kansas City, MO-KS 233,449,000 350,000 0
Minneapolis/St. Paul, MN 263,491,000 0 246,000
Omaha, NE 67,788,000 0 33,000
St. Louis, MO 262,862,000 0 0
MIDWEST TOTAL/AVERAGE 3,937,441,000 1,241,000 5,771,000
WEST
Bakersfield, CA 32,273,000 29,000 716,000
Boise, ID 34,841,000 0 0
Denver, CO 211,259,000 0 48,000
Fairfield, CA 46,162,000 107,000 72,000
Fresno, CA 48,600,000 0 0
Honolulu, HI 38,993,000 0 0
Las Vegas, NV 108,437,000 0 0
Los Angeles - Inland Empire, CA 382,706,000 692,000 5,693,000
Los Angeles, CA 865,987,000 221,000 735,000
Oakland, CA 131,233,000 0 26,000
Orange County, CA 200,098,000 0 645,000
Phoenix, AZ 268,900,000 560,000 3,374,000
Pleasanton/Walnut Creek, CA 33,215,000 0 0
Portland, OR 198,443,000 316,000 416,000
Sacramento, CA 187,142,000 0 200,000
San Diego, CA 188,446,000 0 253,000
San Francisco Peninsula, CA 41,065,000 257,000 0
San Jose/Silicon Valley, CA 253,520,000 0 0
Seattle/Puget Sound, WA 266,364,000 0 144,000
Stockton/San Joaquin County, CA 94,300,000 29,000 0
WEST TOTAL/AVERAGE 3,631,985,000 2,211,000 12,322,000
U.S. TOTAL/AVERAGE 13,965,699,000 6,644,000 36,380,000
HIGHLIGHTS | Q1 2012 | INDUSTRIAL | NORTH AMERICA
COLLIERS INTERNATIONAL | P. 8
UNITED STATES | INDUSTRIAL SURVEY
MARKETABSORPTION Q1 2012 (SF)
VACANCY RATE DEC. 31, 2011 (%)
VACANCY RATE MAR. 31, 2012 (%)
NORTHEAST
Baltimore, MD 1,225,000 10.50 10.11
Boston, MA 628,000 20.00 19.33
Hartford, CT (245,000) 9.50 9.74
Long Island, NY (66,000) 5.27 5.37
New Jersey - Central (1,297,000) 9.96 10.32
New Jersey - Northern 692,000 8.63 8.48
Philadelphia, PA (852,000) 9.80 10.02
Pittsburgh, PA (1,000) 7.26 7.76
Washington, DC 909,000 11.21 10.98
NORTHEAST TOTAL/AVERAGE 994,000 10.06 10.06
SOUTH
Atlanta, GA 995,000 13.52 13.35
Charleston, SC 256,000 10.64 10.86
Charlotte, NC 1,165,000 12.82 12.56
Columbia, SC 50,000 7.49 7.33
Dallas-Ft. Worth, TX 1,169,000 10.41 10.27
Ft. Lauderdale-Broward, FL 315,000 9.50 9.15
Greenville/Spartanburg, SC 395,000 9.73 9.86
Houston, TX 1,232,000 5.34 5.31
Jacksonville, FL 141,000 10.42 10.30
Little Rock, AR 705,000 13.50 12.32
Louisville, KY 198,000 10.01 9.97
Memphis, TN -1,025,000 12.75 13.34
Miami, FL 536,000 7.86 7.36
Nashville, TN 1,227,000 12.68 12.07
Orlando, FL 1,978,000 11.35 10.73
Raleigh, NC (68,000) 10.98 11.04
Savannah, GA 216,000 14.31 13.73
Tampa Bay, FL 86,000 10.27 10.28
West Palm Beach, FL 336,000 8.78 8.23
SOUTH TOTAL/AVERAGE 9,909,000 10.54 10.37
P. 9 | COLLIERS INTERNATIONAL
HIGHLIGHTS | Q1 2012 | INDUSTRIAL | NORTH AMERICA
UNITED STATES | INDUSTRIAL SURVEY
MARKETABSORPTION Q1 2012 (SF)
VACANCY RATE DEC. 31, 2011 (%)
VACANCY RATE MAR. 31, 2012 (%)
MIDWEST
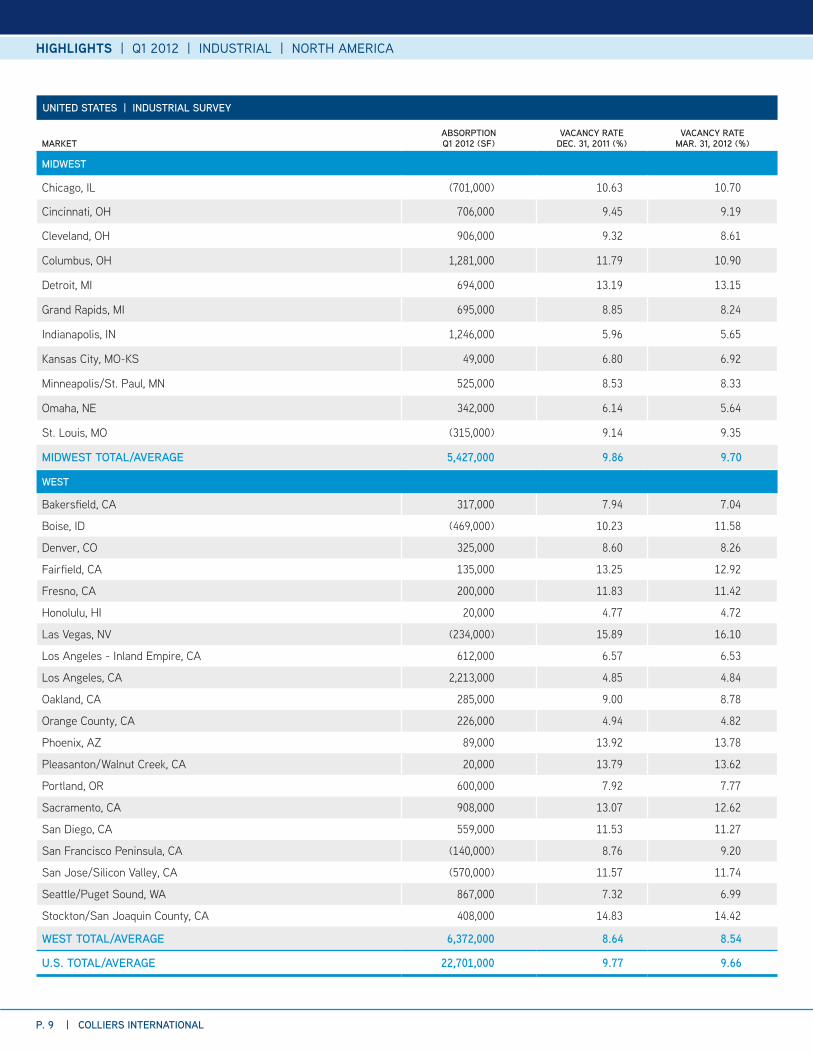
Chicago, IL (701,000) 10.63 10.70
Cincinnati, OH 706,000 9.45 9.19
Cleveland, OH 906,000 9.32 8.61
Columbus, OH 1,281,000 11.79 10.90
Detroit, MI 694,000 13.19 13.15
Grand Rapids, MI 695,000 8.85 8.24
Indianapolis, IN 1,246,000 5.96 5.65
Kansas City, MO-KS 49,000 6.80 6.92
Minneapolis/St. Paul, MN 525,000 8.53 8.33
Omaha, NE 342,000 6.14 5.64
St. Louis, MO (315,000) 9.14 9.35
MIDWEST TOTAL/AVERAGE 5,427,000 9.86 9.70
WEST
Bakersfield, CA 317,000 7.94 7.04
Boise, ID (469,000) 10.23 11.58
Denver, CO 325,000 8.60 8.26
Fairfield, CA 135,000 13.25 12.92
Fresno, CA 200,000 11.83 11.42
Honolulu, HI 20,000 4.77 4.72
Las Vegas, NV (234,000) 15.89 16.10
Los Angeles - Inland Empire, CA 612,000 6.57 6.53
Los Angeles, CA 2,213,000 4.85 4.84
Oakland, CA 285,000 9.00 8.78
Orange County, CA 226,000 4.94 4.82
Phoenix, AZ 89,000 13.92 13.78
Pleasanton/Walnut Creek, CA 20,000 13.79 13.62
Portland, OR 600,000 7.92 7.77
Sacramento, CA 908,000 13.07 12.62
San Diego, CA 559,000 11.53 11.27
San Francisco Peninsula, CA (140,000) 8.76 9.20
San Jose/Silicon Valley, CA (570,000) 11.57 11.74
Seattle/Puget Sound, WA 867,000 7.32 6.99
Stockton/San Joaquin County, CA 408,000 14.83 14.42
WEST TOTAL/AVERAGE 6,372,000 8.64 8.54
U.S. TOTAL/AVERAGE 22,701,000 9.77 9.66
HIGHLIGHTS | Q1 2012 | INDUSTRIAL | NORTH AMERICA
COLLIERS INTERNATIONAL | P. 10
UNITED STATES | INDUSTRIAL SURVEY | SALES PRICE AND CAP RATE AS OF MARCH 2012
MARKETSALES PRICE
(USD PSF)CAP RATE
(%)VACANCY FORECAST
(3 MONTHS)ABSORPTION FORECAST
(3 MONTHS)RENT FORECAST
(3 MONTHS)
NORTHEAST
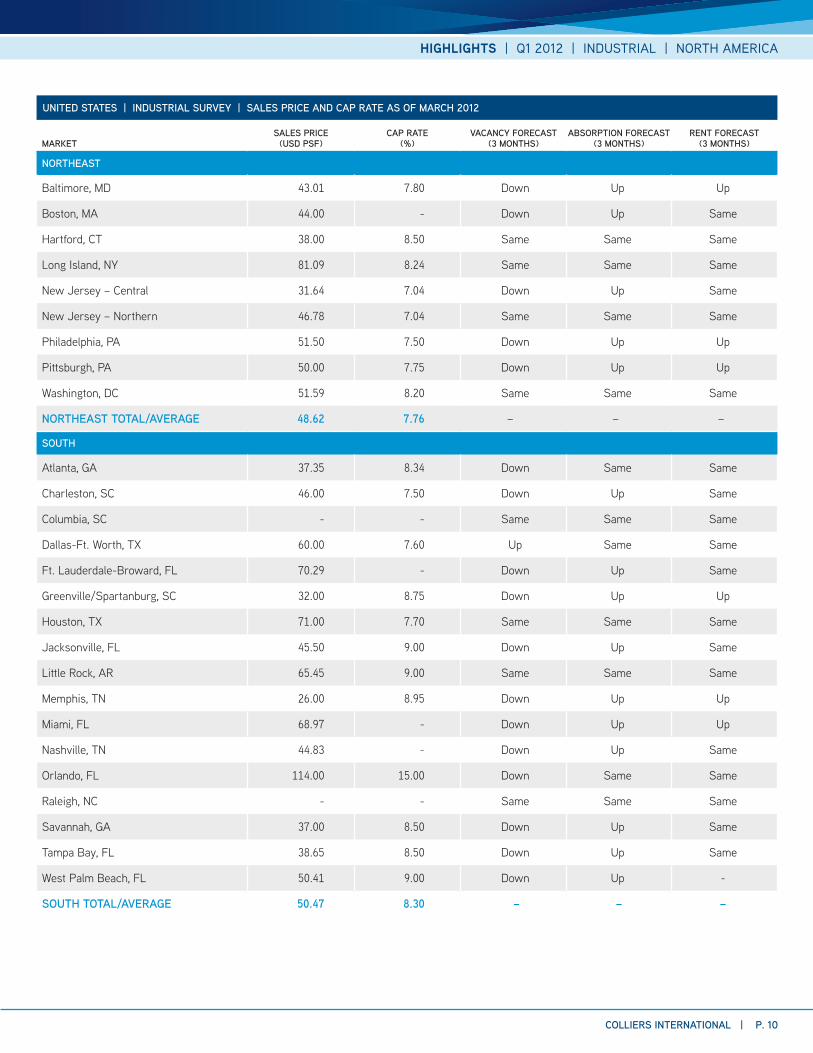
Baltimore, MD 43.01 7.80 Down Up Up
Boston, MA 44.00 - Down Up Same
Hartford, CT 38.00 8.50 Same Same Same
Long Island, NY 81.09 8.24 Same Same Same
New Jersey – Central 31.64 7.04 Down Up Same
New Jersey – Northern 46.78 7.04 Same Same Same
Philadelphia, PA 51.50 7.50 Down Up Up
Pittsburgh, PA 50.00 7.75 Down Up Up
Washington, DC 51.59 8.20 Same Same Same
NORTHEAST TOTAL/AVERAGE 48.62 7.76 – – –
SOUTH
Atlanta, GA 37.35 8.34 Down Same Same
Charleston, SC 46.00 7.50 Down Up Same
Columbia, SC - - Same Same Same
Dallas-Ft. Worth, TX 60.00 7.60 Up Same Same
Ft. Lauderdale-Broward, FL 70.29 - Down Up Same
Greenville/Spartanburg, SC 32.00 8.75 Down Up Up
Houston, TX 71.00 7.70 Same Same Same
Jacksonville, FL 45.50 9.00 Down Up Same
Little Rock, AR 65.45 9.00 Same Same Same
Memphis, TN 26.00 8.95 Down Up Up
Miami, FL 68.97 - Down Up Up
Nashville, TN 44.83 - Down Up Same
Orlando, FL 114.00 15.00 Down Same Same
Raleigh, NC - - Same Same Same
Savannah, GA 37.00 8.50 Down Up Same
Tampa Bay, FL 38.65 8.50 Down Up Same
West Palm Beach, FL 50.41 9.00 Down Up -
SOUTH TOTAL/AVERAGE 50.47 8.30 – – –
P. 11 | COLLIERS INTERNATIONAL
HIGHLIGHTS | Q1 2012 | INDUSTRIAL | NORTH AMERICA
UNITED STATES | INDUSTRIAL SURVEY | SALES PRICE AND CAP RATE AS OF MARCH 2012
MARKETSALES PRICE
(USD PSF)CAP RATE
(%)VACANCY FORECAST
(3 MONTHS)ABSORPTION FORECAST
(3 MONTHS)RENT FORECAST
(3 MONTHS)
MIDWEST
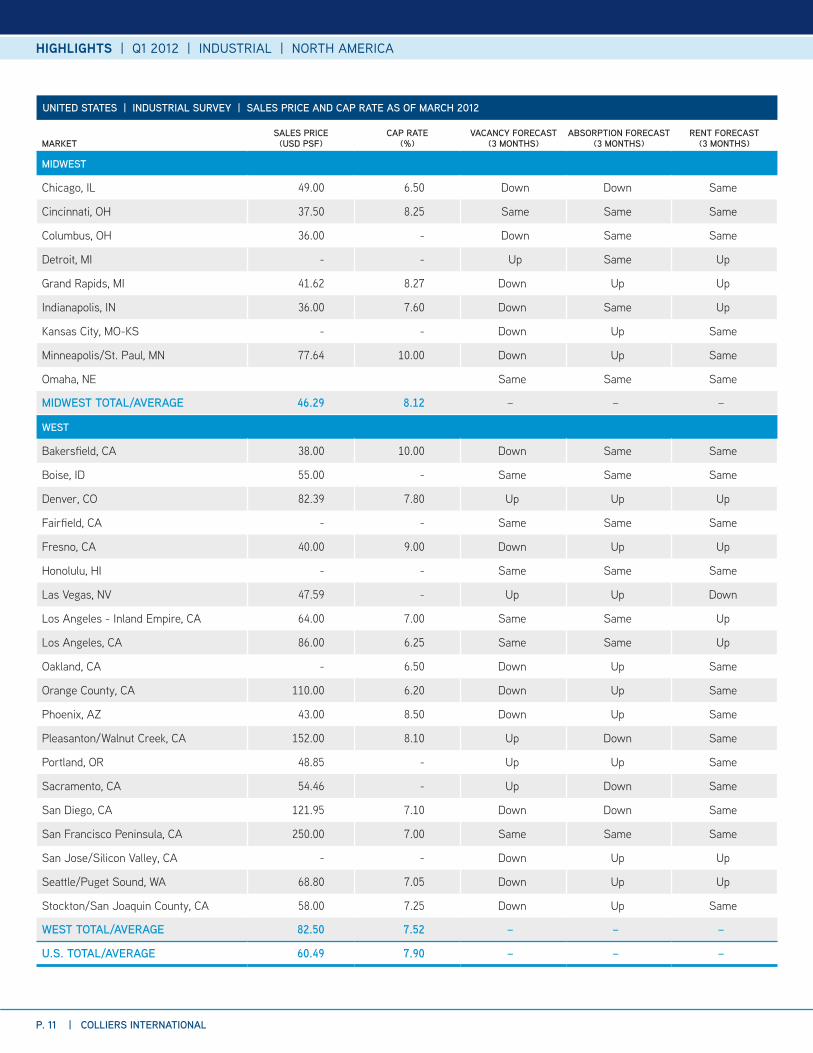
Chicago, IL 49.00 6.50 Down Down Same
Cincinnati, OH 37.50 8.25 Same Same Same
Columbus, OH 36.00 - Down Same Same
Detroit, MI - - Up Same Up
Grand Rapids, MI 41.62 8.27 Down Up Up
Indianapolis, IN 36.00 7.60 Down Same Up
Kansas City, MO-KS - - Down Up Same
Minneapolis/St. Paul, MN 77.64 10.00 Down Up Same
Omaha, NE Same Same Same
MIDWEST TOTAL/AVERAGE 46.29 8.12 – – –
WEST
Bakersfield, CA 38.00 10.00 Down Same Same
Boise, ID 55.00 - Same Same Same
Denver, CO 82.39 7.80 Up Up Up
Fairfield, CA - - Same Same Same
Fresno, CA 40.00 9.00 Down Up Up
Honolulu, HI - - Same Same Same
Las Vegas, NV 47.59 - Up Up Down
Los Angeles - Inland Empire, CA 64.00 7.00 Same Same Up
Los Angeles, CA 86.00 6.25 Same Same Up
Oakland, CA - 6.50 Down Up Same
Orange County, CA 110.00 6.20 Down Up Same
Phoenix, AZ 43.00 8.50 Down Up Same
Pleasanton/Walnut Creek, CA 152.00 8.10 Up Down Same
Portland, OR 48.85 - Up Up Same
Sacramento, CA 54.46 - Up Down Same
San Diego, CA 121.95 7.10 Down Down Same
San Francisco Peninsula, CA 250.00 7.00 Same Same Same
San Jose/Silicon Valley, CA - - Down Up Up
Seattle/Puget Sound, WA 68.80 7.05 Down Up Up
Stockton/San Joaquin County, CA 58.00 7.25 Down Up Same
WEST TOTAL/AVERAGE 82.50 7.52 – – –
U.S. TOTAL/AVERAGE 60.49 7.90 – – –
HIGHLIGHTS | Q1 2012 | INDUSTRIAL | NORTH AMERICA
COLLIERS INTERNATIONAL | P. 12
UNITED STATES | INDUSTRIAL SURVEY | RENTS AS OF MARCH 2012
MARKETWAREHOUSE/DISTRIBUTION
SPACE (USD PSF)BULK SPACE(USD PSF)
FLEX/SERVICE SPACE (USD PSF)
TECH/R&D SPACE (USD PSF)
NORTHEAST
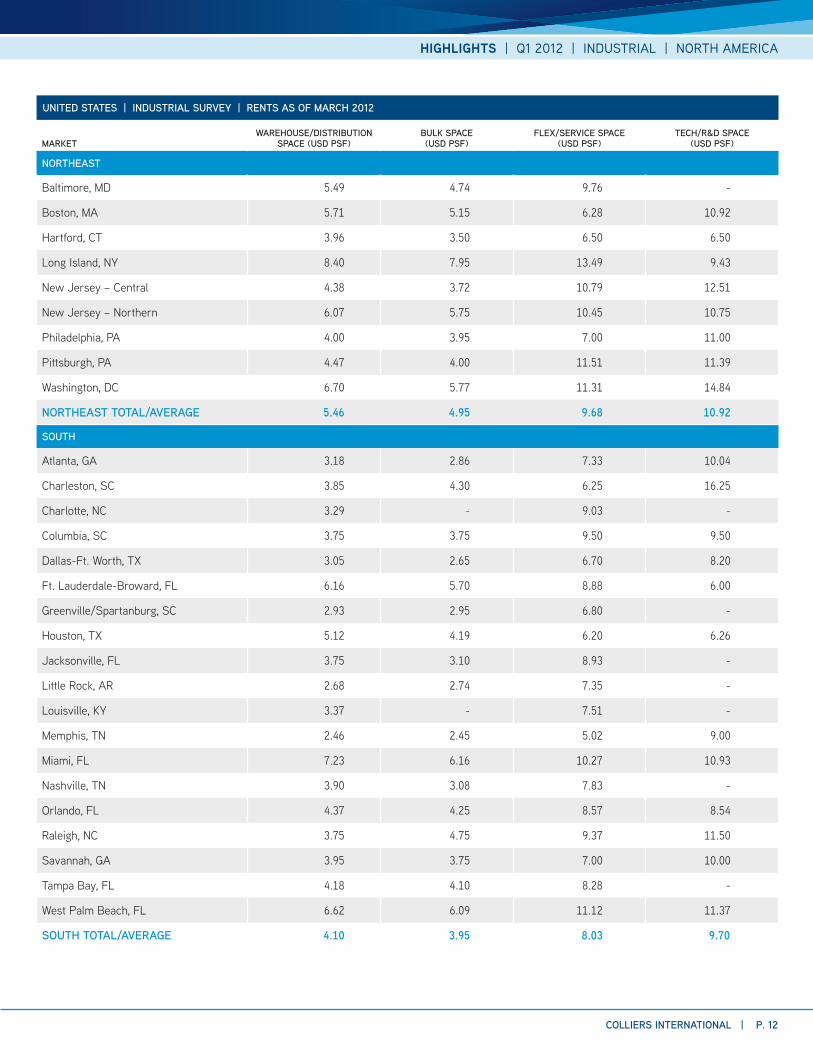
Baltimore, MD 5.49 4.74 9.76 -
Boston, MA 5.71 5.15 6.28 10.92
Hartford, CT 3.96 3.50 6.50 6.50
Long Island, NY 8.40 7.95 13.49 9.43
New Jersey – Central 4.38 3.72 10.79 12.51
New Jersey – Northern 6.07 5.75 10.45 10.75
Philadelphia, PA 4.00 3.95 7.00 11.00
Pittsburgh, PA 4.47 4.00 11.51 11.39
Washington, DC 6.70 5.77 11.31 14.84
NORTHEAST TOTAL/AVERAGE 5.46 4.95 9.68 10.92
SOUTH
Atlanta, GA 3.18 2.86 7.33 10.04
Charleston, SC 3.85 4.30 6.25 16.25
Charlotte, NC 3.29 - 9.03 -
Columbia, SC 3.75 3.75 9.50 9.50
Dallas-Ft. Worth, TX 3.05 2.65 6.70 8.20
Ft. Lauderdale-Broward, FL 6.16 5.70 8.88 6.00
Greenville/Spartanburg, SC 2.93 2.95 6.80 -
Houston, TX 5.12 4.19 6.20 6.26
Jacksonville, FL 3.75 3.10 8.93 -
Little Rock, AR 2.68 2.74 7.35 -
Louisville, KY 3.37 - 7.51 -
Memphis, TN 2.46 2.45 5.02 9.00
Miami, FL 7.23 6.16 10.27 10.93
Nashville, TN 3.90 3.08 7.83 -
Orlando, FL 4.37 4.25 8.57 8.54
Raleigh, NC 3.75 4.75 9.37 11.50
Savannah, GA 3.95 3.75 7.00 10.00
Tampa Bay, FL 4.18 4.10 8.28 -
West Palm Beach, FL 6.62 6.09 11.12 11.37
SOUTH TOTAL/AVERAGE 4.10 3.95 8.03 9.70
P. 13 | COLLIERS INTERNATIONAL
HIGHLIGHTS | Q1 2012 | INDUSTRIAL | NORTH AMERICA
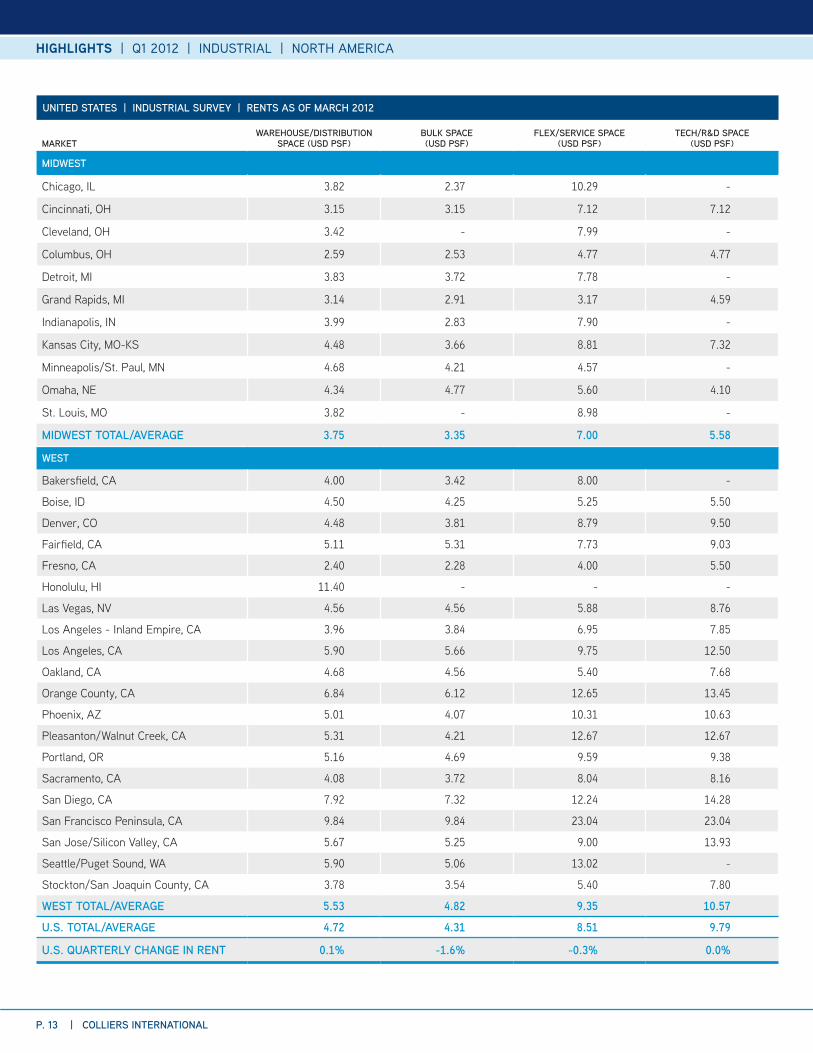
UNITED STATES | INDUSTRIAL SURVEY | RENTS AS OF MARCH 2012
MARKETWAREHOUSE/DISTRIBUTION
SPACE (USD PSF)BULK SPACE(USD PSF)
FLEX/SERVICE SPACE (USD PSF)
TECH/R&D SPACE (USD PSF)
MIDWEST
Chicago, IL 3.82 2.37 10.29 -
Cincinnati, OH 3.15 3.15 7.12 7.12
Cleveland, OH 3.42 - 7.99 -
Columbus, OH 2.59 2.53 4.77 4.77
Detroit, MI 3.83 3.72 7.78 -
Grand Rapids, MI 3.14 2.91 3.17 4.59
Indianapolis, IN 3.99 2.83 7.90 -
Kansas City, MO-KS 4.48 3.66 8.81 7.32
Minneapolis/St. Paul, MN 4.68 4.21 4.57 -
Omaha, NE 4.34 4.77 5.60 4.10
St. Louis, MO 3.82 - 8.98 -
MIDWEST TOTAL/AVERAGE 3.75 3.35 7.00 5.58
WEST
Bakersfield, CA 4.00 3.42 8.00 -
Boise, ID 4.50 4.25 5.25 5.50
Denver, CO 4.48 3.81 8.79 9.50
Fairfield, CA 5.11 5.31 7.73 9.03
Fresno, CA 2.40 2.28 4.00 5.50
Honolulu, HI 11.40 - - -
Las Vegas, NV 4.56 4.56 5.88 8.76
Los Angeles - Inland Empire, CA 3.96 3.84 6.95 7.85
Los Angeles, CA 5.90 5.66 9.75 12.50
Oakland, CA 4.68 4.56 5.40 7.68
Orange County, CA 6.84 6.12 12.65 13.45
Phoenix, AZ 5.01 4.07 10.31 10.63
Pleasanton/Walnut Creek, CA 5.31 4.21 12.67 12.67
Portland, OR 5.16 4.69 9.59 9.38
Sacramento, CA 4.08 3.72 8.04 8.16
San Diego, CA 7.92 7.32 12.24 14.28
San Francisco Peninsula, CA 9.84 9.84 23.04 23.04
San Jose/Silicon Valley, CA 5.67 5.25 9.00 13.93
Seattle/Puget Sound, WA 5.90 5.06 13.02 -
Stockton/San Joaquin County, CA 3.78 3.54 5.40 7.80
WEST TOTAL/AVERAGE 5.53 4.82 9.35 10.57
U.S. TOTAL/AVERAGE 4.72 4.31 8.51 9.79
U.S. QUARTERLY CHANGE IN RENT 0.1% -1.6% -0.3% 0.0%
HIGHLIGHTS | Q1 2012 | INDUSTRIAL | NORTH AMERICA
COLLIERS INTERNATIONAL | P. 14
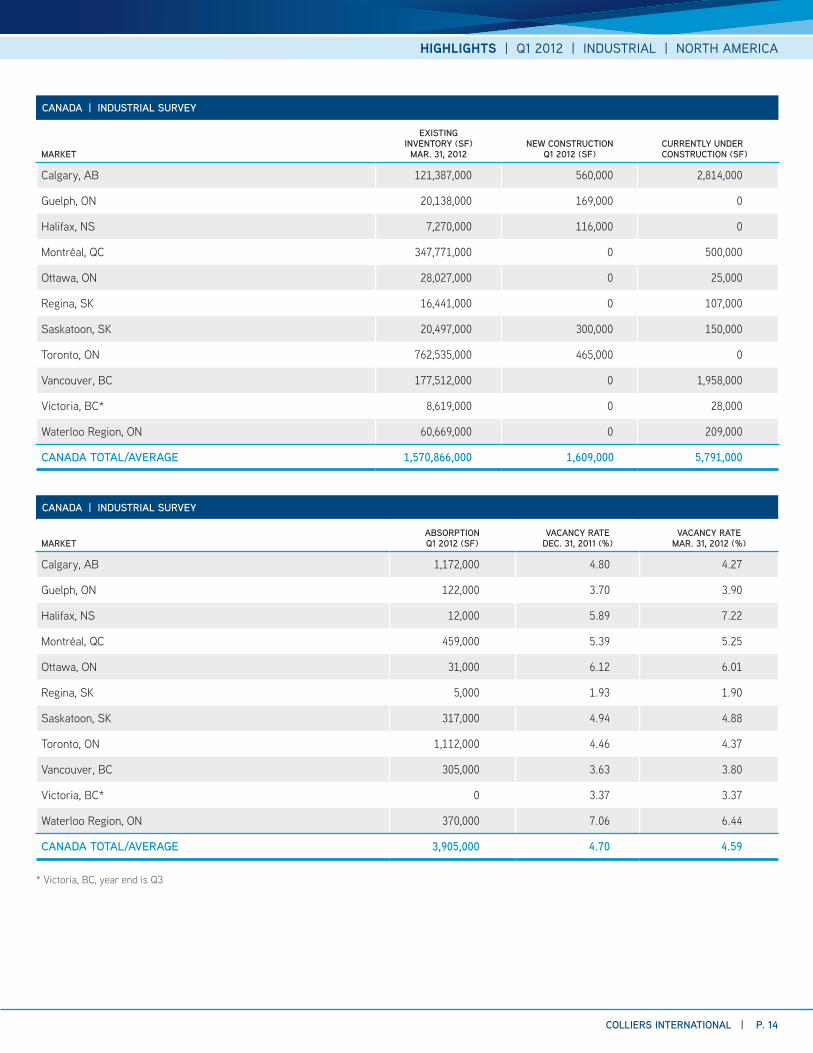
CANADA | INDUSTRIAL SURVEY
MARKET
EXISTING INVENTORY (SF)
MAR. 31, 2012NEW CONSTRUCTION
Q1 2012 (SF)CURRENTLY UNDER CONSTRUCTION (SF)
Calgary, AB 121,387,000 560,000 2,814,000
Guelph, ON 20,138,000 169,000 0
Halifax, NS 7,270,000 116,000 0
Montréal, QC 347,771,000 0 500,000
Ottawa, ON 28,027,000 0 25,000
Regina, SK 16,441,000 0 107,000
Saskatoon, SK 20,497,000 300,000 150,000
Toronto, ON 762,535,000 465,000 0
Vancouver, BC 177,512,000 0 1,958,000
Victoria, BC* 8,619,000 0 28,000
Waterloo Region, ON 60,669,000 0 209,000
CANADA TOTAL/AVERAGE 1,570,866,000 1,609,000 5,791,000
CANADA | INDUSTRIAL SURVEY
MARKETABSORPTION Q1 2012 (SF)
VACANCY RATE DEC. 31, 2011 (%)
VACANCY RATE MAR. 31, 2012 (%)
Calgary, AB 1,172,000 4.80 4.27
Guelph, ON 122,000 3.70 3.90
Halifax, NS 12,000 5.89 7.22
Montréal, QC 459,000 5.39 5.25
Ottawa, ON 31,000 6.12 6.01
Regina, SK 5,000 1.93 1.90
Saskatoon, SK 317,000 4.94 4.88
Toronto, ON 1,112,000 4.46 4.37
Vancouver, BC 305,000 3.63 3.80
Victoria, BC* 0 3.37 3.37
Waterloo Region, ON 370,000 7.06 6.44
CANADA TOTAL/AVERAGE 3,905,000 4.70 4.59
* Victoria, BC, year end is Q3
P. 15 | COLLIERS INTERNATIONAL
HIGHLIGHTS | Q1 2012 | INDUSTRIAL | NORTH AMERICA
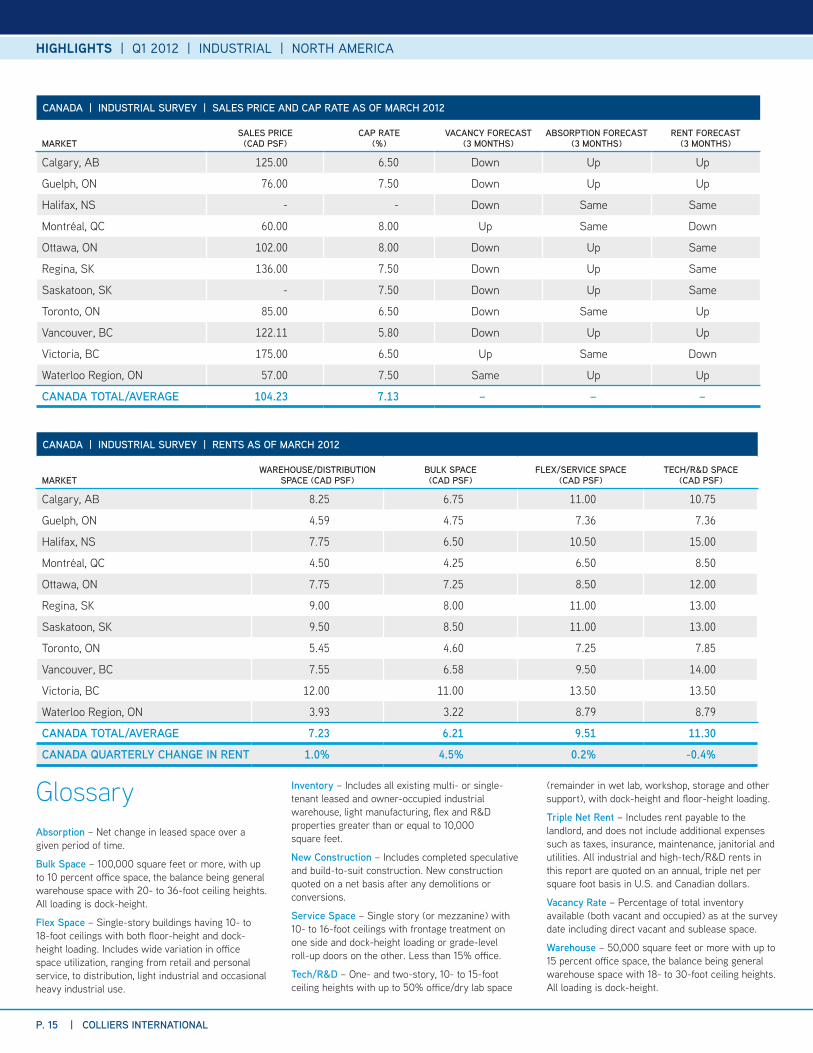
CANADA | INDUSTRIAL SURVEY | SALES PRICE AND CAP RATE AS OF MARCH 2012
MARKETSALES PRICE
(CAD PSF)CAP RATE
(%)VACANCY FORECAST
(3 MONTHS)ABSORPTION FORECAST
(3 MONTHS)RENT FORECAST
(3 MONTHS)
Calgary, AB 125.00 6.50 Down Up Up
Guelph, ON 76.00 7.50 Down Up Up
Halifax, NS - - Down Same Same
Montréal, QC 60.00 8.00 Up Same Down
Ottawa, ON 102.00 8.00 Down Up Same
Regina, SK 136.00 7.50 Down Up Same
Saskatoon, SK - 7.50 Down Up Same
Toronto, ON 85.00 6.50 Down Same Up
Vancouver, BC 122.11 5.80 Down Up Up
Victoria, BC 175.00 6.50 Up Same Down
Waterloo Region, ON 57.00 7.50 Same Up Up
CANADA TOTAL/AVERAGE 104.23 7.13 – – –
CANADA | INDUSTRIAL SURVEY | RENTS AS OF MARCH 2012
MARKETWAREHOUSE/DISTRIBUTION
SPACE (CAD PSF)BULK SPACE(CAD PSF)
FLEX/SERVICE SPACE (CAD PSF)
TECH/R&D SPACE (CAD PSF)
Calgary, AB 8.25 6.75 11.00 10.75
Guelph, ON 4.59 4.75 7.36 7.36
Halifax, NS 7.75 6.50 10.50 15.00
Montréal, QC 4.50 4.25 6.50 8.50
Ottawa, ON 7.75 7.25 8.50 12.00
Regina, SK 9.00 8.00 11.00 13.00
Saskatoon, SK 9.50 8.50 11.00 13.00
Toronto, ON 5.45 4.60 7.25 7.85
Vancouver, BC 7.55 6.58 9.50 14.00
Victoria, BC 12.00 11.00 13.50 13.50
Waterloo Region, ON 3.93 3.22 8.79 8.79
CANADA TOTAL/AVERAGE 7.23 6.21 9.51 11.30
CANADA QUARTERLY CHANGE IN RENT 1.0% 4.5% 0.2% -0.4%
GlossaryAbsorption – Net change in leased space over a given period of time.
Bulk Space – 100,000 square feet or more, with up to 10 percent office space, the balance being general warehouse space with 20- to 36-foot ceiling heights. All loading is dock-height.
Flex Space – Single-story buildings having 10- to 18-foot ceilings with both floor-height and dock-height loading. Includes wide variation in office space utilization, ranging from retail and personal service, to distribution, light industrial and occasional heavy industrial use.
Inventory – Includes all existing multi- or single- tenant leased and owner-occupied industrial warehouse, light manufacturing, flex and R&D properties greater than or equal to 10,000 square feet.
New Construction – Includes completed speculative and build-to-suit construction. New construction quoted on a net basis after any demolitions or conversions.
Service Space – Single story (or mezzanine) with 10- to 16-foot ceilings with frontage treatment on one side and dock-height loading or grade-level roll-up doors on the other. Less than 15% office.
Tech/R&D – One- and two-story, 10- to 15-foot ceiling heights with up to 50% office/dry lab space
(remainder in wet lab, workshop, storage and other support), with dock-height and floor-height loading.
Triple Net Rent – Includes rent payable to the landlord, and does not include additional expenses such as taxes, insurance, maintenance, janitorial and utilities. All industrial and high-tech/R&D rents in this report are quoted on an annual, triple net per square foot basis in U.S. and Canadian dollars.
Vacancy Rate – Percentage of total inventory available (both vacant and occupied) as at the survey date including direct vacant and sublease space.
Warehouse – 50,000 square feet or more with up to 15 percent office space, the balance being general warehouse space with 18- to 30-foot ceiling heights. All loading is dock-height.
HIGHLIGHTS | Q1 2012 | INDUSTRIAL | NORTH AMERICA
WWW.COLLIERS.COM
COLLIERS INTERNATIONAL
601 Union Street, Suite 4800Seattle, WA 98101TEL +1 206 695 4200
Copyright © 2012 Colliers International.
The information contained herein has been obtained from sources deemed reliable. While every reasonable effort has been made to ensure its accuracy, we cannot guarantee it. No responsibility is assumed for any inaccuracies. Readers are encouraged to consult their professional advisors prior to acting on any of the material contained in this report.
Accelerating success.
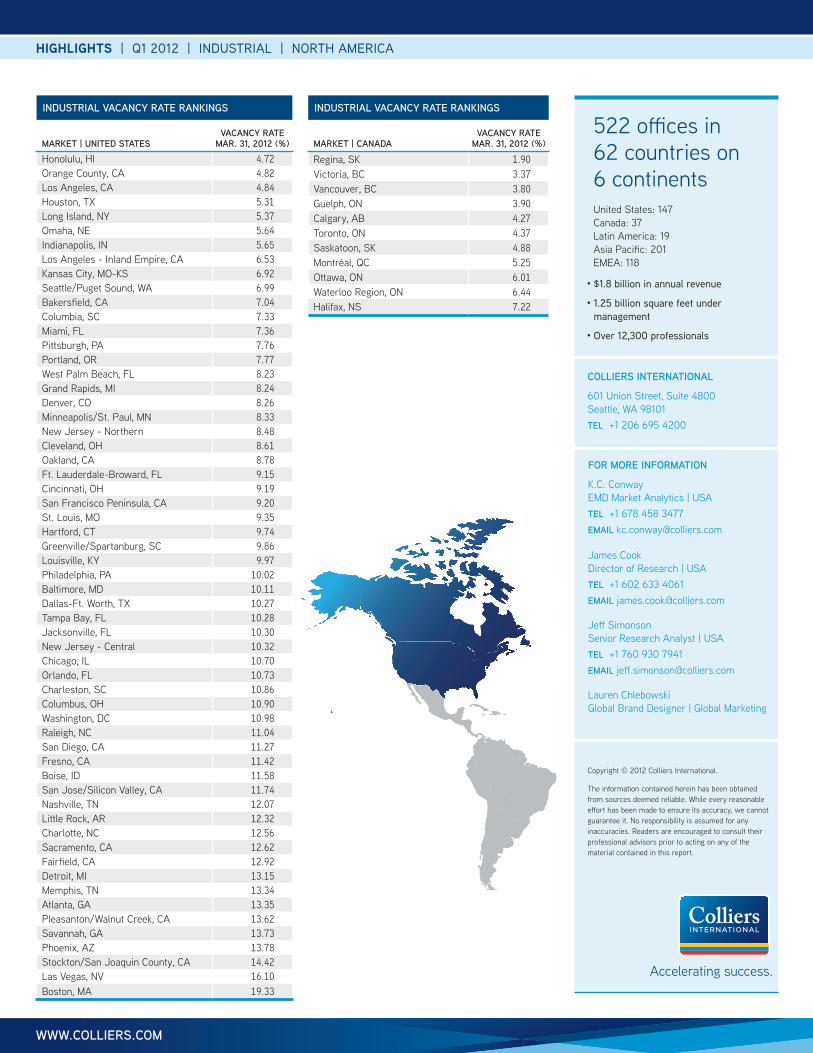
INDUSTRIAL VACANCY RATE RANKINGS
MARKET | UNITED STATESVACANCY RATE
MAR. 31, 2012 (%)
Honolulu, HI 4.72 Orange County, CA 4.82 Los Angeles, CA 4.84 Houston, TX 5.31 Long Island, NY 5.37 Omaha, NE 5.64 Indianapolis, IN 5.65 Los Angeles - Inland Empire, CA 6.53 Kansas City, MO-KS 6.92 Seattle/Puget Sound, WA 6.99 Bakersfield, CA 7.04 Columbia, SC 7.33 Miami, FL 7.36 Pittsburgh, PA 7.76 Portland, OR 7.77 West Palm Beach, FL 8.23 Grand Rapids, MI 8.24 Denver, CO 8.26 Minneapolis/St. Paul, MN 8.33 New Jersey - Northern 8.48 Cleveland, OH 8.61 Oakland, CA 8.78 Ft. Lauderdale-Broward, FL 9.15 Cincinnati, OH 9.19 San Francisco Peninsula, CA 9.20 St. Louis, MO 9.35 Hartford, CT 9.74 Greenville/Spartanburg, SC 9.86 Louisville, KY 9.97 Philadelphia, PA 10.02 Baltimore, MD 10.11 Dallas-Ft. Worth, TX 10.27 Tampa Bay, FL 10.28 Jacksonville, FL 10.30 New Jersey - Central 10.32 Chicago, IL 10.70 Orlando, FL 10.73 Charleston, SC 10.86 Columbus, OH 10.90 Washington, DC 10.98 Raleigh, NC 11.04 San Diego, CA 11.27 Fresno, CA 11.42 Boise, ID 11.58 San Jose/Silicon Valley, CA 11.74 Nashville, TN 12.07 Little Rock, AR 12.32 Charlotte, NC 12.56 Sacramento, CA 12.62 Fairfield, CA 12.92 Detroit, MI 13.15 Memphis, TN 13.34 Atlanta, GA 13.35 Pleasanton/Walnut Creek, CA 13.62 Savannah, GA 13.73 Phoenix, AZ 13.78 Stockton/San Joaquin County, CA 14.42 Las Vegas, NV 16.10 Boston, MA 19.33
INDUSTRIAL VACANCY RATE RANKINGS
MARKET | CANADAVACANCY RATE
MAR. 31, 2012 (%)
Regina, SK 1.90 Victoria, BC 3.37 Vancouver, BC 3.80 Guelph, ON 3.90 Calgary, AB 4.27 Toronto, ON 4.37 Saskatoon, SK 4.88 Montréal, QC 5.25 Ottawa, ON 6.01 Waterloo Region, ON 6.44 Halifax, NS 7.22
FOR MORE INFORMATION
K.C. ConwayEMD Market Analytics | USATEL +1 678 458 3477EMAIL [email protected]
Jeff SimonsonSenior Research Analyst | USATEL +1 760 930 7941EMAIL [email protected]
Lauren ChlebowskiGlobal Brand Designer | Global Marketing
James CookDirector of Research | USATEL +1 602 633 4061EMAIL [email protected]
522 offices in 62 countries on 6 continentsUnited States: 147Canada: 37Latin America: 19Asia Pacific: 201EMEA: 118
• $1.8 billion in annual revenue
• 1.25 billion square feet under management
• Over 12,300 professionals