college and career ready performance index (ccrpi) the new report card in georgia
TRANSCRIPT
College and Career Ready Performance Index (CCRPI)
The NEW Report Card in Georgia

CONTEXT
http://www.youtube.com/watch?v=n5hLJDBm2pU


THE UGLY
http://archive.11alive.com/news/article/196909/8/Did-No-Child-Left-Behind-lead-to-the-CRCT-cheating-scandal
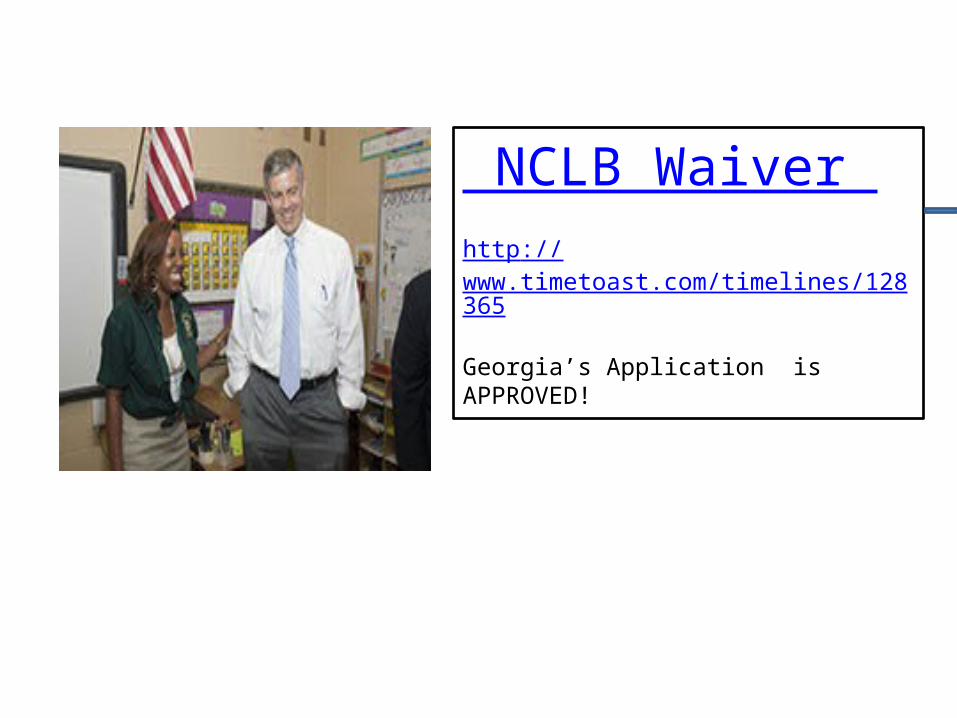
NCLB Waiver http://www.timetoast.com/timelines/128365
Georgia’s Application is APPROVED!
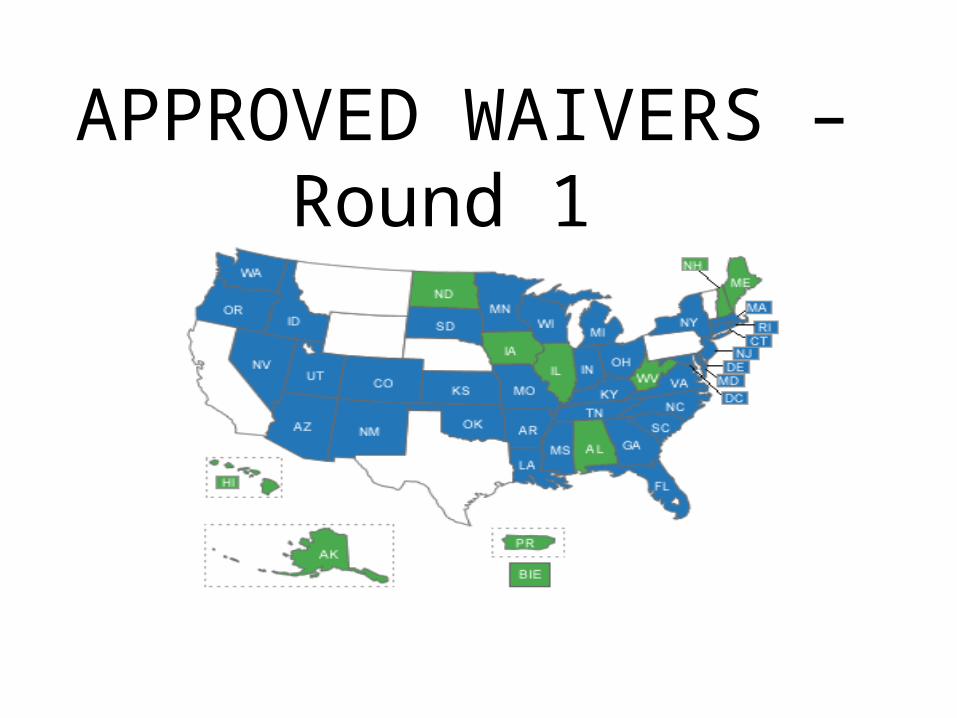
APPROVED WAIVERS – Round 1

APPROVED WAIVERS – Round 2


In Your Folder
1. CCRPI Overview (yellow and pink)2. CCRPI Indicators (blue and white)3. CCRPI Reports (ES, MS, & HS)4. CCRPI Scores - Tables and Charts5. Graduation Rates (2011-2013)5. AYP vs. CCRPI


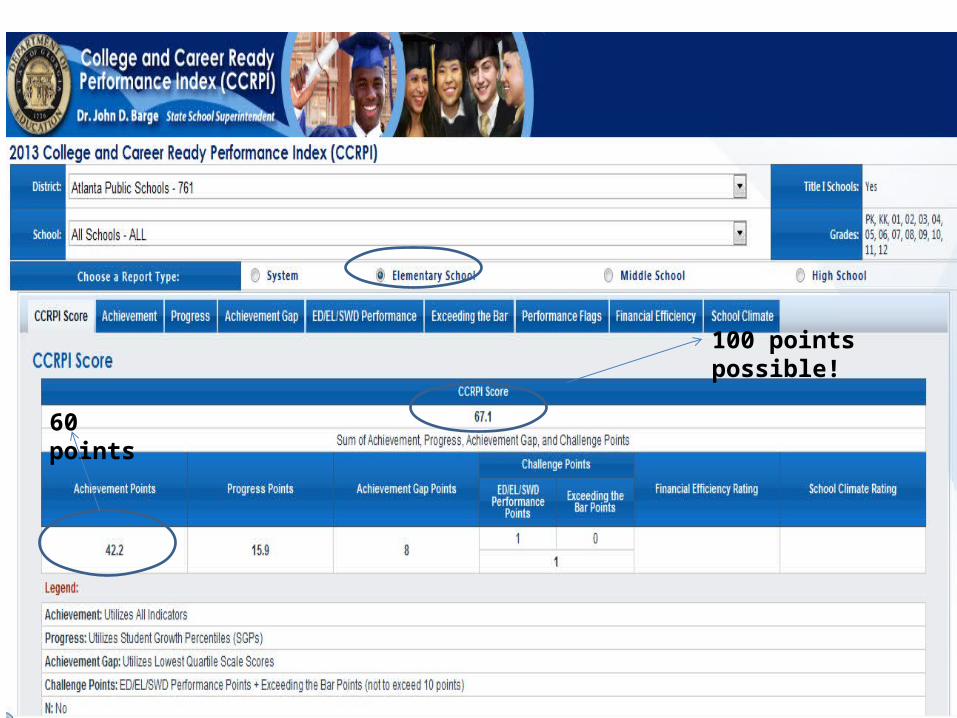
100 points possible!
100 points possible!
60 points

100 points possible!
60 points 25 points

100 points possible!
60 points 25 points 15 points

100 points possible!
60 points 25 points 15 points up to 10 “bonus” points.

100 points possible!
60 points 25 points 15 points up to 10 “bonus” points.
New Areas for 2014 – 1 to 5 Star Rating (Poor to Excellent)


ACHIEVEMENT 60 Points! CONTENT MASTERY (40%)READINESS (30%)GRADUATION (30%)Indicators: 10 Points Each (before weights are calculated)

ACHIEVEMENTElementary and Middle
Georgia CRCT Reading English/ Language Arts MathematicsScienceSocial Studies
CONTENT MASTERY
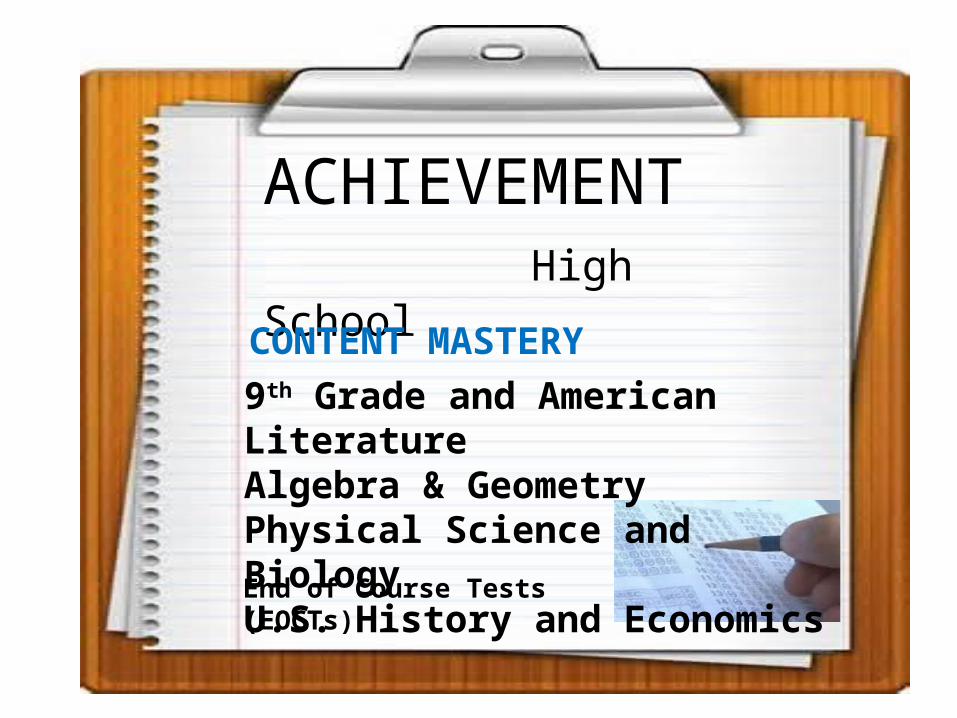
ACHIEVEMENT High School
9th Grade and American LiteratureAlgebra & GeometryPhysical Science and BiologyU.S. History and Economics End of Course Tests (EOCTs)
CONTENT MASTERY
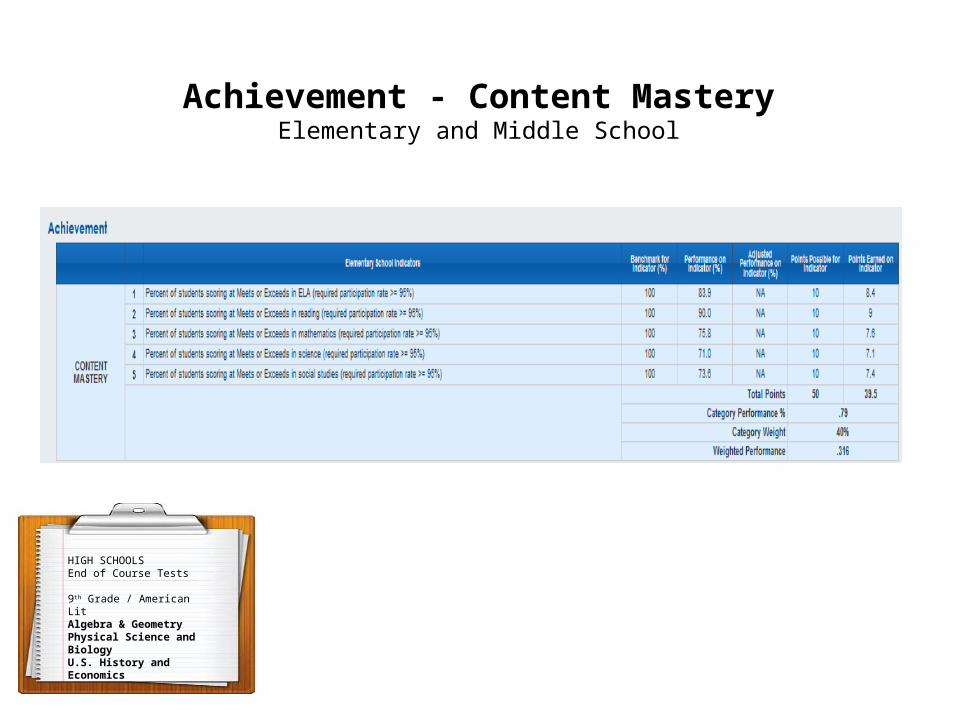
Achievement - Content MasteryElementary and Middle School
HIGH SCHOOLS End of Course Tests
9th Grade / American LitAlgebra & GeometryPhysical Science and BiologyU.S. History and Economics
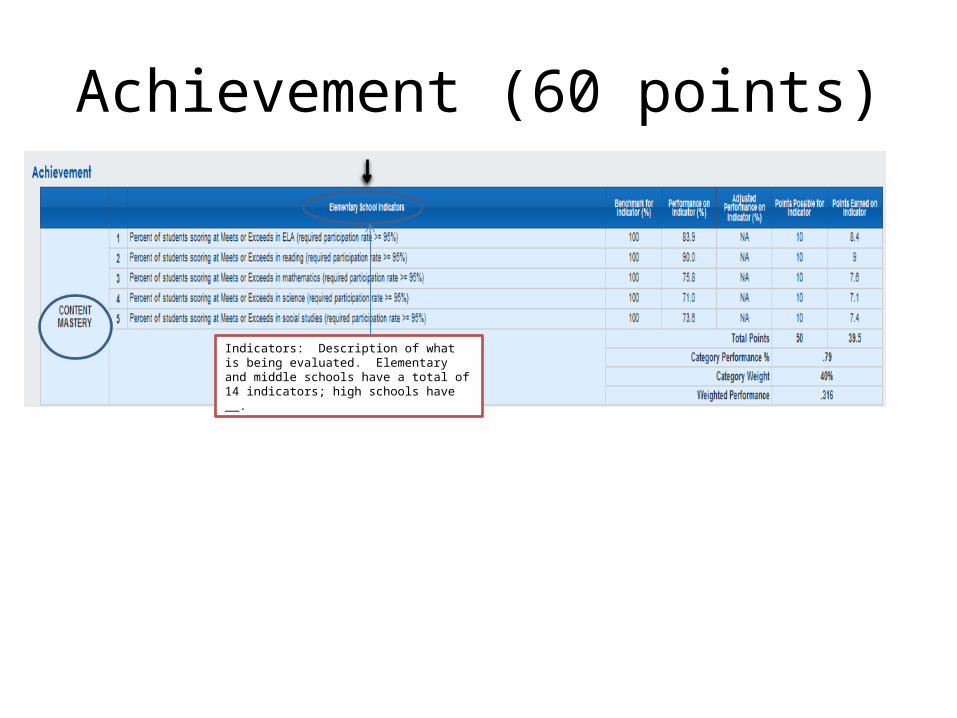
Achievement (60 points)
Indicators: Description of what is being evaluated. Elementary and middle schools have a total of 14 indicators; high schools have __.
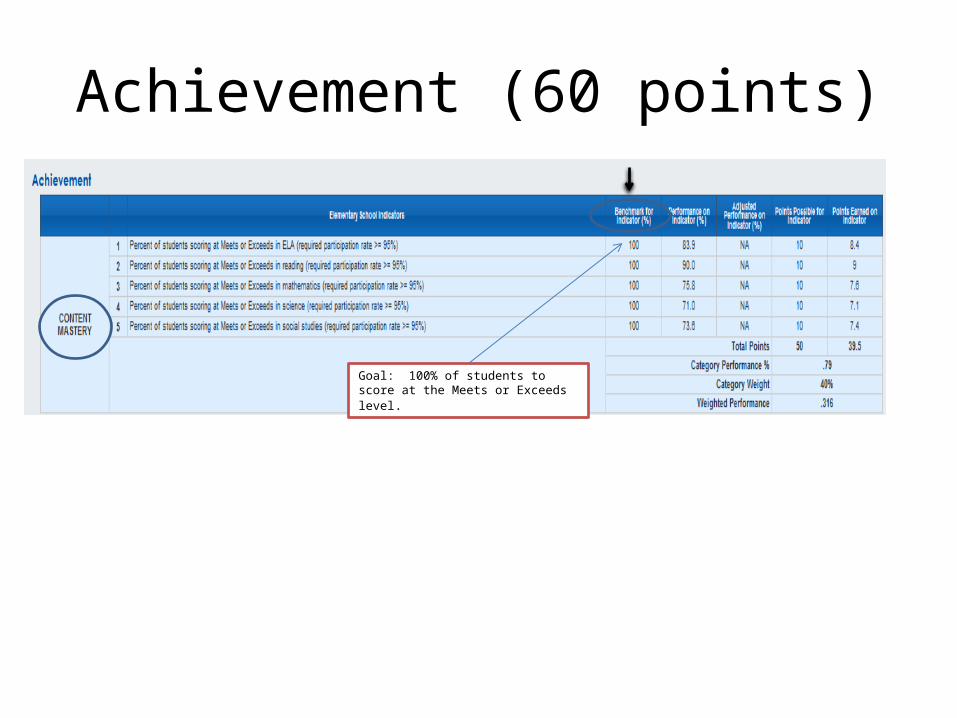
Achievement (60 points)
Goal: 100% of students to score at the Meets or Exceeds level.

Achievement (60 points)
Proficiency: 83.9% of elementary students scored at the Meets or Exceeds level on ELA (English Language Arts).

Achievement (60 points)
Indicators: Valued at 10 points each (before weights are applied).

Achievement (60 points)
Points Earned are Cumulative! Reading Performance - 83.9/10 = 8.4.

Achievement (60 points)
Average Performance (Points Earned/ Points Possible) (39.5/50) = .79.Elementary schools earned 79% of the points possible in this category.

Achievement (60 points)
Average Performance (Points Earned/ Points Possible) (39.5/50) = .79.Elementary schools earned 79% of the points possible in this category.

Achievement (60 points)
This section is actually worth 40% of the entire Achievement component.

Achievement (60 points)
Elementary schools earned 31.6 points for this section. These points contribute to the total CCRPI score.
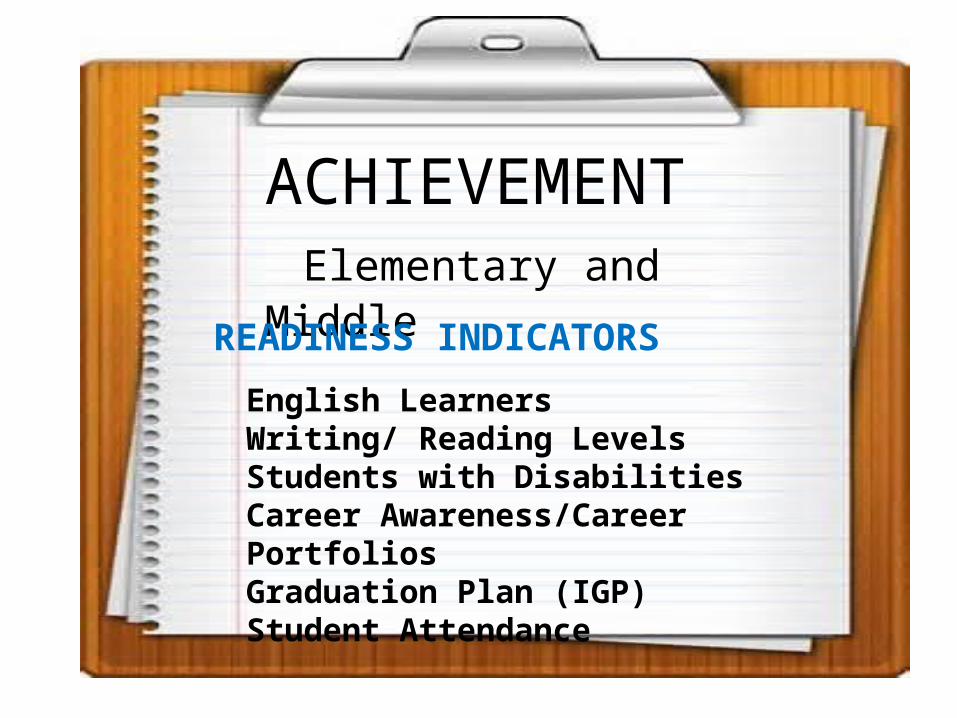
ACHIEVEMENT Elementary and Middle
English LearnersWriting/ Reading LevelsStudents with DisabilitiesCareer Awareness/Career PortfoliosGraduation Plan (IGP)Student Attendance
READINESS INDICATORS

Post Readiness Indicators
Scoring process is the same as before, but some indicators have a benchmark or expectation < 100%. These benchmarks are adjusted …schools earn additional points.
Elementary schools earned 22 points for this section. HIGH SCHOOL READINESS
Pathway Completers Career Ready Credentials College-Ready Credentials Reading/ Writing Levels Student Attendance
OTHER ACHIEVEMENT OUTCOMES

ACHIEVEMENT Elementary and Middle
Passing Core Classes AND CRCTExceeding CRCT Expectations
Graduation Rate Predictor = Grad Rate

Graduation Predictors/ Graduation Rate Equivalent of Graduation Rate, but at the elementary and middle school level
Elementary schools earned 16.8 points for this section.
The contributions of the three sections are added together and multiplied by 60.
Achievement points earned – 42.2 out of 60 possible points.
High School
Graduation Rate
4 Year Graduation Rate5 Year Graduation Rate

Progress = Student Growth!

PROGRESS (25 points)

PROGRESS (25 points)
• Progress is a term used to describe how well students are growing academically relative to similar achieving students across the State of Georgia.
How Progress is Determined:1) Students are placed into peer groups (based on previous test
scores)2) Current test scores for each peer group are ranked from 1 -99
(SGPs). 3) The SGPS are rated as low (1-33), typical (34-65), or high (66 –
99)http://www.youtube.com/watch?v=dyArv7184ZY

Progress Calculations
Step 1: Group Students (Academic Peer Groups)
Rubric is subject to change.
Georgia Student Growth Percentileshttp://www.youtube.com/watch?v=dyArv7184ZY

Georgia Department of Education Dr. John D. Barge, State School Superintendent All Rights Reserved
vs.
High Performing – Low Growth
Low Performing High Growth
Hannah
John
Step 2: Rank student growth from 1 -99 (using SGPs).

Georgia Department of Education Dr. John D. Barge, State School Superintendent All Rights Reserved
vs.
High Performing – Low Growth
Low Performing High Growth
Step 3: Rate SGPs as Low, Typical, or High
Hannah
John
LOW GROWTHHIGH GROWTH (counts)

PROGRESS (25 points)
•
63.7% of students showed growth that was rated by the Georgia Department of Education as Typical or High (credit-worthy).

ACHIEVEMENT GAP (15 points)
GAP SIZE - Distance between statewide and lowest performing students (bottom 25%)

GAP SIZE
Average Student Performance Average Student Performance Lowest 25% (School)
Georgia
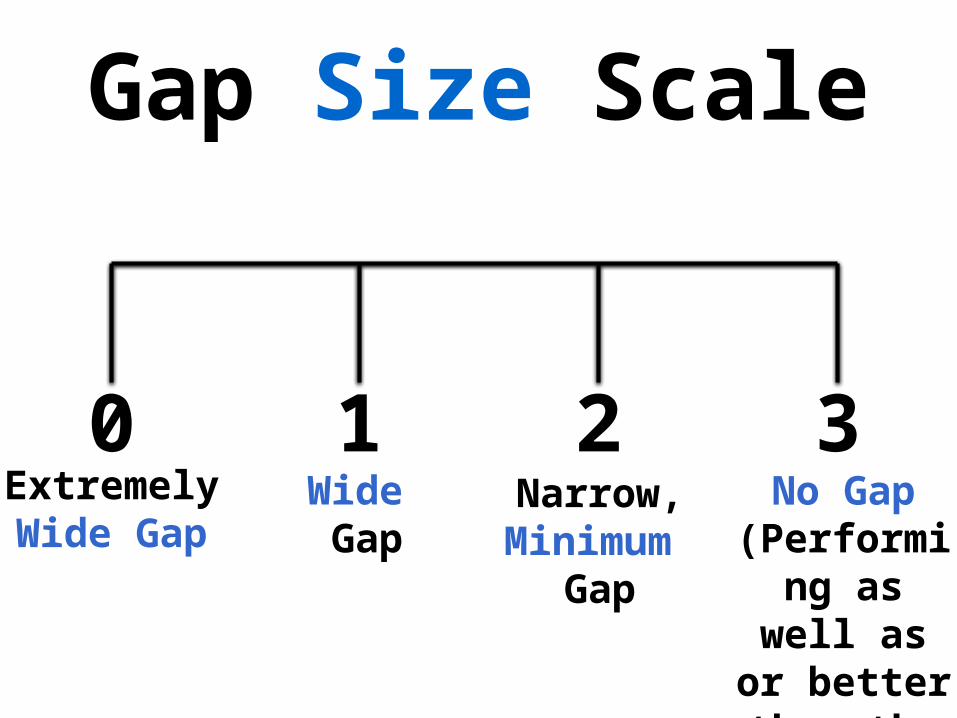
Gap Size Scale
0 1 2 3Extremely Wide Gap
Wide Gap
Narrow, Minimum
Gap
No Gap (Performing as well as or better than the state)

ACHIEVEMENT GAP (15 points)
GAP SIZE - Distance between statewide and lowest performing students (bottom 25%)

GAP CHANGE
2012 vs. 2013

Gap Change Scale
0Essentially no change (the same Gap still
exists or has widened)
Has moved in the right direction towards
Minimizing the Gap
Has really Narrowed the Gap
Has practically Closed the Gap (performing as
well as or above the
State of GA)
1 2 3

CHALLENGE POINTS

CHALLENGE POINTS (up to 10)
Schools Earn Points
Two Areas: High Performance - Exceeding the Bar IndicatorsHigh Performance of Subgroups - Performance Targets

EXCEEDING THE BAR
½ point each

Subgroup Performance
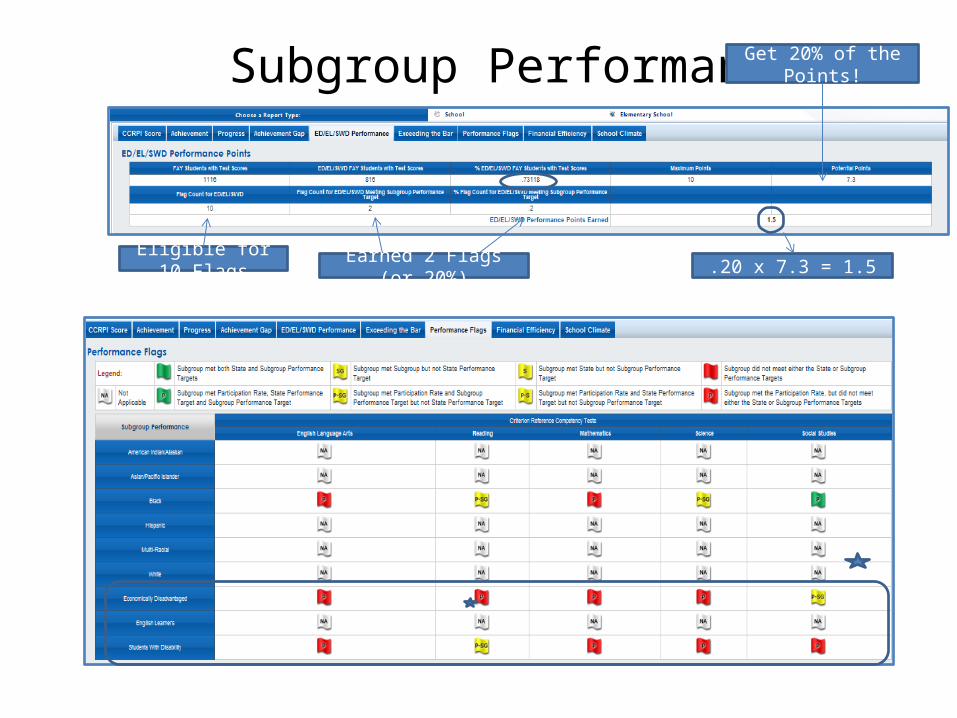
Subgroup Performance
Eligible for 10 Flags Earned 2 Flags (or 20%)
Get 20% of the Points!
.20 x 7.3 = 1.5
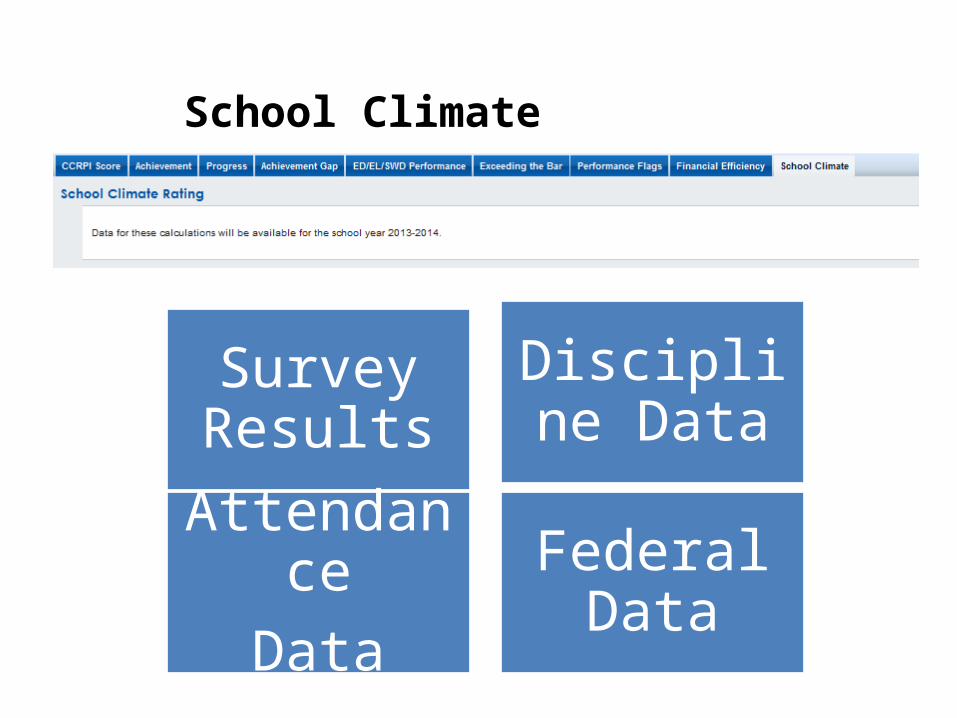
Survey Results
Discipline Data
AttendanceData
Federal Data
School Climate

Contact Dr. Rubye SullivanDirector of Research and [email protected]
Joy F. Johnson, PhDResearch Associate - [email protected]
Larry WattsResearch Associate [email protected]

60% = 60 points ES MS High
Content Mastery = 40% (max of 24 points) 4.8 4.8 3.0
Post Readiness = 30% (max of 18 points) 2.3 3.0 2.25
Graduation / Grad Rate = 30% (max of 18 points) 9.0 9.0 9.0 *
ACHIEVEMENT
Weighted Point Values of Indicators
• HS Indicator – 4-Year Grad Rate = 6 pts 5-year Grad rate = 12 pts