coastal land-use and land-cover change trajectories: are
TRANSCRIPT
sustainability
Article
Coastal Land-Use and Land-Cover Change Trajectories:Are They Sustainable?
Raquel Faria de Deus * and José António Tenedório
�����������������
Citation: Faria de Deus, R.;
Tenedório, J.A. Coastal Land-Use and
Land-Cover Change Trajectories: Are
They Sustainable? Sustainability 2021,
13, 8840. https://doi.org/10.3390/
su13168840
Academic Editor: Hossein Azadi
Received: 30 June 2021
Accepted: 2 August 2021
Published: 7 August 2021
Publisher’s Note: MDPI stays neutral
with regard to jurisdictional claims in
published maps and institutional affil-
iations.
Copyright: © 2021 by the authors.
Licensee MDPI, Basel, Switzerland.
This article is an open access article
distributed under the terms and
conditions of the Creative Commons
Attribution (CC BY) license (https://
creativecommons.org/licenses/by/
4.0/).
Interdisciplinary Centre of Social Sciences (CICS.NOVA), Faculty of Social Sciences and Humanities (NOVAFCSH), Universidade NOVA de Lisboa, Avenida de Berna, 26-C, 1069-061 Lisbon, Portugal;[email protected]* Correspondence: [email protected]
Abstract: In this study, past and current land-use and land-cover (LULC) change trajectories between1947 and 2018 were analysed in terms of sustainability using a unique set of nine detailed, high-precision LULC thematic maps for the municipality of Portimão (Algarve region), Portugal. SeveralGeographic Information System (GIS)-based spatial analysis techniques were used to process LULCdata and assess the spatiotemporal dynamics of LULC change processes. The dynamics of LULCchange were explored by analysing LULC change trajectories. In addition, spatial pattern metricswere introduced to further investigate and quantify the spatial patterns of such LULC changetrajectories. The findings show that Portimão has been experiencing complex LULC changes. Nearly52% of the study area has undergone an LULC change at least once during the 71-year period. Theanalysis of spatial pattern metrics on LULC change trajectories confirmed the emergence of morecomplex, dispersed, and fragmented shapes when patches of land were converted from non-builtcategories into artificial surface categories from 1947 to 2018. The combined analysis of long-termLULC sequences by means of LULC change trajectories and spatial pattern metrics provided useful,actionable, and robust empirical information that can support sustainable spatial planning and smartgrowth, which is much needed since the results of this study have shown that the pattern of LULCchange trajectories in Portimão municipality has been heading towards unsustainability.
Keywords: dynamic systems; long-term change; LULC change typology processes; spatial patternmetrics; urban sustainability; planning
1. Introduction
Changes in LULC have been extensively studied worldwide over recent decades,especially in the fields of urban studies and landscape ecology. Indeed, it has been widelyrecognised that LULC change plays a major role in global change phenomena [1–4]. Urbangrowth by means of LULC change has been similarly put in the spotlight by the Portuguesegovernment and planning agencies as evidenced by the several strategic and policy doc-uments (namely, the Portuguese Legal Framework for Spatial Management Tools). Thisconcern may be due to the fact that LULC change and subsequent urban growth are recog-nised as taking place at an accelerated pace and spatial dimension [5,6], imposed by bothpopulation pressure and tourism demand, particularly in metropolitan and coastal areas,causing adverse effects on the environment, ecosystems and their services.
Simultaneously, advanced geospatial technology and methods (e.g., remote sensing,geographic information systems (GIS), 3D web-GIS, spatial analysis and modelling) to-gether with free high-quality satellite imagery sources (such as Copernicus Sentinel data)or high-resolution orthoimagery that has become cheaper and more accessible enable theanalysis and visualisation of the spatiotemporal dynamic of LULC change [7–9], expandour knowledge of complex urban systems [10,11], reduce uncertainty [12] and improvedata-driven decisions. Hence, such geospatial technology and methods are becoming moreimportant for future committed decision-making [13,14].
Sustainability 2021, 13, 8840. https://doi.org/10.3390/su13168840 https://www.mdpi.com/journal/sustainability
Sustainability 2021, 13, 8840 2 of 24
Additional empirical research has corroborated the use of remote sensing data andspatial pattern metrics in quantifying and interpreting the spatial pattern of urban growthand LULC change [15–20]. Spatial pattern metrics are powerful quantitative indicators thatdescribe and measure the spatial pattern of individual patches, classes, or the entire land-scape, at a certain spatial resolution [7]. Assessing the landscape dynamic, composition,and configuration using spatial pattern metrics highly depends on the accuracy of thematicLULC data [21]. Currently, there is a broad range of spatial pattern metrics (see reviewby [22]). There is a growing interest in exploring quantitatively the connection between spa-tial patterns of urban land change and ecological and environmental processes [23–25], asurban land changes may have significant adverse effects on ecosystems [26]. The protectionof both biodiversity and ecosystem services is a crucial dimension of sustainability. The spa-tial pattern metrics that may be used to produce spatial temporal data on existing landscapeconditions—and thus be considered for sustainability analysis—comprise fragmentation,heterogeneity, diversity, and connectivity [27]. Human-induced landscape changes canmodify the spatial pattern and function of natural landscapes. Generally, they lead tohabitat destruction, degradation, and fragmentation, and as a result to the loss of bothbiodiversity and ecosystem services [28]. Evaluating the spatial pattern and the amountof these specific LULC changes on the landscape via spatial pattern metrics contributestowards sustainable ecosystem planning [27]. Moreover, as spatial pattern metrics canbe linked to landscape function, they have been progressively developed, enhanced, andapplied as indicators of urban sustainability (see overviews on spatial pattern metrics inurban sustainability by [29–31]). Hence, the connection between spatial pattern metrics andattaining urban sustainability has become a major research topic in attempts to plan futureurban areas following sustainable and smart urban design principles (such as compact andgreener cities, mixed land-uses, and proper urban block size) [32].
The analysis of the spatial patterns of LULC change is also recognised as a crucialaspect for research on LULC change and urban growth detection as such spatial patternsoften reveal the underlying historical anthropogenic and natural processes that shape land-scape [33,34]. The analysis of the spatial patterns of LULC change has attracted renewedinterest due to the development of the multitemporal profile method [35,36] that allows usto perform spatial pattern metric analysis based on categorical trajectory analysis [37–40].Such a method is an alternative to the bi-temporal profile method (traditional ‘from-to’post-classification change detection) [41]. When applied to spatial LULC pattern changeanalysis, the latter measures changes in LULC based on ‘two-epoch’ timescale (pair-wiseLULC change comparison). The spatial LULC change patterns are subsequently assessedby comparing spatial pattern metric results between two observation years [38]. How-ever, when analysing long-term LULC change, this method involves time-consuming,demanding work and generally leads to the propagation of errors and inconsistencies [42].Moreover, results from previous studies revealed that the bi-temporal profile method isusually not sufficient to infer landscape processes [40]. Spatial pattern metric analysis onclassified temporal categorical trajectories, on the other hand, has emerged as the mosteffective method for interpreting long-term dynamic and complex LULC conversions [43].The basic assumption of this method is that the evolution of LULC change processes may bebetter interpreted by means of LULC change trajectory patterns that focus on the temporalsequence of LULC categories over more than two time periods, rather than on the basis ofa ‘two-epoch’ timescale [44].
Although previous studies [27,45–48] have been successful in assessing and measuringlarge-scale LULC change and urban growth using a broad LULC categorisation, researchon the production of high-precision long-term LULC datasets, along with detailed LULCcategorisation to measure the dynamic patterns of LULC change, is still quite limited.Therefore, this study proposes an approach grounded on previous work conducted byFaria de Deus [49] and seeks to assess the spatial pattern of LULC change trajectories interms of sustainability on a coastal urban area facing current and future challenges due toincreasing urbanisation, based on a multiple epoch timescale (a time span of about 71 years)
Sustainability 2021, 13, 8840 3 of 24
and spatial pattern metrics. The analysis of long-term LULC change trajectory patternsusing a detailed land classification scheme (including low-density residential land-usecategories) is expected to produce robust and trustworthy results that may be used toimprove and sustain public policies and decisions aiming at guiding the system towards amore sustainable future.
2. Study Area
Portimão is a municipality located in the district of Faro (Algarve), the southernmostregion of mainland Portugal (Figure 1). The Algarve region is a major tourist destinationin Portugal and Europe. The main European countries that have the Algarve as theirvacation destination are the United Kingdom, Germany, Ireland, the Netherlands, France,Spain, Belgium, and Poland [50]. The Algarve’s economic activities are primarily groundedon the tertiary sector, especially on tourism. The tertiary sector accounts for almost 90%of the regional gross value added (GVA) [51]. Tourism demand expressed in number ofovernight stays and guests has decreased in the last year, but it still reached quite highvalues in 2019: the number of guests totalled 5.1 million (almost 19% share of the totaldemand in Portugal) and overnight stays were 20.9 million (almost 30% share of the totaldemand in Portugal). In economic terms, total revenues reached EUR 1225.7 million andthe revenue from accommodation totalled EUR 909.6 million, contributing decisively tothe economic, social, and territorial development of the region [50]. The municipalityof Portimão is one of the fastest-growing municipalities in Portugal: the population ofPortimão grew by 24.5% between 2001 and 2011, far above the national growth rate of0.29% [52], even if this trend has largely slowed down since the global financial crisis. Since2001, the number of buildings has increased to 25.5% in this municipality. This figure isparticularly significant when compared to the Algarve region’s growth of 18.1%, whichwas already significantly high, higher than the national growth of 12.1%. The number ofdwellings and households has also grown considerably over this period: 54.6% and 35%,respectively. Second homes and seasonal residences represent a significant part of housingin Portimão. According to Statistics Portugal, second homes and seasonal residences inPortimão accounted for 50% of the total dwellings in 2011 [52]. The importance of secondhomes and seasonal residences is compounded by the fact that dwelling dynamics havefar outweighed household dynamics in the past two decades [53], which clearly showshow both the territorial and the socioeconomic model of the municipality of Portimão issupported by real estate and tourism. Considering that the municipality of Portimão facescurrent and future challenges due to increasing urbanisation [5], this study area offersan opportunity to analyse the effectiveness of spatial pattern metrics for LULC changetrajectory analysis based on high-precision detailed LULC maps.
Sustainability 2021, 13, 8840 4 of 24Sustainability 2021, 13, x FOR PEER REVIEW 4 of 25
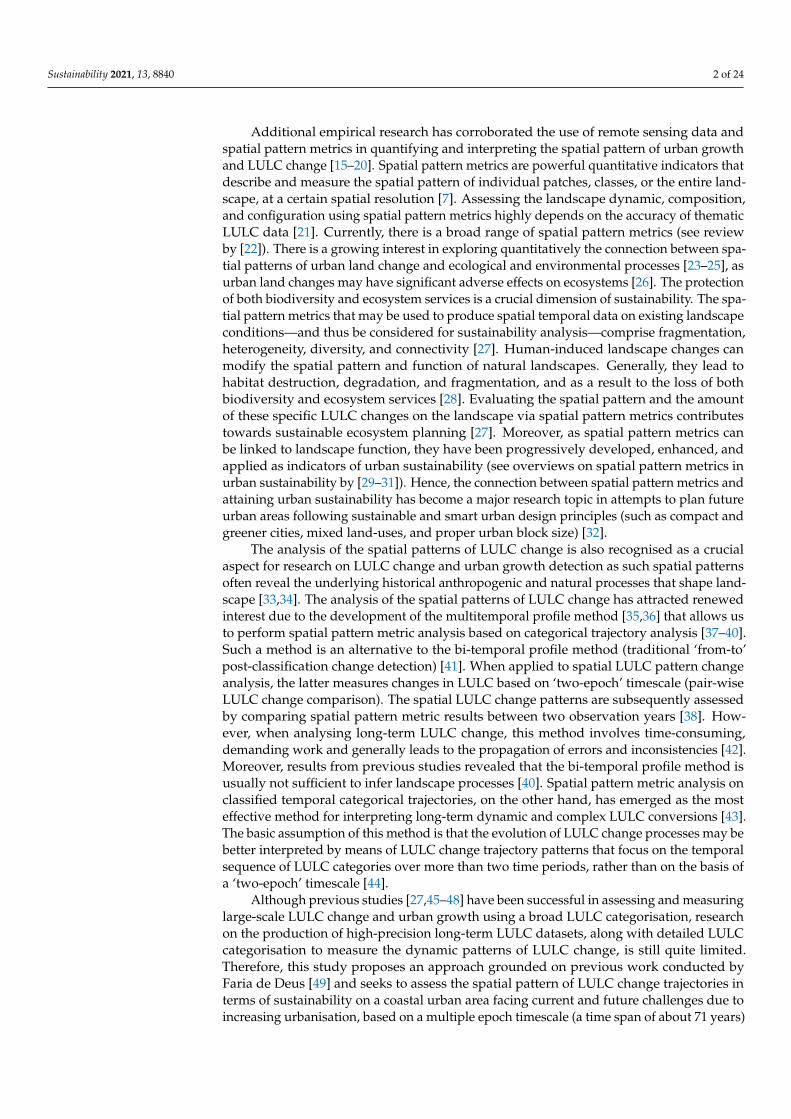
Figure 1. Location of the municipality of Portimão, Algarve region (Portugal). Geographical data source: © EuroGeographics for the administrative boundaries (Original product is available for free at www.eurogeographics.org (accessed on 6 August 2021). Terms of licence available at https://eu-rogeographics.org/maps-for-europe/open-data/topographic-data/ (accessed on 6 August 2021). Dig-ital elevation data are available in [54].
3. Materials and Methods The research methodology included the acquisition and organisation of aerial photo-
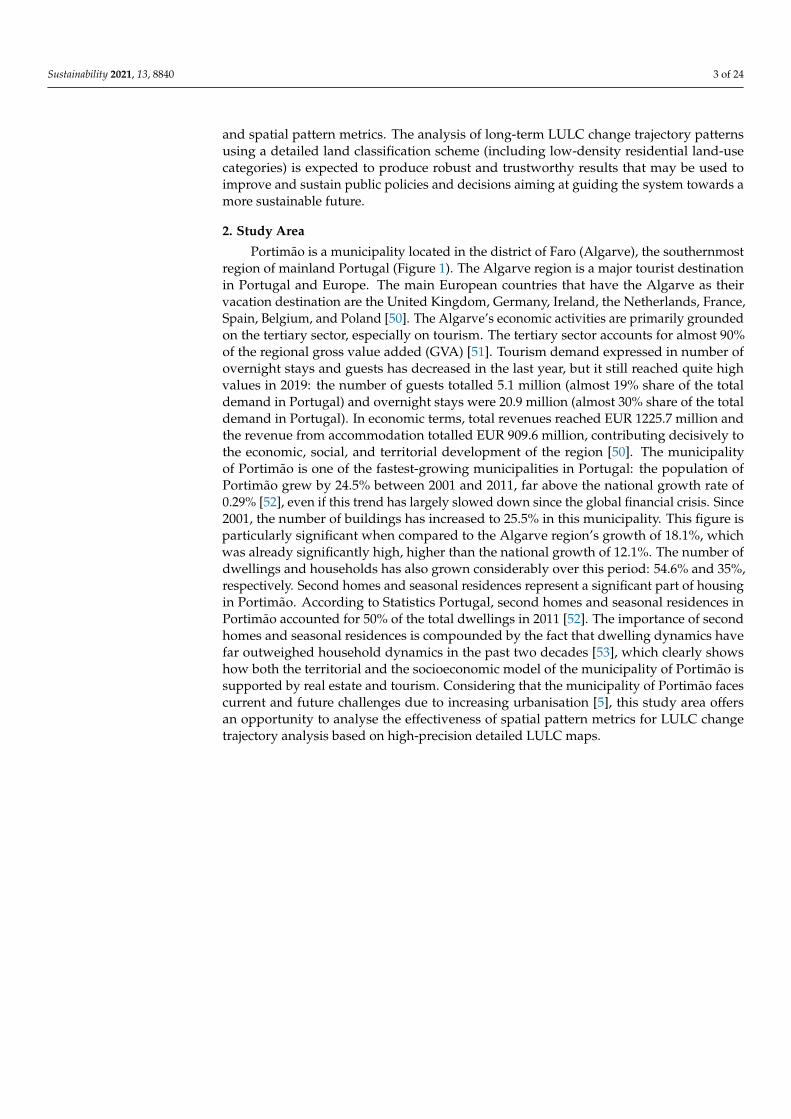
graphs and ortho-rectified digital aerial images for a long period of time (1947–2018), data processing, and analysis of both LULC change and LULC change trajectories (Figure 2). This research methodology is presented in the following four subsections.
Figure 2. Research methodology flowchart.
Figure 1. Location of the municipality of Portimão, Algarve region (Portugal). Geographical datasource: © EuroGeographics for the administrative boundaries (Original product is available forfree at www.eurogeographics.org (accessed on 6 August 2021). Terms of licence available at https://eurogeographics.org/maps-for-europe/open-data/topographic-data/ (accessed on 6 August2021). Digital elevation data are available in [54].
3. Materials and Methods
The research methodology included the acquisition and organisation of aerial pho-tographs and ortho-rectified digital aerial images for a long period of time (1947–2018), dataprocessing, and analysis of both LULC change and LULC change trajectories (Figure 2).This research methodology is presented in the following four subsections.
Sustainability 2021, 13, x FOR PEER REVIEW 4 of 25
Figure 1. Location of the municipality of Portimão, Algarve region (Portugal). Geographical data source: © EuroGeographics for the administrative boundaries (Original product is available for free at www.eurogeographics.org (accessed on 6 August 2021). Terms of licence available at https://eu-rogeographics.org/maps-for-europe/open-data/topographic-data/ (accessed on 6 August 2021). Dig-ital elevation data are available in [54].
3. Materials and Methods The research methodology included the acquisition and organisation of aerial photo-
graphs and ortho-rectified digital aerial images for a long period of time (1947–2018), data processing, and analysis of both LULC change and LULC change trajectories (Figure 2). This research methodology is presented in the following four subsections.
Figure 2. Research methodology flowchart. Figure 2. Research methodology flowchart.
Sustainability 2021, 13, 8840 5 of 24
3.1. Data Description
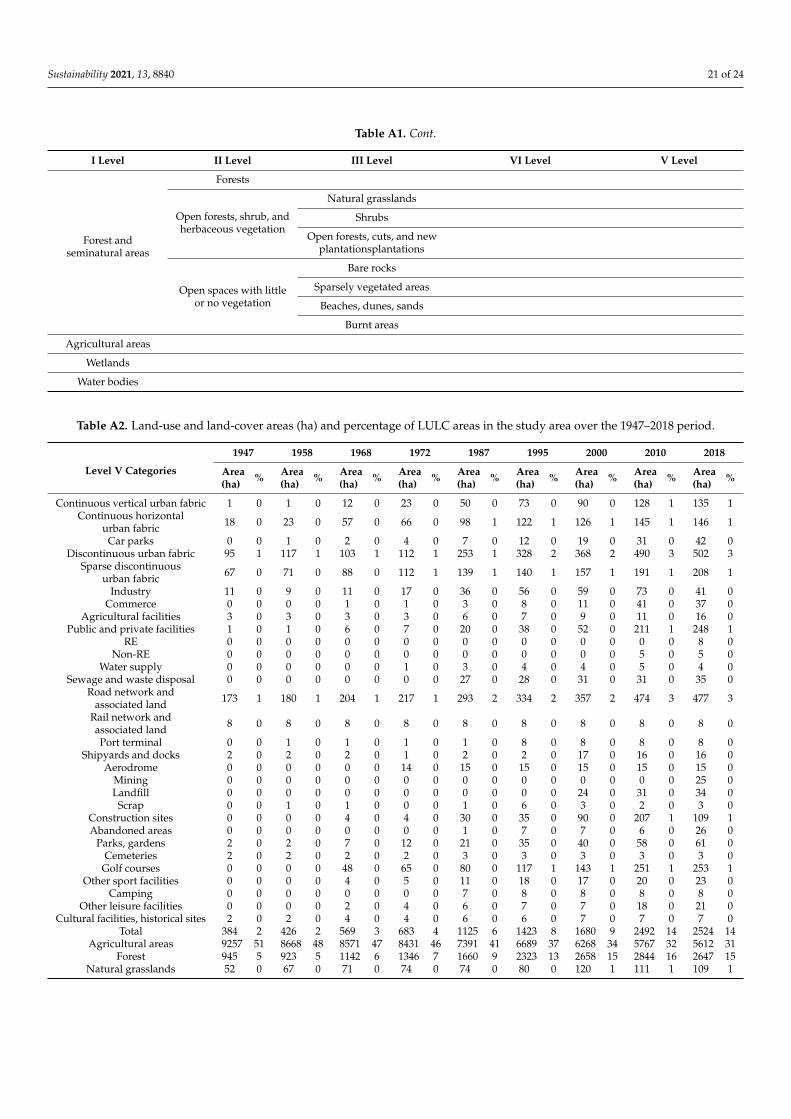
The data on the LULC of this growing municipality were collected from researchcarried out by [49]. A unique set of detailed high-precision LULC thematic maps wereproduced for 1947, 1958, 1968, 1972, 1987, 1995, 2000, 2010, and 2018 to advance ourknowledge of the LULC change that occurred in the municipality of Portimão over thepast 71 years. Though acquiring near-anniversary images would have been desirable, thisproved difficult to achieve. The analysis intervals were determined by the availability ofaerial photographs and ortho-rectified digital aerial images for the study area. Moreover,the choice of these dates stems from the fact that the main LULC changes in the municipalityof Portimão occurred within these periods. The LULC vector maps were derived by visualimage interpretation of historical aerial photographs and ortho-rectified digital aerialimages, and have a scale of 1:10,000, and a minimum mapping unit (MMU) of 1000 m2.Land classification is organised into five levels of thematic detail, with 33 urban land-usecategories at the highest level of detail (Table A1, Appendix A). The thematic accuracyassessment carried out for the 2010 and 2018 LULC maps has produced an overall accuracyof 96.9% and 96.3%, and a Khat statistic (which is an estimate of Kappa) of 96.8% and96.2%, respectively. In this study, no validation procedure was conducted for the remainingLULC maps due to the lack of higher resolution ground-truthing data with time intervalssimilar to those of historical images in Portimão. To overcome this limitation, ancillary datawere used for an adequate visual interpretation of the historical images. A comprehensivepresentation of the methodology used to produce the LULC maps and their specificationsis given in [6].
Population data were supplied by Statistics Portugal for the period 1940–2019. Thedata were obtained from the Portuguese 1940, 1950, 1960, 1970, 1981, 1991, 2001, and 2011Census. The population data from 2019 were obtained from the annual provisional residentpopulation estimates. Since we did not have Census data for the same years as the LULCdata we possessed, the former were only used to get some insight into the populationtrends in the study area.
3.2. Change Analysis
The analysis of the spatial and temporal dynamics of LULC change and urban growthwas carried out based on the nine LULC digital vector maps of the study area. All LULCcategories were analysed and detailed, with a third level for forestland and seminaturalareas and a fifth level for artificial surfaces (see Table A1, Appendix A). LULC areas (ha),LULC area percentages, and LULC area growth rates of the study area over the 1947–2018period were computed. In our study, the LULC area growth rate (LUCAGR) was computedusing the following Formula (1):
LUCAGR =ln(LUCAt2)− ln(LUCAt1)
n× 100% (1)
where LUCAGR is the (continuously compounded) annual growth rate of an LULC areaduring a given period, LUCAt1 and LUCAt2 are the LULC area sizes (ha) in year t1 and yeart2, respectively, n is the elapsed number of years, and ln represents the natural logarithm.
Furthermore, a combined analysis of LULC changes with population trends wasconducted to provide an adequate basis for the understanding of urban sprawl processesover time and space. Population densities and annual population growth rates for themunicipality were computed from population data. Finally, a common GIS-based LULCchange detection technique was used to create a spatiotemporal difference map. Thisprocedure was carried out by overlaying the two consecutive LULC maps over the periodfrom 1947 to 2018 to evaluate the physical expansion of artificial surfaces in Portimão overthe study period. The spatiotemporal LULC change analysis of 41 LULC categories ispresented in this study.
Sustainability 2021, 13, 8840 6 of 24
3.3. Definition of LULC Change Trajectories
This study focuses on the analysis of LULC change trajectories in the study area toprovide an adequate basis for the understanding of the LULC change process over time andspace. Thus, for the definition of LULC change trajectories, LULC categories disaggregatedat the most detailed level for the nine temporal periods were used. The analysis of temporalLULC change trajectories from this perspective allows us to benefit from the rich, highlydetailed temporal information contained in the LULC maps. In this study, the LULC changetrajectory is understood as the sequence of transitions between LULC categories during thenine temporal periods. For example, a trajectory defined as ‘A-A-A-A-SD-SD-SD-SD-SD’denotes that land was cultivated from 1947 to 1972, converted to discontinuous urbanfabric in 1987 and persisted as discontinuous urban fabric until 2018. A categorical LULCchange map containing the LULC trajectories at the object-level (polygon) was derivedusing a vector GIS. Firstly, the two successive LULC maps were overlaid so that changes inLULC were identified, and every object had a category attributed to it for the years 1947,1958, 1968, 1972, 1987, 1995, 2000, 2010, and 2018. Secondly, by means of concatenation,each LULC polygon was computed as a numeric pattern trajectory based on the LULC IDsassociated with it. The concatenation outcomes represent the trajectory of LULC change ona polygon over nine time periods. A total of 5495 LULC change trajectories were identified,and then 24 main LULC change trajectories were retained based on their proportion (ha)in the landscape. Furthermore, each main LULC change trajectory was interpreted for itscategorical nature regarding the theorised processes at work on Portimão’s landscape. Thetheorised processes of LULC change identified in this study are described in Table 1.
Table 1. Description of the theorised processes of LULC change.
Processes Description
Urban expansion Describes changes from agricultural land or shrubland to urbandeveloped land.
Golf course expansion Describes changes from agricultural land to the golf courseland-use category.
Public and private facilitiesexpansion
Describes changes from shrubland or forestland to the public andprivate facility land-use category.
DensificationDescribes specifically the process of change from discontinuousurban fabric land-use categories to the continuous horizontalurban fabric land-use category.
VerticalizationDescribes changes from existing urban land to the vertical urbanfabric land-use category, resulting in the development of high-risebuildings in specific locations of the municipality.
Forest regrowth Describes forest regeneration, generally since 1995, in areaspreviously occupied by shrubland.
Land fallow Describes recent changes from agricultural land to shrubland,which may suggest land left uncultivated after successive crops.
Farmland abandonment Describes the cessation of agricultural activities (Pointereau et al.,2008) on a given location thereafter converted into shrubland.
Deforestation Describes old changes from forestland to non-forest uses.
LULC stability Describes situations where the LULC of a given surface remainedunchanged during the entire study period.
Finally, these LULC trajectories were grouped into four main classes based on theLULC categories involved in each change trajectory, including changes from non-builtto artificial surfaces (1), changes within artificial surfaces (2), changes within non-builtsurfaces (3), and unchanged surfaces (4). The changes from non-built to artificial surfacesbasically refer to the situations of changes from non-built categories and remained as
Sustainability 2021, 13, 8840 7 of 24
artificial surface categories. Changes within the artificial surface class include sequencesthat predominantly involved changes between artificial surface categories in the studyperiod. However, situations where patches of land changed periodically between artificialsurfaces (in the earliest year), non-built surfaces (at least in one intermediate year), andartificial surfaces (in the latest year) were assigned to this class as well. They were thenincluded in ‘Other’ sequences since individually these sequences only represent a minorproportion of the landscape. Changes within the non-built class refer to the sequences thatpredominantly involved changes between non-built categories during the study period.Situations where patches of land changed periodically between non-built surfaces (in theearliest year), artificial surfaces (at least in one intermediate year), and non-built surfaces(in the latest year) were also assigned to this class. They were included in ‘Other’ sequencesfor the same above-mentioned reason. The unchanged class refers to situations wherepatches of land remained in the same LULC category during the nine temporal periods.
3.4. Spatial Pattern Metric Computation Based on a Multitemporal Profile
To better understand both long-term LULC change trajectory patterns related todistinct historical human and natural processes and their effects on sustainability, thespatial arrangement of the patches of LULC change trajectories were interpreted via spatialpattern metrics. In this study, a set of class-level spatial pattern metrics was pre-selectedbased on their intuitiveness [9] and ability to describe landscape change patterns [38,40].These spatial metrics were computed by means of FRAGSTAT 4.2 [55] running at 10 mspatial resolution with an 8-cell patch neighbour for each LULC change trajectory andmain group. To retain uncorrelated spatial metrics, the Pearson correlation coefficientor Pearson’s r was computed. Redundancy among spatial metrics was prevented bychoosing a single spatial metric from strongly correlated pairs, i.e., r > 0.85 or r < −0.85 [56].Additionally, three landscape-level spatial pattern metrics were computed using a circular-moving window (500-m radius) for the geo-visualisation and interpretation of LULCchange trajectories. The description of the selected spatial pattern metrics is shown inTable 2. See [55] for a complete description of spatial pattern metrics and more details onboth the characteristics of each spatial metric and the corresponding equations.
Table 2. Selected spatial metrics for LULC change trajectory pattern analysis (adapted from [55]).
Spatial Metric (Acronym) Description Units Range
Class-Level
Edge Density (ED) ED is defined as the sum of the lengths (m) ofall edge segments in the landscape per hectare. Meters per ha ED ≥ 0, no limit. ED = 0 if there is no
class edge in the landscape.
Largest Patch Index (LPI) LPI quantifies the percentage of totallandscape area comprised by the largest patch. Percent 0 < LPI ≤ 100
Area-weighted mean patch fractaldimension (FRAC_AM)
FRAC_AM is defined as the area weightedmean value of the fractal dimension values of
all similar patch types.None 1 ≤ FRAC_AM ≤ 2
Euclidean mean nearestneighbour distance (ENN_MN)
ENN_MN is the average distance (m) of allpatch types to the nearest neighbouring
similar patch type.Meters
ENN_MN > 0, no limit. ENN_MN→ 0as distance to the nearest
neighbour decreases.
Interspersion and Juxtapositionindex (IJI)
IJI provides the observed interspersion overthe maximum possible interspersion for the
given number of patch types.Percent 0 < IJI ≤ 100
Splitting index (SPLIT)
SPLIT quantifies the total landscape areasquared (m2) divided by the sum of patch area
squared (m2), summed across all patches ofeach patch type.
None1 ≤ SPLIT ≤ number of cells in the
landscape area squared. SPLIT = 1 ifthere is a single patch in the landscape.
normalised Landscape ShapeIndex (nLSI)
nLSI measures the degree of class aggregationor clumpiness. None 0 ≤ nLSI ≤ 1
Sustainability 2021, 13, 8840 8 of 24
Table 2. Cont.
Spatial Metric (Acronym) Description Units Range
Landscape-Level
Aggregation Index (AI)AI quantifies the maximum possible number
of similar adjacencies considering anylandscape composition.
Percent 0 ≤ AI ≤ 100
Landscape Shape Index (LSI)LSH is defined as the ratio between the reallandscape edge and the theoretical lowest
edge length.None LSI ≥ 1, no limit. LSI = 1 if there is a single
square patch in the landscape.
Shannon’s Diversity Index (SHDI) SHDI quantifies relative patch diversity in agiven landscape. Information SHDI ≥ 0, no limit. SHDI = 0 if there is a
single patch in the landscape.
4. Results and Discussion
Using high-level thematic high-precision LULC maps produced from remote sensingimagery for a 71-year period to analyse LULC change provided robust results. Thoseresults allowed us to measure and monitor LULC change in Portimão in a detailed manneras well as to address the effects of both LULC change and LULC change trajectorieson sustainability.
4.1. Change Trend Analysis of Agricultural Areas, Forest and Seminatural Areas, Water Bodies,and Wetlands (1947–2018)
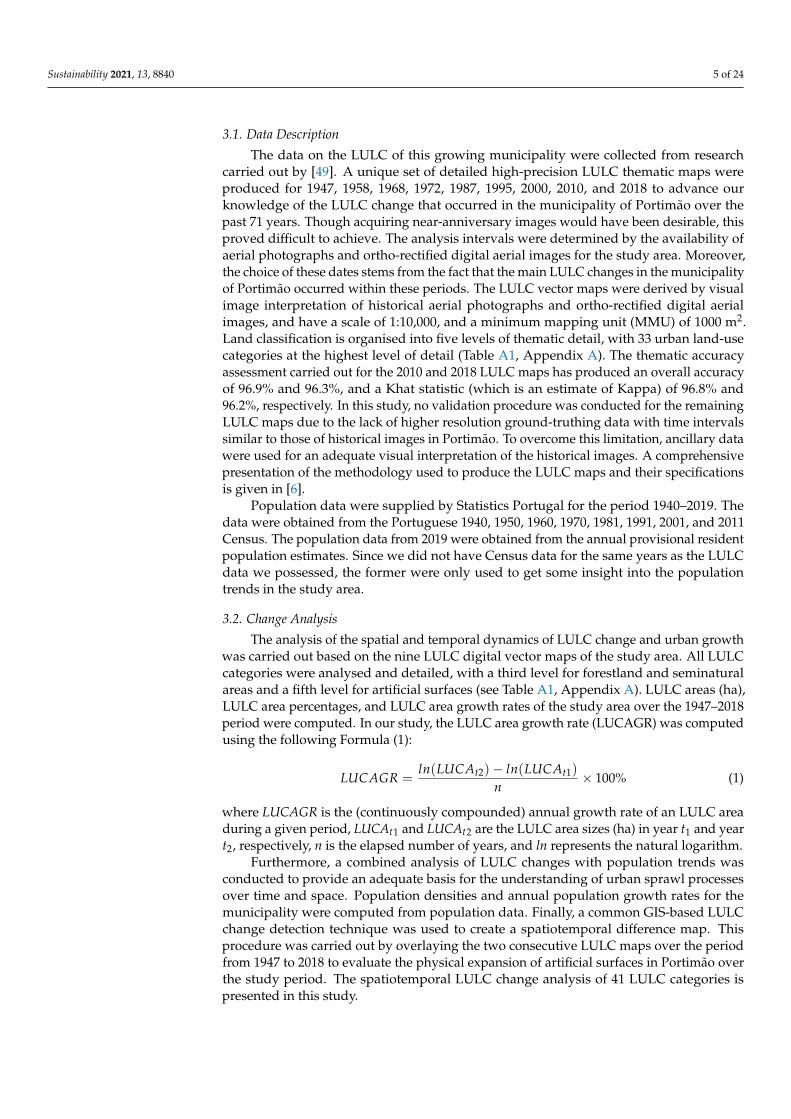
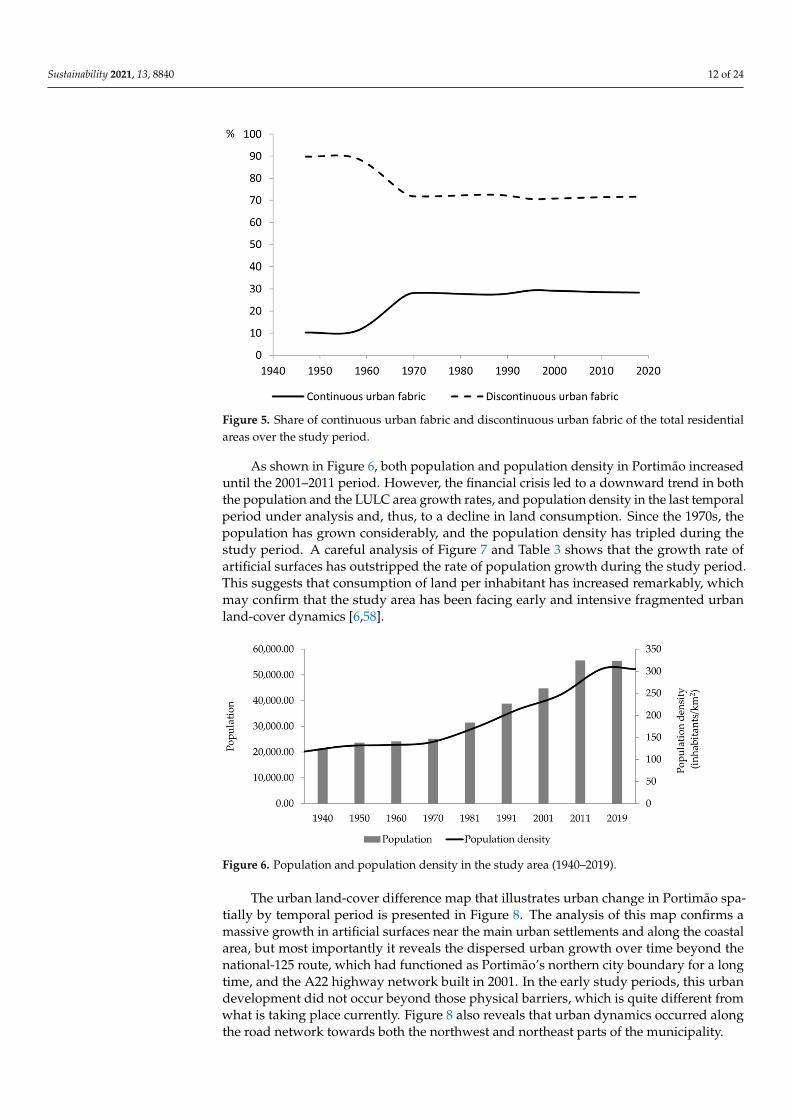
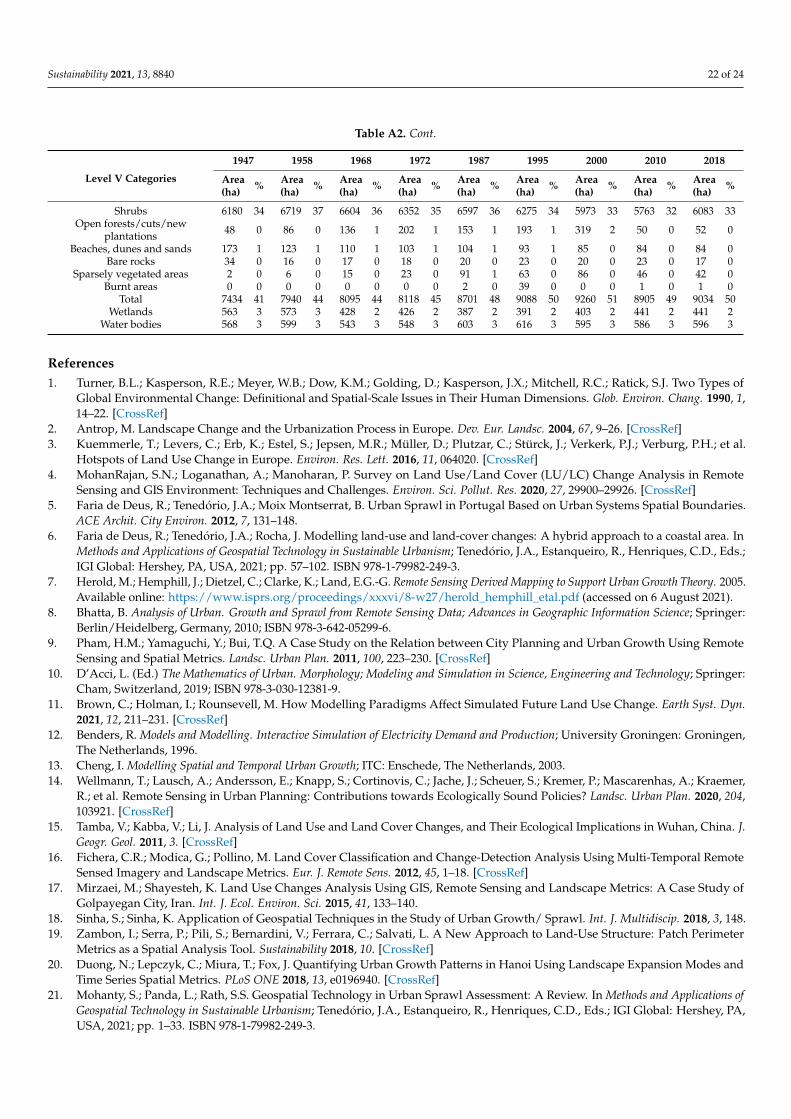
Figure 3 illustrates the nine LULC maps created for the study area, classified at themost generic thematic level. Figure 4 depicts overall land-cover dynamics that occurredthroughout the study period. Annual growth rates of LULC areas by period are listed inTable 3. A complete table with LULC areas (ha) and percentage of LULC areas is providedin Table A2 (Appendix A).
Sustainability 2021, 13, x FOR PEER REVIEW 9 of 25
During the overall time span, forest and seminatural areas were mainly composed of shrubland and forestland (Table A2, Appendix A). Since 1947, the ‘forest’ land-cover cat-egory has nearly tripled, rising from 945 hectares to 2647 in 2018 (from 5% to 15% of the total area of the study area) showing a rapid rhythm of change, particularly for the 1968–1972 and 1987–1995 periods (with annual growth rates of 5.48% and 4.20%, respectively), apart from the 2010–2018 period.
Figure 3. LULC maps of Portimão for (a) 2018, (b) 2010, (c) 2000, (d) 1995, (e) 1987, (f) 1972, (g) 1968, (h) 1958, and (i) 1947, classified according to level I category.
Figure 3. LULC maps of Portimão for (a) 2018, (b) 2010, (c) 2000, (d) 1995, (e) 1987, (f) 1972, (g) 1968,(h) 1958, and (i) 1947, classified according to level I category.
Sustainability 2021, 13, 8840 9 of 24Sustainability 2021, 13, x FOR PEER REVIEW 10 of 25
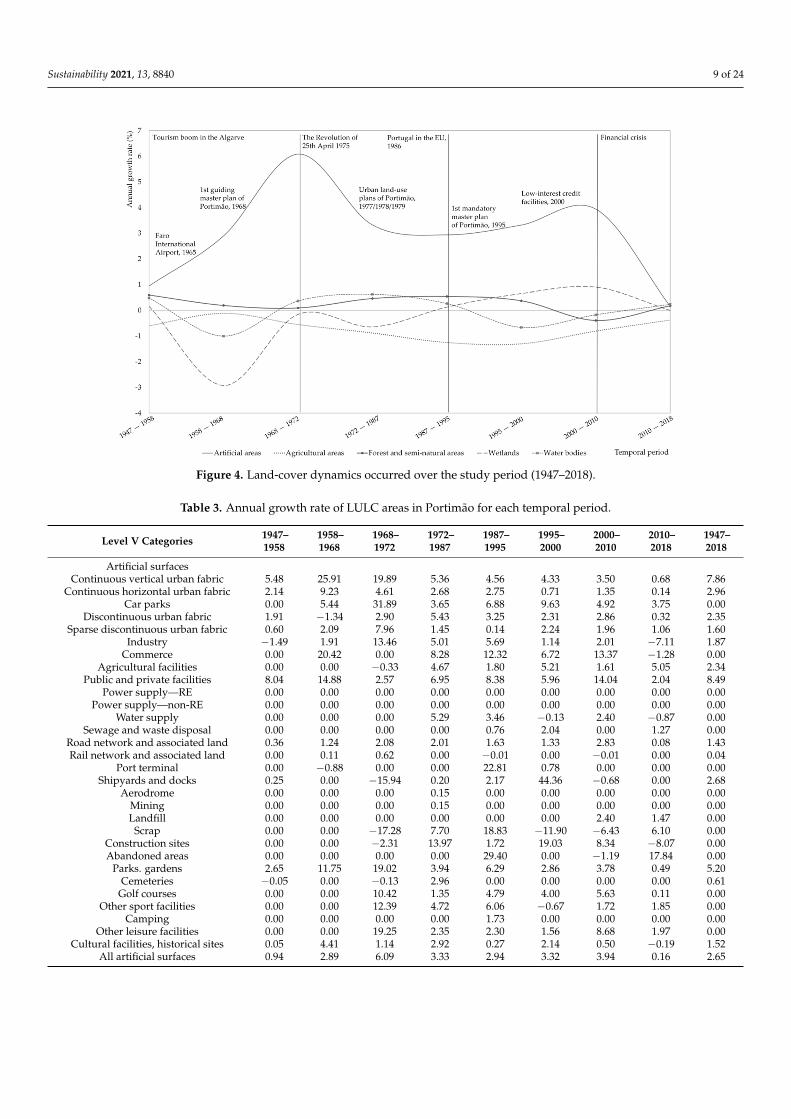
Figure 4. Land-cover dynamics occurred over the study period (1947–2018).
Table 3. Annual growth rate of LULC areas in Portimão for each temporal period.
Level V Categories 1947–1958
1958–1968
1968–1972
1972–1987
1987–1995
1995–2000
2000–2010
2010–2018
1947–2018
Artificial surfaces Continuous vertical urban fabric 5.48 25.91 19.89 5.36 4.56 4.33 3.50 0.68 7.86
Continuous horizontal urban fabric 2.14 9.23 4.61 2.68 2.75 0.71 1.35 0.14 2.96 Car parks 0.00 5.44 31.89 3.65 6.88 9.63 4.92 3.75 0.00
Discontinuous urban fabric 1.91 −1.34 2.90 5.43 3.25 2.31 2.86 0.32 2.35 Sparse discontinuous urban fabric 0.60 2.09 7.96 1.45 0.14 2.24 1.96 1.06 1.60
Industry −1.49 1.91 13.46 5.01 5.69 1.14 2.01 −7.11 1.87 Commerce 0.00 20.42 0.00 8.28 12.32 6.72 13.37 −1.28 0.00
Agricultural facilities 0.00 0.00 −0.33 4.67 1.80 5.21 1.61 5.05 2.34 Public and private facilities 8.04 14.88 2.57 6.95 8.38 5.96 14.04 2.04 8.49
Power supply—RE 0.00 0.00 0.00 0.00 0.00 0.00 0.00 0.00 0.00 Power supply—non-RE 0.00 0.00 0.00 0.00 0.00 0.00 0.00 0.00 0.00
Water supply 0.00 0.00 0.00 5.29 3.46 −0.13 2.40 −0.87 0.00 Sewage and waste disposal 0.00 0.00 0.00 0.00 0.76 2.04 0.00 1.27 0.00
Road network and associated land 0.36 1.24 2.08 2.01 1.63 1.33 2.83 0.08 1.43 Rail network and associated land 0.00 0.11 0.62 0.00 −0.01 0.00 −0.01 0.00 0.04
Port terminal 0.00 −0.88 0.00 0.00 22.81 0.78 0.00 0.00 0.00 Shipyards and docks 0.25 0.00 −15.94 0.20 2.17 44.36 −0.68 0.00 2.68
Aerodrome 0.00 0.00 0.00 0.15 0.00 0.00 0.00 0.00 0.00 Mining 0.00 0.00 0.00 0.15 0.00 0.00 0.00 0.00 0.00 Landfill 0.00 0.00 0.00 0.00 0.00 0.00 2.40 1.47 0.00
Scrap 0.00 0.00 −17.28 7.70 18.83 −11.90 −6.43 6.10 0.00 Construction sites 0.00 0.00 −2.31 13.97 1.72 19.03 8.34 −8.07 0.00 Abandoned areas 0.00 0.00 0.00 0.00 29.40 0.00 −1.19 17.84 0.00
Parks. gardens 2.65 11.75 19.02 3.94 6.29 2.86 3.78 0.49 5.20 Cemeteries −0.05 0.00 −0.13 2.96 0.00 0.00 0.00 0.00 0.61
Golf courses 0.00 0.00 10.42 1.35 4.79 4.00 5.63 0.11 0.00
Figure 4. Land-cover dynamics occurred over the study period (1947–2018).
Table 3. Annual growth rate of LULC areas in Portimão for each temporal period.
Level V Categories 1947–1958
1958–1968
1968–1972
1972–1987
1987–1995
1995–2000
2000–2010
2010–2018
1947–2018
Artificial surfacesContinuous vertical urban fabric 5.48 25.91 19.89 5.36 4.56 4.33 3.50 0.68 7.86
Continuous horizontal urban fabric 2.14 9.23 4.61 2.68 2.75 0.71 1.35 0.14 2.96Car parks 0.00 5.44 31.89 3.65 6.88 9.63 4.92 3.75 0.00
Discontinuous urban fabric 1.91 −1.34 2.90 5.43 3.25 2.31 2.86 0.32 2.35Sparse discontinuous urban fabric 0.60 2.09 7.96 1.45 0.14 2.24 1.96 1.06 1.60
Industry −1.49 1.91 13.46 5.01 5.69 1.14 2.01 −7.11 1.87Commerce 0.00 20.42 0.00 8.28 12.32 6.72 13.37 −1.28 0.00
Agricultural facilities 0.00 0.00 −0.33 4.67 1.80 5.21 1.61 5.05 2.34Public and private facilities 8.04 14.88 2.57 6.95 8.38 5.96 14.04 2.04 8.49
Power supply—RE 0.00 0.00 0.00 0.00 0.00 0.00 0.00 0.00 0.00Power supply—non-RE 0.00 0.00 0.00 0.00 0.00 0.00 0.00 0.00 0.00
Water supply 0.00 0.00 0.00 5.29 3.46 −0.13 2.40 −0.87 0.00Sewage and waste disposal 0.00 0.00 0.00 0.00 0.76 2.04 0.00 1.27 0.00
Road network and associated land 0.36 1.24 2.08 2.01 1.63 1.33 2.83 0.08 1.43Rail network and associated land 0.00 0.11 0.62 0.00 −0.01 0.00 −0.01 0.00 0.04
Port terminal 0.00 −0.88 0.00 0.00 22.81 0.78 0.00 0.00 0.00Shipyards and docks 0.25 0.00 −15.94 0.20 2.17 44.36 −0.68 0.00 2.68
Aerodrome 0.00 0.00 0.00 0.15 0.00 0.00 0.00 0.00 0.00Mining 0.00 0.00 0.00 0.15 0.00 0.00 0.00 0.00 0.00Landfill 0.00 0.00 0.00 0.00 0.00 0.00 2.40 1.47 0.00
Scrap 0.00 0.00 −17.28 7.70 18.83 −11.90 −6.43 6.10 0.00Construction sites 0.00 0.00 −2.31 13.97 1.72 19.03 8.34 −8.07 0.00Abandoned areas 0.00 0.00 0.00 0.00 29.40 0.00 −1.19 17.84 0.00
Parks. gardens 2.65 11.75 19.02 3.94 6.29 2.86 3.78 0.49 5.20Cemeteries −0.05 0.00 −0.13 2.96 0.00 0.00 0.00 0.00 0.61
Golf courses 0.00 0.00 10.42 1.35 4.79 4.00 5.63 0.11 0.00Other sport facilities 0.00 0.00 12.39 4.72 6.06 −0.67 1.72 1.85 0.00
Camping 0.00 0.00 0.00 0.00 1.73 0.00 0.00 0.00 0.00Other leisure facilities 0.00 0.00 19.25 2.35 2.30 1.56 8.68 1.97 0.00
Cultural facilities, historical sites 0.05 4.41 1.14 2.92 0.27 2.14 0.50 −0.19 1.52All artificial surfaces 0.94 2.89 6.09 3.33 2.94 3.32 3.94 0.16 2.65
Sustainability 2021, 13, 8840 10 of 24
Table 3. Cont.
Level V Categories 1947–1958
1958–1968
1968–1972
1972–1987
1987–1995
1995–2000
2000–2010
2010–2018
1947–2018
Agricultural areas −0.60 −0.11 −0.55 −0.88 −1.25 −1.30 −0.81 −0.34 −0.70
Forest and seminatural areasForest −0.22 2.13 5.48 1.40 4.20 2.70 0.67 −0.90 1.45
Natural grasslands 2.18 0.65 1.23 0.00 1.00 8.10 −0.79 −0.27 1.02Shrubs 0.76 −0.17 −1.29 0.25 −0.63 −0.99 −0.36 0.67 −0.02
Open forests, cuts, and new plantations 5.31 4.62 13.06 −1.85 2.93 9.98 −18.55 0.44 0.10Beaches, dunes and sands −3.07 −1.12 −2.23 0.05 −1.46 −1.82 −0.12 0.01 −1.02
Bare rocks −6.50 0.43 2.19 0.65 1.53 −2.57 1.31 −3.61 −0.95Sparsely vegetated areas 12.28 9.20 14.18 9.25 −4.71 6.24 −6.28 −0.97 4.67
Burnt areas 0.00 0.00 0.00 0.00 40.36 0.00 0.00 0.00 0.00All forest and seminatural areas 0.60 0.19 0.09 0.46 0.54 0.37 −0.39 0.16 0.27
Wetlands 0.16 −2.92 −0.16 −0.64 0.13 0.66 0.90 0.00 −0.34
Water bodies 0.48 −1.00 0.37 0.63 0.27 −0.66 −0.17 0.22 0.07
As Figures 3 and 4 show, the land-cover dynamic revealed by the annual growth ratesof LULC area is very similar at the beginning and at the end of the study period. However,between those two specific time periods, there is a significant divergence in the behaviourof artificial surfaces regarding the other land-cover categories. In the late 1940s, Portimãowas composed basically of both agricultural land (nearly 51%) and forest/seminaturalland (nearly 41%). Although there was a clear dominance of these land categories overthe study period, Table 3 and Figure 4 also reveal that agricultural and forest/seminaturalland exhibited different change trends. Agricultural areas decreased at moderate negativegrowth rates—especially in the periods of 1987–1995 and 1995–2000 (with annual growthrates of −1.25% and −1.30%, respectively)—although the rhythm of change slowed downat the end of the study period (Table 3). Conversely, forest and seminatural land increasedduring the eight decades analysed (Figure 4), except for the 2000–2010 period, and showedrelatively low growth rates (ranging from 0.09% to 0.60%). This demonstrates that theseveral national financial-incentive programmes to encourage forestry that have beenimplemented mainly since the mid-20th century and recent local land-use policies that aimfor nature and forest areas protection have played an important role on the trends of forestland-cover change.
During the overall time span, forest and seminatural areas were mainly composedof shrubland and forestland (Table A2, Appendix A). Since 1947, the ‘forest’ land-covercategory has nearly tripled, rising from 945 hectares to 2647 in 2018 (from 5% to 15%of the total area of the study area) showing a rapid rhythm of change, particularly forthe 1968–1972 and 1987–1995 periods (with annual growth rates of 5.48% and 4.20%,respectively), apart from the 2010–2018 period.
Conversely, shrubland showed a shrinking trend towards the end of the study period.The fact that forestland and seminatural areas have mainly been comprised of shrubland,along with this shrinking trend over the time span, may point towards a critical hiddenLULC change process. That is, the natural and rural land-cover change to transitionalland-cover categories, such as shrublands. After being left uncultivated for a long periodof time, shrubland often becomes a highly desirable area for urban development, whichcan lead to a permanent change into urban land cover [57] (p. 13).
Water bodies have always played important roles on both the natural environmentand the socioeconomic activity of the municipality. In 1947, the total area of wetland andwater bodies was 563 hectares and 569 hectares, respectively, whereas in 2018, the totalwetland area dropped to 444 and the total area of water bodies increased to 596. Thus,wetland decreased by 22% during the 1947–2018 period. This changing trend of wetland(Figure 4), mainly attributable to human-induced activities (such as urban encroachment),has been triggering flooding problems and their consequences.
Sustainability 2021, 13, 8840 11 of 24
4.2. Analysis of Waves of Urbanisation, Urban Growth, and Population Trends (1947–2018)
From the analysis of Figure 4, two main waves of urbanisation and urban growth areidentified. The first phase of urbanisation occurred in the late 1960s, reflecting the tourismboom in the Algarve, which was triggered by the favourable economic situation in Europe,with the consequent increase in accommodation capacity and the construction of FaroInternational Airport (1965). The spurt in the increase of artificial surfaces that occurredin this first phase was also prompted by the population growth and economic activityexpansion since the independence movements in Portugal’s African colonies in 1975.Although the rhythm of change has decreased after that period, urban growth continuedat high annual growth rates between 1972 and 2000. The second phase of urbanisationtook place in the 2000s and is represented by the fast urban growth supported by low-interest credit facilities, mainly along the coast and the construction of public and sportinfrastructures (e.g., road network, the Algarve International Circuit) towards the northof the study area. Due to the socioeconomic and political development of Portugal andthe Algarve region, Portimão has a complex spatial organisation and its artificial surfaceshave increased greatly during the overall time span and are changing very quickly. In 1947,the total area of artificial surfaces was 384 hectares, while in 2018, the total area of thatsame land category had risen to 2524 hectares, so that artificial surfaces increased by 557%between 1947 and 2018. Moreover, the decreasing trend in agricultural areas, vegetationcover, and wetlands reveals the unbalanced spatiotemporal pattern of land-cover changein Portimão and, therefore, indicates that the study area has been moving towards anunsustainable path.
The increase in artificial areas was mostly due to the growth of residential areasincluding the four urban fabric categories (see Table A1, Appendix A) (remarkably in thefirst three temporal periods), public and private facilities, road network and associatedland, and golf courses (Table 3). Table 3 also shows that higher annual growth rates duringthe study period were more frequent in artificial surface categories. During the first threeperiods, the annual growth rate of residential areas noticeably surpassed the developmentof commerce, the transport network, and industry. However, this trend has shifted sincethe 1972–1987 period. In the last four periods, the growth rhythm of residential areasweakened slightly and was outpaced by the development of commerce, the transportnetwork, and industry. This may indicate that the municipality has shifted to an industrialand service-oriented economy towards the end of the study period. Parks and gardens,car parks, other sport facilities, construction sites, and other leisure facilities have grownconsiderably in the 1958–1968 and 1968–1972 periods and have expanded regularly sincethen (Table 3).
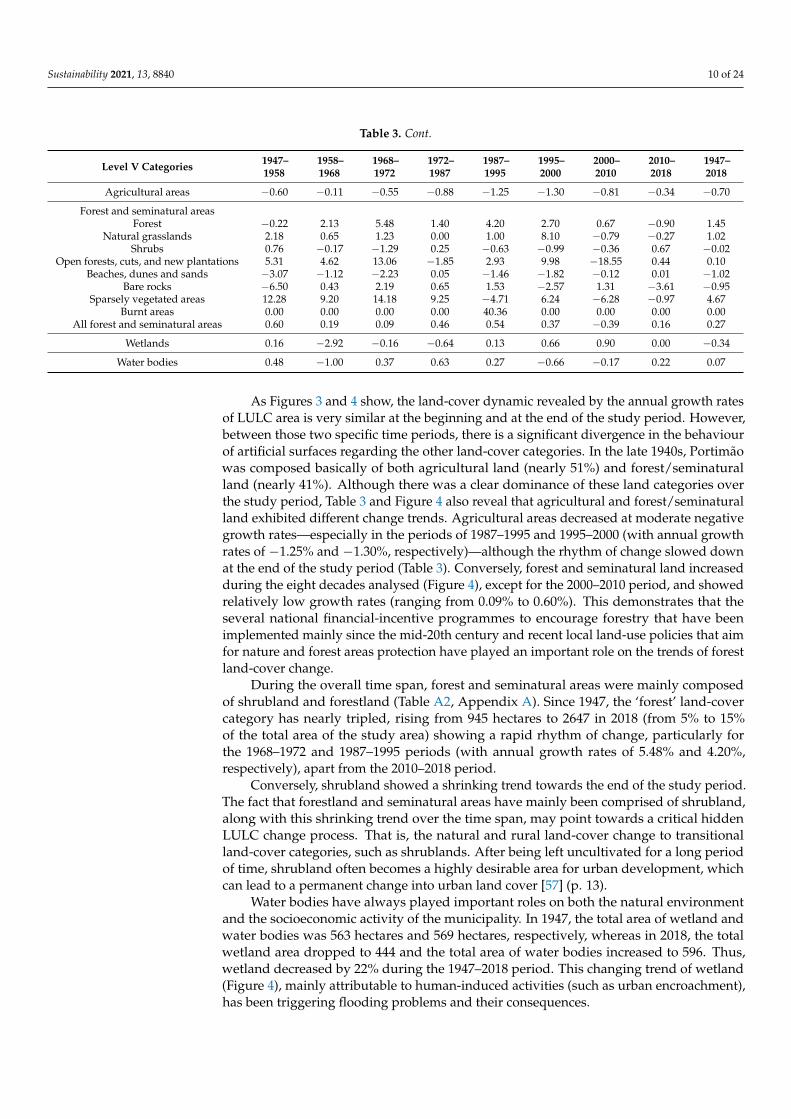
We can see from Figure 5 and Table A2 (Appendix A) that discontinuous urban fabricwas dominant over the 71-year study period. Between the late 1940s and 2018, on average,76% of all new residential areas were discontinuous. The dynamic of residential areasduring the study period reveals two key characteristics of these areas. On the one hand,it shows a trend towards the growth of less intensive residential areas, and on the otherhand, the rapid growth rhythm of discontinuous urban fabric is a clear evidence of urbansprawl. This observation can be supported by analysing and combining population datawith the previously explored land-use data.
Sustainability 2021, 13, 8840 12 of 24
Sustainability 2021, 13, x FOR PEER REVIEW 12 of 25
557% between 1947 and 2018. Moreover, the decreasing trend in agricultural areas, vege-tation cover, and wetlands reveals the unbalanced spatiotemporal pattern of land-cover change in Portimão and, therefore, indicates that the study area has been moving towards an unsustainable path.
The increase in artificial areas was mostly due to the growth of residential areas in-cluding the four urban fabric categories (see Table A1, Appendix A) (remarkably in the first three temporal periods), public and private facilities, road network and associated land, and golf courses (Table 3). Table 3 also shows that higher annual growth rates during the study period were more frequent in artificial surface categories. During the first three periods, the annual growth rate of residential areas noticeably surpassed the development of commerce, the transport network, and industry. However, this trend has shifted since the 1972–1987 period. In the last four periods, the growth rhythm of residential areas weakened slightly and was outpaced by the development of commerce, the transport net-work, and industry. This may indicate that the municipality has shifted to an industrial and service-oriented economy towards the end of the study period. Parks and gardens, car parks, other sport facilities, construction sites, and other leisure facilities have grown considerably in the 1958–1968 and 1968–1972 periods and have expanded regularly since then (Table 3).
We can see from Figure 5 and Table A2 (Appendix A) that discontinuous urban fabric was dominant over the 71-year study period. Between the late 1940s and 2018, on average, 76% of all new residential areas were discontinuous. The dynamic of residential areas during the study period reveals two key characteristics of these areas. On the one hand, it shows a trend towards the growth of less intensive residential areas, and on the other hand, the rapid growth rhythm of discontinuous urban fabric is a clear evidence of urban sprawl. This observation can be supported by analysing and combining population data with the previously explored land-use data.
Figure 5. Share of continuous urban fabric and discontinuous urban fabric of the total residential areas over the study period.
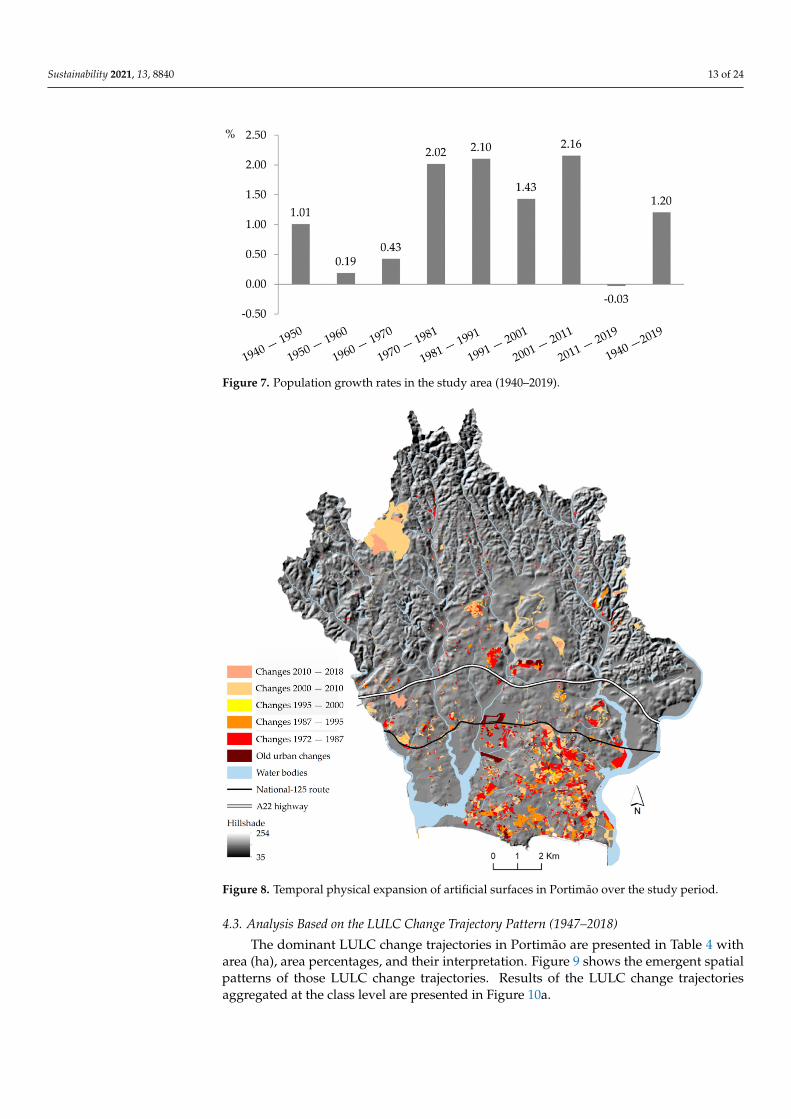
As shown in Figure 6, both population and population density in Portimão increased until the 2001–2011 period. However, the financial crisis led to a downward trend in both the population and the LULC area growth rates, and population density in the last tem-poral period under analysis and, thus, to a decline in land consumption. Since the 1970s, the population has grown considerably, and the population density has tripled during the study period. A careful analysis of Figure 7 and Table 3 shows that the growth rate of
Figure 5. Share of continuous urban fabric and discontinuous urban fabric of the total residentialareas over the study period.
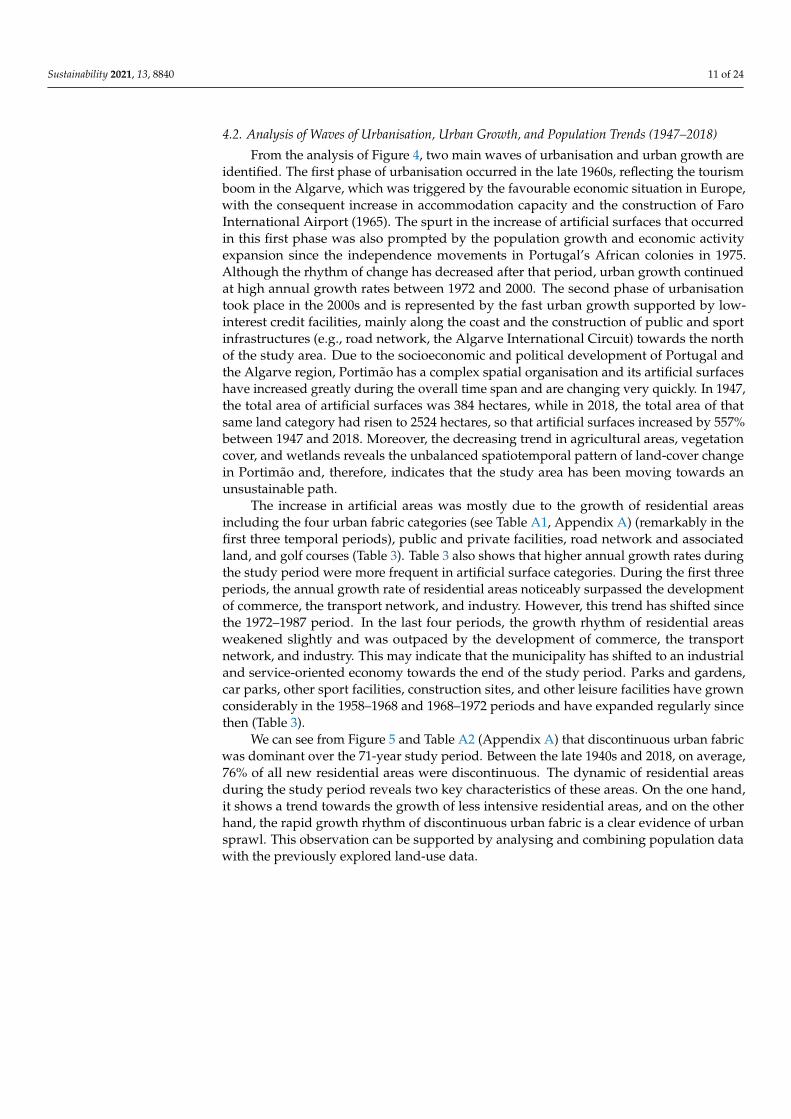
As shown in Figure 6, both population and population density in Portimão increaseduntil the 2001–2011 period. However, the financial crisis led to a downward trend in boththe population and the LULC area growth rates, and population density in the last temporalperiod under analysis and, thus, to a decline in land consumption. Since the 1970s, thepopulation has grown considerably, and the population density has tripled during thestudy period. A careful analysis of Figure 7 and Table 3 shows that the growth rate ofartificial surfaces has outstripped the rate of population growth during the study period.This suggests that consumption of land per inhabitant has increased remarkably, whichmay confirm that the study area has been facing early and intensive fragmented urbanland-cover dynamics [6,58].
Sustainability 2021, 13, x FOR PEER REVIEW 13 of 25
artificial surfaces has outstripped the rate of population growth during the study period. This suggests that consumption of land per inhabitant has increased remarkably, which may confirm that the study area has been facing early and intensive fragmented urban land-cover dynamics [6,58].
Figure 6. Population and population density in the study area (1940–2019).
Figure 7. Population growth rates in the study area (1940–2019).
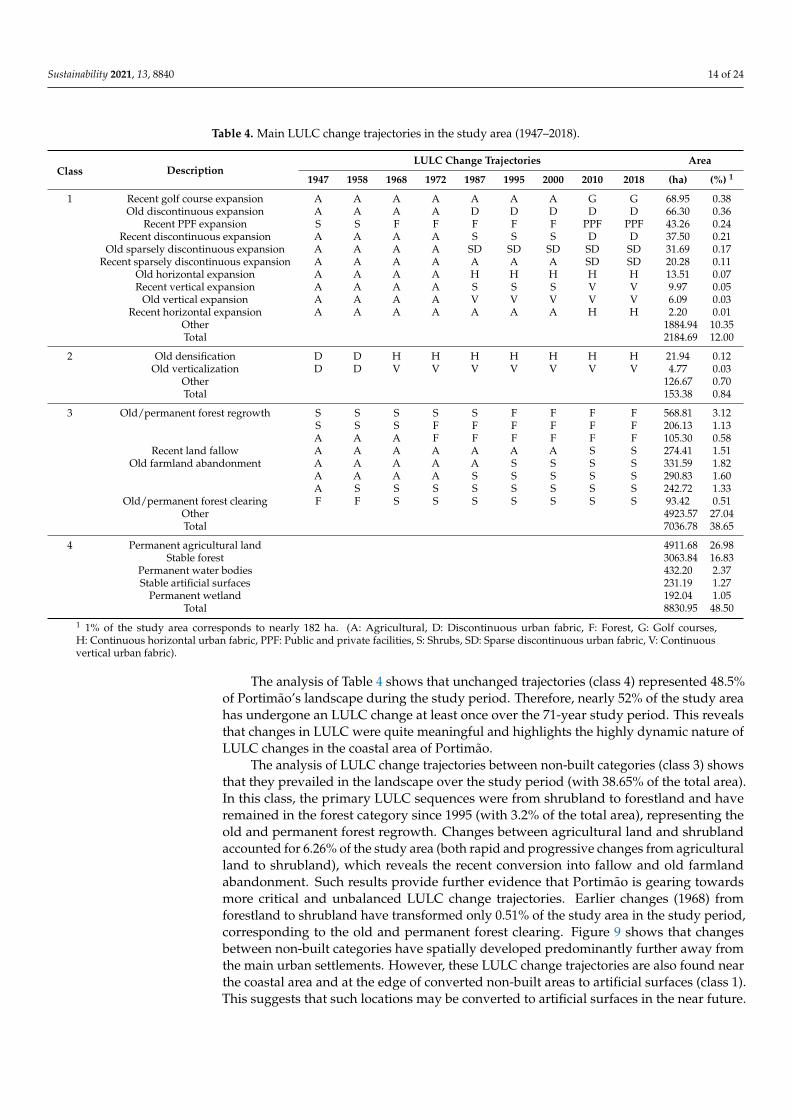
The urban land-cover difference map that illustrates urban change in Portimão spa-tially by temporal period is presented in Figure 8. The analysis of this map confirms a massive growth in artificial surfaces near the main urban settlements and along the coastal area, but most importantly it reveals the dispersed urban growth over time beyond the national-125 route, which had functioned as Portimão’s northern city boundary for a long time, and the A22 highway network built in 2001. In the early study periods, this urban development did not occur beyond those physical barriers, which is quite different from what is taking place currently. Figure 8 also reveals that urban dynamics occurred along the road network towards both the northwest and northeast parts of the municipality.
Figure 6. Population and population density in the study area (1940–2019).
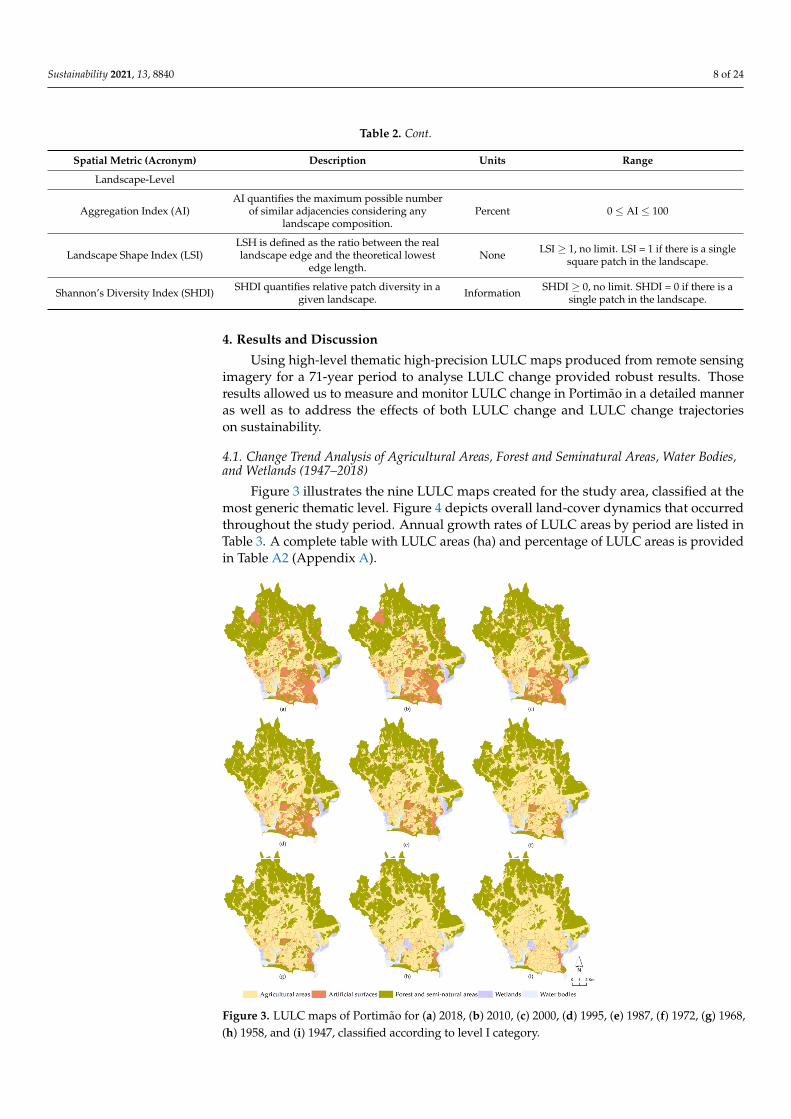
The urban land-cover difference map that illustrates urban change in Portimão spa-tially by temporal period is presented in Figure 8. The analysis of this map confirms amassive growth in artificial surfaces near the main urban settlements and along the coastalarea, but most importantly it reveals the dispersed urban growth over time beyond thenational-125 route, which had functioned as Portimão’s northern city boundary for a longtime, and the A22 highway network built in 2001. In the early study periods, this urbandevelopment did not occur beyond those physical barriers, which is quite different fromwhat is taking place currently. Figure 8 also reveals that urban dynamics occurred alongthe road network towards both the northwest and northeast parts of the municipality.
Sustainability 2021, 13, 8840 13 of 24
Sustainability 2021, 13, x FOR PEER REVIEW 13 of 25
artificial surfaces has outstripped the rate of population growth during the study period. This suggests that consumption of land per inhabitant has increased remarkably, which may confirm that the study area has been facing early and intensive fragmented urban land-cover dynamics [6,58].
Figure 6. Population and population density in the study area (1940–2019).
Figure 7. Population growth rates in the study area (1940–2019).
The urban land-cover difference map that illustrates urban change in Portimão spa-tially by temporal period is presented in Figure 8. The analysis of this map confirms a massive growth in artificial surfaces near the main urban settlements and along the coastal area, but most importantly it reveals the dispersed urban growth over time beyond the national-125 route, which had functioned as Portimão’s northern city boundary for a long time, and the A22 highway network built in 2001. In the early study periods, this urban development did not occur beyond those physical barriers, which is quite different from what is taking place currently. Figure 8 also reveals that urban dynamics occurred along the road network towards both the northwest and northeast parts of the municipality.
Figure 7. Population growth rates in the study area (1940–2019).
Sustainability 2021, 13, x FOR PEER REVIEW 14 of 25
Figure 8. Temporal physical expansion of artificial surfaces in Portimão over the study period.
4.3. Analysis Based on the LULC Change Trajectory Pattern (1947–2018) The dominant LULC change trajectories in Portimão are presented in Table 4 with
area (ha), area percentages, and their interpretation. Figure 9 shows the emergent spatial patterns of those LULC change trajectories. Results of the LULC change trajectories ag-gregated at the class level are presented in Figure 10a.
Figure 8. Temporal physical expansion of artificial surfaces in Portimão over the study period.
4.3. Analysis Based on the LULC Change Trajectory Pattern (1947–2018)
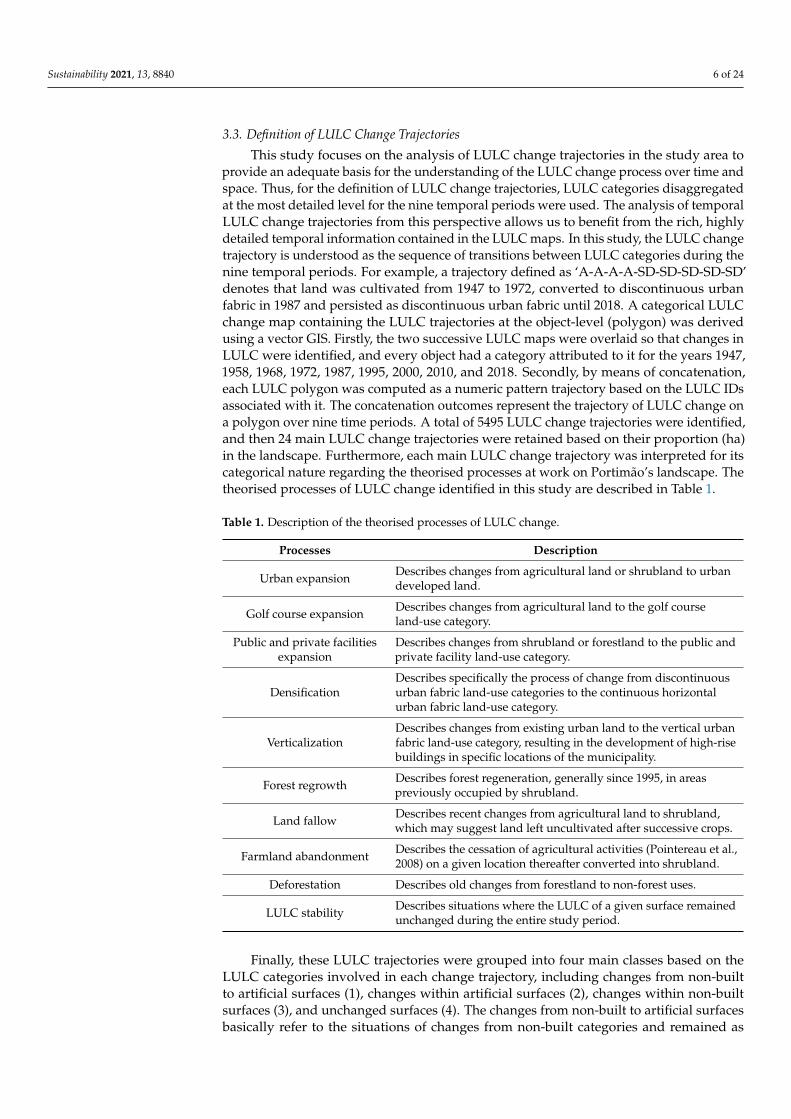
The dominant LULC change trajectories in Portimão are presented in Table 4 witharea (ha), area percentages, and their interpretation. Figure 9 shows the emergent spatialpatterns of those LULC change trajectories. Results of the LULC change trajectoriesaggregated at the class level are presented in Figure 10a.
Sustainability 2021, 13, 8840 14 of 24
Table 4. Main LULC change trajectories in the study area (1947–2018).
Class DescriptionLULC Change Trajectories Area
1947 1958 1968 1972 1987 1995 2000 2010 2018 (ha) (%) 1
1 Recent golf course expansion A A A A A A A G G 68.95 0.38Old discontinuous expansion A A A A D D D D D 66.30 0.36
Recent PPF expansion S S F F F F F PPF PPF 43.26 0.24Recent discontinuous expansion A A A A S S S D D 37.50 0.21
Old sparsely discontinuous expansion A A A A SD SD SD SD SD 31.69 0.17Recent sparsely discontinuous expansion A A A A A A A SD SD 20.28 0.11
Old horizontal expansion A A A A H H H H H 13.51 0.07Recent vertical expansion A A A A S S S V V 9.97 0.05
Old vertical expansion A A A A V V V V V 6.09 0.03Recent horizontal expansion A A A A A A A H H 2.20 0.01
Other 1884.94 10.35Total 2184.69 12.00
2 Old densification D D H H H H H H H 21.94 0.12Old verticalization D D V V V V V V V 4.77 0.03
Other 126.67 0.70Total 153.38 0.84
3 Old/permanent forest regrowth S S S S S F F F F 568.81 3.12S S S F F F F F F 206.13 1.13A A A F F F F F F 105.30 0.58
Recent land fallow A A A A A A A S S 274.41 1.51Old farmland abandonment A A A A A S S S S 331.59 1.82
A A A A S S S S S 290.83 1.60A S S S S S S S S 242.72 1.33
Old/permanent forest clearing F F S S S S S S S 93.42 0.51Other 4923.57 27.04Total 7036.78 38.65
4 Permanent agricultural land 4911.68 26.98Stable forest 3063.84 16.83
Permanent water bodies 432.20 2.37Stable artificial surfaces 231.19 1.27
Permanent wetland 192.04 1.05Total 8830.95 48.50
1 1% of the study area corresponds to nearly 182 ha. (A: Agricultural, D: Discontinuous urban fabric, F: Forest, G: Golf courses,H: Continuous horizontal urban fabric, PPF: Public and private facilities, S: Shrubs, SD: Sparse discontinuous urban fabric, V: Continuousvertical urban fabric).
The analysis of Table 4 shows that unchanged trajectories (class 4) represented 48.5%of Portimão’s landscape during the study period. Therefore, nearly 52% of the study areahas undergone an LULC change at least once over the 71-year study period. This revealsthat changes in LULC were quite meaningful and highlights the highly dynamic nature ofLULC changes in the coastal area of Portimão.
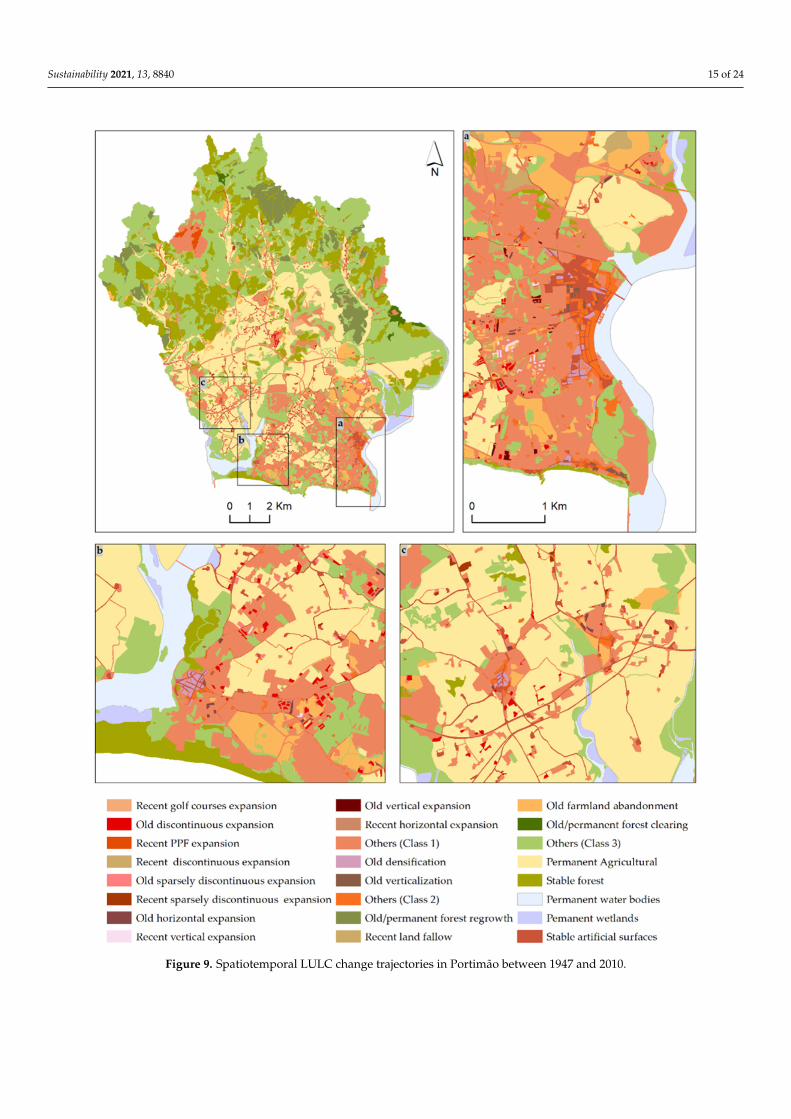
The analysis of LULC change trajectories between non-built categories (class 3) showsthat they prevailed in the landscape over the study period (with 38.65% of the total area).In this class, the primary LULC sequences were from shrubland to forestland and haveremained in the forest category since 1995 (with 3.2% of the total area), representing theold and permanent forest regrowth. Changes between agricultural land and shrublandaccounted for 6.26% of the study area (both rapid and progressive changes from agriculturalland to shrubland), which reveals the recent conversion into fallow and old farmlandabandonment. Such results provide further evidence that Portimão is gearing towardsmore critical and unbalanced LULC change trajectories. Earlier changes (1968) fromforestland to shrubland have transformed only 0.51% of the study area in the study period,corresponding to the old and permanent forest clearing. Figure 9 shows that changesbetween non-built categories have spatially developed predominantly further away fromthe main urban settlements. However, these LULC change trajectories are also found nearthe coastal area and at the edge of converted non-built areas to artificial surfaces (class 1).This suggests that such locations may be converted to artificial surfaces in the near future.
Sustainability 2021, 13, 8840 15 of 24
Sustainability 2021, 13, x FOR PEER REVIEW 15 of 25
Figure 9. Spatiotemporal LULC change trajectories in Portimão between 1947 and 2010. Figure 9. Spatiotemporal LULC change trajectories in Portimão between 1947 and 2010.
Sustainability 2021, 13, 8840 16 of 24Sustainability 2021, 13, x FOR PEER REVIEW 16 of 25
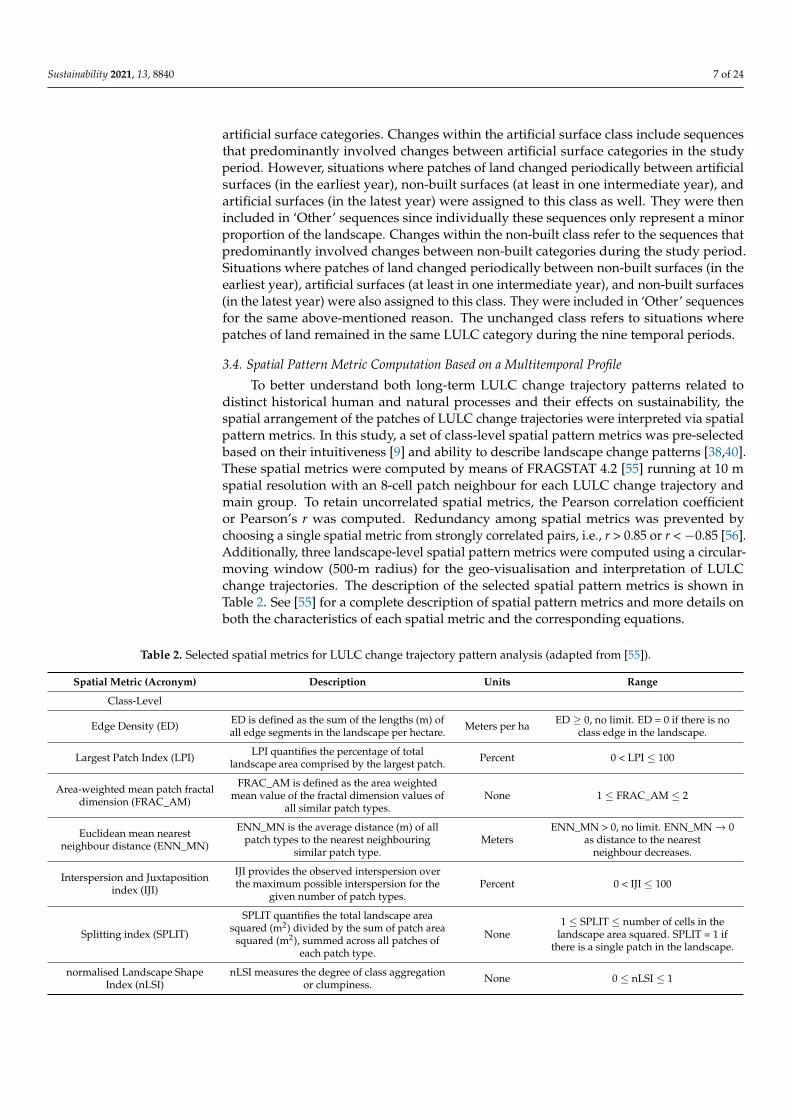
Figure 10. Description of images from left to right, top to bottom: (a) spatial patterns of LULC change trajectories, aggre-gated at the class level; (b) spatial patterns of AI; (c) spatial patterns of SHDI; and (d) spatial patterns of LSI.
The analysis of Table 4 shows that unchanged trajectories (class 4) represented 48.5% of Portimão’s landscape during the study period. Therefore, nearly 52% of the study area has undergone an LULC change at least once over the 71-year study period. This reveals that changes in LULC were quite meaningful and highlights the highly dynamic nature of LULC changes in the coastal area of Portimão.
The analysis of LULC change trajectories between non-built categories (class 3) shows that they prevailed in the landscape over the study period (with 38.65% of the total area). In this class, the primary LULC sequences were from shrubland to forestland and have remained in the forest category since 1995 (with 3.2% of the total area), representing the old and permanent forest regrowth. Changes between agricultural land and shrubland accounted for 6.26% of the study area (both rapid and progressive changes from agricul-tural land to shrubland), which reveals the recent conversion into fallow and old farmland abandonment. Such results provide further evidence that Portimão is gearing towards more critical and unbalanced LULC change trajectories. Earlier changes (1968) from for-estland to shrubland have transformed only 0.51% of the study area in the study period,
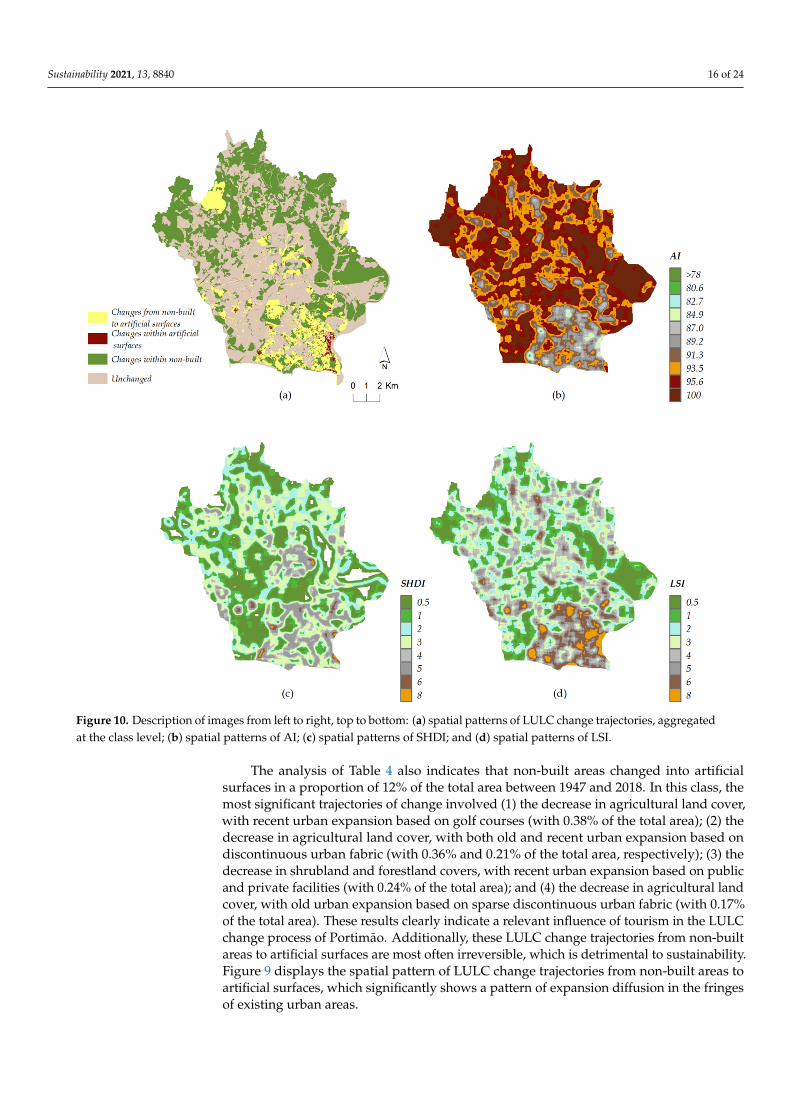
Figure 10. Description of images from left to right, top to bottom: (a) spatial patterns of LULC change trajectories, aggregatedat the class level; (b) spatial patterns of AI; (c) spatial patterns of SHDI; and (d) spatial patterns of LSI.
The analysis of Table 4 also indicates that non-built areas changed into artificialsurfaces in a proportion of 12% of the total area between 1947 and 2018. In this class, themost significant trajectories of change involved (1) the decrease in agricultural land cover,with recent urban expansion based on golf courses (with 0.38% of the total area); (2) thedecrease in agricultural land cover, with both old and recent urban expansion based ondiscontinuous urban fabric (with 0.36% and 0.21% of the total area, respectively); (3) thedecrease in shrubland and forestland covers, with recent urban expansion based on publicand private facilities (with 0.24% of the total area); and (4) the decrease in agricultural landcover, with old urban expansion based on sparse discontinuous urban fabric (with 0.17%of the total area). These results clearly indicate a relevant influence of tourism in the LULCchange process of Portimão. Additionally, these LULC change trajectories from non-builtareas to artificial surfaces are most often irreversible, which is detrimental to sustainability.Figure 9 displays the spatial pattern of LULC change trajectories from non-built areas toartificial surfaces, which significantly shows a pattern of expansion diffusion in the fringesof existing urban areas.
Sustainability 2021, 13, 8840 17 of 24
LULC change trajectories between artificial surface categories (class 2) representedabout 0.84% of the total study area during the study period. Changes from discontinuousurban fabric to both horizontal urban fabric (with 0.12% of the total area) and verticalurban fabric (with 0.03% of the total area) are dominant in this class. These trajectoriescorrespond to both progressive urban densification and high-rise building increase inpreviously discontinuous urban areas. The analysis of their spatial pattern (Figure 9)shows that changes between artificial surfaces are generally located near the main urbansettlements and along the coastal area.
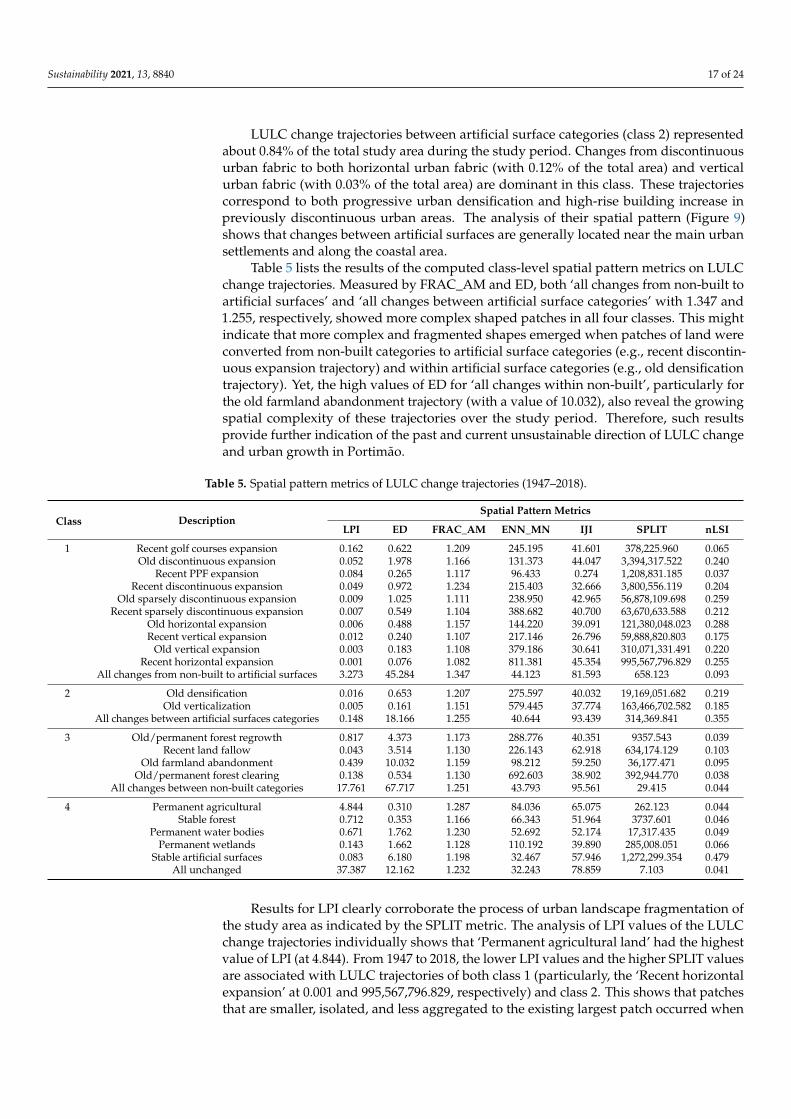
Table 5 lists the results of the computed class-level spatial pattern metrics on LULCchange trajectories. Measured by FRAC_AM and ED, both ‘all changes from non-built toartificial surfaces’ and ‘all changes between artificial surface categories’ with 1.347 and1.255, respectively, showed more complex shaped patches in all four classes. This mightindicate that more complex and fragmented shapes emerged when patches of land wereconverted from non-built categories to artificial surface categories (e.g., recent discontin-uous expansion trajectory) and within artificial surface categories (e.g., old densificationtrajectory). Yet, the high values of ED for ‘all changes within non-built’, particularly forthe old farmland abandonment trajectory (with a value of 10.032), also reveal the growingspatial complexity of these trajectories over the study period. Therefore, such resultsprovide further indication of the past and current unsustainable direction of LULC changeand urban growth in Portimão.
Table 5. Spatial pattern metrics of LULC change trajectories (1947–2018).
Class DescriptionSpatial Pattern Metrics
LPI ED FRAC_AM ENN_MN IJI SPLIT nLSI
1 Recent golf courses expansion 0.162 0.622 1.209 245.195 41.601 378,225.960 0.065Old discontinuous expansion 0.052 1.978 1.166 131.373 44.047 3,394,317.522 0.240
Recent PPF expansion 0.084 0.265 1.117 96.433 0.274 1,208,831.185 0.037Recent discontinuous expansion 0.049 0.972 1.234 215.403 32.666 3,800,556.119 0.204
Old sparsely discontinuous expansion 0.009 1.025 1.111 238.950 42.965 56,878,109.698 0.259Recent sparsely discontinuous expansion 0.007 0.549 1.104 388.682 40.700 63,670,633.588 0.212
Old horizontal expansion 0.006 0.488 1.157 144.220 39.091 121,380,048.023 0.288Recent vertical expansion 0.012 0.240 1.107 217.146 26.796 59,888,820.803 0.175
Old vertical expansion 0.003 0.183 1.108 379.186 30.641 310,071,331.491 0.220Recent horizontal expansion 0.001 0.076 1.082 811.381 45.354 995,567,796.829 0.255
All changes from non-built to artificial surfaces 3.273 45.284 1.347 44.123 81.593 658.123 0.093
2 Old densification 0.016 0.653 1.207 275.597 40.032 19,169,051.682 0.219Old verticalization 0.005 0.161 1.151 579.445 37.774 163,466,702.582 0.185
All changes between artificial surfaces categories 0.148 18.166 1.255 40.644 93.439 314,369.841 0.355
3 Old/permanent forest regrowth 0.817 4.373 1.173 288.776 40.351 9357.543 0.039Recent land fallow 0.043 3.514 1.130 226.143 62.918 634,174.129 0.103
Old farmland abandonment 0.439 10.032 1.159 98.212 59.250 36,177.471 0.095Old/permanent forest clearing 0.138 0.534 1.130 692.603 38.902 392,944.770 0.038
All changes between non-built categories 17.761 67.717 1.251 43.793 95.561 29.415 0.044
4 Permanent agricultural 4.844 0.310 1.287 84.036 65.075 262.123 0.044Stable forest 0.712 0.353 1.166 66.343 51.964 3737.601 0.046
Permanent water bodies 0.671 1.762 1.230 52.692 52.174 17,317.435 0.049Permanent wetlands 0.143 1.662 1.128 110.192 39.890 285,008.051 0.066
Stable artificial surfaces 0.083 6.180 1.198 32.467 57.946 1,272,299.354 0.479All unchanged 37.387 12.162 1.232 32.243 78.859 7.103 0.041
Results for LPI clearly corroborate the process of urban landscape fragmentation ofthe study area as indicated by the SPLIT metric. The analysis of LPI values of the LULCchange trajectories individually shows that ‘Permanent agricultural land’ had the highestvalue of LPI (at 4.844). From 1947 to 2018, the lower LPI values and the higher SPLIT valuesare associated with LULC trajectories of both class 1 (particularly, the ‘Recent horizontalexpansion’ at 0.001 and 995,567,796.829, respectively) and class 2. This shows that patchesthat are smaller, isolated, and less aggregated to the existing largest patch occurred when
Sustainability 2021, 13, 8840 18 of 24
lands were converted from non-built categories to artificial surface categories and withinartificial surface categories over the 1947–2018 period.
Table 5 shows that the highest value of ENN_MN during the study period concernsthe ‘recent horizontal expansion’ trajectory (at 811.381). This implies that from 2010 to 2018,artificial surfaces based on continuous horizontal urban fabric category were developedfar from existing locations of the same LULC category. Figure 9 confirms that theseartificial surfaces were developed in municipality-planned areas located in the northernpart of Portimão.
The results of nLSI reveal that LULC change trajectories present quite different levels ofspatial aggregation. In general, when contiguous patches of both LULC change trajectoriesfrom ‘all changes between non-built categories’ and unchanged trajectories are mergedthey have higher levels of aggregation. A careful analysis of the nLSI values of the LULCchange trajectories individually shows that permanent agricultural land, stable forestland,permanent water bodies, and permanent wetland trajectories have minimum nLSI valuesand considerably less than the LULC change trajectories that involved conversions betweennon-built surfaces and artificial surfaces or within artificial surfaces. The high values ofnLSI of ‘old horizontal urban fabric expansion’ and ‘old sparse discontinuous urban fabricexpansion’ confirm their highly dispersed and disaggregated spatial pattern over the studyperiod. Also interesting is the fact that the nLSI of ‘recent public and private facilitiesexpansion’ and ‘recent golf courses expansion’ is 0.037 and 0.065, respectively, which arethe smallest values among the main LULC change trajectories of class 1. This suggests thatthese trajectories exhibited a relatively more concentrated spatial pattern.
The stable trajectories presented the lower value of IJI among all four classes (witha value of 78.859). This means that these trajectories tended to spatially associate witheach other and thus are less contiguous to other trajectory types. LULC change trajectoriesbetween non-built categories and LULC change trajectories between non-built and artificialsurface categories generally exhibited higher IJI when compared to ‘old verticalization’(with a value of 37.774) and ‘old densification’ (with a value of 40.032). This is so becauseLULC change trajectories between non-built categories and artificial surface categories andLULC change trajectories between non-built categories (particularly, ‘recent land fallow’and ‘old farmland abandonment’) typically represent the intermixed areas [40] betweennatural and rural land-cover categories and urban land-cover categories.
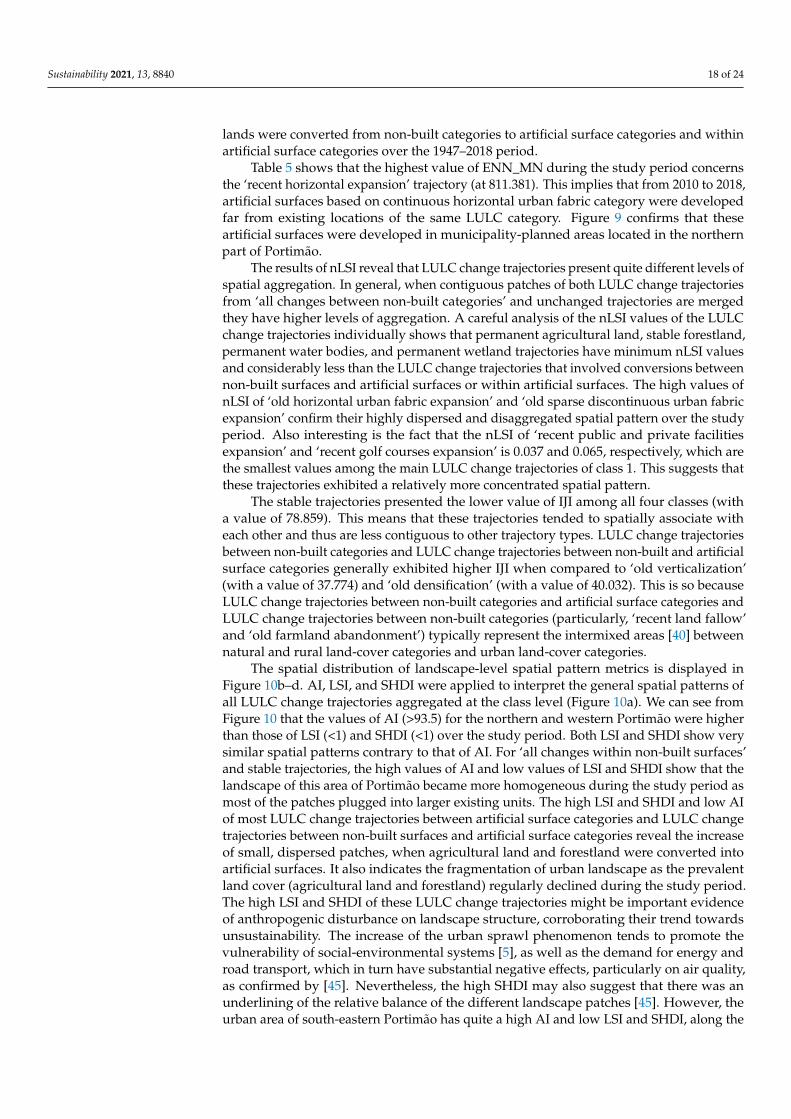
The spatial distribution of landscape-level spatial pattern metrics is displayed inFigure 10b–d. AI, LSI, and SHDI were applied to interpret the general spatial patterns ofall LULC change trajectories aggregated at the class level (Figure 10a). We can see fromFigure 10 that the values of AI (>93.5) for the northern and western Portimão were higherthan those of LSI (<1) and SHDI (<1) over the study period. Both LSI and SHDI show verysimilar spatial patterns contrary to that of AI. For ‘all changes within non-built surfaces’and stable trajectories, the high values of AI and low values of LSI and SHDI show that thelandscape of this area of Portimão became more homogeneous during the study period asmost of the patches plugged into larger existing units. The high LSI and SHDI and low AIof most LULC change trajectories between artificial surface categories and LULC changetrajectories between non-built surfaces and artificial surface categories reveal the increaseof small, dispersed patches, when agricultural land and forestland were converted intoartificial surfaces. It also indicates the fragmentation of urban landscape as the prevalentland cover (agricultural land and forestland) regularly declined during the study period.The high LSI and SHDI of these LULC change trajectories might be important evidenceof anthropogenic disturbance on landscape structure, corroborating their trend towardsunsustainability. The increase of the urban sprawl phenomenon tends to promote thevulnerability of social-environmental systems [5], as well as the demand for energy androad transport, which in turn have substantial negative effects, particularly on air quality,as confirmed by [45]. Nevertheless, the high SHDI may also suggest that there was anunderlining of the relative balance of the different landscape patches [45]. However, theurban area of south-eastern Portimão has quite a high AI and low LSI and SHDI, along the
Sustainability 2021, 13, 8840 19 of 24
time series. This indicates that these urban areas tended to aggregate, and the area of thedominant land cover (artificial surfaces) increased with basic geometric forms.
5. Conclusions
Knowing the past and current spatial dimension, pattern, and location of LULCchange trajectories is crucial to understand territorial sustainability and anticipate possiblefutures. This study provided a comprehensive analysis applying GIS-based spatial analysistechniques, an LULC change trajectory analysis and spatial pattern metrics to addressLULC change trajectories and their effects on sustainability at the local level (municipalityof Portimão, Algarve). Several researchers have extensively explored the effectiveness ofLULC change trajectory analysis and spatial metrics in relating spatial patterns of LULCtrajectories and LULC change processes, as well as the usefulness of spatial metrics asindicators of landscape sustainability. The major original contribution of the proposedapproach is in the confirmation of the effectiveness of these methods, using high-precisionLULC maps for a long time period (71 years). This study extended research reportedby [39,40] based on the multitemporal profile method. Spatial pattern metric analysison classified temporal categorical trajectories has been introduced to interpret long-termdynamic and complex LULC conversions, now based on a much smaller scale view onLULC change. By taking this approach, the LULC change trend for each location inthe study area across time was tracked and spatial patterns of LULC trajectories wereanalysed quantitatively, thus providing important insights into both the dynamics and theculmination of long LULC change processes.
Ultimately, the analysis of the spatial dynamics of LULC change trajectories over thepast 71 years using a fine spatial resolution and highly detailed LULC thematic maps couldprovide a basis for understanding urban local-spatial resilience, and thus foster data-drivendecisions. Furthermore, it provides robust, actionable, and adequate empirical informationto support smart and sustainable future spatial planning. This study presents an approachthat is relatively simple to implement and yet it is quite powerful for addressing past,current, and future LULC changes trajectories, which may be replicated in other urbanareas worldwide.
Future research on this approach that combines LULC change trajectory analysisand spatial pattern metrics needs to focus on analysing to what extent the quantitativeand analytical results of LULC change detection are affected using multitemporal andmulti-resolution imagery as data sources. It should also focus on enriching this approachwith the creation of new spatial pattern metrics based on 3D data [59] that may improveour understanding of LULC changes that occur in very dynamic areas [60,61].
Author Contributions: Conceptualisation, R.F.d.D. and J.A.T.; methodology, R.F.d.D. and J.A.T.;formal analysis, R.F.d.D. and J.A.T.; research, R.F.d.D.; writing—original draft preparation, R.F.d.D.;writing—review and editing, R.F.d.D. and J.A.T.; supervision, J.A.T.; funding acquisition, R.F.d.D.and J.A.T. Both authors have read and agreed to the published version of the manuscript.
Funding: This research was funded by national funds through FCT—Fundação para a Ciência e aTecnologia, I.P., within the scope of the project ‘UIDB/04647/2020′ of CICS.NOVA—Centro Interdis-ciplinar de Ciências Sociais da Universidade Nova de Lisboa. This research was also partially fundedby the SIARL Methodology project, contract 000011-DFIN-DCP, in progress at Associação para a Ino-vação e Desenvolvimento da FCT (NOVA.ID.FCT). The first author was financed by the FCT, underthe Norma Transitória—DL 57/2016/CP1453/CT0105 and by a grant number SFRH/BD/61544/2009.
Conflicts of Interest: The authors declare no conflict of interest. The funders had no role in the designof the study; in the collection, analyses, or interpretation of data; in the writing of the manuscript, orin the decision to publish the results.
Sustainability 2021, 13, 8840 20 of 24
Appendix A
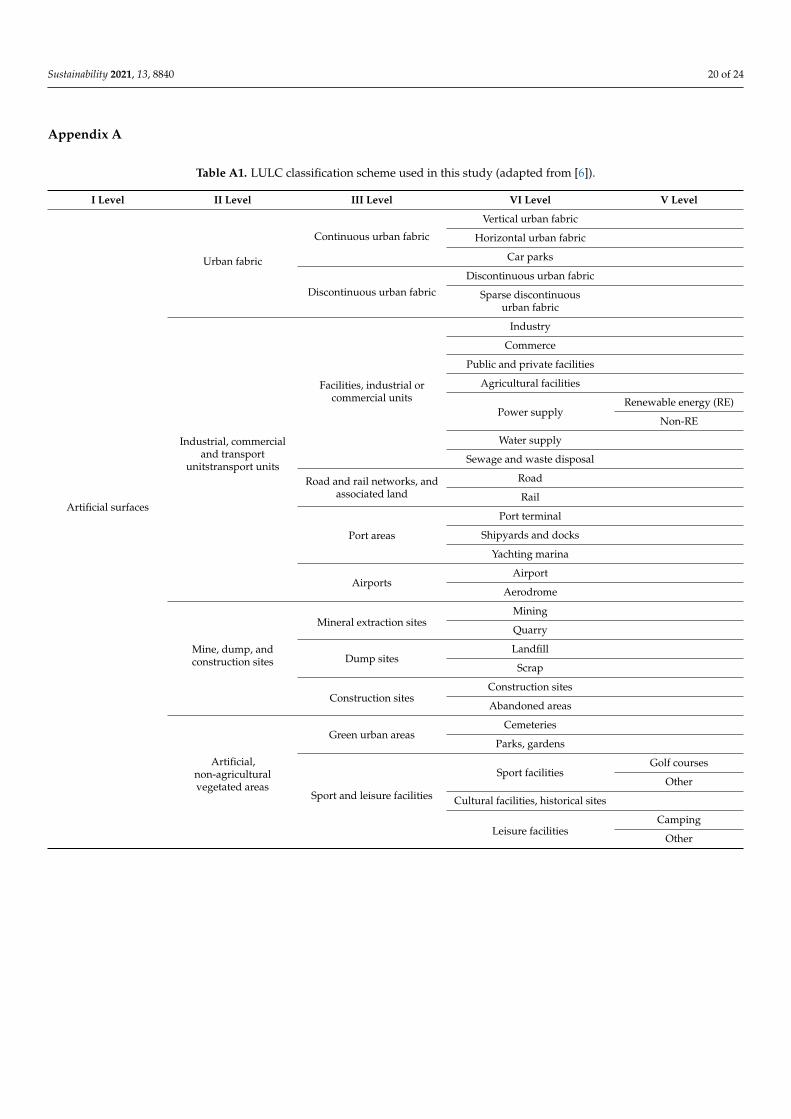
Table A1. LULC classification scheme used in this study (adapted from [6]).
I Level II Level III Level VI Level V Level
Artificial surfaces
Urban fabric
Continuous urban fabric
Vertical urban fabric
Horizontal urban fabric
Car parks
Discontinuous urban fabric
Discontinuous urban fabric
Sparse discontinuousurban fabric
Industrial, commercialand transport
unitstransport units
Facilities, industrial orcommercial units
Industry
Commerce
Public and private facilities
Agricultural facilities
Power supplyRenewable energy (RE)
Non-RE
Water supply
Sewage and waste disposal
Road and rail networks, andassociated land
Road
Rail
Port areas
Port terminal
Shipyards and docks
Yachting marina
AirportsAirport
Aerodrome
Mine, dump, andconstruction sites
Mineral extraction sitesMining
Quarry
Dump sitesLandfill
Scrap
Construction sitesConstruction sites
Abandoned areas
Artificial,non-agriculturalvegetated areas
Green urban areasCemeteries
Parks, gardens
Sport and leisure facilities
Sport facilitiesGolf courses
Other
Cultural facilities, historical sites
Leisure facilitiesCamping
Other
Sustainability 2021, 13, 8840 21 of 24
Table A1. Cont.
I Level II Level III Level VI Level V Level
Forest andseminatural areas
Forests
Open forests, shrub, andherbaceous vegetation
Natural grasslands
Shrubs
Open forests, cuts, and newplantationsplantations
Open spaces with littleor no vegetation
Bare rocks
Sparsely vegetated areas
Beaches, dunes, sands
Burnt areas
Agricultural areas
Wetlands
Water bodies
Table A2. Land-use and land-cover areas (ha) and percentage of LULC areas in the study area over the 1947–2018 period.
Level V Categories
1947 1958 1968 1972 1987 1995 2000 2010 2018
Area(ha) % Area
(ha) % Area(ha) % Area
(ha) % Area(ha) % Area
(ha) % Area(ha) % Area
(ha) % Area(ha) %
Continuous vertical urban fabric 1 0 1 0 12 0 23 0 50 0 73 0 90 0 128 1 135 1Continuous horizontal
urban fabric 18 0 23 0 57 0 66 0 98 1 122 1 126 1 145 1 146 1
Car parks 0 0 1 0 2 0 4 0 7 0 12 0 19 0 31 0 42 0Discontinuous urban fabric 95 1 117 1 103 1 112 1 253 1 328 2 368 2 490 3 502 3
Sparse discontinuousurban fabric 67 0 71 0 88 0 112 1 139 1 140 1 157 1 191 1 208 1
Industry 11 0 9 0 11 0 17 0 36 0 56 0 59 0 73 0 41 0Commerce 0 0 0 0 1 0 1 0 3 0 8 0 11 0 41 0 37 0
Agricultural facilities 3 0 3 0 3 0 3 0 6 0 7 0 9 0 11 0 16 0Public and private facilities 1 0 1 0 6 0 7 0 20 0 38 0 52 0 211 1 248 1
RE 0 0 0 0 0 0 0 0 0 0 0 0 0 0 0 0 8 0Non-RE 0 0 0 0 0 0 0 0 0 0 0 0 0 0 5 0 5 0
Water supply 0 0 0 0 0 0 1 0 3 0 4 0 4 0 5 0 4 0Sewage and waste disposal 0 0 0 0 0 0 0 0 27 0 28 0 31 0 31 0 35 0
Road network andassociated land 173 1 180 1 204 1 217 1 293 2 334 2 357 2 474 3 477 3
Rail network andassociated land 8 0 8 0 8 0 8 0 8 0 8 0 8 0 8 0 8 0
Port terminal 0 0 1 0 1 0 1 0 1 0 8 0 8 0 8 0 8 0Shipyards and docks 2 0 2 0 2 0 1 0 2 0 2 0 17 0 16 0 16 0
Aerodrome 0 0 0 0 0 0 14 0 15 0 15 0 15 0 15 0 15 0Mining 0 0 0 0 0 0 0 0 0 0 0 0 0 0 0 0 25 0Landfill 0 0 0 0 0 0 0 0 0 0 0 0 24 0 31 0 34 0
Scrap 0 0 1 0 1 0 0 0 1 0 6 0 3 0 2 0 3 0Construction sites 0 0 0 0 4 0 4 0 30 0 35 0 90 0 207 1 109 1Abandoned areas 0 0 0 0 0 0 0 0 1 0 7 0 7 0 6 0 26 0
Parks, gardens 2 0 2 0 7 0 12 0 21 0 35 0 40 0 58 0 61 0Cemeteries 2 0 2 0 2 0 2 0 3 0 3 0 3 0 3 0 3 0
Golf courses 0 0 0 0 48 0 65 0 80 0 117 1 143 1 251 1 253 1Other sport facilities 0 0 0 0 4 0 5 0 11 0 18 0 17 0 20 0 23 0
Camping 0 0 0 0 0 0 0 0 7 0 8 0 8 0 8 0 8 0Other leisure facilities 0 0 0 0 2 0 4 0 6 0 7 0 7 0 18 0 21 0
Cultural facilities, historical sites 2 0 2 0 4 0 4 0 6 0 6 0 7 0 7 0 7 0Total 384 2 426 2 569 3 683 4 1125 6 1423 8 1680 9 2492 14 2524 14
Agricultural areas 9257 51 8668 48 8571 47 8431 46 7391 41 6689 37 6268 34 5767 32 5612 31Forest 945 5 923 5 1142 6 1346 7 1660 9 2323 13 2658 15 2844 16 2647 15
Natural grasslands 52 0 67 0 71 0 74 0 74 0 80 0 120 1 111 1 109 1
Sustainability 2021, 13, 8840 22 of 24
Table A2. Cont.
Level V Categories
1947 1958 1968 1972 1987 1995 2000 2010 2018
Area(ha) % Area
(ha) % Area(ha) % Area
(ha) % Area(ha) % Area
(ha) % Area(ha) % Area
(ha) % Area(ha) %
Shrubs 6180 34 6719 37 6604 36 6352 35 6597 36 6275 34 5973 33 5763 32 6083 33Open forests/cuts/new
plantations 48 0 86 0 136 1 202 1 153 1 193 1 319 2 50 0 52 0
Beaches, dunes and sands 173 1 123 1 110 1 103 1 104 1 93 1 85 0 84 0 84 0Bare rocks 34 0 16 0 17 0 18 0 20 0 23 0 20 0 23 0 17 0
Sparsely vegetated areas 2 0 6 0 15 0 23 0 91 1 63 0 86 0 46 0 42 0Burnt areas 0 0 0 0 0 0 0 0 2 0 39 0 0 0 1 0 1 0
Total 7434 41 7940 44 8095 44 8118 45 8701 48 9088 50 9260 51 8905 49 9034 50Wetlands 563 3 573 3 428 2 426 2 387 2 391 2 403 2 441 2 441 2
Water bodies 568 3 599 3 543 3 548 3 603 3 616 3 595 3 586 3 596 3
References1. Turner, B.L.; Kasperson, R.E.; Meyer, W.B.; Dow, K.M.; Golding, D.; Kasperson, J.X.; Mitchell, R.C.; Ratick, S.J. Two Types of
Global Environmental Change: Definitional and Spatial-Scale Issues in Their Human Dimensions. Glob. Environ. Chang. 1990, 1,14–22. [CrossRef]
2. Antrop, M. Landscape Change and the Urbanization Process in Europe. Dev. Eur. Landsc. 2004, 67, 9–26. [CrossRef]3. Kuemmerle, T.; Levers, C.; Erb, K.; Estel, S.; Jepsen, M.R.; Müller, D.; Plutzar, C.; Stürck, J.; Verkerk, P.J.; Verburg, P.H.; et al.
Hotspots of Land Use Change in Europe. Environ. Res. Lett. 2016, 11, 064020. [CrossRef]4. MohanRajan, S.N.; Loganathan, A.; Manoharan, P. Survey on Land Use/Land Cover (LU/LC) Change Analysis in Remote
Sensing and GIS Environment: Techniques and Challenges. Environ. Sci. Pollut. Res. 2020, 27, 29900–29926. [CrossRef]5. Faria de Deus, R.; Tenedório, J.A.; Moix Montserrat, B. Urban Sprawl in Portugal Based on Urban Systems Spatial Boundaries.
ACE Archit. City Environ. 2012, 7, 131–148.6. Faria de Deus, R.; Tenedório, J.A.; Rocha, J. Modelling land-use and land-cover changes: A hybrid approach to a coastal area. In
Methods and Applications of Geospatial Technology in Sustainable Urbanism; Tenedório, J.A., Estanqueiro, R., Henriques, C.D., Eds.;IGI Global: Hershey, PA, USA, 2021; pp. 57–102. ISBN 978-1-79982-249-3.
7. Herold, M.; Hemphill, J.; Dietzel, C.; Clarke, K.; Land, E.G.-G. Remote Sensing Derived Mapping to Support Urban Growth Theory. 2005.Available online: https://www.isprs.org/proceedings/xxxvi/8-w27/herold_hemphill_etal.pdf (accessed on 6 August 2021).
8. Bhatta, B. Analysis of Urban. Growth and Sprawl from Remote Sensing Data; Advances in Geographic Information Science; Springer:Berlin/Heidelberg, Germany, 2010; ISBN 978-3-642-05299-6.
9. Pham, H.M.; Yamaguchi, Y.; Bui, T.Q. A Case Study on the Relation between City Planning and Urban Growth Using RemoteSensing and Spatial Metrics. Landsc. Urban Plan. 2011, 100, 223–230. [CrossRef]
10. D’Acci, L. (Ed.) The Mathematics of Urban. Morphology; Modeling and Simulation in Science, Engineering and Technology; Springer:Cham, Switzerland, 2019; ISBN 978-3-030-12381-9.
11. Brown, C.; Holman, I.; Rounsevell, M. How Modelling Paradigms Affect Simulated Future Land Use Change. Earth Syst. Dyn.2021, 12, 211–231. [CrossRef]
12. Benders, R. Models and Modelling. Interactive Simulation of Electricity Demand and Production; University Groningen: Groningen,The Netherlands, 1996.
13. Cheng, I. Modelling Spatial and Temporal Urban Growth; ITC: Enschede, The Netherlands, 2003.14. Wellmann, T.; Lausch, A.; Andersson, E.; Knapp, S.; Cortinovis, C.; Jache, J.; Scheuer, S.; Kremer, P.; Mascarenhas, A.; Kraemer,
R.; et al. Remote Sensing in Urban Planning: Contributions towards Ecologically Sound Policies? Landsc. Urban Plan. 2020, 204,103921. [CrossRef]
15. Tamba, V.; Kabba, V.; Li, J. Analysis of Land Use and Land Cover Changes, and Their Ecological Implications in Wuhan, China. J.Geogr. Geol. 2011, 3. [CrossRef]
16. Fichera, C.R.; Modica, G.; Pollino, M. Land Cover Classification and Change-Detection Analysis Using Multi-Temporal RemoteSensed Imagery and Landscape Metrics. Eur. J. Remote Sens. 2012, 45, 1–18. [CrossRef]
17. Mirzaei, M.; Shayesteh, K. Land Use Changes Analysis Using GIS, Remote Sensing and Landscape Metrics: A Case Study ofGolpayegan City, Iran. Int. J. Ecol. Environ. Sci. 2015, 41, 133–140.
18. Sinha, S.; Sinha, K. Application of Geospatial Techniques in the Study of Urban Growth/ Sprawl. Int. J. Multidiscip. 2018, 3, 148.19. Zambon, I.; Serra, P.; Pili, S.; Bernardini, V.; Ferrara, C.; Salvati, L. A New Approach to Land-Use Structure: Patch Perimeter
Metrics as a Spatial Analysis Tool. Sustainability 2018, 10. [CrossRef]20. Duong, N.; Lepczyk, C.; Miura, T.; Fox, J. Quantifying Urban Growth Patterns in Hanoi Using Landscape Expansion Modes and
Time Series Spatial Metrics. PLoS ONE 2018, 13, e0196940. [CrossRef]21. Mohanty, S.; Panda, L.; Rath, S.S. Geospatial Technology in Urban Sprawl Assessment: A Review. In Methods and Applications of
Geospatial Technology in Sustainable Urbanism; Tenedório, J.A., Estanqueiro, R., Henriques, C.D., Eds.; IGI Global: Hershey, PA,USA, 2021; pp. 1–33. ISBN 978-1-79982-249-3.
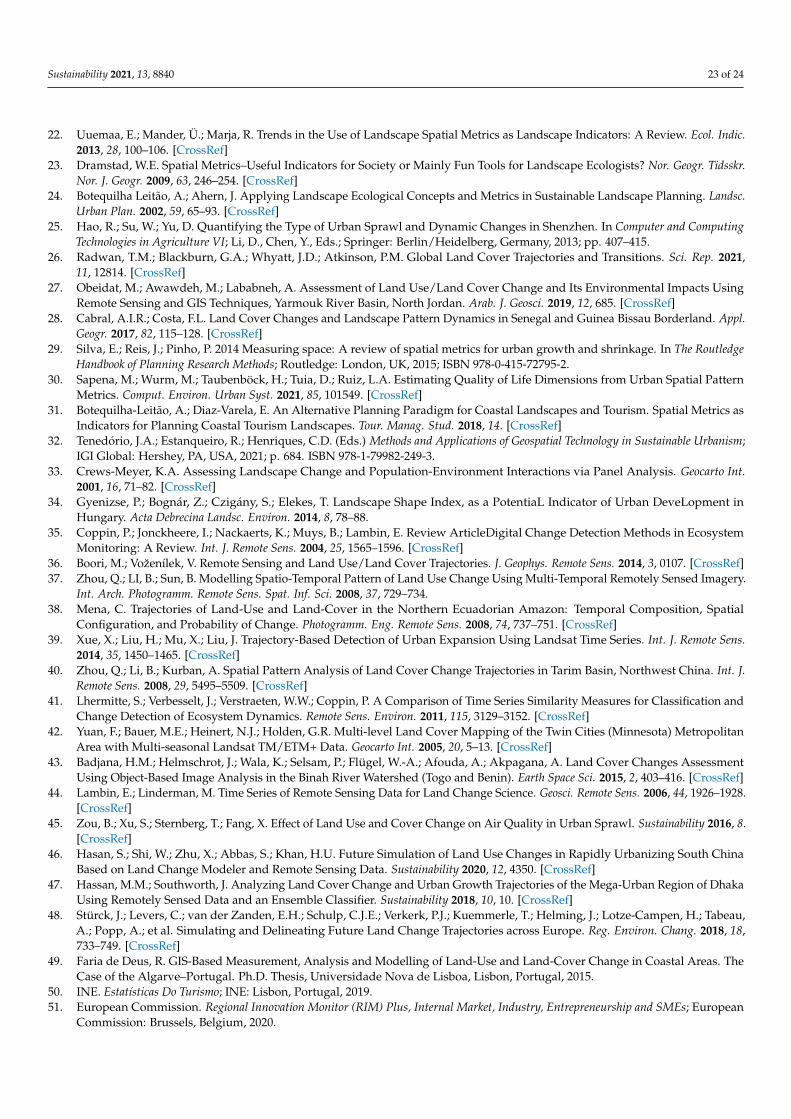
Sustainability 2021, 13, 8840 23 of 24
22. Uuemaa, E.; Mander, Ü.; Marja, R. Trends in the Use of Landscape Spatial Metrics as Landscape Indicators: A Review. Ecol. Indic.2013, 28, 100–106. [CrossRef]
23. Dramstad, W.E. Spatial Metrics–Useful Indicators for Society or Mainly Fun Tools for Landscape Ecologists? Nor. Geogr. Tidsskr.Nor. J. Geogr. 2009, 63, 246–254. [CrossRef]
24. Botequilha Leitão, A.; Ahern, J. Applying Landscape Ecological Concepts and Metrics in Sustainable Landscape Planning. Landsc.Urban Plan. 2002, 59, 65–93. [CrossRef]
25. Hao, R.; Su, W.; Yu, D. Quantifying the Type of Urban Sprawl and Dynamic Changes in Shenzhen. In Computer and ComputingTechnologies in Agriculture VI; Li, D., Chen, Y., Eds.; Springer: Berlin/Heidelberg, Germany, 2013; pp. 407–415.
26. Radwan, T.M.; Blackburn, G.A.; Whyatt, J.D.; Atkinson, P.M. Global Land Cover Trajectories and Transitions. Sci. Rep. 2021,11, 12814. [CrossRef]
27. Obeidat, M.; Awawdeh, M.; Lababneh, A. Assessment of Land Use/Land Cover Change and Its Environmental Impacts UsingRemote Sensing and GIS Techniques, Yarmouk River Basin, North Jordan. Arab. J. Geosci. 2019, 12, 685. [CrossRef]
28. Cabral, A.I.R.; Costa, F.L. Land Cover Changes and Landscape Pattern Dynamics in Senegal and Guinea Bissau Borderland. Appl.Geogr. 2017, 82, 115–128. [CrossRef]
29. Silva, E.; Reis, J.; Pinho, P. 2014 Measuring space: A review of spatial metrics for urban growth and shrinkage. In The RoutledgeHandbook of Planning Research Methods; Routledge: London, UK, 2015; ISBN 978-0-415-72795-2.
30. Sapena, M.; Wurm, M.; Taubenböck, H.; Tuia, D.; Ruiz, L.A. Estimating Quality of Life Dimensions from Urban Spatial PatternMetrics. Comput. Environ. Urban Syst. 2021, 85, 101549. [CrossRef]
31. Botequilha-Leitão, A.; Diaz-Varela, E. An Alternative Planning Paradigm for Coastal Landscapes and Tourism. Spatial Metrics asIndicators for Planning Coastal Tourism Landscapes. Tour. Manag. Stud. 2018, 14. [CrossRef]
32. Tenedório, J.A.; Estanqueiro, R.; Henriques, C.D. (Eds.) Methods and Applications of Geospatial Technology in Sustainable Urbanism;IGI Global: Hershey, PA, USA, 2021; p. 684. ISBN 978-1-79982-249-3.
33. Crews-Meyer, K.A. Assessing Landscape Change and Population-Environment Interactions via Panel Analysis. Geocarto Int.2001, 16, 71–82. [CrossRef]
34. Gyenizse, P.; Bognár, Z.; Czigány, S.; Elekes, T. Landscape Shape Index, as a PotentiaL Indicator of Urban DeveLopment inHungary. Acta Debrecina Landsc. Environ. 2014, 8, 78–88.
35. Coppin, P.; Jonckheere, I.; Nackaerts, K.; Muys, B.; Lambin, E. Review ArticleDigital Change Detection Methods in EcosystemMonitoring: A Review. Int. J. Remote Sens. 2004, 25, 1565–1596. [CrossRef]
36. Boori, M.; Voženílek, V. Remote Sensing and Land Use/Land Cover Trajectories. J. Geophys. Remote Sens. 2014, 3, 0107. [CrossRef]37. Zhou, Q.; LI, B.; Sun, B. Modelling Spatio-Temporal Pattern of Land Use Change Using Multi-Temporal Remotely Sensed Imagery.
Int. Arch. Photogramm. Remote Sens. Spat. Inf. Sci. 2008, 37, 729–734.38. Mena, C. Trajectories of Land-Use and Land-Cover in the Northern Ecuadorian Amazon: Temporal Composition, Spatial
Configuration, and Probability of Change. Photogramm. Eng. Remote Sens. 2008, 74, 737–751. [CrossRef]39. Xue, X.; Liu, H.; Mu, X.; Liu, J. Trajectory-Based Detection of Urban Expansion Using Landsat Time Series. Int. J. Remote Sens.
2014, 35, 1450–1465. [CrossRef]40. Zhou, Q.; Li, B.; Kurban, A. Spatial Pattern Analysis of Land Cover Change Trajectories in Tarim Basin, Northwest China. Int. J.
Remote Sens. 2008, 29, 5495–5509. [CrossRef]41. Lhermitte, S.; Verbesselt, J.; Verstraeten, W.W.; Coppin, P. A Comparison of Time Series Similarity Measures for Classification and
Change Detection of Ecosystem Dynamics. Remote Sens. Environ. 2011, 115, 3129–3152. [CrossRef]42. Yuan, F.; Bauer, M.E.; Heinert, N.J.; Holden, G.R. Multi-level Land Cover Mapping of the Twin Cities (Minnesota) Metropolitan
Area with Multi-seasonal Landsat TM/ETM+ Data. Geocarto Int. 2005, 20, 5–13. [CrossRef]43. Badjana, H.M.; Helmschrot, J.; Wala, K.; Selsam, P.; Flügel, W.-A.; Afouda, A.; Akpagana, A. Land Cover Changes Assessment
Using Object-Based Image Analysis in the Binah River Watershed (Togo and Benin). Earth Space Sci. 2015, 2, 403–416. [CrossRef]44. Lambin, E.; Linderman, M. Time Series of Remote Sensing Data for Land Change Science. Geosci. Remote Sens. 2006, 44, 1926–1928.
[CrossRef]45. Zou, B.; Xu, S.; Sternberg, T.; Fang, X. Effect of Land Use and Cover Change on Air Quality in Urban Sprawl. Sustainability 2016, 8.
[CrossRef]46. Hasan, S.; Shi, W.; Zhu, X.; Abbas, S.; Khan, H.U. Future Simulation of Land Use Changes in Rapidly Urbanizing South China
Based on Land Change Modeler and Remote Sensing Data. Sustainability 2020, 12, 4350. [CrossRef]47. Hassan, M.M.; Southworth, J. Analyzing Land Cover Change and Urban Growth Trajectories of the Mega-Urban Region of Dhaka
Using Remotely Sensed Data and an Ensemble Classifier. Sustainability 2018, 10, 10. [CrossRef]48. Stürck, J.; Levers, C.; van der Zanden, E.H.; Schulp, C.J.E.; Verkerk, P.J.; Kuemmerle, T.; Helming, J.; Lotze-Campen, H.; Tabeau,
A.; Popp, A.; et al. Simulating and Delineating Future Land Change Trajectories across Europe. Reg. Environ. Chang. 2018, 18,733–749. [CrossRef]
49. Faria de Deus, R. GIS-Based Measurement, Analysis and Modelling of Land-Use and Land-Cover Change in Coastal Areas. TheCase of the Algarve–Portugal. Ph.D. Thesis, Universidade Nova de Lisboa, Lisbon, Portugal, 2015.
50. INE. Estatísticas Do Turismo; INE: Lisbon, Portugal, 2019.51. European Commission. Regional Innovation Monitor (RIM) Plus, Internal Market, Industry, Entrepreneurship and SMEs; European
Commission: Brussels, Belgium, 2020.
Sustainability 2021, 13, 8840 24 of 24
52. INE. Censos 2011–Resultados Definitivos; INE: Lisbon, Portugal, 2011.53. INE. Statistics Portugal, Annual Estimates of Resident Population; INE: Lisbon, Portugal, 2019.54. Gonçalves, J. DEM SRTM. Available online: http://www.fc.up.pt/pessoas/jagoncal/srtm (accessed on 2 July 2019).55. McGarigal, K.; Cushman, S.; Neel, M.; Ene, E.; McGarigal, K.; Cushman, S.A.; Neel, M.C.; Ene, E. FRAGSTATS: Spatial Pattern
Analysis Program for Categorical Maps. Computer Software Program Produced by the Authors at the University of Massachusetts,Amherst. 2002. Available online: www.Umass.Edu/Landeco/Research/Fragstats/Fragstats.Html (accessed on 3 December 2020).
56. Berry, W.; Feldman, S. Multiple Regression in Practice; Sage University Paper: Thousand Oaks, CA, USA, 2021.57. Dutta, V. Land Use Dynamics and Peri-Urban Growth Characteristics Reflections on Master Plan and Urban Suitability from a
Sprawling North Indian City. Environ. Urban Asia 2012, 3, 277–301. [CrossRef]58. Kasango, M.; Barredo, J.; Lavalle, C.; McCormick, N.; Demicheli, L.; Sagris, V.; Brezger, A. Are European Cities Becoming
Dispersed? A Comparative Analysis of Fifteen European Urban. Areas. Landsc. Urban Plan. 2006, 77, 111–130. [CrossRef]59. Kedron, P.; Zhao, Y.; Frazier, A.E. Three Dimensional (3D) Spatial Metrics for Objects. Landsc. Ecol. 2019, 34, 2123–2132. [CrossRef]60. Magarotto, M.; Costa, M.; Tenedório, J.; Silva, C. Vertical Growth in a Coastal City: An Analysis of Boa Viagem (Recife, Brazil). J.
Coast. Conserv. 2016, 20. [CrossRef]61. Magarotto, M.; Costa, M.; Tenedório, J.; Silva, C.; Pontes, T. Methodology for the Development of 3D GIS Models in the Coastal
Zone. J. Coast. Res. 2014, 70, 479–484. [CrossRef]