clustering of the kenyan general insurance risk classes by
TRANSCRIPT
Mathematical Theory and Modeling www.iiste.org
ISSN 2224-5804 (Paper) ISSN 2225-0522 (Online)
Vol.4, No.13, 2014
72
Clustering of the Kenyan General Insurance Risk Classes by the
Archimedean Copula Theory
Joseph Kyalo Mung’atu1*
, Patrick Guge Weke2 and Samuel Musili Mwalili
1
1. Department of Statistics and Actuarial Science, Jomo Kenyatta University of Agriculture and
Technology P.O. Box 62000 - 00200 NAIROBI, Kenya
2. School of Mathematics, University of Nairobi, P. O. Box 30197, Nairobi, 00100 - Kenya
* E-mail of the corresponding author: [email protected] or [email protected]
Abstract
Dependence between risks reduces the benefits of diversification. Modern portfolio theory is based on
correlation as a measure of dependence while the criterion presented here is based on the copula theory as a
measure of the intrinsic relatedness of different risks classes. The dependencies are examined by fitting copulas,
estimating the dependence parameters and lastly using distance matrices to cluster the similar risks together. The
study derives its data from the general insurance business in Kenya. The motivation of the study was driven by
the fact that insurance companies had collapsed in the past, one reason being the type of business classes they
engage in. It is therefore important to understand the dependencies between risks for better risk management.
Five major clusters stood out each with peculiar characteristics. The first cluster constituted the lines with a high
probability of a huge claim amount: Engineering, Liability, Fire industrial and Theft. The second contains lines
with moderate claim amounts as compared to the previous cluster but are rather slightly more frequent: Fire
domestic, Personal accident, Workman’s compensation, Motor commercial and motor private. In the following
cluster we have the less popular lines under the umbrella of the miscellaneous class. Marine and Transit which is
completely erratic clusters singly while the Aviation line whose main business is exported to foreign countries
forming the last cluster. This will assist the companies seeking diversification of their risk portfolio and also
entry into re-insurance treaties as a criterion for the determination of forwarding proportions is proposed here.
Keywords: Copula, Measures of dependence, Cluster, Distances, Lines of business
1. Introduction
Once a risk is insured, it is reasonable that the standards for classifying that risk can and should be different from
those of marketing and/or underwriting. The variables comprising a classification system should be chosen so
that the following guidelines or conditions in addition, of course, to any legal requirements regarding fair
discrimination, are generally adhered to in keeping with Walter (1981) who writes on risk classification
standards. The whole modern portfolio theory is based on correlation (see Burgi, Dacorogna, and Iles (2008)) as
a measure of dependence but the criterion used here is based on the copula theory which is handy when
correlation assumptions are violated.
Frees and Valdez (1997) introduces actuaries to the concept of ‘‘copulas’’, as a tool for understanding
relationships among multivariate outcomes. The work explores some of the practical applications, including
estimation of joint life mortality and multiple decrement models and showed how to fit copulas and hence
described their usefulness by pricing a reinsurance contract and estimating expenses for pre-specified losses.
Motivated by the fact that most of the Economic Capital assessment models encounter difficulties when trying to
incorporate the dependence of claim costs between different Lines of Business (LOBs), Faivre (2003) suggested
the use of copula theory as a solution to this problem. Other useful literature include: Embrechts, et al. (2002),
Frees and Wang (2004), Pettere and Kollo (2006), Wu, Valdez and Sherris (2006), Gatzert, Schmeiser and
Schuckmann, (2008) and Filler, Odening, Okhrin and Xu (2009). Faivre (2003) use Copulas to model the overall
distribution of claim costs of four-Lines of Business company. The work utilized different copulas to show that
Mathematical Theory and Modeling www.iiste.org
ISSN 2224-5804 (Paper) ISSN 2225-0522 (Online)
Vol.4, No.13, 2014
73
the dependence structure has a substantial impact on the Economic Capital of that firm. Mung’atu, Mwalili and
Weke (2011) extended to cover lines of business with sub-classes by employing the Hierarchical Archimedean
Copulas. This work proposes the use of the copula theory to model the dependence between business classes
and later clustering them into larger homogeneous clusters. The paper is presented in the various sections:
introduction; methodology which constitutes: the copula function, distances, clustering, methodology, empirical
results; conclusion and recommendations.
1.1. Measures of dependence
Measures of dependence summarize a complicated dependence structure in a single value, in the bivariate case.
The three important concepts in measuring dependence include: the linear correlation, rank correlation and the
coefficients of tail dependence. The last two provide perhaps the best alternatives to the linear correlation
coefficient as a measure of dependence for non-elliptical distributions. Copulas capture the properties of the joint
distributions since they are invariant, that is, they remain unchanged under strictly increasing transformations of
the random variables.
2. Methodology
2.1. The copula function
The term copula was first used in the work of Sklar (1959) and is derived from the Latin word copulare, meaning
to connect or to join and has recently found an extensive acceptance in risk management, financial and insurance
applications. The main purpose of copulas is to describe the interrelation of several random variables. A copula is
a function that joins or couples a multivariate distribution function to univariate marginal distribution functions
and so a copula is a multivariate distribution function. The operational definition of a copula is a multivariate
distribution function defined on the unit cube 0,1n, with uniformly distributed marginals (see Nelsen, 2006).
Definition 1: A two-dimensional copula function (or a 2-copula) is defined as a binary function 2:[0,1] [0,1]C ,
which satisfies the following three properties:
1 2 1 2
1 1 2 2 2 2 1, 2 2 1 1 1
1. ( ,0) (0, ) 0 for any [0,1].
2. ( ,1) (1, ) for any [0,1].
3. For all 0 1 and 0 1
([ , ] [ , ]) ( , ) ( ) ( , ) ( , ) 0.
C u C u u
C u C u u u
u u v v
C u v u v C u v C u v C u v C u v
(1)
From the properties 1-3, when the arguments u and v are univariate distribution functions F1 and F2, the copula
function C(F1; F2) is a legitimate bivariate distribution function with marginals F1 and F2. Conversely, any
bivariate distribution function H(x; y) with continuous marginals F1 and F2 admits a unique representation as a
copula function:
1 1
1 2( , ) ( ), ( )C u v H F u F v (2)
In general, an n-dimensional Copula is any function C: 0,1 0,1n such that:
1. C is grounded and n-increasing
2. C has margins , 1,2,..., ,kC k n which satisfy ( )kC u u for all in 0,1 .u
It is also important to note that for any n-copula, 3n , each k-dimensional margin of C is a k-copula.

Mathematical Theory and Modeling www.iiste.org
ISSN 2224-5804 (Paper) ISSN 2225-0522 (Online)
Vol.4, No.13, 2014
74
2.1.1. Archimedean copulas
Definition 2: Let : 0,1 0, be a continuous, strictly decreasing and convex function such that 1 0
and 0 . The function φ has an inverse 1 : 0, 0,1 with the same properties like φ, except that
1 0 1 and 1 0 .
Definition 3: The function : 0,1 0,1n
C defined by
1
1 1, , n nC u u u u (3)
is called n-dimensional Archimedean copula if and only if 1 is completely monotonic on 0, , that is
11 0 for k
k
ku k
u
(4)
The function is called the generator of the copula. We assume that the generator has only one parameter,
denoted as . The three often used Archimedean copulas include: Clayton, Gumbel, and Frank.
The Clayton copula: This is an asymmetric Archimedean copula, exhibiting greater dependence in the negative
tail than in the positive. This copula is given by 1
, max 1 ,0C u v u v
and its generator is
1
1x x
where 1, \ 0 . The relationship between Kendall's tau and the Clayton copula
parameter is given by 2 1 .
The Gumbel copula: also referred to as the Gumbel-Hougard copula, is an asymmetric Archimedean copula,
exhibiting greater dependence in the positive tail than in the negative. This copula is given by
1
( , ) exp ln lnC u v u v
and its generator is ( ) lnx x
where 1, . The
relationship between Kendall's tau and the Gumbel copula parameter is given by 1 1 .
The Frank copula: The Frank copula is a symmetric Archimedean copula given by
1 11
, ln 11
u ve eC u v
e
and its generator is exp( ) 1
( ) lnexp( ) 1
xx
where
, \ 0 . The relationship between Kendall's tau and the Frank copula parameter is given by
1 1 1
4
D
where 1
0
1
1t
tD dt
e
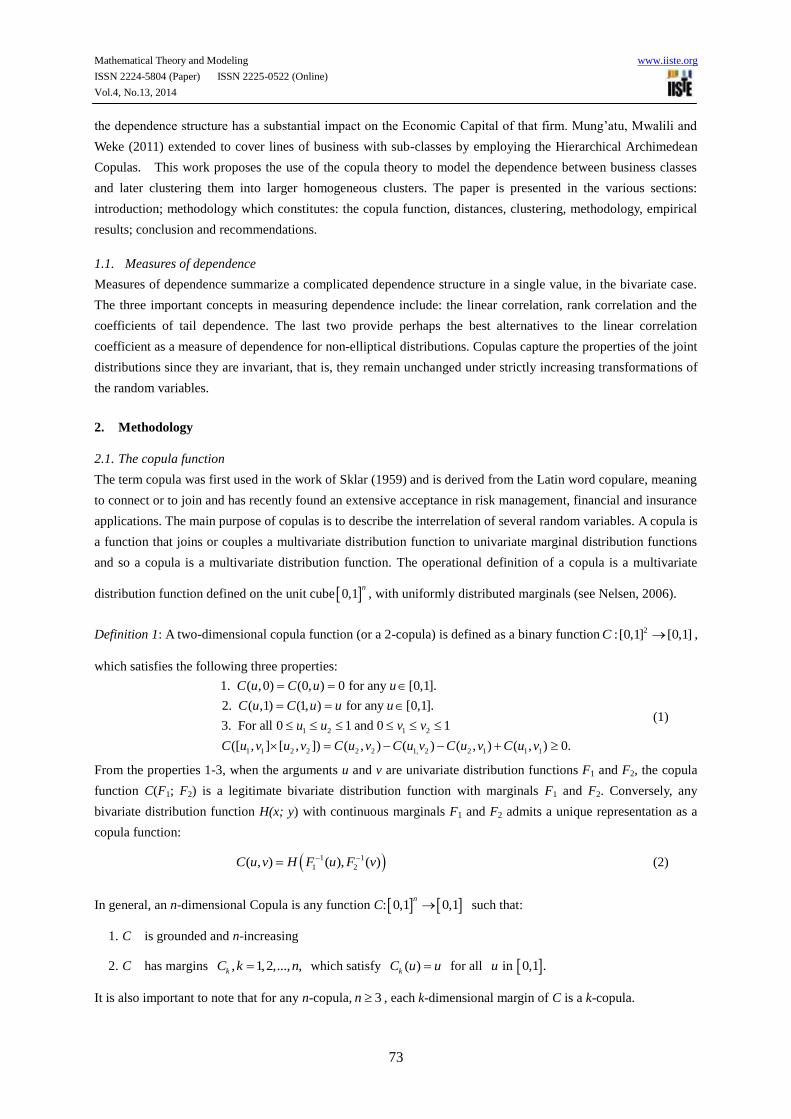
is a Debye function of the first kind. Figure 1 shows the tail
dependencies for the three Archimedean copulas. The Clayton is strong on the lower tail dependence; Frank has
no tail dependence while the Gumbel is good for modelling the upper tail dependence.
Mathematical Theory and Modeling www.iiste.org
ISSN 2224-5804 (Paper) ISSN 2225-0522 (Online)
Vol.4, No.13, 2014
75
x
0.0
0.2
0.4
0.6
0.8
1.0
y
0.0
0.2
0.4
0.6
0.8
1.0
Density
0
5
10
15
20
25
Clayton
x
0.0
0.2
0.4
0.6
0.8
1.0
y
0.0
0.2
0.4
0.6
0.8
1.0
Density
1
2
3
4
5
Frank
x
0.0
0.2
0.4
0.6
0.8
1.0
y
0.0
0.2
0.4
0.6
0.8
1.0
Density
0
5
10
15
Gumbel
(a) (b) (c)
Figure 1: Perspective plots for the (a) Clayton, (b) Frank and (c) Gumbel copulas
2.2. Distances
Distance is a numerical description of how far apart objects are. When distances are calculated between various
objects, this culminates into a distance matrix.
Definition 4: A metric on a set X is a function, called the distance function or simply distance,
:d X X (where is the set of real numbers). For all x, y, z in X, this function is required to satisfy the
following conditions:
1. d(x, y) ≥ 0 (non-negativity)
2. d(x, y) = 0 if and only if x = y (identity of indiscernible).
Condition 1 and 2 together produce positive definiteness
3. d(x, y) = d(y, x) (symmetry)
4. d(x, z) ≤ d(x, y) + d(y, z) (subadditivity/triangle inequality).
2.2.1. Euclidean distances
The well-known distance is the Euclidean distance which is defined as
2( , ) , ( ) ( ) ( )x y x yT
i i
i
d x y x y x y (with x being the norm of x, and ix and
iy being the
i-th element of x and y). The Euclidean distances were used as the criterion to cluster the general insurance risk
classes with respect to the spearman’s rho, Kendall’s tau and the Tail dependence.
2.2.2. Manhattan distances
This is also known as City Block Distance, boxcar distance, absolute value distance, rectilinear distance,
Minkowski's L1 distance, or taxi cab metric and it is given by n
i i
i
d x y where n is the number of variables,
and ix and iy are the values of the i-th variable, at points X and Y respectively.
2.3. Clustering
Clustering is a technique to group objects based on distance or similarity. It is therefore the assignment, grouping
or segmenting of a set of observations, individuals, cases, or data rows into subsets, called clusters, so that
observations in the same cluster are similar in some sense. The cardinal objective of clustering is to measure the
degree of similarity (or dissimilarity) between the individual objects being clustered. In this work we utilize the

Mathematical Theory and Modeling www.iiste.org
ISSN 2224-5804 (Paper) ISSN 2225-0522 (Online)
Vol.4, No.13, 2014
76
agglomerative approach under the Hierarchical clustering. The algorithm of agglomerative approach to compute
hierarchical clustering is as follows:
(i) Convert object features to distance matrix, in our case we have the matrix of the rank correlation
coefficients and the tail dependence.
(ii) Set each object as a cluster, thus for the twelve general insurance lines of business, we will have twelve
clusters in the beginning.
(iii) Iterate until the number of cluster is one, that is, by merging the two closest clusters and continuously
updating the distance matrix.
2.3.1. Cophenetic correlation coefficient
After the formation of the clusters, the question now is how good is the clustering? There is an index called
Cross Correlation Coefficient or Cophenetic Correlation Coefficient that shows the goodness of fit of our
clustering similar to the Correlation Coefficient of regression. To compute the Cophenetic Correlation
Coefficient of hierarchical clustering, we need a distance matrix and a Cophenetic matrix. To obtain Cophenetic
matrix, we need to fill the distance matrix with the minimum merging distance that we obtain in the previous
cluster objects. Cophenetic Correlation Coefficient is simply correlation coefficient between distance matrix and
Cophenetic matrix.
2.4. The Clustering Algorithm
This is section presents the proposed algorithm for grouping business classes into various lines. For the different
business classes follow the algorithm below to cluster them into their respective lines (or departments):
(i) Fit the Copula function (see section 2.1) for each pair of business classes;
(ii) Estimate the dependence parameter, ;
(iii) Calculate the measures of dependence, the rank correlation (Spearman’s rho or the Kendall’s tau) and
the tail dependence, using the relationships in sub-section 2.1.1;
(iv) Compare closeness of these measures to each other by calculating appropriate distances culminating to
a distance matrix (see section 2.2); and
(v) Cluster the business classes into the various homogeneous lines or departments using the minimum
distance approach (see section 2.3).
This resulted in the highly related classes being in one cluster with the less dependent classes being in different
clusters. The different clusters of business form a diversified portfolio together (with each cluster having
homogeneous lines within). The investment should not pick only those business classes/lines within one cluster
as this will reduce the diversification benefits.
3. Empirical Results
Data that were collected from thirty-five insurance companies who are members of the Insurance Regulatory
Authority (IRA) of Kenya and participating in some class of general insurance for the period 2006 to 2009 were
analysed in this section.

Mathematical Theory and Modeling www.iiste.org
ISSN 2224-5804 (Paper) ISSN 2225-0522 (Online)
Vol.4, No.13, 2014
77
Figure 2: Densities for the twelve classes of business in general insurance, Kenya
A general business insurer, in Kenya, can be registered to transact any or all the twelve classes of general
insurance business namely: aviation, engineering, fire-domestic, fire-industrial, liability, marine, motor-private,
motor-commercial, personal accident, theft, workman’s compensation and miscellaneous. Their densities are
shown in Figure 2 which are positively skewed as one would expect with any theoretical loss distribution.
We now compare the clustering based on the Euclidean distances and the Manhattan distances. We suggest the
use of the cophenetic correlation coefficient in choosing between the best distances to use. The Euclidean
distance performs better than the Manhattan distances, as shown in Table 1 as it consistently produced stronger
correlations than for the Manhattan distances, and so we will base our clustering on the Euclidean distances.
Table 1: Comparison between the performance of the Euclidean and the Manhattan distance
Distance
Measure
Manhattan Euclidean
Cophenetic
correlation Significance
Cophenetic
correlation Significance
Kendall’s tau 0.6580 <0.01 0.9029 <0.01
Spearman’s Rho 0.7041 <0.01 0.7850 <0.01
Tail index 0.6511 <0.01 0.9067 <0.01
Table 2: The dependence parameter, , estimated for each pair of general insurance classes
Av Eng F D F I Liab M & T M P M C P A Theft W C
Eng 5.814
F D 6.025 6.696
F I 6.173 6.906 6.859
Liab 5.770 6.508 6.535 7.097
M & T 5.574 6.171 6.293 6.654 6.580
M P 6.961 7.212 8.219 8.033 7.643 7.085
M C 8.068 8.280 8.764 8.945 8.438 8.112 10.102
P A 6.153 6.815 7.124 7.079 6.832 6.668 8.210 8.814
Theft 6.451 6.957 7.053 7.322 6.911 6.712 7.936 8.536 6.913
W C 6.243 6.976 7.265 7.338 7.170 6.727 8.296 9.260 7.408 7.187
Misc 5.496 6.398 6.566 6.410 6.664 5.917 7.474 7.864 6.669 6.568 6.681

Mathematical Theory and Modeling www.iiste.org
ISSN 2224-5804 (Paper) ISSN 2225-0522 (Online)
Vol.4, No.13, 2014
78
KEY: Av - Aviation, Eng - Engineering, F D - Fire Domestic, F I - Fire Industrial, Liab - Liability, M & T -
Marine and Transit, M P - Motor Private, M C - Motor Commercial, P A - Personal Accident, W C - Workman’s
Compensation, Misc - Miscellaneous.
Table 3: Tail index calculated from the fitted dependence parameter, , for each pair of general insurance
classes
Av Eng F D F I Liab M & T M P M C P A Theft W C
Eng 0.873
F D 0.878 0.891
F I 0.881 0.894 0.894
Liab 0.872 0.888 0.888 0.897
M & T 0.868 0.881 0.884 0.890 0.889
M P 0.895 0.899 0.912 0.910 0.905 0.897
M C 0.910 0.913 0.918 0.919 0.914 0.911 0.929
P A 0.881 0.893 0.898 0.897 0.893 0.890 0.912 0.918
Theft 0.887 0.895 0.897 0.901 0.895 0.891 0.909 0.915 0.895
W C 0.883 0.896 0.900 0.901 0.899 0.891 0.913 0.922 0.902 0.899
Misc 0.866 0.886 0.873 0.886 0.890 0.876 0.903 0.908 0.890 0.889 0.891
Table 4: Euclidean distances from Tail index for each pair of general insurance classes
Av Eng F D F I Liab M & T Misc M C M P P A Theft
Eng 0.183
F D 0.178 0.156
F I 0.178 0.151 0.151
Liab 0.187 0.159 0.160 0.146
M & T 0.189 0.169 0.167 0.159 0.159
Misc 0.192 0.164 0.181 0.166 0.157 0.176
M C 0.176 0.151 0.141 0.132 0.145 0.160 0.167
M P 0.175 0.153 0.134 0.133 0.144 0.161 0.157 0.105
P A 0.178 0.153 0.146 0.146 0.152 0.159 0.160 0.134 0.130
Theft 0.171 0.150 0.148 0.141 0.150 0.158 0.163 0.137 0.135 0.149
W C 0.179 0.151 0.144 0.141 0.145 0.159 0.161 0.125 0.127 0.139 0.144
Table 5: Kendall’s tau calculated from the fitted dependence parameter, , for each pair of general insurance
classes
Av Eng F D F I Liab M & T M P M C P A Theft W C
Eng 0.828
F D 0.834 0.851
F I 0.838 0.855 0.854
Liab 0.827 0.846 0.847 0.859
M & T 0.821 0.838 0.841 0.850 0.848
M P 0.856 0.861 0.878 0.876 0.869 0.859
M C 0.876 0.879 0.886 0.888 0.881 0.877 0.901
P A 0.837 0.853 0.860 0.859 0.854 0.850 0.878 0.887
Theft 0.845 0.856 0.858 0.863 0.855 0.851 0.874 0.883 0.855
W C 0.840 0.857 0.862 0.864 0.861 0.851 0.879 0.892 0.865 0.861
Misc 0.818 0.844 0.848 0.844 0.850 0.831 0.866 0.873 0.850 0.848 0.850

Mathematical Theory and Modeling www.iiste.org
ISSN 2224-5804 (Paper) ISSN 2225-0522 (Online)
Vol.4, No.13, 2014
79
Table 6: Euclidean distances from the Kendall’s tau for each pair of general insurance classes
Av Eng F D F I Liab M & T Misc M C M P P A Theft
Eng 0.249
F D 0.244 0.212
F I 0.241 0.207 0.207
Liab 0.253 0.218 0.217 0.200
M & T 0.256 0.230 0.228 0.217 0.217
Misc 0.260 0.222 0.218 0.225 0.214 0.239
M C 0.237 0.205 0.189 0.181 0.198 0.217 0.221
M P 0.237 0.209 0.181 0.183 0.197 0.219 0.209 0.146
P A 0.242 0.210 0.199 0.200 0.208 0.217 0.216 0.183 0.179
Theft 0.232 0.205 0.202 0.194 0.206 0.216 0.220 0.187 0.185 0.205
W C 0.242 0.206 0.196 0.193 0.200 0.217 0.218 0.171 0.175 0.191 0.197
Table 7: Spearman’s rho calculated from the fitted dependence parameter, , for each pair of general insurance
classes
Av Eng F D F I Liab M & T M P M C P A Theft W C
Eng 0.958
F D 0.960 0.968
F I 0.963 0.970 0.969
Liab 0.957 0.966 0.966 0.971
M & T 0.954 0.962 0.964 0.968 0.967
M P 0.970 0.972 0.978 0.978 0.975 0.971
M C 0.978 0.979 0.981 0.982 0.980 0.978 0.986
P A 0.962 0.969 0.971 0.971 0.969 0.968 0.978 0.981
Theft 0.965 0.970 0.971 0.973 0.970 0.968 0.977 0.980 0.970
W C 0.963 0.970 0.973 0.973 0.972 0.968 0.979 0.983 0.974 0.972
Misc 0.953 0.965 0.967 0.965 0.968 0.959 0.974 0.977 0.968 0.967 0.968
Table 8: Euclidean distances from the spearman’s rho for each pair of general insurance
Av Eng F D F I Liab M & T Misc M C M P P A Theft
Eng 0.064
F D 0.063 0.046
F I 0.062 0.044 0.044
Liab 0.067 0.048 0.048 0.042
M & T 0.067 0.054 0.054 0.049 0.048
Misc 0.069 0.051 0.049 0.053 0.047 0.058
M C 0.072 0.053 0.046 0.042 0.049 0.060 0.060
M P 0.066 0.049 0.038 0.037 0.044 0.055 0.051 0.025
P A 0.063 0.045 0.041 0.041 0.044 0.049 0.049 0.042 0.036
Theft 0.059 0.044 0.042 0.038 0.044 0.049 0.051 0.043 0.038 0.043
W C 0.064 0.045 0.040 0.038 0.042 0.050 0.050 0.037 0.033 0.037 0.040
The estimated dependence parameter, , in Table 2 was used to calculate Table 3 whose distances were
calculated and recorded in Table 4. The larger the dependence parameter, , the stronger the dependence

Mathematical Theory and Modeling www.iiste.org
ISSN 2224-5804 (Paper) ISSN 2225-0522 (Online)
Vol.4, No.13, 2014
80
between pairs of business lines and this leads to a high dependence measure value. Table 4 produce the clusters
in Figure 3 which relates to the tail index. A similar approach is done on the Kendall’s tau and the Spearman’s
rho with Tables 6 and 8 leading to Figures 4 and 5 respectively. The three dependence measures are consistent
since they produce the same clustering structure as evident from Figures 3, 4 and 5.
This work proposes the use of the upper tail dependence derived from the dependence parameter in determining
the retention limits for a re-insurance arrangement. Though the dependence is not the only factor to consider for
such re-insurance treaties (Straub 1997) the forwarding proportions should be somewhere proportional to 1/(1 −
Tail index). This will ensure that for highly dependent risks in the upper tail will forward higher proportion to the
re-insurer and vice versa. The behaviour of this proposed quantity is found in Figure
6.
Figure 3: The general insurance classes clustered by the Euclidean distances for the Tail index
Figure 4: The general insurance classes clustered by the Euclidean distances for the Kendall’s tau

Mathematical Theory and Modeling www.iiste.org
ISSN 2224-5804 (Paper) ISSN 2225-0522 (Online)
Vol.4, No.13, 2014
81
Figure 5: The general insurance classes clustered by the Euclidean distances for the Spearman’s rho
Figure 6: The proposed re-insurance proportions in relation to the tail index
The criteria based on the three dependence measures arrived at five major clusters each with peculiar
characteristics. The first cluster involves the business classes/lines with a high probability of a huge claim
amount lines: Engineering, Liability, Fire industrial and Theft. The second contain lines with moderate claim
amounts as compared to the previous cluster but rather slightly more frequent: Fire domestic, Personal accident,
Workman’s compensation, Motor commercial and motor private. In the following cluster we have the less
popular lines under the umbrella of the miscellaneous class. Marine and Transit which is completely erratic
clusters alone while the Aviation line whose main business is exported to foreign countries forming the last
cluster. When setting up or restructuring a company it is advisable to select the lines of business from different
clusters. This results in a diversified portfolio hence the company enjoys diversification benefits.
4. Conclusion and Recommendations
4.1. Conclusion
The choice of distances for clustering is very crucial as they can vary depending on the problem at hand.
Comparison of the results obtained by different cluster analysis methods result different dendrograms and that
the cluster analysis should be used. This problem can be surmounted by comparing the cophenetic distances to
the initial distances computed as suggested in this manuscript. Just as we suggested, an insurance company can
employ the use of tail dependence index to approximate the proportion of retentions in the case of reinsurance
arrangements. Finally, it can be observed that with the dendrograms one can choose the number of efficient
divisions in the company by just moving up or down the dendrogram tree.

Mathematical Theory and Modeling www.iiste.org
ISSN 2224-5804 (Paper) ISSN 2225-0522 (Online)
Vol.4, No.13, 2014
82
4.2. Recommendations
We recommend to all investors establishing general insurance business to first consider the dependence structure
so as to arrive at a diversified portfolio in order to benefit from diversification benefits. The business classes that
form their own individual clusters like the Aviation, Miscellaneous, Marine and Transit should be given special
attention when a company engages in them as they present peculiar characteristics within themselves. We do also
recommend that the insurance regulator uses the methods outlined in this study in order to understand the
dependencies between insurance classes for advisory purposes. This is due to the fact that there may be no single
insurance company that operates all the insurance classes for it to have sufficient data. Finally, the proposed
algorithm is long and tedious but this can be made easier by having dedicated computer software.
References
1 Burgi, R. B., Dacorogna, M. M. and Iles, R. (2008). Risk Aggregation, Dependence Structure and
Diversification Benefit. Stress Testing for Financial Institutions. http://ssrn.com/=1468526.
2 Embrechts, P., McNeil, A., and Straumann, D. (2002). Correlation and Dependence in Risk Management:
Properties and Pitfalls. In Dempster M. A. H. (ed.). Risk Management: Value at Risk and Beyond, pp.
176–223. Cambridge University Press, Cambridge.
3 Faivre, F. (2003): Copula: A New Vision for Economic Capital and Application to a Four Line of Business
Company. Paper presented at ASTIN Colloquium, Berlin.
4 Filler, G., Odening, M., Okhrin O., and Xu, W. (2009). "On the Systemic Nature of Weather Risk," SFB 649
Discussion Papers SFB649DP2009-002, Sonderforschungsbereich 649, Humboldt University, Berlin,
Germany.
5 Frees E.W. and Valdez E.A. (1997) Understanding Relationships using copulas, 32nd
Actuarial Research
Conference, University of Calgary.
6 Frees, E. W. and Wang, P. (2004). Credibility Using Copulas. University of Wisconsin, Madison.
7 Gatzert, N., Schmeiser, H., and Schuckmann, S. (2008). Enterprise Risk Management in Fiancial Groups:
Analysis of Risk Concentration and Default Risk. Financial Markets and Portfolio Management, 22(3),
241-258.
8 Mung’atu, J. K., Mwalili, S. M. and Weke, P. G. O. (2011). Copula Modelling of Insurance Risks with a
Hierarchical Dependence Structure. East African Journal of Statistics. 4(2), pp 10-28
9 Nelsen, R. B. (2006) An Introduction to Copulas, Springer Verlag, New York
10 Pettere, G.,and Kollo, T. (2006). Modelling Claim Size in Time via Copulas.
http://papers.ica2006.com/1A.html.
11 Sklar, M. (1959). Fonctions de répartition à n dimensions et leurs marges. Publications de l’Institut de
Statistique de l’Universit´e de Paris, 8, 229–231.
12 Straub, E. (1997). Non-Life insurance Mathematics. Association of Swiss Actuaries. Berlin.
13 Walters, M. A. (1981). Risk classification standards. Proceedings, “LXVIII, Part 1”, No. 129.
14 Wu, F., Valdez, E. A., Sherris, M., (2006). Simulating exchangeable multivariate Archimedean copulas and
its applications. Working paper, School of Actuarial Studies, university of New South Wales.

The IISTE is a pioneer in the Open-Access hosting service and academic event
management. The aim of the firm is Accelerating Global Knowledge Sharing.
More information about the firm can be found on the homepage:
http://www.iiste.org
CALL FOR JOURNAL PAPERS
There are more than 30 peer-reviewed academic journals hosted under the hosting
platform.
Prospective authors of journals can find the submission instruction on the
following page: http://www.iiste.org/journals/ All the journals articles are available
online to the readers all over the world without financial, legal, or technical barriers
other than those inseparable from gaining access to the internet itself. Paper version
of the journals is also available upon request of readers and authors.
MORE RESOURCES
Book publication information: http://www.iiste.org/book/
IISTE Knowledge Sharing Partners
EBSCO, Index Copernicus, Ulrich's Periodicals Directory, JournalTOCS, PKP Open
Archives Harvester, Bielefeld Academic Search Engine, Elektronische
Zeitschriftenbibliothek EZB, Open J-Gate, OCLC WorldCat, Universe Digtial
Library , NewJour, Google Scholar