clustering petter mostad. clustering vs. class prediction class prediction: class prediction: a...
Post on 20-Dec-2015
221 views
TRANSCRIPT

ClusteringClustering
Petter MostadPetter Mostad
Clustering vs. class Clustering vs. class predictionprediction
Class prediction: Class prediction: A A learning setlearning set of objects with known classes of objects with known classes Goal: put new objects into existing classesGoal: put new objects into existing classes Also called: Also called: Supervised learning, Supervised learning, oror classification classification
Clustering: Clustering: No learning set, no given classesNo learning set, no given classes Goal: discover the ”best” classes or groupingsGoal: discover the ”best” classes or groupings Also called: Also called: Unsupervised learningUnsupervised learning, or , or class class
discoverydiscovery
OverviewOverview
General clustering theoryGeneral clustering theory Steps, methods, algorithms, issues...Steps, methods, algorithms, issues...
Clustering microarray dataClustering microarray data Recommendations for this kind of dataRecommendations for this kind of data
Programs for clusteringPrograms for clustering Some other visualization techniquesSome other visualization techniques

Issues in clusteringIssues in clustering
Used to Used to exploreexplore and and visualizevisualize data, with data, with few preconceptionsfew preconceptions
Many subjective choices must be made, Many subjective choices must be made, so a clustering output tends to be so a clustering output tends to be subjectivesubjective
It is difficult to get truly statistically It is difficult to get truly statistically ”significant” conclusions”significant” conclusions
Algorithms will always produce clusters, Algorithms will always produce clusters, whether any exist in the data or notwhether any exist in the data or not

Steps in clusteringSteps in clustering
1.1. Feature selection and extractionFeature selection and extraction
2.2. Defining and computing similaritiesDefining and computing similarities
3.3. Clustering or grouping objectsClustering or grouping objects
4.4. Assessing, presenting, and using Assessing, presenting, and using the resultthe result

1. Feature selection and 1. Feature selection and extractionextraction
Deciding which measurements Deciding which measurements matter for similaritymatter for similarity
Data reductionData reduction Filtering away objectsFiltering away objects Normalization of measurementsNormalization of measurements
The data matrixThe data matrix
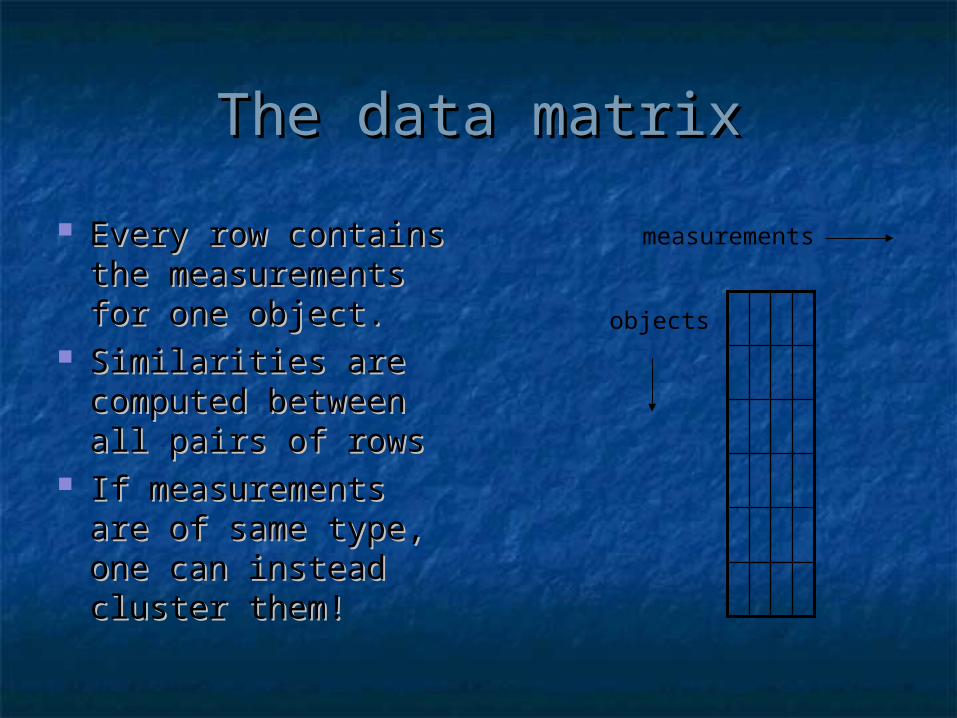
Every row contains Every row contains the measurements the measurements for one object. for one object.
Similarities are Similarities are computed between computed between all pairs of rows all pairs of rows
If measurements are If measurements are of same type, one of same type, one can instead cluster can instead cluster them! them!
measurements
objects

2. Defining and computing 2. Defining and computing similaritiessimilarities
Similarity measures for continuous Similarity measures for continuous data vectors: data vectors: Euclidean distance Euclidean distance
Minkowski distance (including Minkowski distance (including Manhattan metric)Manhattan metric)
Mahalanobis distance where S Mahalanobis distance where S is a covariance matrixis a covariance matrix
),...,( 1 nxxx ),...,( 1 nyyy
n
iii yx
1
2)(
pn
i
p
ii yx/1
1
yxS 1

Centered and non-centered (absolute) Centered and non-centered (absolute) Pearson correlationPearson correlation
centered: centered:
non-centered: non-centered:
where where Spearman rank correlationSpearman rank correlation
Compute the ranking of the numbers in each Compute the ranking of the numbers in each vectorvector
Find correlation between ranking numbersFind correlation between ranking numbers ........
n
i
n
iii
n
iii
yyxx
yyxx
1 1
22
1
)()(
))((
n
i
n
iii
n
iii
yx
yx
1 1
22
1
n
iixn
x1
1
n
iiyn
y1
1

Geometrical view of Geometrical view of clusteringclustering
If measurements are If measurements are coordinates, objects coordinates, objects become points in some become points in some spacespace
If the simiarity measure If the simiarity measure is Euclidean distance, is Euclidean distance, the goal is to group the goal is to group nearby pointsnearby points
Note: When we have Note: When we have only 2 or 3 only 2 or 3 measurements per measurements per object, we can do better object, we can do better than most algorithms than most algorithms using visual inspectionusing visual inspection
2 3 4 5 6 7
02
46
8

Similarity measures for Similarity measures for discrete datadiscrete data
Comparing two binary vectors, count the Comparing two binary vectors, count the numbers a,b,c,d of 1-1’s, 1-0’s, 0-1’s, and numbers a,b,c,d of 1-1’s, 1-0’s, 0-1’s, and 0-0’s, respectively 0-0’s, respectively
Construct different similarity Construct different similarity measurements based on these numbers: measurements based on these numbers:
Similarity of for example trees or other Similarity of for example trees or other objects can be defined in reasonable waysobjects can be defined in reasonable ways
dcba
da
dcba
a
cba
a
dcba
ba
)(2
)(2 ...

Similarities using contextsSimilarities using contexts
Mutual Neighbour Distance:Mutual Neighbour Distance:
where is the neighbour number where is the neighbour number of x with respect to yof x with respect to y
This is not a metric, but similarities This is not a metric, but similarities do not need to be based on metrics. do not need to be based on metrics.
),(),(),( xyNNyxNNyxMND ),( yxNN
3. Clustering or grouping3. Clustering or grouping
Hierarchical clusteringsHierarchical clusterings Divisive: Starts with one big cluster and Divisive: Starts with one big cluster and
subdivides on cluster in each stepsubdivides on cluster in each step Agglomerative: Starts with each object Agglomerative: Starts with each object
in separate cluster. In each step, joins in separate cluster. In each step, joins the two closest clustersthe two closest clusters
Partitional clusteringsPartitional clusterings Probabilistic or fuzzy clusteringsProbabilistic or fuzzy clusterings

Hierarchical clusteringHierarchical clustering
Agglomerative clustering depends on type of Agglomerative clustering depends on type of linkage, linkage, i.e., how to compute the distance i.e., how to compute the distance between merged cluster (UV) and old cluster (W): between merged cluster (UV) and old cluster (W): d(UV, W) = min(d(U, W), d(V,W)) (single linkage)d(UV, W) = min(d(U, W), d(V,W)) (single linkage) d(UV, W) = max(d(U,W), d(V,W)) (complete linkage)d(UV, W) = max(d(U,W), d(V,W)) (complete linkage) d(UV, W) = average over all distances between objects d(UV, W) = average over all distances between objects
in (UV) and objects in W (average linkage, or UPGMA: in (UV) and objects in W (average linkage, or UPGMA: Unweighted Pair Group Method with Arithmetic mean)Unweighted Pair Group Method with Arithmetic mean)
The output is a The output is a dendrogramdendrogram A simplification of average linkage is often A simplification of average linkage is often
implemented (“average group linkage”): It may implemented (“average group linkage”): It may lead to inverted dendrograms! lead to inverted dendrograms!

Dendrograms, visualizationsDendrograms, visualizations
The data matrix is often visualized using The data matrix is often visualized using three colors, representing positive, three colors, representing positive, negative, and zero values. negative, and zero values.
Hierarchical clustering results often Hierarchical clustering results often represented with a dendrogram. The represented with a dendrogram. The similarity at which clusters merge should similarity at which clusters merge should correspond to height of corresponding correspond to height of corresponding horizontal line in dendrogram! horizontal line in dendrogram!
To display the dendrogram, the objects To display the dendrogram, the objects (lines or columns) need to be (lines or columns) need to be sorted, sorted, this this can be done in two ways at every time can be done in two ways at every time when two clusters are merged. when two clusters are merged.


Ward’s hierarchical Ward’s hierarchical clusteringclustering
Agglomerative. Agglomerative. Goal: minimize ”Error Sum of Squares” Goal: minimize ”Error Sum of Squares”
(ESS) at every step. (ESS) at every step. ESS = The sum over all clusters, of the sum of ESS = The sum over all clusters, of the sum of
the squares of the distances from the objects the squares of the distances from the objects to the cluster centroid. to the cluster centroid.
When joining two clusters, find the pair When joining two clusters, find the pair that results in the smallest increase in that results in the smallest increase in ESS. ESS.

Partitional clusteringsPartitional clusterings
The number of desired clusters is fixed at The number of desired clusters is fixed at the startthe start
K-means clustering:K-means clustering: Partition into k initial clustersPartition into k initial clusters Iteratively, reassign points to groups with the Iteratively, reassign points to groups with the
closest centroid. Recompute centroids.closest centroid. Recompute centroids. Repeat until stabilityRepeat until stability The result may depend on initial clustersThe result may depend on initial clusters May include a procedure joining or splitting May include a procedure joining or splitting
clusters according to sizeclusters according to size The choice of number of clusters may not The choice of number of clusters may not
be obvious be obvious

Probabilistic or fuzzy Probabilistic or fuzzy clusteringclustering
The output is, for each object and each cluster, The output is, for each object and each cluster, a probability or weight that the object belongs a probability or weight that the object belongs to the clusterto the cluster
Example: The observations are modelled as Example: The observations are modelled as produced by drawing from a number of produced by drawing from a number of probability densities (often multivariate probability densities (often multivariate normal). Parameters are then estimated with normal). Parameters are then estimated with Maximum Likelihood (for example using EM Maximum Likelihood (for example using EM algorithm). algorithm).
Example: A ”fuzzy” version of k-means, where Example: A ”fuzzy” version of k-means, where weights for objects are changed iteratively weights for objects are changed iteratively

Neural networks for Neural networks for clusteringclustering
Neural networks are mathematical Neural networks are mathematical models made to be similar to actual models made to be similar to actual neural networksneural networks
They consist of layers of nodes that They consist of layers of nodes that send out ”signals” based send out ”signals” based probabilistically on input signalsprobabilistically on input signals
Most known uses are classifications, Most known uses are classifications, i.e., with learning setsi.e., with learning sets

Self-Organising Maps (SOM)Self-Organising Maps (SOM)
Clustering as optimizationClustering as optimization
Given similarity definition and definition of Given similarity definition and definition of what is an ”optimal” clustering, it can often what is an ”optimal” clustering, it can often be a huge algorithmic challenge to find the be a huge algorithmic challenge to find the optimum. optimum.
Example: Subdivide many thousand objects Example: Subdivide many thousand objects into 50 clusters, minimizing e.g. the sum of into 50 clusters, minimizing e.g. the sum of the squared distances to centroids. the squared distances to centroids.
Then, algorithms for optimization are Then, algorithms for optimization are central. central.

Genetic algorithmsGenetic algorithms
Tries to use ”evolution” to obtain good Tries to use ”evolution” to obtain good solutions to a problemsolutions to a problem
A number of solutions are kept at every step: A number of solutions are kept at every step: They may then mate or mutate, to produce They may then mate or mutate, to produce new solutions. The ”fittest” solutions are kept. new solutions. The ”fittest” solutions are kept.
Can be seen as an optimization algorithmCan be seen as an optimization algorithm A great challenge to design ways of mating A great challenge to design ways of mating
and mutating that produce an efficient and mutating that produce an efficient algorithmalgorithm

Simulated annealingSimulated annealing
A general optimization techniqueA general optimization technique Iterative: At every step, nearby solutions Iterative: At every step, nearby solutions
are chosen with probabilities depending on are chosen with probabilities depending on their optimality (so even less optimal their optimality (so even less optimal solutions may be chosen)solutions may be chosen)
As the algorithm proceeds, and the As the algorithm proceeds, and the ”temperature” sinks, the probability of ”temperature” sinks, the probability of choosing less optimal solutions also sinks. choosing less optimal solutions also sinks.
Is a good general way to avoid local Is a good general way to avoid local optima. optima.

4. Assessing and using the 4. Assessing and using the resultresult
Visualization and summarization of Visualization and summarization of the clustersthe clusters
Note: You should always investigate Note: You should always investigate the dependence of your results on the dependence of your results on the choices you have made for the the choices you have made for the clustering! clustering!

Examples of applications of Examples of applications of clusteringclustering
Image analysisImage analysis Speech recognitionSpeech recognition Data miningData mining ........

Clustering microarray dataClustering microarray data
Samples are columns, Samples are columns, genes are rows, in genes are rows, in data matrixdata matrix
What values to What values to cluster? cluster?
What is a biologically What is a biologically relevant measure of relevant measure of similarity? similarity?
One can cluster genes One can cluster genes and/or samplesand/or samples
samples
genes

Clustering microarray dataClustering microarray data
Use logged data, usuallyUse logged data, usually Data should be on same scale (but usually is if you use data Data should be on same scale (but usually is if you use data
that is already normalized)that is already normalized) You may have to filter away genes that show too little You may have to filter away genes that show too little
variation over samples.variation over samples. Use an appropriate distance measure for the question you Use an appropriate distance measure for the question you
want to focus on (Pearson correlation often works OK). want to focus on (Pearson correlation often works OK). Use appropriate clustering algorithm (Hierarchical average Use appropriate clustering algorithm (Hierarchical average
linkage usually works OK). linkage usually works OK). If you draw some conclusion from the clustering results, try If you draw some conclusion from the clustering results, try
to vary your clustering choices to see how stable these to vary your clustering choices to see how stable these results are. results are.
Clustering works best as a tool to generate hypotheses and Clustering works best as a tool to generate hypotheses and ideas, which may then be tested in other ways. ideas, which may then be tested in other ways.

Clustering tumor samplesClustering tumor samples

Clustering to confirm or reject Clustering to confirm or reject hypotheses?hypotheses?
A clustering may appear to validate, or be validated A clustering may appear to validate, or be validated by, a grouping derived by using other databy, a grouping derived by using other data
Caution: The many different ways to do a clustering Caution: The many different ways to do a clustering may make it possible to tweak it to produce the may make it possible to tweak it to produce the clusters you wantclusters you want
There is a huge and complex multiple testing There is a huge and complex multiple testing problemproblem
Note that small changes in data can change result Note that small changes in data can change result dramaticallydramatically
If you insist on trying to get ”significance”: If you insist on trying to get ”significance”: Using permutations of dataUsing permutations of data Using resampling of data (bootstrapping)Using resampling of data (bootstrapping)
How to do clustering: How to do clustering: ProgramsPrograms
A good program for clustering and visualization: A good program for clustering and visualization: HCEHCE Great visualization optionsGreat visualization options Adapted to microarray dataAdapted to microarray data http://www.cs.umd.edu/hcil/hce/http://www.cs.umd.edu/hcil/hce/ Can import similarity matricesCan import similarity matrices
Classic for microarray data: Cluster & TreeView Classic for microarray data: Cluster & TreeView (Eisen)(Eisen)
R/BioConductor: package cluster, hclust function, R/BioConductor: package cluster, hclust function, heatmap function, ...heatmap function, ...
Many other programs/packagesMany other programs/packages
Other visualization techniques: Other visualization techniques: Principal ComponentsPrincipal Components
The principal components can be viewed as the The principal components can be viewed as the axes of a “better” coordinate system for the data.axes of a “better” coordinate system for the data.
““Better” in the sense that the data is maximally Better” in the sense that the data is maximally spread out along the first principal components. spread out along the first principal components.
The principal components correspond to The principal components correspond to eigenvectors of the covariance matrix of the data. eigenvectors of the covariance matrix of the data.
The eigenvalues represent the part of the total The eigenvalues represent the part of the total variance explained by each of the principal variance explained by each of the principal components. components.

Principal component Principal component analysis of expression dataanalysis of expression data

Principal component Principal component analysis of expression dataanalysis of expression data

Other visualization techniques: Other visualization techniques:
Multidimensional scalingMultidimensional scaling Start with some points in a very high Start with some points in a very high
dimension. dimension. Goal: Display these points in a lower Goal: Display these points in a lower
dimension, so that distances between them dimension, so that distances between them are similar to distances in original dimension. are similar to distances in original dimension.
May also try to preserve only the ranking of May also try to preserve only the ranking of the pairwise distances.the pairwise distances.
Makes it possible to use powerful visual Makes it possible to use powerful visual inspection, in 2 or 3 dimensions. inspection, in 2 or 3 dimensions.
Can sometimes give very convincing pictures Can sometimes give very convincing pictures separating samples in a predicted way. separating samples in a predicted way.