cluster analysis
DESCRIPTION
Cluster Analysis. Dr. Bernard Chen Assistant Professor Department of Computer Science University of Central Arkansas. What is Cluster Analysis?. Cluster: a collection of data objects Similar to one another within the same cluster Dissimilar to the objects in other clusters - PowerPoint PPT PresentationTRANSCRIPT

Cluster Analysis
Dr. Bernard Chen Assistant Professor
Department of Computer Science University of Central Arkansas

What is Cluster Analysis?
Cluster: a collection of data objects Similar to one another within the same
cluster Dissimilar to the objects in other clusters
Cluster analysis Finding similarities between data according
to the characteristics found in the data and grouping similar data objects into clusters

What is Cluster Analysis? Clustering analysis is an important human
activity Early in childhood, we learn how to distinguish
between cats and dogs
Unsupervised learning: no predefined classes
Typical applications As a stand-alone tool to get insight into data distribution As a preprocessing step for other algorithms

Clustering: Rich Applications and Multidisciplinary Efforts
Pattern Recognition Spatial Data Analysis
Create thematic maps in GIS by clustering feature spaces Detect spatial clusters or for other spatial mining tasks
Image Processing Economic Science (especially market research) WWW
Document classification Cluster Weblog data to discover groups of similar access
patterns

Quality: What Is Good Clustering?
A good clustering method will produce high quality
clusters with high intra-class similarity
(Similar to one another within the same cluster)
low inter-class similarity
(Dissimilar to the objects in other clusters)
The quality of a clustering method is also measured by
its ability to discover some or all of the hidden patterns
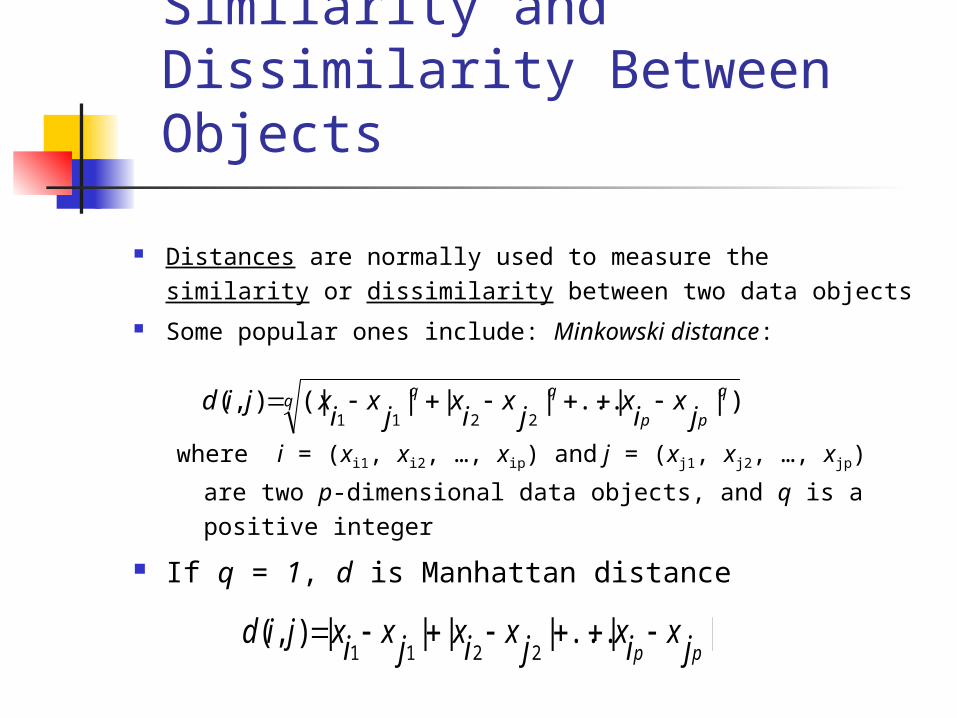
Similarity and Dissimilarity Between Objects
Distances are normally used to measure the similarity or dissimilarity between two data objects
Some popular ones include: Minkowski distance:
where i = (xi1, xi2, …, xip) and j = (xj1, xj2, …, xjp) are
two p-dimensional data objects, and q is a positive integer
If q = 1, d is Manhattan distance
pp
jx
ix
jx
ix
jx
ixjid )||...|||(|),(
2211
||...||||),(2211 pp jxixjxixjxixjid

Similarity and Dissimilarity Between Objects (Cont.)
If q = 2, d is Euclidean distance:
Also, one can use weighted distance, parametric Pearson correlation, or other disimilarity measures
)||...|||(|),( 22
22
2
11 pp jx
ix
jx
ix
jx
ixjid

Major Clustering Approaches Partitioning approach:
Construct various partitions and then evaluate them by some
criterion, e.g., minimizing the sum of square errors
Typical methods: k-means, k-medoids, CLARANS
Hierarchical approach: Create a hierarchical decomposition of the set of data (or objects)
using some criterion
Typical methods: Hierarchical, Diana, Agnes, BIRCH, ROCK,
CAMELEON
Density-based approach: Based on connectivity and density functions
Typical methods: DBSACN, OPTICS, DenClue

Some Other Major Clustering Approaches Grid-based approach:
based on a multiple-level granularity structure
Typical methods: STING, WaveCluster, CLIQUE
Model-based: A model is hypothesized for each of the clusters and tries to find the best fit of that
model to each other
Typical methods: EM, SOM, COBWEB
Frequent pattern-based: Based on the analysis of frequent patterns
Typical methods: pCluster
User-guided or constraint-based: Clustering by considering user-specified or application-specific constraints
Typical methods: COD (obstacles), constrained clustering

Clustering Approaches
1. Partitioning Methods
2. Hierarchical Methods
3. Density-Based Methods

Partitioning Algorithms: Basic Concept
Partitioning method: Construct a partition of a database D of n objects into a set of k clusters, s.t., min sum of squared distance 2
1 )( mimKmtkm tC
mi

Partitioning Algorithms: Basic Concept Given a k, find a partition of k clusters that optimizes
the chosen partitioning criterion
Global optimal: exhaustively enumerate all partitions
Heuristic methods: k-means and k-medoids algorithms k-means (MacQueen’67): Each cluster is represented by the
center of the cluster k-medoids or PAM (Partition around medoids) (Kaufman &
Rousseeuw’87): Each cluster is represented by one of the objects in the cluster
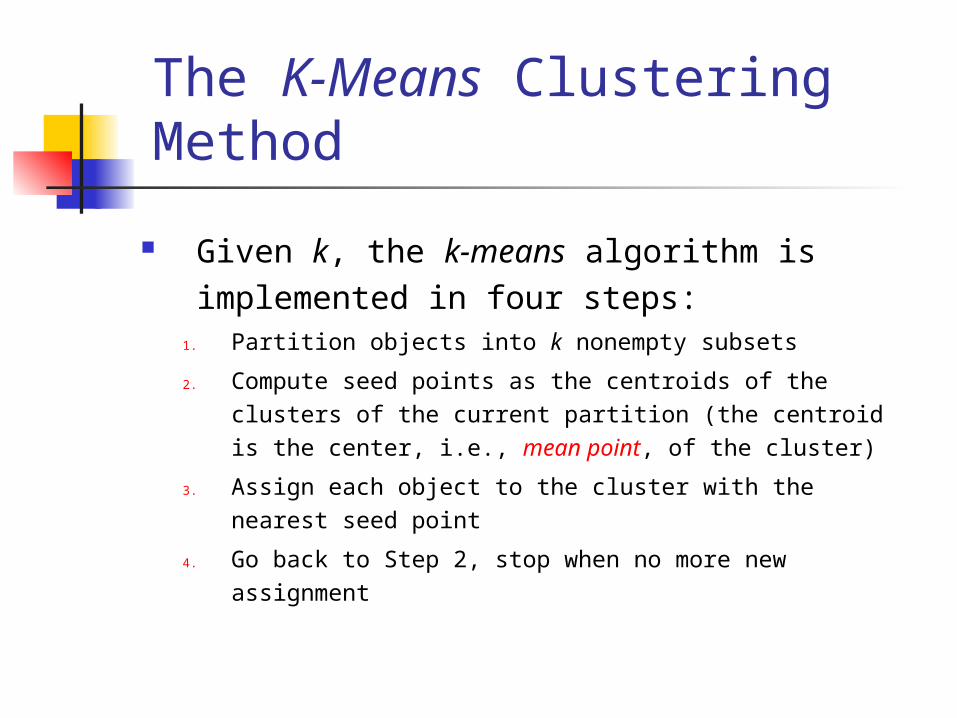
The K-Means Clustering Method
Given k, the k-means algorithm is implemented in four steps:
1. Partition objects into k nonempty subsets
2. Compute seed points as the centroids of the clusters of the current partition (the centroid is the center, i.e., mean point, of the cluster)
3. Assign each object to the cluster with the nearest seed point
4. Go back to Step 2, stop when no more new assignment

K-means Clustering

K-means Clustering

K-means Clustering

K-means Clustering

K-means Clustering

The K-Means Clustering Method
0
1
2
3
4
5
6
7
8
9
10
0 1 2 3 4 5 6 7 8 9 100
1
2
3
4
5
6
7
8
9
10
0 1 2 3 4 5 6 7 8 9 10
0
1
2
3
4
5
6
7
8
9
10
0 1 2 3 4 5 6 7 8 9 10
0
1
2
3
4
5
6
7
8
9
10
0 1 2 3 4 5 6 7 8 9 10
0
1
2
3
4
5
6
7
8
9
10
0 1 2 3 4 5 6 7 8 9 10
K=2
Arbitrarily choose K object as initial cluster center
Assign each objects to most similar center
Update the cluster means
Update the cluster means
reassignreassign

Example
Run K-means clustering with 3 clusters (initial centroids: 3, 16, 25) for at least 2 iterations

Example
Centroids:3 – 2 3 4 7 9 new centroid: 5
16 – 10 11 12 16 18 19 new centroid: 14.33
25 – 23 24 25 30 new centroid: 25.5

Example
Centroids:5 – 2 3 4 7 9 new centroid: 5
14.33 – 10 11 12 16 18 19 new centroid: 14.33
25.5 – 23 24 25 30 new centroid: 25.5

In class Practice
Run K-means clustering with 3 clusters (initial centroids: 3, 12, 19) for at least 2 iterations

Typical Alternatives to Calculate the Distance between Clusters
Single link: smallest distance between an element in one
cluster and an element in the other, i.e., dis(Ki, Kj) = min(tip,
tjq)
Complete link: largest distance between an element in one
cluster and an element in the other, i.e., dis(Ki, Kj) = max(tip,
tjq)
Average: avg distance between an element in one cluster
and an element in the other, i.e., dis(Ki, Kj) = avg(tip, tjq)

Typical Alternatives to Calculate the Distance between Clusters
Centroid: distance between the centroids of two
clusters, i.e., dis(Ki, Kj) = dis(Ci, Cj)
Centroid: the “middle” of a cluster
Medoid: distance between the medoids of two
clusters, i.e., dis(Ki, Kj) = dis(Mi, Mj)
Medoid: one chosen, centrally located object in the
cluster
N
tNi ip
mC)(
1

Comments on the K-Means Method Strength: Relatively efficient: O(tkn), where n is #
objects, k is # clusters, and t is # iterations. Normally, k, t << n.
Weakness Applicable only when mean is defined, then what about
categorical data? Need to specify k, the number of clusters, in advance Unable to handle noisy data and outliers Not suitable to discover clusters with non-convex shapes

What Is the Problem of the K-Means Method?
The k-means algorithm is sensitive to
outliers ! Since an object with an extremely large value may
substantially distort the distribution of the data.
K-Medoids: Instead of taking the mean value of the
object in a cluster as a reference point, medoids
can be used, which is the most centrally located
object in a cluster.
0
1
2
3
4
5
6
7
8
9
10
0 1 2 3 4 5 6 7 8 9 100
1
2
3
4
5
6
7
8
9
10
0 1 2 3 4 5 6 7 8 9 10