chapter dm:ii - webis.de · chapter dm:ii ii.cluster analysis q cluster analysis basics q...
TRANSCRIPT
Chapter DM:II
II. Cluster Analysisq Cluster Analysis Basicsq Hierarchical Cluster Analysisq Iterative Cluster Analysisq Density-Based Cluster Analysisq Cluster Evaluationq Constrained Cluster Analysis
DM:II-1 Cluster Analysis © STEIN 2002-2019
Cluster Analysis Basics
Cluster analysis is the unsupervised classification of a set of objects in groups,pursuing the following objectives:
1. maximize the similarities within the groups (intra groups)
2. minimize the similarities between the groups (inter groups)
DM:II-2 Cluster Analysis © STEIN 2002-2019
Cluster Analysis Basics
Cluster analysis is the unsupervised classification of a set of objects in groups,pursuing the following objectives:
1. maximize the similarities within the groups (intra groups)
2. minimize the similarities between the groups (inter groups)
Applications:
q identification of similar groups of buyers
q “higher-level” image processing: object recognition
q search of similar gene profiles
q specification of syndromes
q analysis of traffic data in computer networks
q visualization of complex graphs
q text categorization in information retrieval
DM:II-3 Cluster Analysis © STEIN 2002-2019
Remarks:
q The setting of a cluster analysis is reverse to the setting of a variance analysis:
– A variance analysis verifies whether a nominal feature defines groups such that themembers of the different groups differ significantly with regard to a numerical feature.I.e., the nominal feature is in the role of the independent variable, while the numericalfeature(s) is (are) in role of dependent variable(s).Example: The type of a product packaging (the independent variable) may define thenumber of customers (the dependent variable) in a supermarket who look at the product.
– A cluster analysis, in turn, can be used to identify such a nominal feature, namely byconstructing a suited feature domain for the nominal variable: each cluster correspondsimplicitly to a value of the domain.Example: Equivalent but differently presented products in a supermarket are clustered(= the impact of product packaging is identified) with regard to the number of customerswho buy the products.
q Cluster analysis is a tool for structure generation. Nearly nothing is known about the nominalvariable that is to be identified. In particular, there is no knowledge about the number ofdomain values (the number of clusters).
q Variance analysis is a tool for structure verification.
DM:II-4 Cluster Analysis © STEIN 2002-2019
Cluster Analysis Basics
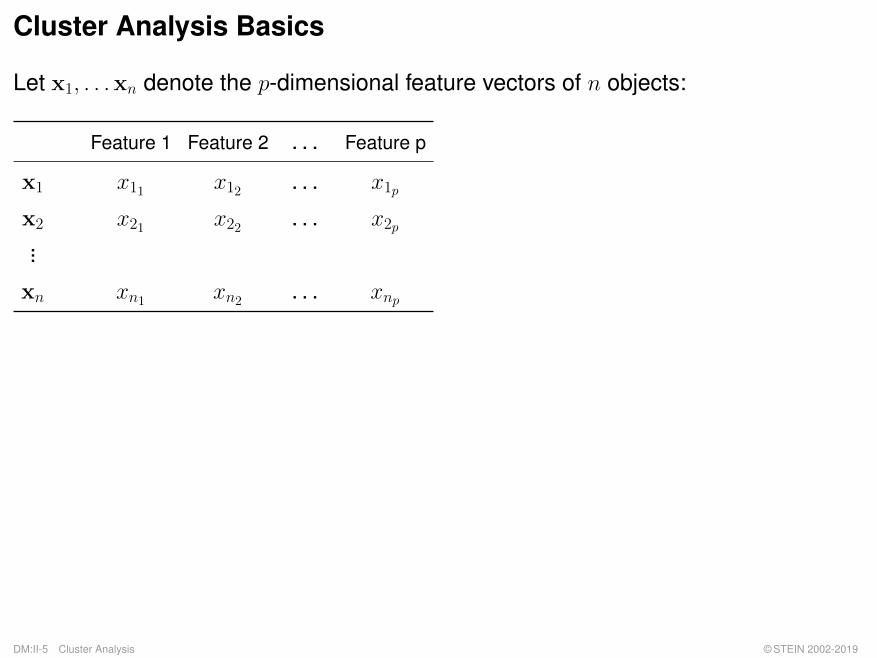
Let x1, . . .xn denote the p-dimensional feature vectors of n objects:
Feature 1 Feature 2 . . . Feature p
x1 x11 x12 . . . x1p
x2 x21 x22 . . . x2p...
xn xn1 xn2 . . . xnp
DM:II-5 Cluster Analysis © STEIN 2002-2019

Cluster Analysis Basics
Let x1, . . .xn denote the p-dimensional feature vectors of n objects:
Feature 1 Feature 2 . . . Feature p
x1 x11 x12 . . . x1p
x2 x21 x22 . . . x2p...
xn xn1 xn2 . . . xnp
no Target concept
c1
c2...
cn
DM:II-6 Cluster Analysis © STEIN 2002-2019
Cluster Analysis Basics
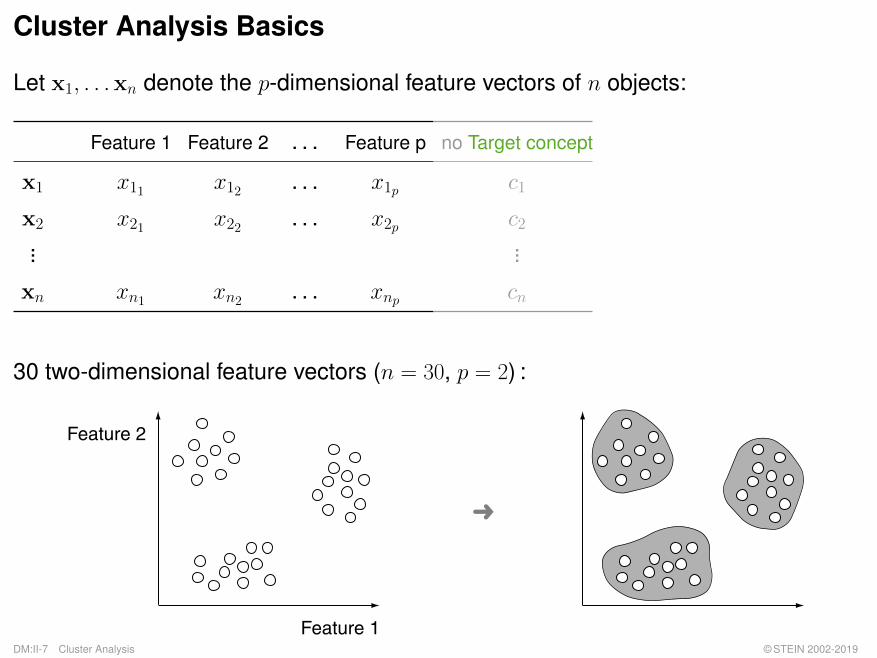
Let x1, . . .xn denote the p-dimensional feature vectors of n objects:
Feature 1 Feature 2 . . . Feature p
x1 x11 x12 . . . x1p
x2 x21 x22 . . . x2p...
xn xn1 xn2 . . . xnp
no Target concept
c1
c2...
cn
30 two-dimensional feature vectors (n = 30, p = 2) :
�
Feature 1
Feature 2
DM:II-7 Cluster Analysis © STEIN 2002-2019
Cluster Analysis Basics
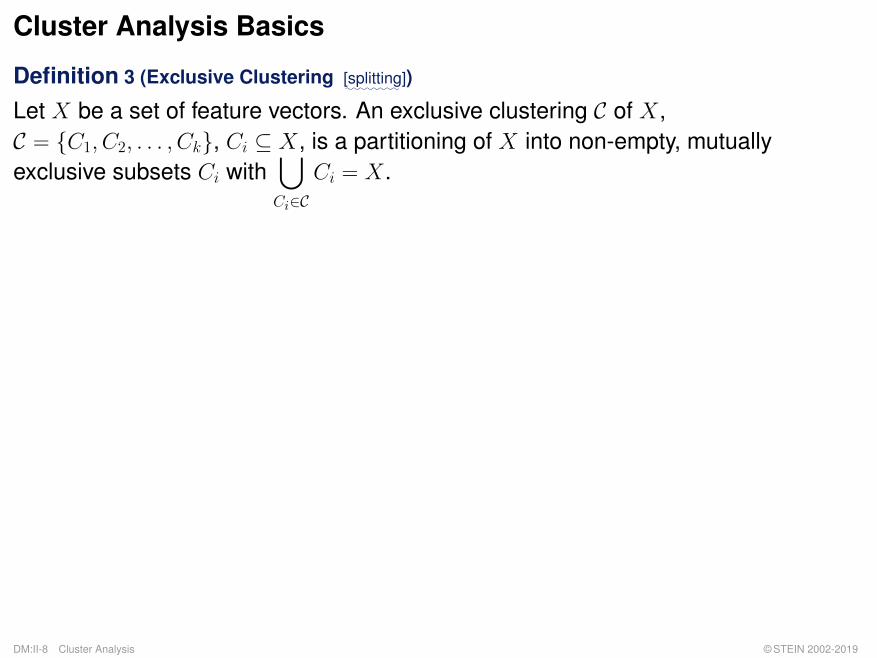
Definition 3 (Exclusive Clustering [::::::::splitting])
Let X be a set of feature vectors. An exclusive clustering C of X,C = {C1, C2, . . . , Ck}, Ci ⊆ X, is a partitioning of X into non-empty, mutuallyexclusive subsets Ci with
⋃Ci∈C
Ci = X.
DM:II-8 Cluster Analysis © STEIN 2002-2019
Cluster Analysis Basics
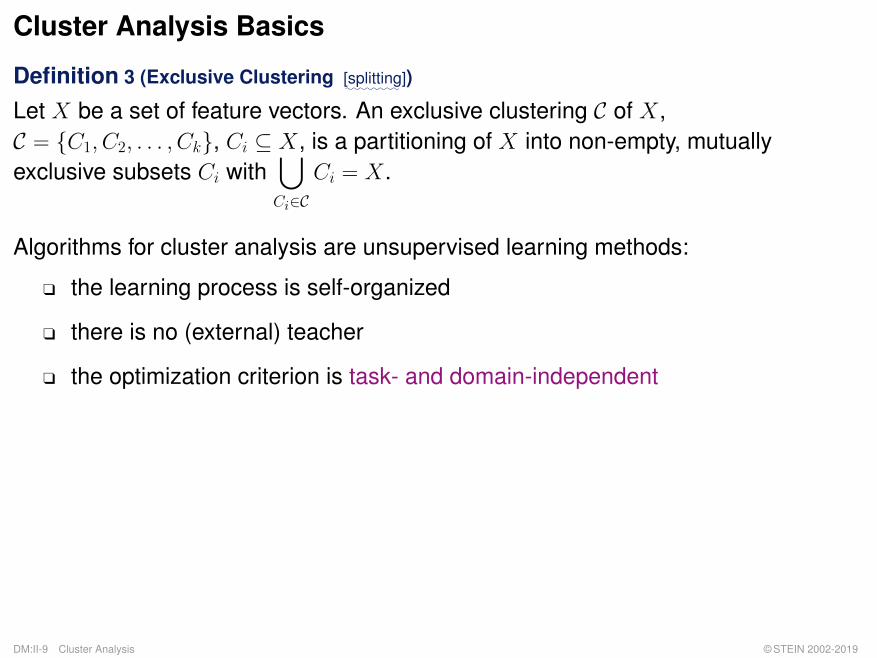
Definition 3 (Exclusive Clustering [::::::::splitting])
Let X be a set of feature vectors. An exclusive clustering C of X,C = {C1, C2, . . . , Ck}, Ci ⊆ X, is a partitioning of X into non-empty, mutuallyexclusive subsets Ci with
⋃Ci∈C
Ci = X.
Algorithms for cluster analysis are unsupervised learning methods:
q the learning process is self-organized
q there is no (external) teacher
q the optimization criterion is task- and domain-independent
DM:II-9 Cluster Analysis © STEIN 2002-2019
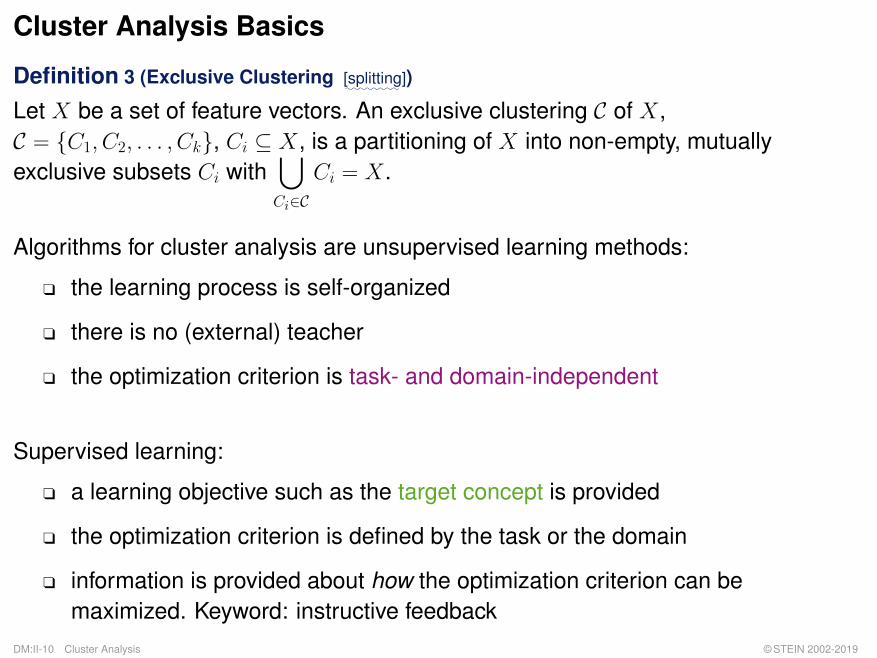
Cluster Analysis Basics
Definition 3 (Exclusive Clustering [::::::::splitting])
Let X be a set of feature vectors. An exclusive clustering C of X,C = {C1, C2, . . . , Ck}, Ci ⊆ X, is a partitioning of X into non-empty, mutuallyexclusive subsets Ci with
⋃Ci∈C
Ci = X.
Algorithms for cluster analysis are unsupervised learning methods:
q the learning process is self-organized
q there is no (external) teacher
q the optimization criterion is task- and domain-independent
Supervised learning:
q a learning objective such as the target concept is provided
q the optimization criterion is defined by the task or the domain
q information is provided about how the optimization criterion can bemaximized. Keyword: instructive feedback
DM:II-10 Cluster Analysis © STEIN 2002-2019
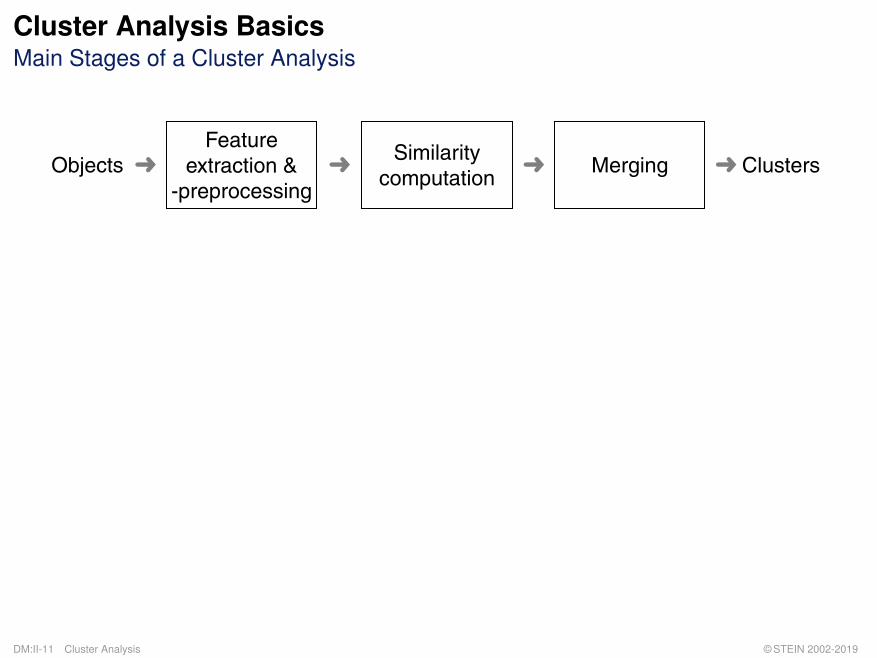
Cluster Analysis BasicsMain Stages of a Cluster Analysis
ClustersObjectsFeature
extraction &-preprocessing
Similaritycomputation
Merging� �� �
DM:II-11 Cluster Analysis © STEIN 2002-2019
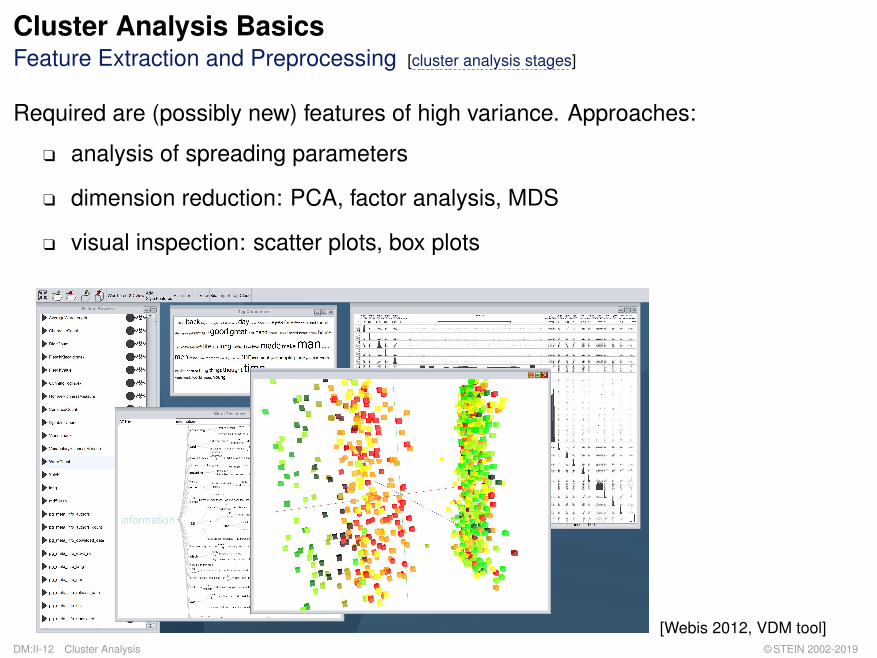
Cluster Analysis BasicsFeature Extraction and Preprocessing [cluster analysis stages]
Required are (possibly new) features of high variance. Approaches:
q analysis of spreading parameters
q dimension reduction: PCA, factor analysis, MDS
q visual inspection: scatter plots, box plots
[Webis 2012, VDM tool]DM:II-12 Cluster Analysis © STEIN 2002-2019
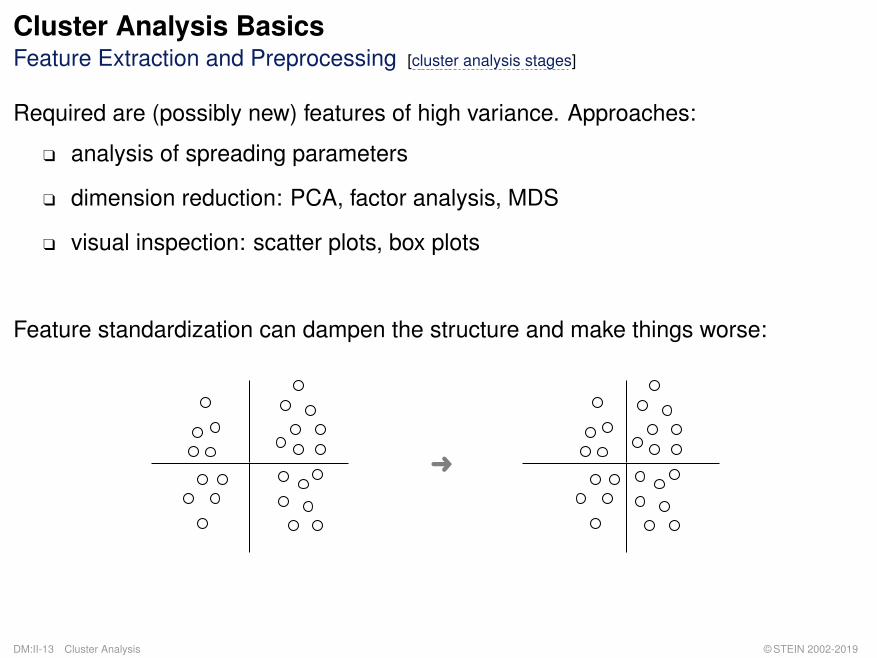
Cluster Analysis BasicsFeature Extraction and Preprocessing [cluster analysis stages]
Required are (possibly new) features of high variance. Approaches:
q analysis of spreading parameters
q dimension reduction: PCA, factor analysis, MDS
q visual inspection: scatter plots, box plots
Feature standardization can dampen the structure and make things worse:
�
DM:II-13 Cluster Analysis © STEIN 2002-2019
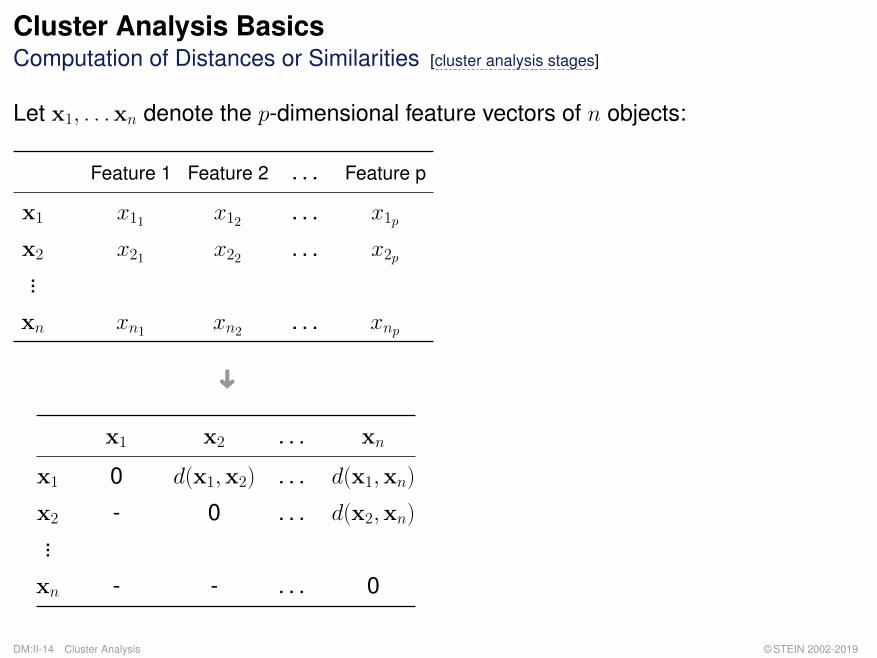
Cluster Analysis BasicsComputation of Distances or Similarities [cluster analysis stages]
Let x1, . . .xn denote the p-dimensional feature vectors of n objects:
Feature 1 Feature 2 . . . Feature p
x1 x11 x12 . . . x1p
x2 x21 x22 . . . x2p...
xn xn1 xn2 . . . xnp
Ü
x1 x2 . . . xn
x1 0 d(x1,x2) . . . d(x1,xn)
x2 - 0 . . . d(x2,xn)...
xn - - . . . 0
DM:II-14 Cluster Analysis © STEIN 2002-2019
Remarks:
q Usually, the distance matrix is defined implicitly by a metric on the feature space.
q The distance matrix can be understood as the adjacency matrix of a weighted, undirectedgraph G, G = 〈V,E,w〉. The set X of feature vectors is mapped one-to-one (bijection) onto aset of nodes V . The distance d(xi,xj) corresponds to the weight w({u, v}) of edge {u, v} ∈ E
between those nodes u and v that are associated with xi and xj respectively.
DM:II-15 Cluster Analysis © STEIN 2002-2019
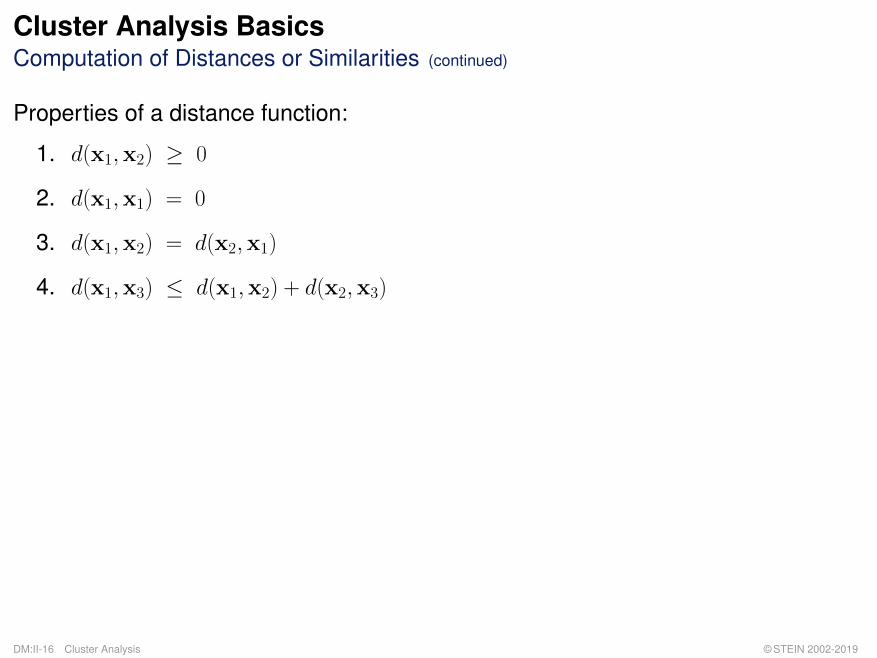
Cluster Analysis BasicsComputation of Distances or Similarities (continued)
Properties of a distance function:
1. d(x1,x2) ≥ 0
2. d(x1,x1) = 0
3. d(x1,x2) = d(x2,x1)
4. d(x1,x3) ≤ d(x1,x2) + d(x2,x3)
DM:II-16 Cluster Analysis © STEIN 2002-2019
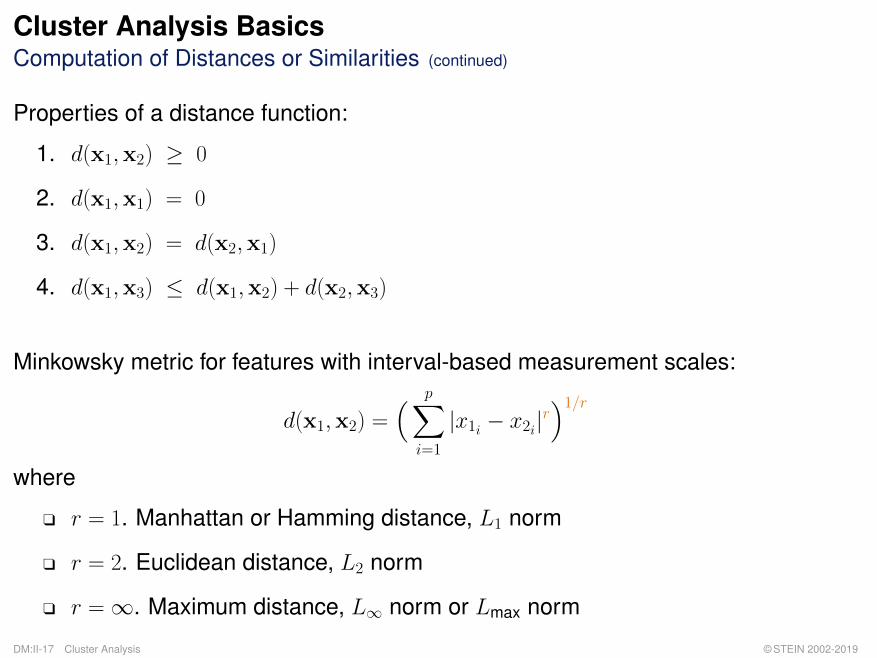
Cluster Analysis BasicsComputation of Distances or Similarities (continued)
Properties of a distance function:
1. d(x1,x2) ≥ 0
2. d(x1,x1) = 0
3. d(x1,x2) = d(x2,x1)
4. d(x1,x3) ≤ d(x1,x2) + d(x2,x3)
Minkowsky metric for features with interval-based measurement scales:
d(x1,x2) =( p∑
i=1
|x1i − x2i|r)1/r
where
q r = 1. Manhattan or Hamming distance, L1 norm
q r = 2. Euclidean distance, L2 norm
q r =∞. Maximum distance, L∞ norm or Lmax norm
DM:II-17 Cluster Analysis © STEIN 2002-2019
Cluster Analysis BasicsComputation of Distances or Similarities (continued)
Cluster analysis does not presume a particular:::::::::::::::::::::measurement
:::::::::scale.
Ü Generalization of the distance function towards a (dis)similarity function byomitting the triangle inequality. (Dis)similarities can be quantified between allkinds of features—irrespective of the given levels of measurement.
DM:II-18 Cluster Analysis © STEIN 2002-2019
Cluster Analysis BasicsComputation of Distances or Similarities (continued)
Cluster analysis does not presume a particular:::::::::::::::::::::measurement
:::::::::scale.
Ü Generalization of the distance function towards a (dis)similarity function byomitting the triangle inequality. (Dis)similarities can be quantified between allkinds of features—irrespective of the given levels of measurement.
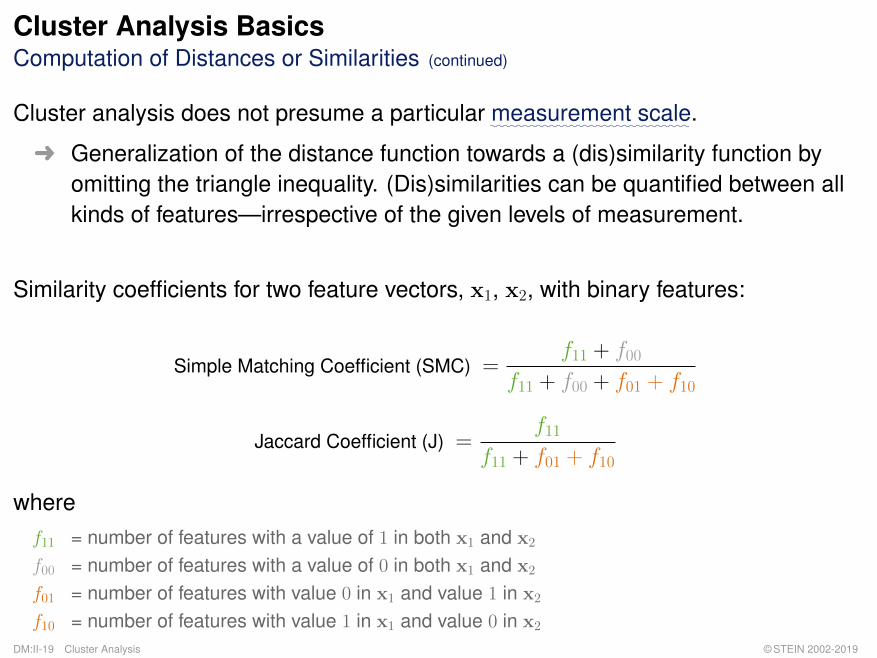
Similarity coefficients for two feature vectors, x1, x2, with binary features:
Simple Matching Coefficient (SMC) =f11 + f00
f11 + f00 + f01 + f10
Jaccard Coefficient (J) =f11
f11 + f01 + f10
wheref11 = number of features with a value of 1 in both x1 and x2
f00 = number of features with a value of 0 in both x1 and x2
f01 = number of features with value 0 in x1 and value 1 in x2
f10 = number of features with value 1 in x1 and value 0 in x2
DM:II-19 Cluster Analysis © STEIN 2002-2019
Remarks:
q The definitions for the above similarity coefficients can be extended towards features with anominal measurement scale.
q Particular heterogeneous metrics have been developed, such as HEOM and HVDM, whichallow the combined computation of feature values from different measurement scales.
q The computation of the correlation between all features of two feature vectors (not: betweentwo features over all feature vectors) allows to compare feature profiles.Example: Q correlation coefficient
q The development of a suited, realistic, and expressive similarity measure is the biggestchallenge within a cluster analysis tasks. Typical problems:
– (unwanted) structure damping due to normalization– (unwanted) sensitivity concerning outliers– (unrecognized) feature correlations– (neglected) varying feature importance
q Similarity measures can be transformed straightforwardly into dissimilarity measures—andvice versa.
DM:II-20 Cluster Analysis © STEIN 2002-2019
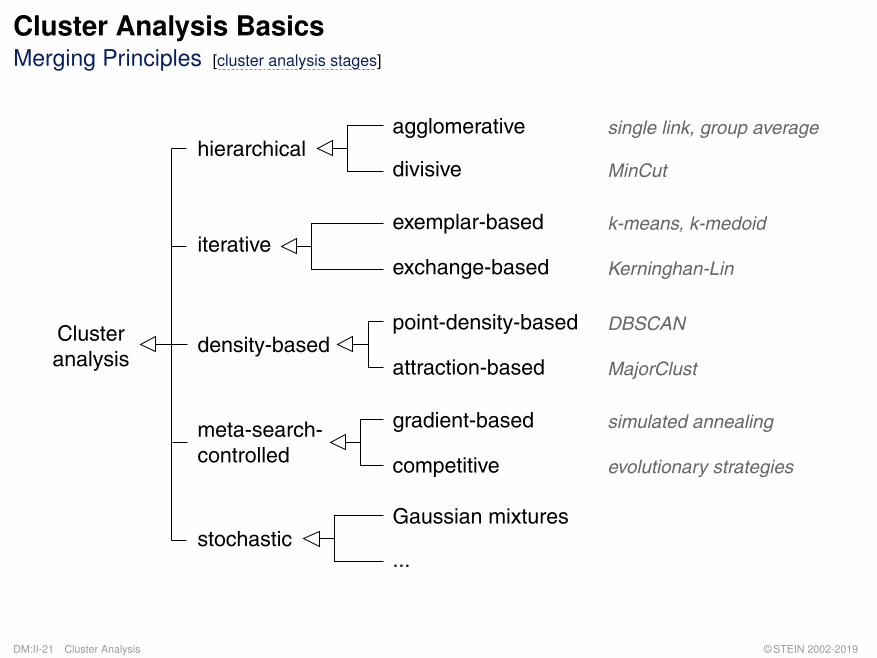
Cluster Analysis BasicsMerging Principles [cluster analysis stages]
meta-search-controlled
Clusteranalysis
gradient-based
density-basedpoint-density-based
attraction-based
competitive
hierarchicalagglomerative
divisive
iterativeexemplar-based
exchange-based
stochasticGaussian mixtures
...
single link, group average
MinCut
k-means, k-medoid
Kerninghan-Lin
DBSCAN
MajorClust
simulated annealing
evolutionary strategies
DM:II-21 Cluster Analysis © STEIN 2002-2019