chapter dm:ii (continued) - bauhaus university, weimar dm:ii (continued) ii.cluster analysis q...
TRANSCRIPT
Chapter DM:II (continued)
II. Cluster Analysisq Cluster Analysis Basicsq Hierarchical Cluster Analysisq Iterative Cluster Analysisq Density-Based Cluster Analysisq Cluster Evaluationq Constrained Cluster Analysis
DM:II-270 Cluster Analysis © STEIN 2007-2018

Constrained Cluster AnalysisPerson Resolution Task
DM:II-271 Cluster Analysis © STEIN 2007-2018

Constrained Cluster AnalysisPerson Resolution Task
DM:II-272 Cluster Analysis © STEIN 2007-2018

Constrained Cluster AnalysisPerson Resolution Task
target nameMichael Jordan
other names
DM:II-273 Cluster Analysis © STEIN 2007-2018

Constrained Cluster AnalysisPerson Resolution Task
target nameMichael Jordan
other names
target nameMichael Jordan
(referent 1)
other names...
target nameMichael Jordan
(referent r)
other names
The basket ball player. The statistician.
DM:II-274 Cluster Analysis © STEIN 2007-2018

Constrained Cluster AnalysisPerson Resolution Task
target nameMichael Jordan
other names
target nameMichael Jordan
(referent 1)
other names...
target nameMichael Jordan
(referent r)
other names
The basket ball player. The statistician.
q Multi-document resolution task:
Names, Target names: N = {n1, . . . , nl}, T ⊂ N
Referents: R = {r1, . . . , rm}, τ : R→ T , |R| � |T |Documents: D = {d1, . . . , dn}, ν : D → P(N), |ν(di) ∩ T | = 1
A solution: γ : D → R, s.t. τ(γ(di)) ∈ ν(di)
DM:II-275 Cluster Analysis © STEIN 2007-2018
Constrained Cluster AnalysisPerson Resolution Task
target nameMichael Jordan
other names
target nameMichael Jordan
(referent 1)
other names...
target nameMichael Jordan
(referent r)
other names
The basket ball player. The statistician.
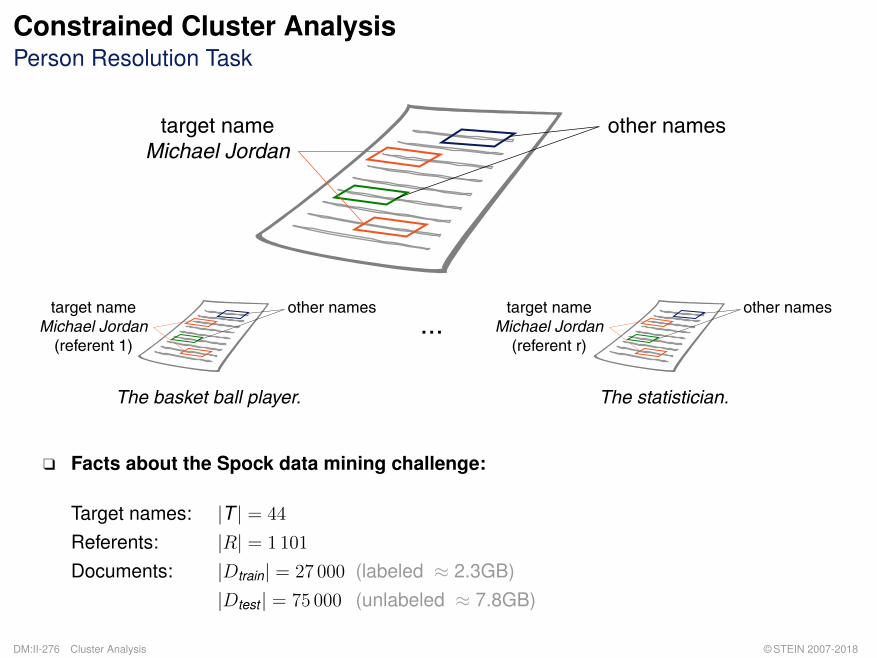
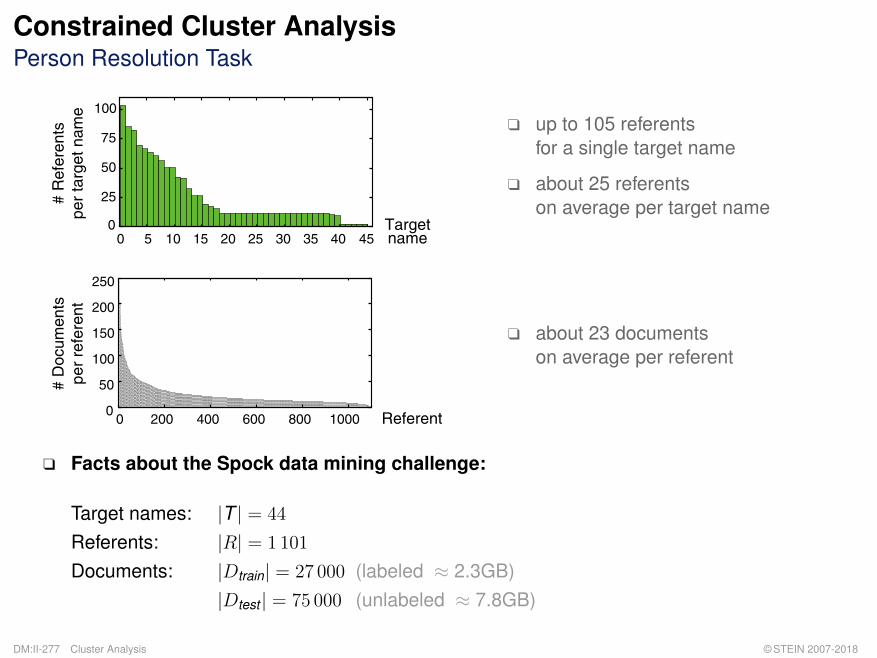
q Facts about the Spock data mining challenge:
Target names: |T | = 44
Referents: |R| = 1101
Documents: |Dtrain| = 27 000 (labeled ≈ 2.3GB)|Dtest | = 75 000 (unlabeled ≈ 7.8GB)
DM:II-276 Cluster Analysis © STEIN 2007-2018
Constrained Cluster AnalysisPerson Resolution Task
target nameMichael Jordan
other names
target nameMichael Jordan
(referent 1)
other names...
target nameMichael Jordan
(referent r)
other names
The basket ball player. The statistician.
q Facts about the Spock data mining challenge:
Target names: |T | = 44
Referents: |R| = 1101
Documents: |Dtrain| = 27 000 (labeled ≈ 2.3GB)|Dtest | = 75 000 (unlabeled ≈ 7.8GB)
0
25
50
75
100
0 5 10 15 20 25 30 35 40 45
# R
efer
ents
per
targ
et n
ame
Targetname
q up to 105 referentsfor a single target name
q about 25 referentson average per target name
0
50
100
150
200
250
# D
ocum
ents
per
refe
rent
0 200 400 600 800 1000 Referent
q about 23 documentson average per referent
DM:II-277 Cluster Analysis © STEIN 2007-2018

Constrained Cluster AnalysisApplied to Multi-Document Resolution
Referent 1 Referent 2
1. Model similarities Ü new and established retrieval models:
q global and context-based vector space modelsq explicit semantic analysisq ontology alignment
2. Learn class memberships (supervised) Ü logistic regression
3. Find equivalence classes (unsupervised) Ü cluster analysis:
(a) adaptive graph thinning(b) multiple, density-based cluster analysis(c) clustering selection by expected density maximization
DM:II-278 Cluster Analysis © STEIN 2007-2018

Constrained Cluster AnalysisApplied to Multi-Document Resolution
Referent 1 Referent 2
1. Model similarities Ü new and established retrieval models:
q global and context-based vector space modelsq explicit semantic analysisq ontology alignment
2. Learn class memberships (supervised) Ü logistic regression
3. Find equivalence classes (unsupervised) Ü cluster analysis:
(a) adaptive graph thinning(b) multiple, density-based cluster analysis(c) clustering selection by expected density maximization
DM:II-279 Cluster Analysis © STEIN 2007-2018

Constrained Cluster AnalysisApplied to Multi-Document Resolution
Referent 1 Referent 2
1. Model similarities Ü new and established retrieval models:
q global and context-based vector space modelsq explicit semantic analysisq ontology alignment
2. Learn class memberships (supervised) Ü logistic regression
3. Find equivalence classes (unsupervised) Ü cluster analysis:
(a) adaptive graph thinning(b) multiple, density-based cluster analysis(c) clustering selection by expected density maximization
DM:II-280 Cluster Analysis © STEIN 2007-2018

Constrained Cluster AnalysisApplied to Multi-Document Resolution
Referent 1 Referent 2
1. Model similarities Ü new and established retrieval models:
q global and context-based vector space modelsq explicit semantic analysisq ontology alignment
2. Learn class memberships (supervised) Ü logistic regression
3. Find equivalence classes (unsupervised) Ü cluster analysis:
(a) adaptive graph thinning(b) multiple, density-based cluster analysis(c) clustering selection by expected density maximization
DM:II-281 Cluster Analysis © STEIN 2007-2018

Constrained Cluster AnalysisApplied to Multi-Document Resolution
Referent 1 Referent 2
1. Model similarities Ü new and established retrieval models:
q global and context-based vector space modelsq explicit semantic analysisq ontology alignment
2. Learn class memberships (supervised) Ü logistic regression
3. Find equivalence classes (unsupervised) Ü cluster analysis:
(a) adaptive graph thinning(b) multiple, density-based cluster analysis(c) clustering selection by expected density maximization
DM:II-282 Cluster Analysis © STEIN 2007-2018

Constrained Cluster AnalysisApplied to Multi-Document Resolution
Referent 1 Referent 2
1. Model similarities Ü new and established retrieval models:
q global and context-based vector space modelsq explicit semantic analysisq ontology alignment
2. Learn class memberships (supervised) Ü logistic regression
3. Find equivalence classes (unsupervised) Ü cluster analysis:
(a) adaptive graph thinning(b) multiple, density-based cluster analysis(c) clustering selection by expected density maximization
DM:II-283 Cluster Analysis © STEIN 2007-2018

Constrained Cluster AnalysisIdealized Class Membership Distribution over Similarities
<0,050
<0,100
<0,150
<0,200
<0,250
<0,300
<0,350
<0,400
<0,450
<0,500
<0,550
<0,600
<0,650
<0,700
<0,750
<0,800
<0,850
<0,900
<0,950
<1,000
different referents same referent
Similarity distributions for document pairs from different referents and same referent.
Logistic regression task:
q sample size: 400 000
q classes imbalance: non-target class : target class ≈ 25:1
q items are drawn uniformly distributed wrt. non-targets and targets
q items are uniformly distributed over the groups of target names
DM:II-284 Cluster Analysis © STEIN 2007-2018

Constrained Cluster AnalysisMembership Distribution under tf·idf Vector Space Model
<0,050
<0,100
<0,150
<0,200
<0,250
<0,300
<0,350
<0,400
<0,450
<0,500
<0,550
<0,600
<0,650
<0,700
<0,750
<0,800
<0,850
<0,900
<0,950
<1,000
different referents same referent
0,00%
5,00%
10,00%
15,00%
20,00%
Model details:
q corpus size: 25 000 documents
q dictionary size: 1,2 Mio terms
q stopwords number: 850
q stopword volume: 36%
DM:II-285 Cluster Analysis © STEIN 2007-2018
Constrained Cluster AnalysisMembership Distribution under Context-Based Vector Space Model
<0,050
<0,100
<0,150
<0,200
<0,250
<0,300
<0,350
<0,400
<0,450
<0,500
<0,550
<0,600
<0,650
<0,700
<0,750
<0,800
<0,850
<0,900
<0,950
<1,000
different referents same referent
0,00%
5,00%
10,00%
15,00%
20,00%
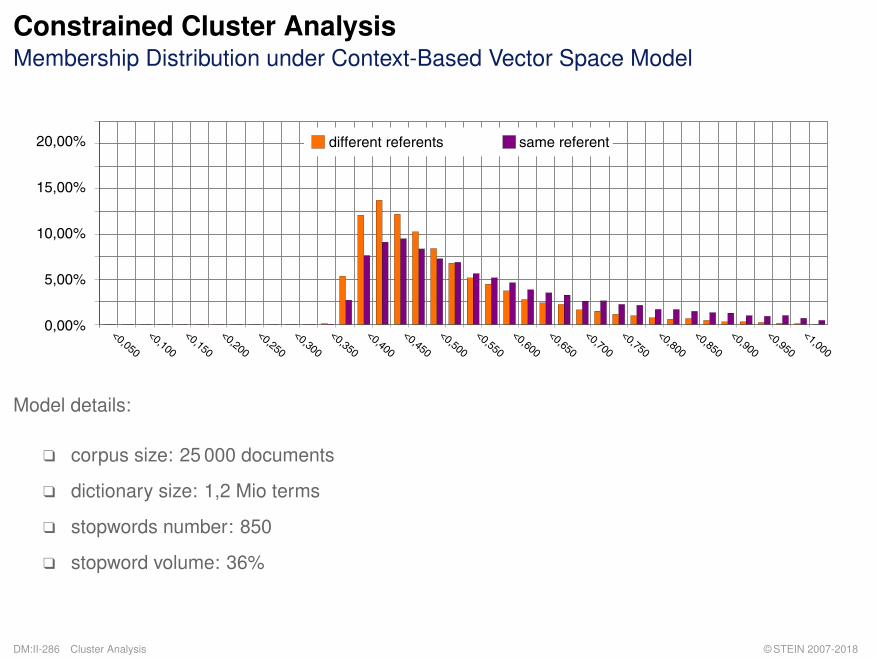
Model details:
q corpus size: 25 000 documents
q dictionary size: 1,2 Mio terms
q stopwords number: 850
q stopword volume: 36%
DM:II-286 Cluster Analysis © STEIN 2007-2018
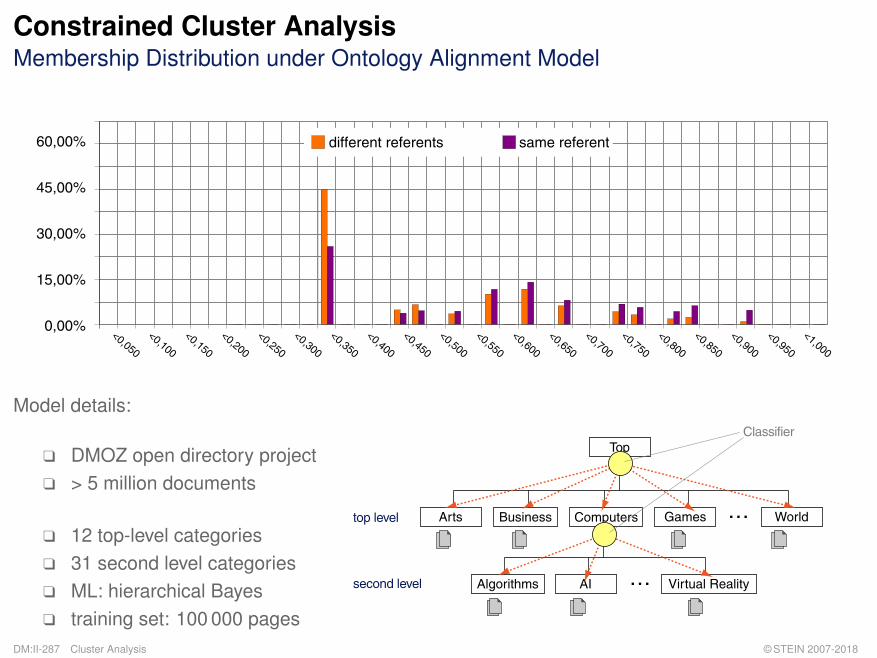
Constrained Cluster AnalysisMembership Distribution under Ontology Alignment Model
<0,050
<0,100
<0,150
<0,200
<0,250
<0,300
<0,350
<0,400
<0,450
<0,500
<0,550
<0,600
<0,650
<0,700
<0,750
<0,800
<0,850
<0,900
<0,950
<1,000
different referents same referent
0,00%
15,00%
30,00%
45,00%
60,00%
Model details:
q DMOZ open directory projectq > 5 million documents
q 12 top-level categoriesq 31 second level categoriesq ML: hierarchical Bayesq training set: 100 000 pages
Top
Arts Business Computers Games World
Virtual RealityAlgorithms AI
top level
second level
Classifier
DM:II-287 Cluster Analysis © STEIN 2007-2018

Constrained Cluster AnalysisIn-Depth: Multi-Class Hierarchical Classification
Flat (big-bang) classification
...
Hierarchical (top-down) classification
+ simple realization– loss of discriminative power with
increasing number of categories
+ specialized classifiers(divide and conquer)
– misclassification at higher levelscan never become repaired
DM:II-288 Cluster Analysis © STEIN 2007-2018

Constrained Cluster AnalysisIn-Depth: Multi-Class Hierarchical Classification
State of the art of effectiveness analyses:
1. independence assumption between categories2. neglection of both hierarchical structure and degree of misclassification
(a)
�
(b)
�
Improvements:
q Consider similarity ϕ(Ci, Cj) between correct and wrong category.q Consider graph distance d(Ci, Cj) between correct and wrong category.
DM:II-289 Cluster Analysis © STEIN 2007-2018
Constrained Cluster AnalysisIn-Depth: Multi-Class Hierarchical Classification
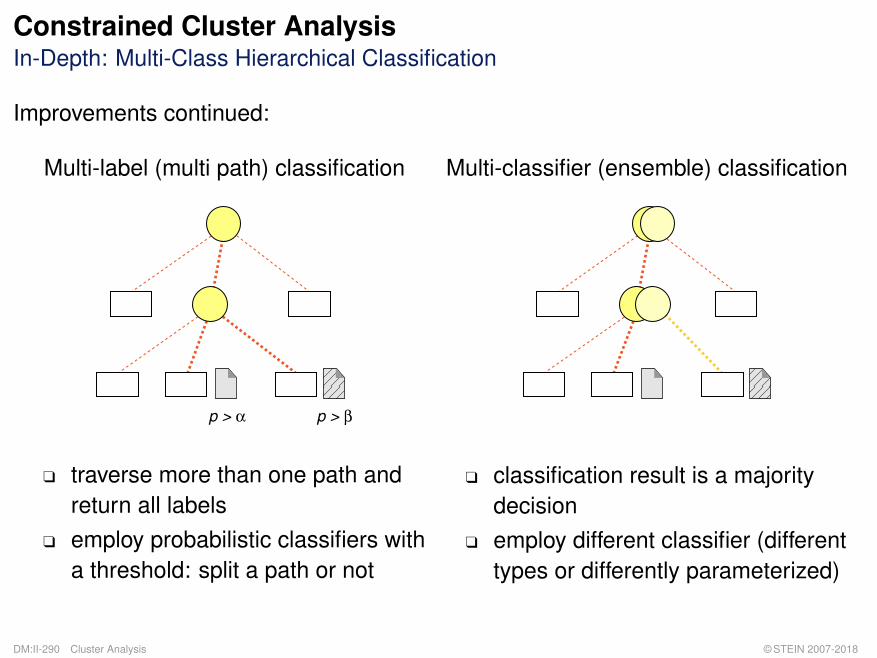
Improvements continued:
Multi-label (multi path) classification
p > α p > β
Multi-classifier (ensemble) classification
q traverse more than one path andreturn all labels
q employ probabilistic classifiers witha threshold: split a path or not
q classification result is a majoritydecision
q employ different classifier (differenttypes or differently parameterized)
DM:II-290 Cluster Analysis © STEIN 2007-2018

Constrained Cluster AnalysisMembership Distribution under Optimized Retrieval Model Combination
<0,050
<0,100
<0,150
<0,200
<0,250
<0,300
<0,350
<0,400
<0,450
<0,500
<0,550
<0,600
<0,650
<0,700
<0,750
<0,800
<0,850
<0,900
<0,950
<1,000
different referents same referent
0,00%
5,00%
10,00%
15,00%
20,00%
Retrieval Model F1/3 -Measure
tf·idf vector space 0.39context-based vector space 0.32ESA Wikipedia persons 0.30phrase structure grammar 0.17ontology alignment 0.15
optimized combination 0.42
DM:II-291 Cluster Analysis © STEIN 2007-2018

Constrained Cluster AnalysisMembership Distribution under Optimized Retrieval Model Combination
<0,050
<0,100
<0,150
<0,200
<0,250
<0,300
<0,350
<0,400
<0,450
<0,500
<0,550
<0,600
<0,650
<0,700
<0,750
<0,800
<0,850
<0,900
<0,950
<1,000
different referents same referent
0,00%
5,00%
10,00%
15,00%
20,00%
Retrieval Model F1/3 -Measure
tf·idf vector space 0.39context-based vector space 0.32ESA Wikipedia persons 0.30phrase structure grammar 0.17ontology alignment 0.15
optimized combination 0.42
...
Referent 1 Referent 2 Referent m
DM:II-292 Cluster Analysis © STEIN 2007-2018

Constrained Cluster AnalysisMembership Distribution under Optimized Retrieval Model Combination
<0,050
<0,100
<0,150
<0,200
<0,250
<0,300
<0,350
<0,400
<0,450
<0,500
<0,550
<0,600
<0,650
<0,700
<0,750
<0,800
<0,850
<0,900
<0,950
<1,000
different referents same referent
0,00%
5,00%
10,00%
15,00%
20,00%
Retrieval Model F1/3 -Measure
tf·idf vector space 0.39context-based vector space 0.32ESA Wikipedia persons 0.30phrase structure grammar 0.17ontology alignment 0.15
optimized combination 0.42
...
Referent 1 Referent 2 Referent m
...
DM:II-293 Cluster Analysis © STEIN 2007-2018

Constrained Cluster AnalysisMembership Distribution under Optimized Retrieval Model Combination
<0,050
<0,100
<0,150
<0,200
<0,250
<0,300
<0,350
<0,400
<0,450
<0,500
<0,550
<0,600
<0,650
<0,700
<0,750
<0,800
<0,850
<0,900
<0,950
<1,000
different referents same referent
0,00%
5,00%
10,00%
15,00%
20,00%
Retrieval Model F1/3 -Measure
tf·idf vector space 0.39context-based vector space 0.32ESA Wikipedia persons 0.30phrase structure grammar 0.17ontology alignment 0.15
optimized combination 0.42
...
Referent 1 Referent 2 Referent m
......
DM:II-294 Cluster Analysis © STEIN 2007-2018
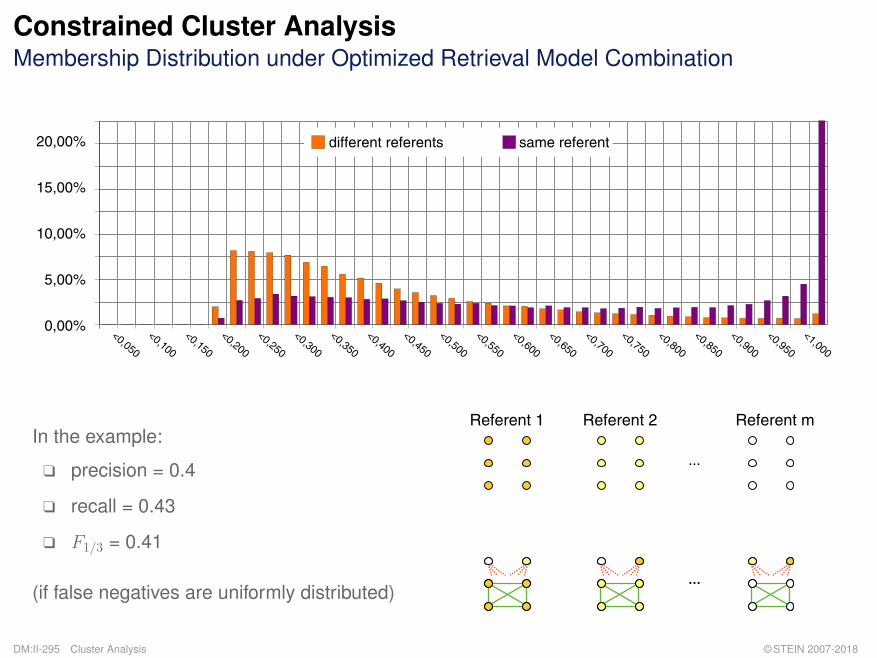
Constrained Cluster AnalysisMembership Distribution under Optimized Retrieval Model Combination
<0,050
<0,100
<0,150
<0,200
<0,250
<0,300
<0,350
<0,400
<0,450
<0,500
<0,550
<0,600
<0,650
<0,700
<0,750
<0,800
<0,850
<0,900
<0,950
<1,000
different referents same referent
0,00%
5,00%
10,00%
15,00%
20,00%
Retrieval Model F1/3 -Measure
tf·idf vector space 0.39context-based vector space 0.32ESA Wikipedia persons 0.30phrase structure grammar 0.17ontology alignment 0.15
optimized combination 0.42
...
Referent 1 Referent 2 Referent m
......
In the example:
q precision = 0.4
q recall = 0.43
q F1/3 = 0.41
(if false negatives are uniformly distributed)
DM:II-295 Cluster Analysis © STEIN 2007-2018

Constrained Cluster AnalysisIn-Depth: Analysis of Classifier Effectiveness
<0,050
<0,100
<0,150
<0,200
<0,250
<0,300
<0,350
<0,400
<0,450
<0,500
<0,550
<0,600
<0,650
<0,700
<0,750
<0,800
<0,850
<0,900
<0,950
<1,000
different referents same referent
0,00%
5,00%
10,00%
15,00%
20,00%
Consideration of imbalance:
0 0.2 0.4 0.6 0.8 1
Interval
different referentssame referents
DM:II-296 Cluster Analysis © STEIN 2007-2018

Constrained Cluster AnalysisIn-Depth: Analysis of Classifier Effectiveness
<0,050
<0,100
<0,150
<0,200
<0,250
<0,300
<0,350
<0,400
<0,450
<0,500
<0,550
<0,600
<0,650
<0,700
<0,750
<0,800
<0,850
<0,900
<0,950
<1,000
different referents same referent
0,00%
5,00%
10,00%
15,00%
20,00%
Consideration of imbalance:
0 0.2 0.4 0.6 0.8 1
Interval
different referentssame referents
q class imbalance factor (CIF ) of 25⇒ precision in interval [0.725; 1] for edges between same referents: ≈ 0.17
How can F1/3 = 0.42 be achieved via cluster analysis?
DM:II-297 Cluster Analysis © STEIN 2007-2018
Constrained Cluster AnalysisIn-Depth: Analysis of Classifier Effectiveness
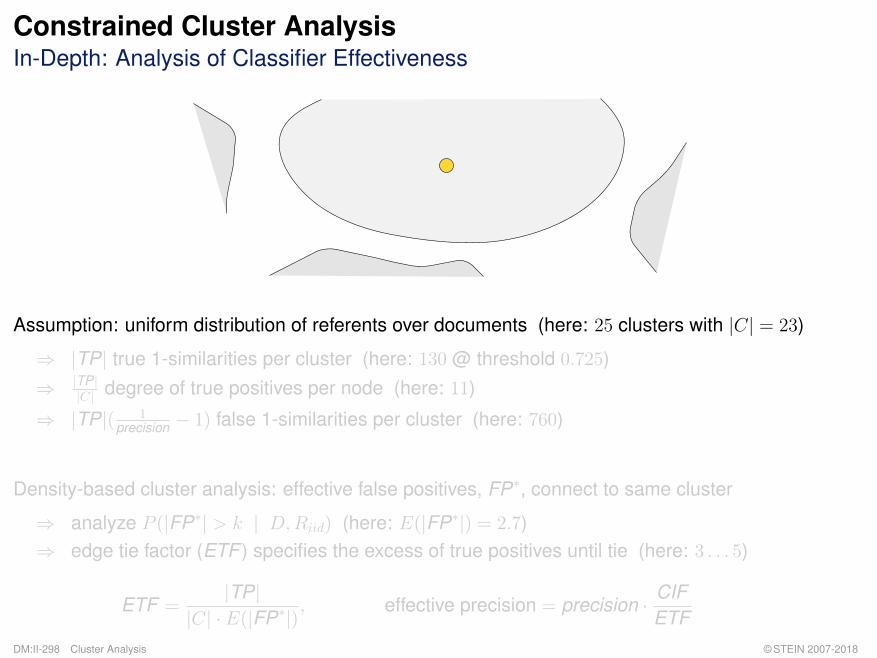
Assumption: uniform distribution of referents over documents (here: 25 clusters with |C| = 23)
⇒ |TP| true 1-similarities per cluster (here: 130 @ threshold 0.725)⇒ |TP|
|C| degree of true positives per node (here: 11)
⇒ |TP|( 1precision − 1) false 1-similarities per cluster (here: 760)
Density-based cluster analysis: effective false positives, FP∗, connect to same cluster
⇒ analyze P (|FP∗| > k | D,Riid) (here: E(|FP∗|) = 2.7)⇒ edge tie factor (ETF ) specifies the excess of true positives until tie (here: 3 . . . 5)
ETF =|TP|
|C| · E(|FP∗|), effective precision = precision · CIF
ETFDM:II-298 Cluster Analysis © STEIN 2007-2018

Constrained Cluster AnalysisIn-Depth: Analysis of Classifier Effectiveness
Assumption: uniform distribution of referents over documents (here: 25 clusters with |C| = 23)
⇒ |TP| true 1-similarities per cluster (here: 130 @ threshold 0.725)⇒ |TP|
|C| degree of true positives per node (here: 11)
⇒ |TP|( 1precision − 1) false 1-similarities per cluster (here: 760)
Density-based cluster analysis: effective false positives, FP∗, connect to same cluster
⇒ analyze P (|FP∗| > k | D,Riid) (here: E(|FP∗|) = 2.7)⇒ edge tie factor (ETF ) specifies the excess of true positives until tie (here: 3 . . . 5)
ETF =|TP|
|C| · E(|FP∗|), effective precision = precision · CIF
ETFDM:II-299 Cluster Analysis © STEIN 2007-2018

Constrained Cluster AnalysisIn-Depth: Analysis of Classifier Effectiveness
Assumption: uniform distribution of referents over documents (here: 25 clusters with |C| = 23)
⇒ |TP| true 1-similarities per cluster (here: 130 @ threshold 0.725)⇒ |TP|
|C| degree of true positives per node (here: 11)
⇒ |TP|( 1precision − 1) false 1-similarities per cluster (here: 760)
Density-based cluster analysis: effective false positives, FP∗, connect to same cluster
⇒ analyze P (|FP∗| > k | D,Riid) (here: E(|FP∗|) = 2.7)⇒ edge tie factor (ETF ) specifies the excess of true positives until tie (here: 3 . . . 5)
ETF =|TP|
|C| · E(|FP∗|), effective precision = precision · CIF
ETFDM:II-300 Cluster Analysis © STEIN 2007-2018
Constrained Cluster AnalysisIn-Depth: Analysis of Classifier Effectiveness
Assumption: uniform distribution of referents over documents (here: 25 clusters with |C| = 23)
⇒ |TP| true 1-similarities per cluster (here: 130 @ threshold 0.725)⇒ |TP|
|C| degree of true positives per node (here: 11)
⇒ |TP|( 1precision − 1) false 1-similarities per cluster (here: 760)
Density-based cluster analysis: effective false positives, FP∗, connect to same cluster
⇒ analyze P (|FP∗| > k | D,Riid) (here: E(|FP∗|) = 2.7)⇒ edge tie factor (ETF ) specifies the excess of true positives until tie (here: 3 . . . 5)
ETF =|TP|
|C| · E(|FP∗|), effective precision = precision · CIF
ETFDM:II-301 Cluster Analysis © STEIN 2007-2018
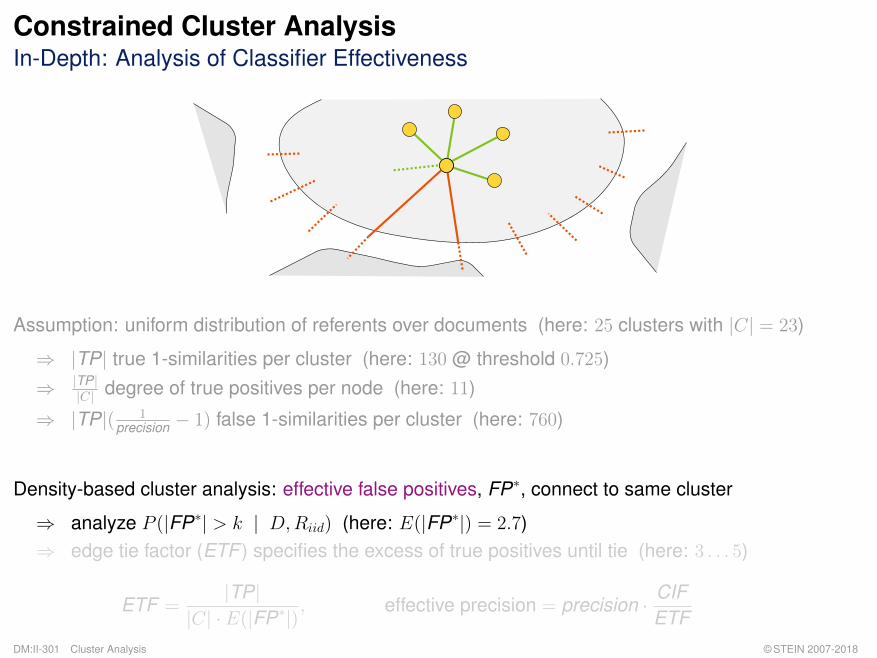
Constrained Cluster AnalysisIn-Depth: Analysis of Classifier Effectiveness
Assumption: uniform distribution of referents over documents (here: 25 clusters with |C| = 23)
⇒ |TP| true 1-similarities per cluster (here: 130 @ threshold 0.725)⇒ |TP|
|C| degree of true positives per node (here: 11)
⇒ |TP|( 1precision − 1) false 1-similarities per cluster (here: 760)
Density-based cluster analysis: effective false positives, FP∗, connect to same cluster
⇒ analyze P (|FP∗| > k | D,Riid) (here: E(|FP∗|) = 2.7)⇒ edge tie factor (ETF ) specifies the excess of true positives until tie (here: 3 . . . 5)
ETF =|TP|
|C| · E(|FP∗|), effective precision = precision · CIF
ETFDM:II-302 Cluster Analysis © STEIN 2007-2018
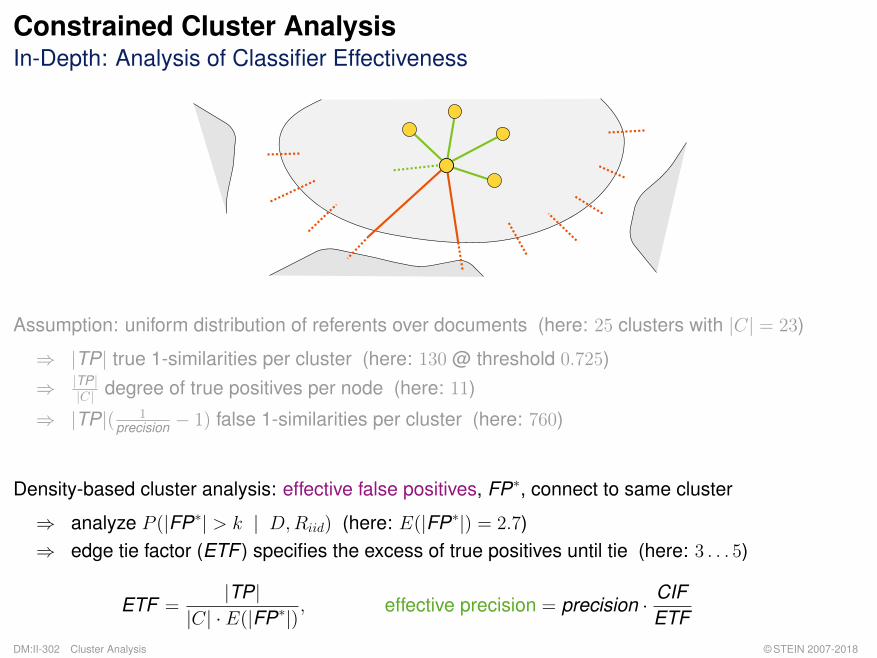
Constrained Cluster AnalysisIn-Depth: Analysis of Classifier Effectiveness
Assumption: uniform distribution of referents over documents (here: 25 clusters with |C| = 23)
⇒ |TP| true 1-similarities per cluster (here: 130 @ threshold 0.725)⇒ |TP|
|C| degree of true positives per node (here: 11)
⇒ |TP|( 1precision − 1) false 1-similarities per cluster (here: 760)
Density-based cluster analysis: effective false positives, FP∗, connect to same cluster
⇒ analyze P (|FP∗| > k | D,Riid) (here: E(|FP∗|) = 2.7)⇒ edge tie factor (ETF ) specifies the excess of true positives until tie (here: 3 . . . 5)
ETF =|TP|
|C| · E(|FP∗|), effective precision = precision · CIF
ETF
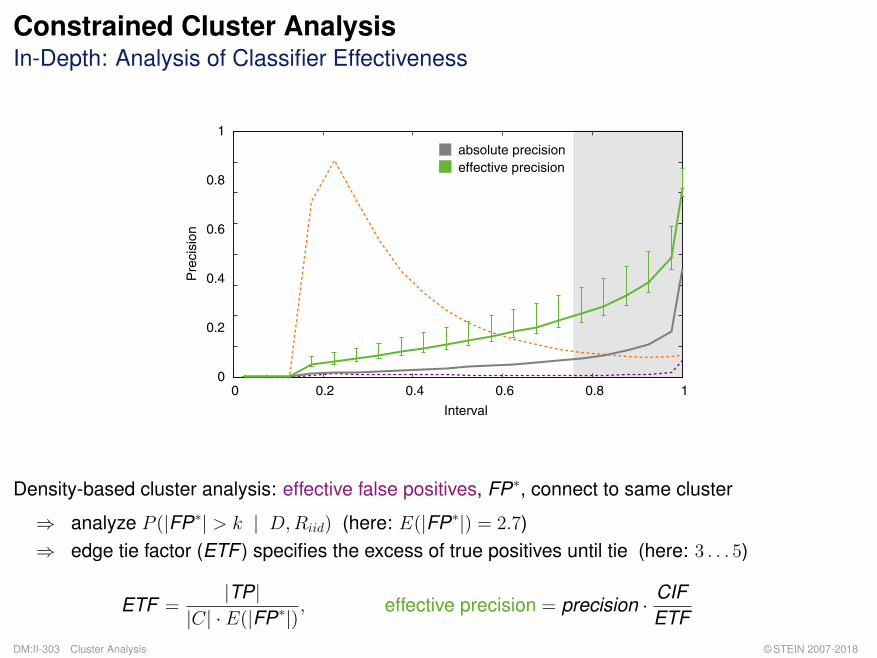
0 0.2 0.4 0.6 0.8 1
Interval
different referentssame referents
0
0.2
0.4
0.6
0.8
1
Pre
cisi
on
absolute precisioneffective precision
DM:II-303 Cluster Analysis © STEIN 2007-2018

Constrained Cluster AnalysisIn-Depth: Analysis of Classifier Effectiveness
Assumption: uniform distribution of referents over documents (here: 25 clusters with |C| = 23)
⇒ |TP| true 1-similarities per cluster (here: 130 @ threshold 0.725)⇒ |TP|
|C| degree of true positives per node (here: 11)
⇒ |TP|( 1precision − 1) false 1-similarities per cluster (here: 760)
Density-based cluster analysis: effective false positives, FP∗, connect to same cluster
⇒ analyze P (|FP∗| > k | D,Riid) (here: E(|FP∗|) = 2.7)⇒ edge tie factor (ETF ) specifies the excess of true positives until tie (here: 3 . . . 5)
ETF =|TP|
|C| · E(|FP∗|), effective precision = precision · CIF
ETF
0 0.2 0.4 0.6 0.8 1
Interval
different referentssame referents
0
0.2
0.4
0.6
0.8
1
Pre
cisi
on
absolute precisioneffective precision
Determine optimum similarity threshold for class-membership function:
θ∗ = argmaxθ∈[0;1]
{ 1 + αETF
precisionθ·CIF + αrecallθ
}
θ∗ considers co-variate shift, introduces model formation bias and sample selection bias.
DM:II-304 Cluster Analysis © STEIN 2007-2018

Constrained Cluster AnalysisModel Selection: Our Risk Minimization Strategy
Retrieval Model F1/3 -Measure
tf·idf vector space 0.39context-based vector space 0.32ESA Wikipedia persons 0.30phrase structure grammar 0.17ontology alignment 0.15
optimized combination 0.42Ensemble cluster analysis 0.40
Ensemble cluster analysis: higher bias, better generalization.
(1) Do we speculate on a better fit for Dtest?
(2) Do we expect a significant covariate shift, more noise, etc. in Dtest?
DM:II-305 Cluster Analysis © STEIN 2007-2018

Constrained Cluster AnalysisRecap
1. Multi-document resolution can be tackled with constrained cluster analysis.
2. Constraints are derived from labeled examples.
3. Class membership function ties constraints to multiple retrieval models.
4. Advanced density-based clustering technology is key.
DM:II-306 Cluster Analysis © STEIN 2007-2018
Constrained Cluster AnalysisReferences
q Disambiguating Web Appearances of People in a Social Network.[R. Bekkerman, A. McCallum. WWW 2005]
q A Bayesian Model for Supervised Clustering with the Dirichlet Process Prior.[H. Daumé III, D. Marcu. Journal MLR 2005]
q Computing Semantic Relatedness Using Wikipedia-based Explicit Semantic Analysis.[E. Gabrilovich, S. Markovitch. IJCAI 2007]
q Unsupervised Discrimination of Person Names in Web Contexts.[T. Pedersen, A. Kulkarni. CICLing 2007]
q On Information Need and Categorizing Search.[S. Meyer zu Eissen. Dissertation, Paderborn University, 2007]
q Weighted Experts: A Solution for the Spock Data Mining Challenge.[B. Stein, S. Meyer zu Eissen. I-KNOW 2008]
q GRAPE: A System for Disambiguating and Tagging People Names in Web Search.[L. Jiang, W. Shen, J. Wang, N. An. WWW 2010]
DM:II-307 Cluster Analysis © STEIN 2007-2018