climate change technology scenarios: energy, · pdf filepnnl-14800 climate change technology...
TRANSCRIPT

PNNL-14800
Climate Change Technology Scenarios: Energy, Emissions and Economic Implications M. Placet K.K. Humphreys N. Mahasenan August 2004 Prepared for the U.S. Department of Energy under Contract DE-AC06-76RL01830

DISCLAIMER This report was prepared as an account of work sponsored by an agency of the United States Government. Neither the United States Government nor any agency thereof, nor Battelle Memorial Institute, nor any of their employees, makes any warranty, express or implied, or assumes any legal liability or responsibility for the accuracy, completeness, or usefulness of any information, apparatus, product, or process disclosed, or represents that its use would not infringe privately owned rights. Reference herein to any specific commercial product, process, or service by trade name, trademark, manufacturer, or otherwise does not necessarily constitute or imply its endorsement, recommendation, or favoring by the United States Government or any agency thereof, or Battelle Memorial Institute. The views and opinions of authors expressed herein do not necessarily state or reflect those of the United States Government or any agency thereof.
PACIFIC NORTHWEST NATIONAL LABORATORY operated by BATTELLE
for the UNITED STATES DEPARTMENT OF ENERGY
under Contract DE-AC06-76RL01830
Printed in the United States of America
Available to DOE and DOE contractors from the Office of Scientific and Technical Information,
P.O. Box 62, Oak Ridge, TN 37831-0062; ph: (865) 576-8401 fax: (865) 576-5728
email: [email protected]
Available to the public from the National Technical Information Service, U.S. Department of Commerce, 5285 Port Royal Rd., Springfield, VA 22161
ph: (800) 553-6847 fax: (703) 605-6900
email: [email protected] online ordering: http://www.ntis.gov/ordering.htm
This document was printed on recycled paper.

PNNL-14800
Climate Change Technology Scenarios: Energy, Emissions and Economic Implications M. Placet K.K. Humphreys N. Mahasenan August 2004 Prepared for the U.S. Department of Energy under Contract DE-AC06-76RL01830 Pacific Northwest National Laboratory Richland, Washington 99352

Acknowledgments This work was sponsored by the U.S. Climate Change Technology Program (CCTP), which is a multi-agency Federal RD&D planning and coordination program, led by the U.S. Department of Energy (DOE). We wish to acknowledge Mr. David Conover, Director of CCTP, who provided the vision, leadership and encouragement for multi-agency R&D planning informed by long-term analysis. We also want to recognize Dr. Robert Marlay, Director of DOE’s Office of Science and Technology Policy and Deputy Director of CCTP, who represented the requirements of CCTP, supported the work on a day-to-day basis, and provided guidance at critical junctures. Many people made technical contributions and provided useful input to the analysis presented in this report. The authors appreciate the excellent work during the scenario development process and case analysis by a number of Pacific Northwest National Laboratory (PNNL) staff members, including Dr. Leon Clarke, Dr. Steven Smith, Dr. Son Kim, and Dr. Jae Edmonds of the Joint Global Change Research Institute. Ms. Dina Kruger, Mr. Francisco de la Chesnaye, and Ms. Casey Delhotal of the U.S. Environmental Protection Agency provided extensive support for the development of non-CO2 emissions estimates and reduction scenarios. Dr. Michael Curtis and Dr. Inja Paik of DOE Office of Science and Technology Policy gave us insightful comments on draft versions of this report. Mr. Burton Koske of Idaho National Engineering and Environmental Laboratory provided technical input and developed some of the concepts for graphics used in the report, in particular, Figure 8.8, which became known within CCTP as the “Koske Icon.” Ms. Casie Davidson of PNNL assisted with data and graphics representing the current emissions of greenhouse gases. In addition, several people made important contributions to the production of the report. Ms. Melody Warford of Stone Soup, Inc. designed many of the high-quality graphics. Ms. Valerie Hamilton, Ms. Deborah Schulz and Ms. Rose Urbina of PNNL provided valuable assistance with text processing and website production. The DOE Offices of Policy and International Affairs, Fossil Energy, Science, and Energy Efficiency and Renewable Energy, whose support is gratefully acknowledged, funded portions of the effort. Note: The Acknowledgements page within this report was revised on September 2, 2004.

v
Contents
Acknowledgments.................................................................................................................................. iii
Acronyms, Abbreviations and Initialisms................................................................................................ xi
1.0 Introduction................................................................................................................................. 1.1
2.0 The Climate Change Challenge and the Potential Role of Technology ......................................... 2.1
2.1 The Climate Change Challenge .......................................................................................... 2.1
2.2 The Role of Energy and Other Technologies ...................................................................... 2.4
3.0 Current Sources of GHG Emissions............................................................................................. 3.1
4.0 Potential Growth in GHG Emissions ........................................................................................... 4.1
4.1 Projected Growth in Energy Demand................................................................................. 4.1
4.2 Projected Growth in CO2 Emissions................................................................................... 4.2
4.3 Projected Growth in Emissions of Other Greenhouse Gases ............................................... 4.6
5.0 Stabilizing Concentrations – Potential Implications for Emissions ............................................... 5.1
6.0 Advanced Technology Scenarios................................................................................................. 6.1
7.0 Modeling Advanced Technology under Emissions Constraints .................................................... 7.1
8.0 Energy, Emissions and Economic Results of the Modeling Exercise ............................................ 8.1
8.1 Results – Energy Supply and End-Use ............................................................................... 8.1
8.2 Results – Reductions in CO2 Emissions.............................................................................. 8.5
8.3 Results – Reductions in Other GHG Emissions .................................................................. 8.7
8.4 Results – Economic Benefits.............................................................................................. 8.8
8.5 Results – Summary of Insights Relevant to CCTP Planning ............................................... 8.9
9.0 References .................................................................................................................................. 9.1 Appendix A - Details on Methodology and Results.............................................................................. A.1

vi
A.1 Overview of the Modeling Approach.................................................................................. A.1
A.2 The Reference Case: Energy and Emissions Projections .................................................... A.9
A.3 Emissions-Constrained Cases: Energy and Emissions Results...........................................A.12
A.3.1 Baseline Cases Assuming Reference Case Technology Assumptions: Energy and CO2 Emissions............................................................................................. A.16
A.3.2 The CLC Cases: Energy and CO2 Emissions........................................................ A.21
A.3.3 The NEB Cases: Energy and CO2 Emissions......................................................... A.34
A.3.4 The BSS Cases: Energy and CO2 Emissions.......................................................... A.34
A.3.5 Emissions of Non-CO2 Greenhouse Gases ............................................................ A.35
A.3.6 Economic Analysis of the Cases........................................................................... A.37
A.4 References ........................................................................................................................A.41

vii
Figures
2.1 Radiative Forcing of Various Atmospheric Constituents and Relative Uncertainties .................... 2.3
3.1 U.S. CO2 Emissions, by Source, 2002 ......................................................................................... 3.2
3.2 U.S. CO2 Emissions, by End-Use Sector, 2002............................................................................ 3.2
3.3 U.S. Emissions of Non-CO2 Greenhouse Gases, by Source, 2002 ................................................ 3.3
4.1 World Primary Energy Demand: 1990-2100: Reference Case.................................................... 4.3
4.2 Projections of World CO2 Emissions, 1990-2025 ........................................................................ 4.3
4.3 Projections of U.S. CO2 Emissions, 1990-2025........................................................................... 4.4
4.4 World CO2 Emissions Projected in IPCC Reference Cases, 1990-2100 ....................................... 4.5
4.5 World CO2 Emissions from Fossil Fuels, 1990-2100: Reference Case ........................................ 4.5
4.6 Non-CO2 Greenhouse Gases in the CCTP Reference Case .......................................................... 4.6
4.7 Radiative Forcing of Greenhouse Gases in the Reference Case.................................................... 4.8
5.1 World CO2 Emissions for the Reference Case and Four Emissions-Constrained Cases ................ 5.2
5.2 World CO2 Intensity for the Reference Case and Four Emissions-Constrained Cases................... 5.2
8.2 World Cumulative Primary Energy Demand Under Advanced Technology Cases, 2000-2100..... 8.4
8.3 Varying Patterns of Energy Supply and Use in 2100 Under Three Advanced Technology Assumptions and Four Emissions Constraints ............................................................................. 8.4
8.4 Cumulative GHG Emission Reductions, Beyond the Reference Case, Under the Advanced Technology Cases....................................................................................................................... 8.6
8.5 World Non-CO2 GHG Emissions in the Reference Case and Two Advanced Technology Cases .......................................................................................................................................... 8.7
8.6 World Non-CO2 GHG Emissions in the Very High Carbon-Constrained Case............................. 8.8
8.7 Annual Costs of Meeting Emissions Constraints ....................................................................... 8.10
8.8 Cumulative Contributions Between 2000 and 2100 to the Reduction, Avoidance, Capture and Sequestration of Greenhouse Gas Emissions for the Three Advanced Technology Scenarios, Under Varying Emissions Constrained Cases ........................................................... 8.11

viii
A.1 CO2 Emissions for the Four CO2-Emissions-Constrained Cases.................................................. A.7
A.2 World Energy Demand in the Reference Case ...........................................................................A.10
A.3 Cumulative World Energy Demand in the Reference Case ........................................................A.10
A.4 World CO2 Emissions in the Reference Case.............................................................................A.11
A.5 Emissions of Other GHGs in the Reference Case, in terms of Carbon-Equivalent Emissions......A.12
A.6 Range of Global Anthropogenic Methane Emissions .................................................................A.14
A.7 Range of Global Anthropogenic Nitrous Oxide Emissions.........................................................A.14
A.8 Results for Baseline for Very High Emissions Constraint ..........................................................A.17
A.9 Results for Baseline for Very High Emissions Constraint ..........................................................A.18
A.10 Results for Baseline for Medium Emissions Constraint..............................................................A.19
A.11 Results for Baseline for Low Emissions Constraint....................................................................A.20
A.12 Results for Closing the Loop on Carbon for Very High Emissions Constraint............................A.22
A.13 Results for Closing the Loop on Carbon for High Emissions Constraint ....................................A.23
A.14 Results for Closing the Loop on Carbon for Medium Emissions Constraint...............................A.24
A.15 Results for Closing the Loop on Carbon for Low Emissions Constraint.....................................A.25
A.16 Results for A New Energy Backbone for Very High Emissions Constraint .................................A.26
A.17 Results for A New Energy Backbone for High Emissions Constraint..........................................A.27
A.18 Results for A New Energy Backbone for Medium Emissions Constraint.....................................A.28
A.19 Results for A New Energy Backbone for Low Emissions Constraint...........................................A.29
A.20 Results for Beyond the Standard Suite for Very High Emissions Constraint...............................A.30
A.21 Results for Beyond the Standard Suite for High Emissions Constraint .......................................A.31
A.22 Results for Beyond the Standard Suite for Medium Emissions Constraint..................................A.32
A.23 Results for Beyond the Standard Suite for Low Emissions Constraint........................................A.33
A.24 World Emissions of Non-CO2 Greenhouse Gases in the Baseline Cases.....................................A.36

ix
A.25 World Emissions of Non-CO2 Greenhouse Gases in the High Emissions-Constrained Baseline Case ............................................................................................................................A.36
A.26 World Emissions of Non-CO2 GHGs for Closing the Loop on Carbon.......................................A.38
A.27 World Emissions of Non-CO2 GHGs for A New Energy Backbone ............................................A.38
A.28 World Emissions of Non-CO2 GHGs for Beyond the Standard Suite..........................................A.39
A.29 World Emissions of Non-CO2 Greenhouse Gases under A New Energy Backbone, Very High Emissions-Constrained Case ....................................................................................A.39

x
Tables
3.1 U.S. GHG Emissions by Source, 2002 ........................................................................................ 3.2
4.1 World Energy Demand and CO2 Projections, 1990-2025............................................................. 4.1
5.1 Emissions-Constrained Cases Examined ..................................................................................... 5.2
7.1 Cases Modeled ........................................................................................................................... 7.2
A.1 Assumptions in the Reference Case and Baseline Cases, as well as Advanced Technology Cases ......................................................................................................................................... A.5
A.2 Advanced Technology Assumptions for Other GHGs ................................................................. A.8
A.3 Costs of Meeting the Emissions Constraints for the Various Cases ............................................A.40
A.4 Percentage Reduction in Costs for Achieving Emissions Constraints, Compared to Baseline .....A.42

xi
Acronyms, Abbreviations and Initialisms
BSS Beyond the Standard Suite (scenario) CCSP U.S. Climate Change Science Program CCTP U.S. Climate Change Technology Program CDIAC Carbon Dioxide Information Analysis Center CH4 Methane CLC Closing the Loop on Carbon (scenario) CO2 Carbon Dioxide DOE U.S. Department of Energy EIA Energy Information Administration EJ Exajoules EMF Energy Modeling Forum, Stanford University EPA U.S. Environmental Protection Agency GHG Greenhouse Gas Gt Gigatonnes (109 tonnes or metric tons) GtC Gigatonnes (109 tonnes or metric tons) of Carbon GtC-eq. Gigatonnes (109 tonnes or metric tons) of Carbon Equivalent (emissions) GWP Global Warming Potential HFC Hydrofluorocarbon IEA International Energy Agency IPCC Intergovernmental Panel on Climate Change MiniCAM Mini Climate Assessment Model (Pacific Northwest National Laboratory) N2O Nitrous Oxide NAS National Academy of Sciences NEB A New Energy Backbone (scenario) ODS Ozone-Depleting Substance PFC Perfluorocarbons PNNL Pacific Northwest National Laboratory ppm parts per million PV Present Value R&D Research and Development; also Research, Development, and Demonstration or Research,
Development, Demonstration, & Deployment SF6 Sulfur Hexafluoride SOx Sulfur Oxides SRES Special Report on Emissions Scenarios UN United Nations UNDP United Nations Development Program UNFCCC United Nations Framework Convention on Climate Change W/m2 Watts per Square Meter WRE T. Wigley, R. Richels, and J. Edmonds (researchers who developed emissions trajectories that
were projected to lead toward stabilization of CO2 emissions over the next several hundred years at minimum economic cost)

xii

1.1
1.0 Introduction
Although the scientific understanding of climate change is incomplete, the potential ramifications of increasing accumulations of carbon dioxide (CO2) and other greenhouse gases (GHGs) in the Earth’s atmosphere have heightened attention on anthropogenic sources of GHG emissions and various means for mitigation. As a signatory to the United Nations Framework Convention on Climate Change (UNFCCC), the United States shares with many countries the desire to achieve the UNFCCC’s ultimate objective: “…stabilization of greenhouse gas concentrations in Earth’s atmosphere at a level that would prevent dangerous anthropogenic interference with the climate system . . . within a time-frame sufficient to allow ecosystems to adapt naturally to climate change, to ensure that food production is not threatened, and to enable economic development to proceed in a sustainable manner” (UN 1992). Meeting this ultimate objective will likely require fundamental changes in the way the world produces and uses energy, as well as in many other GHG-emitting activities within the industrial, agricultural, and land use sectors of the global economy. New and revolutionary technologies could potentially facilitate such changes over the course of the 21st Century by reducing, avoiding, capturing, storing and sequestering GHG emissions, while also continuing to provide the energy-related and other services needed to sustain economic growth.
This report documents an analysis of the role that advanced technology could play in addressing the global climate challenge. The analysis was conducted by staff members of Pacific Northwest National Laboratory (PNNL) for the U.S. Climate Change Technology Program (CCTP) in support of CCTP’s strategic planning process. The CCTP, led by the U.S. Department of Energy (DOE), coordinates the Federal government’s nearly $3 billion annual investment in climate-related technology research, development, demonstration, and deployment (R&D), which is carried out by twelve Federal agencies. The CCTP was chartered by the President to:
1. Evaluate the current state of U.S. climate change technology R&D across all participating agencies and make recommendations for improvement;
2. Provide guidance on strengthening basic research at universities and national laboratories;
3. Develop opportunities to enhance private-public partnerships in applied R&D and expedite innovative and cost-effective approaches to reduce GHG emissions;
4. Make recommendations for funding demonstration projects for cutting-edge technologies;
5. Develop improved technologies for measuring and monitoring gross and net GHG emissions; and
6. Enhance coordination across Federal agencies, and among the Federal Government, universities, and the private sector” (The White House 2001).(a)
For over a decade, PNNL has been developing and using a set of integrated assessment models to analyze the role that technology plays in determining future emissions of greenhouse gases (GHGs) and the economic implications of reducing these emissions. The CCTP asked PNNL to support its planning (a) Additional details on CCTP are available at URL: www.climatetechnology.gov

1.2
process by conducting two tasks. First, working closely with CCTP, PNNL formulated a set of three advanced technology scenarios, each representing a class of technology futures that might lead to stabilization of atmospheric greenhouse gas concentrations at a variety of stabilization levels, while maintaining economic prosperity. These scenarios were based on a review of published long-term energy and emissions scenarios and consultations with experts in R&D planning, technology, climate change, and economics. Each of these scenarios qualitatively describes a set of future technological developments; they are “storylines,” without specific technology assumptions, that serve as a framework for interpreting past analyses and for conducting further CCTP analysis activities. The second task was to construct specific, illustrative cases for each scenario, and explore those cases using an integrated assessment model called the Mini Climate Assessment Model (MiniCAM), which was developed by PNNL. In consultation with CCTP, PNNL developed specific assumptions and then modeled several variations (cases) within each of these advanced technology scenarios. Finally, CCTP and PNNL analyzed the energy, emissions and economic implications of the scenarios.
Scenario analysis is a well-established analytical approach for exploring complex interrelationships of large numbers of variables and for making decisions under uncertainty. Scenarios describe hypothetical future conditions; they are not predictions. The scenarios described in this report are technology scenarios and are not linked specifically with a particular level of GHG emissions reduction or stabilization. They represent technological developments that might lead to stabilization over a wide range of future energy demands, population and economic growth rates, and other factors about which we cannot be certain today.
In the analysis described in this report, the three sets of advanced technology assumptions that were constructed to illustrate the three scenarios were explored under four hypothetical GHG emissions constraints linked to a range of GHG stabilization levels. The emissions constraints were not tied to any set of policy measures or other initiatives aimed at achieving stabilization. Use of this range of emissions constraints allows us to explore the importance of technology developments under a variety of different future conditions.
This report describes the scenarios, documents the assumptions used in the model runs (cases), and provides an analysis of the results. For context, the report also contains some background information about current quantities and sources of GHG emissions, the potential for growth in those emissions over time, and the emission reductions that might be needed to stabilize GHG concentrations in the atmosphere.
The remainder of the report is organized as follows:
• Chapter 2 provides an overview of the climate change challenge, and the potential role of technology in addressing the challenge.
• Chapter 3 discusses current emissions and sources of GHGs.
• Chapter 4 explores future trends in emissions.
• Chapter 5 discusses the emissions implications of stabilizing atmospheric GHG concentrations.

1.3
• Chapter 6 presents the three technology scenarios formulated by PNNL in coordination with CCTP.
• Chapter 7 describes the methodology and specific assumptions made for the illustrative cases that were modeled using MiniCAM.
• Chapter 8 presents the energy, emissions and economic results of the modeling exercise.
• Chapter 9 lists the cited references.
Additional detail on methodology and results are provided in Appendix A.

1.4

2.1
2.0 The Climate Change Challenge and the Potential Role of Technology
This chapter explains what we mean by stabilizing GHG concentrations and why the pathway to stabilization is uncertain (Section 2.1) and describes the potential role of energy and other technologies in reducing GHG emissions (Section 2.2).
2.1 The Climate Change Challenge
Most long-term, prospective analyses of the GHG emissions indicate that a significant increase in anthropogenic emissions of GHGs could occur over the next 100 years. The increase results primarily from population growth and continued expansion of world economic activity, accompanied by growth in energy consumption, a continuation of existing patterns of energy supply (combustion of fossil fuels), land use changes, and industrial and agricultural production.
Growing concern over increasing emissions of GHGs and the resulting increases in GHG concentrations in the atmosphere led to the adoption of the UNFCCC on May 9, 1992, by 157 countries, including the United States. As discussed in Chapter 1, the UNFCCC calls for the stabilization of GHG concentrations at a level that would prevent dangerous anthropogenic interference with the climate system. The stabilization of GHG concentrations at any atmospheric concentration level implies that global additions of GHGs to the atmosphere and global withdrawals of GHGs from the atmosphere must come into balance. This means that net emissions of GHGs would need to slow in growth, eventually peak, begin a long-term decline, and ultimately approach a level that is low or near zero. The concentration level implied by the UNFCCC goal is not known and remains a key planning uncertainty. Accordingly, the analysis described this report is not focused on any specific level of stabilized GHG concentrations.
The timing and pace of actions that may be needed to attain the UNFCCC ultimate objective, or to facilitate progress toward that objective, are also uncertain. Actions that may eventually be deemed necessary could require decades or more to become fully implemented, take effect, and achieve desired results. If an evolution were to take place toward low or near-zero emissions technologies, the commercial readiness of such technologies would need to precede this process.
The scope and magnitude of such an evolution would likely be significant. In the year 2000, world energy demand was about 400 exajoules (EJ), according to the Intergovernmental Panel on Climate Change(a) (IPCC 2000). Based on various assumptions about long-term future economic development, demographic and technological trends, many studies project energy demand to grow to between 800 EJ and 2000 EJ/year by the end of the 21st Century (IPCC 2000). In the year 2000, world emissions of CO2 were approximately 6.5 gigatonnes (109 tonnes or metric tons) of carbon (GtC). Some analyses indicate that unconstrained CO2 emissions could increase to as much as 35 GtC/year by the end of the century (IPCC 2000; see Appendix A).
(a) The IPCC was established in 1988 as a joint body of the World Meteorological Organization (WMO) and the
United Nations Environmental Program (UNEP).

2.2
Of the modeling results recently published by the IPCC (IPCC 2001a), a majority indicate that, if the world were to pursue a goal of stabilizing CO2 concentrations in the atmosphere, at any one of a wide range of plausible concentration levels, net emissions of CO2 from all world sources would need to be reduced to within a range of 3 to 9 GtC/year by the end of the 21st Century (IPCC 2001a). In other words, such emissions would need fall within a range of 0.5 to 1.5 times that of today, while also accommodating a two- or three-fold (or more) increase in energy production and use. Thus, the total reduction needed could be as high as 30GtC.(a)
The examples in Box 2.1 illustrate measures, stated in terms of today’s technology, that could achieve a reduction of one GtC/year. As these examples suggest, today’s technologies would have to be implemented on a very large scale to successfully reduce a single GtC, but achieving the UNFCCC ultimate objective may someday require reductions on the order of tens of GtC. The costs of achieving such reductions using today’s technology could therefore be very high. The challenge for science and technology R&D is to develop far more efficient and less costly versions of these technologies or to identify novel breakthrough technologies that can significantly reduce emissions and meet the world’s increasing need for energy, while maintaining economic growth and ensuring safety and overall environmental quality.
Other than CO2, several other gases, aerosols, and anthropogenic activities can have warming or cooling effects on the atmosphere, as depicted on Figure 2.1. Each can affect climate change. Technological opportunities exist for reducing these emissions. Among the non-CO2 greenhouse gases, the more significant are methane (CH4), arising from natural gas production, transportation and distribution systems, bio-degradation of waste in landfills, mining, and agricultural production, and nitrous oxide (N2O), arising from certain industrial and agricultural activities. Fluorine-containing halogenated substances (e.g., HFCs, PFCs), sulfur hexafluoride (SF6), and other gases with high global warming
(a) The 30 GtC value represents the approximate difference between the maximum projection of unconstrained
emissions in 2100 (which is approximately 35GtC/year, as discussed in the previous paragraph) and the lower end of the range estimated by the IPCC to be needed for stabilization (3GtC/year in 2100), discussed in this paragraph.
Box 2.1 How Big is a Gigaton?
Actions that provide 1 Gigaton/year of carbon mitigation using today’s technology: Coal-Fired Power Plants. Build 1,000 “zero-emission” 500-MW coal-fired power plants (in lieu of coal-fired plants without CO2 capture and storage) Geologic Sequestration. Install 3,700 sequestration sites like Norway’s Sliepner project (0.27 MtC/year) Nuclear. Build 500 new nuclear power plants, each 1 GW in size (in lieu of new coal-fired power plants without CO2 capture and storage) Efficiency. Deploy 1 billion new cars at 40 miles per gallon (mpg), instead of 20 mpg Wind Energy. Install capacity to produce 150 times the current U.S. wind generation (in lieu of coal-fired power plants without CO2 capture and storage) Solar Photovoltaics. Install capacity to produce 10,000 times the current U.S. solar PV generation (in lieu of coal-fired power plants without CO2 capture and storage) Biomass Fuels from Plantations. Convert a barren area about 15 times the size of Iowa’s farmland (about 33 million acres) to biomass crop production CO2 Storage in New Forest. Convert a barren area about 40 times the size of Iowa’s farmland to new forest

2.3
Figure 2.1. Radiative Forcing of Various Atmospheric Constituents and Relative Uncertainties (Source: CCSP 2003)
potential (GWP), can also contribute to atmospheric warming. The IPCC’s Third Assessment Report (IPCC 2001b) states that well-mixed non-CO2 gases, including CH4, N2O, fluorocarbons, and other gases with high global warming potential (GWP), may be responsible for as much as 40 percent of the estimated increase in radiative climate forcing observed between the years 1750 and 2000.(a) This relative percentage is expected to decline over the coming decades. In addition, other actors, including black
(a) Radiative forcing is a measure of the overall energy balance in the Earth’s atmosphere. It is zero when all
energy flows in and out of the atmosphere are in balance, or equal. If there is a difference, it is usually expressed in terms of watts per square meter (W/m2), averaged over the surface of the Earth. When it is positive, there is a net “force” toward warming, even if the warming itself may be slowed or delayed by other factors, such as the heat-absorbing capacity of the oceans or the melting of large natural ice sheets.

2.4
carbon (soot), tropospheric ozone precursors, and other aerosols can have effects on the Earth’s overall energy balance, but less is known about these effects.
Globally, human activities other than fossil fuel use, such as land conversion and agricultural practices, are also known to be contributing to radiative forcing. During the past 150 years, land use and its associated changes were responsible for an estimated one-third of all human emissions of carbon dioxide (IPCC 2001b). These changes include the conversion of forest and grassland to crop and pastureland and the depletion of soil carbon through agricultural and other land management practices. Practices such as livestock grazing, manure management, and soil fertilization also affect emissions of other GHG gases, such as methane (CH4) and nitrous oxide (N2O). There are large opportunities to increase carbon storage on land through improved land management practices that can restore depleted carbon stocks.
2.2 The Role of Energy and Other Technologies
Energy has played an important role in global economic growth since the industrial revolution and continues to be an essential input to the global economy. Forecasts of long-term energy demand suggest that world energy consumption may increase three- to five-fold or more over the course of this century.(a) Structural changes in the world economy and accelerated improvement in energy efficiency are expected to slow the growth rate of total energy demand relative to the economic growth rate, but even under these circumstances, demand for fuels and power would be expected to grow significantly.
Today, most energy is supplied by the combustion of fossil fuels, accompanied by unconstrained emissions of the combustion byproducts, including emissions of CO2. In 2000, CO2 emissions accounted for about 80 percent of all GHG emissions. If today’s fuel mix persists into the future, fossil fuels would likely supply much of the world’s energy well into the 21st Century, and CO2 emissions would continue to increase.
To reduce the rate of growth of CO2 emissions and eventually reverse it, while minimizing any deleterious economic consequences, advanced technologies would be needed that can meet the energy needs of society, while lowering the CO2 emissions per unit energy consumed. Some of the energy use and production technology developments that could help achieve this aim include:
• Development of advanced, highly energy-efficient end use technologies in industry, buildings and transportation
• Improved energy production and transformation efficiencies, e.g., increased efficiency of electricity generation and transmission
• Advancements in low- or near net-zero CO2 energy supply technologies, such as nuclear, biomass, solar, wind and other renewable energy technologies,
(a) The IPCC’s Special Report on Emission Scenarios (IPCC 2000) reports long-term energy demand for 40
different future energy scenarios. These scenarios suggest that by 2100, primary energy demand may be as much as 6.5 times higher than it is today.

2.5
• Development of CO2 capture and storage technologies that could be used in conjunction with fossil fuel combustion
• Development of low-CO2 methods for production of hydrogen for use in fuel cells and other end use technologies in both transportation and stationary applications, accompanied by hydrogen distribution and storage technologies
• Development of advanced bio-technologies
• Development of new forms of energy such as fusion energy and other novel technologies not yet commercially developed or even discovered
The strong and growing demand for energy and related infrastructure in the emerging and developing economies of the world adds to the importance of accelerating advanced technology development. Much of the developing world is now building its future infrastructure. Once built, infrastructure is slow to change. Power plants, industrial facilities, buildings, and cities can endure for a long time. Development and adoption of advanced low-emission technologies could avoid decades of emissions from conventional technologies.
Another important method of reducing atmospheric concentrations of CO2 is terrestrial and other forms of carbon sequestration. The potential storage and sequestration capacity for CO2 in various “sinks” is quite large. Some estimates indicate that about 83 to 131 GtC could be sequestered in forests and agricultural soils by 2050 (IPCC 2001c).
Advanced technologies can also play an important role in reducing the growth of non-CO2 GHGs. For instance, advanced methods are available or under development, or could be developed, to reduce methane emissions from coal mining, natural gas and oil production, landfills and wastewater systems, livestock waste, and rice cultivation. Advanced technologies and methods may also lower N2O emission rates for stationary and mobile fuel combustion systems, wastewater treatment systems, industrial processes, agricultural soils, and other sources. In addition, substitutes for ozone depleting substances (ODS) and methods to reduce high warming potential gases such as SF6 and PFCs may prove important.
Published studies generally agree that successful development and deployment of advanced technologies could achieve large reductions in GHG emissions at comparatively lower costs than if today's technologies were used to achieve the same level of reduction. The analysis conducted for this report and other analyses documented in the literature indicate that advancements in technology have the potential to reduce the cost of stabilization by hundreds of billions to trillions of dollars,(a) and these same technological advances may have economic and environmental benefits (such as reducing criteria air pollutants) that extend well beyond the climate context.
(a) As reported in the IPCC’s Third Assessment (IPCC 2001a) and other studies and shown in the CCTP scenarios
developed for this report.

2.6

3.1
3.0 Current Sources of GHG Emissions
In 2000, worldwide anthropogenic sources of GHGs contributed approximately 12 Gigatonnes of carbon equivalent emissions (GtC).(a) Of these, CO2 emissions from fossil fuel combustion accounted for 6.5 GtC (EIA 2004a) or 54 percent of the total; CO2 emissions from industrial activities accounted for about 0.7 GtC (Humphreys et al. 2002) or 6 percent of the total; deforestation accounted for 2.1 GtC of CO2 (CDIAC 2004) or 17 percent of the total; and other (non-CO2) GHGs accounted for 2.8 Gt of carbon equivalent (C-eq.) emissions (EPA 2004a) or 23 percent of the total.
Both world and U.S. emissions of GHGs have been increasing over time. According to the latest EPA inventory of greenhouse gases in the United States (EPA 2004b), U.S. CO2 emissions increased by 15 percent between 1990 and 2002, primarily as a result of increased energy use, and total GHG emissions increased by 12 percent. According to the EPA inventory, activities in the United States in 2002 led to total GHG emissions of approximately 1.9 GtC (about 16 percent of world emissions). Eighty-five percent of the U.S. emissions in 2002 were a product of energy use, primarily the combustion of fossil fuels (see Table 3.1). Based on the data in Table 3.1, emissions from petroleum products used in transportation combined with those from oil combustion in stationary sources made petroleum use the largest U.S. source of CO2 emissions in 2002, contributing 0.66 GtC (43 percent of the total CO2 emissions). Coal used in stationary sources accounted for over one-third of total CO2 emissions from fossil fuel combustion in the United States in 2002. Natural gas combustion contributed about 20 percent of total U.S. CO2 emissions.
Table 3.1 also shows that land use and forestry activities in 2002 resulted in a net sequestration of 0.19 GtC,(a) representing an offset of approximately 12 percent of total U.S. CO2 emissions. Net sequestration from land use and forestry activities in the United States declined by approximately 28 percent between 1990 and 2002, primarily as a result of a decrease in the rate of carbon accumulation in forests (EPA 2004b). Further detail on U.S. emissions is shown in Figures 3.1 and 3.2. Fossil-fueled power plants that generate electricity (shown as “Electric Utilities” in Figure 3.1) were the largest individual source category for CO2 emissions in the United States, followed by transportation (mostly motor vehicles) and industrial fuel combustion in boilers and process heaters. Together these three major source categories contributed 75 percent of total emissions. Of the remaining quarter, residential and commercial fuel use (combined) and agriculture each accounted for 9 percent. Three percent came from waste disposal activities (incineration), and another 3 percent was emitted from industrial processes, including manufacture of cement and iron and steel.
(a) Values presented in this section are expressed in terms of carbon or carbon equivalents. The total of 12 GtC is
the sum of the other values cited in the paragraph. (a) In addition to forests, the values presented for net sequestration of carbon in the United States include the wood
products industry, agricultural soils, land filled yard trimmings, and urban trees.

3.2
Table 3.1. U.S. GHG Emissions by Source, 2002
2002 Emissions (GtC-Equivalent) Source Category(a) CO2 CH4 N2O Other Total
Energy Use Stationary Combustion – Coal 0.54 0.54 Stationary Combustion –Natural Gas 0.31 0.31 Stationary Combustion – Petroleum Products 0.18 0.18 Mobile Combustion – Petroleum Products 0.48 0.01 0.49 Other Energy Use 0.05 0.05
Sub-Total Energy Use 1.51 0.05 0.01 0.02 1.58
Industrial Processes 0.03 0.04 0.06
Agriculture 0.08 0.08 0.16
Waste 0.01 0.06 0.06
Total Emissions 1.55 0.19 0.09 0.06 1.87 Percent of Total 82.8% 10.2% 4.8% 3.2% CO2 Sequestration from Land Use and Forests 0.19 0.19 Net Emissions(a) 1.36 1.68 (a) “Total Emissions” minus “CO2 Sequestration from Land Use and Forests” Source: EPA 2004b.
When CO2 emissions from electricity generation are allocated to end-use sectors, the residential and commercial sectors combined accounted for 37 percent of total U.S. CO2 emissions (Figure 3.2); the industrial sector (including non-energy industrial process emissions, as well as industrial fuel and electricity consumption) accounted for 31 percent; and transportation accounted for 31 percent. Waste disposal, agricultural activities and minor other sources accounted for the remainder.
Waste Disposal
0.01 GtC1%
Other0.01 GtC
1%
Commercial Fuel0.06 GtC
4%
Residential Fuel0.10 GtC
6%
Industrial Fuel 0.26 GtC
17%
Transportation Fuel
0.48 GtC31%
Electric Utilities0.60 GtC
38%
Industrial Processes0.03 GtC
2%
Figure 3.1. U.S. CO2 Emissions, by Source, 2002
Other0.01 GtC
(1%)
Waste Disposal0.01 GtC
(1%)
Residential Energy
0.31 GtC(20%)
Commercial Energy
0.26 GtC(17%)
Industrial Energy and Processes
0.48 GtC(31%)
Transportation0.48 GtC
(31%)
Figure 3.2. U.S. CO2 Emissions, by End-Use Sector, 2002
(Source for Figures 3.1 and 3.2: Drawn from data in EPA 2004b.)

3.3
As discussed previously, the Third Assessment Report by the IPCC (2001b) states that “well-mixed” non-CO2 gases, including methane, nitrous oxide, chlorofluorocarbons, and other gases with high-global warming potential account for as much as 40 percent of the estimated increase in radiative forcing between the years 1750 and 2000 (see Figure 1.1). The most important of these non-CO2 gases is methane (CH4), the principal component of natural gas (see Table 3.1). Methane is emitted from various energy-related activities (natural gas, oil and coal exploration and operations), as well from agricultural sources (e.g., emissions from cattle digestion and rice cultivation) and waste disposal facilities (landfills and wastewater treatment plants). Methane emissions have declined in the United States since the 1990s, due to voluntary programs to reduce emissions and a regulation requiring the largest landfills to collect and combust their landfill gas.
Another important gas is nitrous oxide (N2O), which is emitted primarily by the agricultural sector through direct emissions from agricultural soils and indirect emissions from nitrogen fertilizers used in agriculture. Methane and N2O account for 10 percent and 5 percent of total U.S. GHGs, respectively, in terms of carbon equivalence (EPA 2004b). Other gases, including certain fluorine-containing halo-genated substances (e.g., HFCs, PFCs and sulfur hexafluoride or SF6,) accounted for about 3 percent of total U.S.GHG emissions in 2002 (EPA 2004b). These gases are used or produced by a variety of industrial processes, and in most cases, emissions were very low in 1990 and have grown rapidly since then. Total emissions of the other greenhouse gases, by source, are shown in Figure 3.3.
0.05 GtC
0.08 GtC
0.06 GtC
0.01 GtC<0.01 GtC
0.08 GtC
0.04 GtC
0.00
0.02
0.04
0.06
0.08
0.10
0.12
0.14
0.16
0.18
0.20
Gig
ato
nn
es o
f C
arb
on
Eq
uiv
alen
t
CH4 N2O Other
Waste
Agriculture
Industrial Processes
Energy Use
Figure 3.3. U.S. Emissions of Non-CO2 Greenhouse Gases, by Source, 2002 (Source: Drawn from data in EPA 2004b.)

3.4

4.1
4.0 Potential Growth in GHG Emissions
This chapter presents projections of world energy demand, followed by projections of CO2 and other GHG emissions. This chapter also sets the stage for the modeling analysis that is discussed in later chapters by introducing a Reference Case developed for CCTP that will be compared to the illustrative advanced technology cases.
4.1 Projected Growth in Energy Demand
In 2000, world primary energy use was ~400 exajoules (EJ), and the U.S. Energy Information Administration (EIA) projects total world energy demand in 2025 will be 675 EJ/year (Table 4.1). While energy use in the developed world is expected to increase 36 percent between 2001 and 2025, energy use in Asia and Central/South America is expected to approximately double. At the present time, 1.7 billion people in the world have no access to electricity, and 2 billion people are without clean and safe cooking fuels, relying instead on traditional biomass (UNDP 2000). Most projections assume that a greater percentage of the world’s population will gain access to commercial energy over the course of the 21st Century, as well as experience improvements in their quality of life, resulting in increased energy use per capita. In addition, world population is expected to grow significantly, further increasing upward pressure on overall energy demand.
Several long-term modeling efforts have made energy demand projections to 2100. For example, the Special Report on Emissions Scenarios (SRES) by the IPCC (2000) includes projections produced by six of the world’s leading energy-economic models that were used to explore a suite of scenarios that projected growth in global energy. Of all the scenarios included in SRES, 90% projected world primary energy use in 2100 to be between 600 and 2800 EJ.
Table 4.1. World Energy Demand and CO2 Projections, 1990-2025
Energy Demand (EJ) Carbon Dioxide Emissions (GtC) Year Year
Region 1990 2001 2010 2025
Percent Increase, 2001-2025 1990 2001 2010 2025
Percent Increase, 2001-2025
Industrialized Countries
193 223 253 304 36 2.8 3.2 3.6 4.3 34
Eastern Europe and the Former Soviet Union
80 56 70 87 55 1.3 0.86 1.0 1.3 51
Developing Countries
94 147 184 284 93 1.7 2.5 3.1 4.7 88
Asia 55 90 116 184 104 1.1 1.6 2.1 3.3 106 Middle East 14 22 26 38 73 0.23 0.36 0.42 0.60 67 Africa 10 13 15 21 62 0.18 0.23 0.26 0.36 57 Central and South America
15 22 27 41 86 0.19 0.26 0.32 0.52
100
Total World 368 426 507 675 58 5.9 6.5 7.7 10.3 58 Sources: 1990 and 2001: EIA 2003a. 2010 and 2025: EIA 2003b.

4.2
Based on a review of these scenarios, PNNL worked closely with CCTP to construct a specific Reference Case that falls within the middle of the range of scenarios explored in the IPCC study. This case serves as a “point of reference” from which the advanced technology cases (discussed in Chapter 7) can be compared. The rates of technological advance in the Reference Case are designed so that, in the near term, energy efficiency and energy supply technologies improve at rates similar to historical trends and, in the long term, emissions and energy results fall toward the middle of the IPCC projections. The average improvement in end-use energy intensity increases at about 1 percent per year throughout the 21st Century in the Reference Case.(a) Costs of energy technologies, such as solar, wind, biomass, and nuclear, are assumed to decline over time as the technologies improve and mature. Fossil fuels are assumed to continue to be a cost-competitive, abundant source of energy in this case, but carbon capture and storage is assumed to be unavailable. The Reference Case assumes a moderate growth rate of 2 percent for economic development and that population reaches 9 billion by 2100. (See Appendix A for a more detailed explanation of the assumptions in the Reference Case.)
While the Reference Case includes important assumptions about the evolution of technology over the remainder of the century, none of these technology assumptions should be interpreted as predictions of what would happen absent any particular U.S. or other nation’s R&D actions. The Reference Case serves as plausible benchmark against which the three illustrative advanced technology cases can be consistently compared, and it provides one plausible illustration of how energy consumption and GHG emissions might grow over time, even if technology does advance.
By 2100, total energy demand in the Reference Case is projected to increase more than three-fold, from about 400 EJ/year today to 1200 EJ/year by the end of the century (Figure 4.1). Fossil fuels are projected to provide most of the primary energy supply within the global energy system. However, the Reference Case also shows significant global expansion in the use of renewable energy (solar, wind, geothermal, and hydroelectric energy), nuclear energy, and energy derived from biomass (biomass used for production of electricity, gaseous, and liquid fuels).
4.2 Projected Growth in CO2 Emissions
According to EIA (2003b), by 2025 annual global CO2 emissions may be about 60 percent higher than in 2001, with growth higher in the developing regions of the world, where CO2 emissions may increase by a factor of two or more by 2025 (Table 4.1). In 2025, global use of petroleum products (see “Oil” in Figure 4.2), primarily in the transportation sector, is expected to continue to account for the largest share of global emissions of CO2. This is followed in importance by the use of coal, primarily for electricity generation, and natural gas, which is used for power generation, residential/commercial fuel, and many other uses. For the United States (Figure 4.3), EIA projects that by 2025, total CO2 emissions will increase by 30 percent above the level in 2002.
Longer-term projections of CO2 emissions were compiled during the analysis conducted by IPCC (SRES) of multiple reference scenarios from six long-term modeling efforts. Ninety percent of the CO2
(a) The average improvement in end-use energy intensity is assumed to be ~1 percent/year, based on historical rates
discussed in IEA 2001 (p. 27). Thus, by 2050, the end-use energy intensity of the economy is assumed to be almost 40 percent lower than in 2004.

4.3
-
200
400
600
800
1,000
1,200
1,400
1990 2005 2020 2035 2050 2065 2080 2095Year
EJ/
yr
Coal Oil Gas Nuclear Renewables Biomass
Figure 4.1. World Primary Energy Demand: 1990-2100: Reference Case
Figure 4.2. Projections of World CO2 Emissions, 1990-2025 (Source: Drawn from data in EIA 2004a.)

4.4
Figure 4.3. Projections of U.S. CO2 Emissions, 1990-2025 (Source: Drawn from data in EIA 2004b)
projections fall within the bounds shown in Figure 4.4. The upper bound is formed by scenario results that assume very high world economic growth, high per-capita energy use, and continued use of fossil fuels. At this upper bound, CO2 emissions from energy use were projected to grow from about 6 GtC/year in 2000 to more than 30 GtC/year in 2100 – a five-fold increase. The lower bound is formed by scenarios that assume lower population growth, lower per capita energy use, more energy efficiency, and considerably higher use of carbon-neutral fuels, compared to the upper bound. At this lower bound, CO2 emissions are projected to grow for the first half the century, but then to decline to levels about equal to those in 2000 – representing no net growth by 2100.
The projection of CO2 emissions in the Reference Case falls in the middle of the range of the projections for reference scenarios reviewed in the IPCC’s SRES report. Because energy demand is projected to increase more than three-fold by the end of the century, CO2 emissions also are projected to rise three-fold – from about 6 GtC/yr in 2000 to slightly over 19 GtC/yr in 2100 (see Figure 4.5). Appendix A provides more details on the assumptions underlying the Reference Case.
Carbon emissions and sequestration from various land uses will affect net CO2 emissions and will be driven by increasing demand for food by a growing population and changing diets. In addition, other factors such as demand for wood products, land management intensity, demand for biomass energy and bio-based products, and technological change will influence carbon emissions and sequestration on lands. Projections of changes in emissions from land use were not conducted by PNNL for this report.

4.5
Figure 4.4. World CO2 Emissions Projected in IPCC Reference Cases, 1990-2100 (Note: Of all cases presented in the IPCC analysis, 90% of the scenarios had projected emission levels that fall above the blue “5%” line and below the green “95%” line. Source: Data from IPCC 2000, for upper and lower bounds.)
-
5
10
15
20
25
1990 2005 2020 2035 2050 2065 2080 2095
Year
GtC
/yr
Coal Oil Gas
Figure 4.5. World CO2 Emissions from Fossil Fuels, 1990-2100: Reference Case
4.6
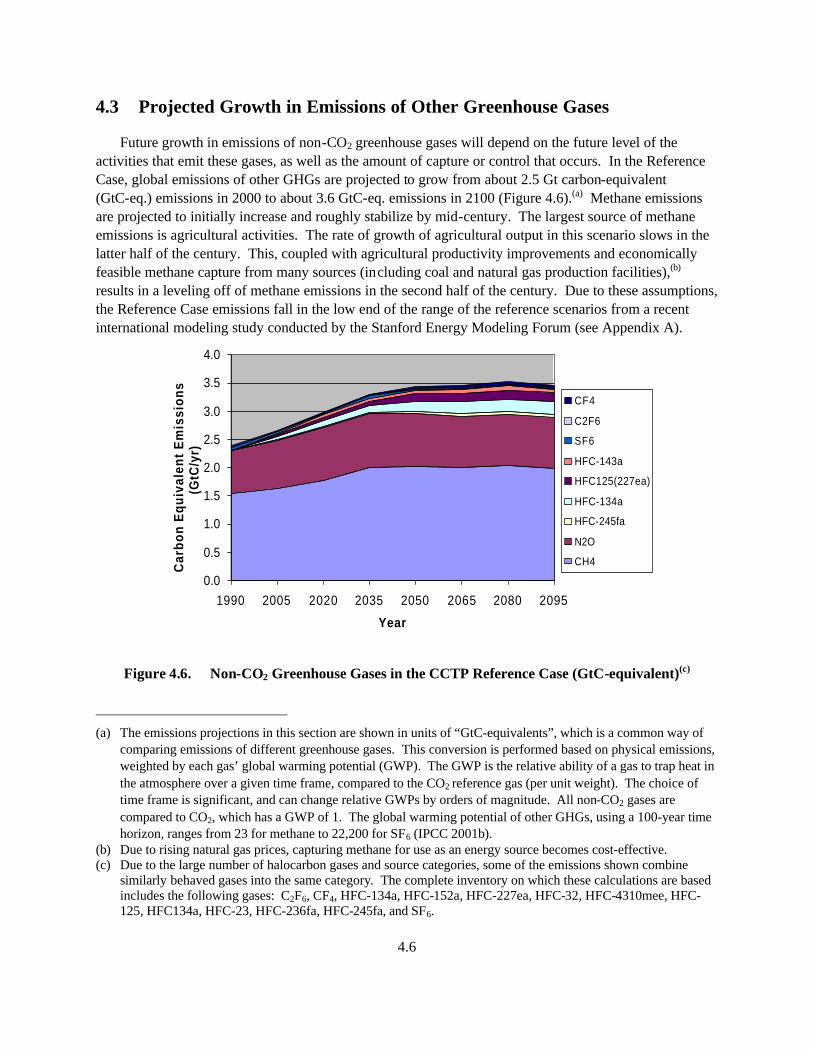
4.3 Projected Growth in Emissions of Other Greenhouse Gases
Future growth in emissions of non-CO2 greenhouse gases will depend on the future level of the activities that emit these gases, as well as the amount of capture or control that occurs. In the Reference Case, global emissions of other GHGs are projected to grow from about 2.5 Gt carbon-equivalent (GtC-eq.) emissions in 2000 to about 3.6 GtC-eq. emissions in 2100 (Figure 4.6).(a) Methane emissions are projected to initially increase and roughly stabilize by mid-century. The largest source of methane emissions is agricultural activities. The rate of growth of agricultural output in this scenario slows in the latter half of the century. This, coupled with agricultural productivity improvements and economically feasible methane capture from many sources (including coal and natural gas production facilities),(b) results in a leveling off of methane emissions in the second half of the century. Due to these assumptions, the Reference Case emissions fall in the low end of the range of the reference scenarios from a recent international modeling study conducted by the Stanford Energy Modeling Forum (see Appendix A).
0.0
0.5
1.0
1.5
2.0
2.5
3.0
3.5
4.0
1990 2005 2020 2035 2050 2065 2080 2095
Year
Car
bon
Equ
ival
ent
Em
issi
ons
(GtC
/yr)
CF4
C2F6
SF6
HFC-143a
HFC125(227ea)
HFC-134a
HFC-245fa
N2O
CH4
Figure 4.6. Non-CO2 Greenhouse Gases in the CCTP Reference Case (GtC-equivalent)(c)
(a) The emissions projections in this section are shown in units of “GtC-equivalents”, which is a common way of
comparing emissions of different greenhouse gases. This conversion is performed based on physical emissions, weighted by each gas’ global warming potential (GWP). The GWP is the relative ability of a gas to trap heat in the atmosphere over a given time frame, compared to the CO2 reference gas (per unit weight). The choice of time frame is significant, and can change relative GWPs by orders of magnitude. All non-CO2 gases are compared to CO2, which has a GWP of 1. The global warming potential of other GHGs, using a 100-year time horizon, ranges from 23 for methane to 22,200 for SF6 (IPCC 2001b).
(b) Due to rising natural gas prices, capturing methane for use as an energy source becomes cost-effective. (c) Due to the large number of halocarbon gases and source categories, some of the emissions shown combine
similarly behaved gases into the same category. The complete inventory on which these calculations are based includes the following gases: C2F6, CF4, HFC-134a, HFC-152a, HFC-227ea, HFC-32, HFC-4310mee, HFC-125, HFC134a, HFC-23, HFC-236fa, HFC-245fa, and SF6.

4.7
Emissions of N2O follow a similar pattern, peaking before mid-century. The largest N2O emissions source is agricultural soils. For agricultural operations, increases in the efficiency of fertilizer use, stemming from both economic and environmental concerns, lead to stabilization of N2O emissions from the agricultural sector by mid-century, followed by a small decline. (The agricultural sector dominates the N2O emissions profile.)
Emissions of high GWP gases are much lower than CH4 and N2O emissions in 1990, but they are projected in the Reference Case to increase steadily throughout most of the period (these are also shown in Figure 4.6). Again, the slower growth of driving forces (population and income) coupled with productivity improvements eventually leads to stabilization of these emissions later in the century.
Another common metric for evaluating the contribution of various greenhouse gases to global warming is to assess their “radiative forcing.”(a) Most of the gases shown have a positive radiative forcing (i.e., a warming effect). However, sulfur oxide compounds (SOx) have a negative radiative forcing (i.e., a cooling effect), indicated by the negative values in the figure.(b) For the Reference Case, the net global radiative forcing from all of these substances (the sum of the positive radiative forcing associated with the GHGs minus the negative radiative forcing associated with SOx), measured in watts per square meter (W/m2), is projected to increase from about 1.5 W/m2 to about 6.5 W/m2 over the course of the 21st Century – an increase of more than a factor of four (Figure 4.7).
(a) See Chapter 2. (b) Note that black carbon was not considered in the analysis presented here, but as more is learned about its
effects, it may be considered in future CCTP scenario analyses.

4.8
-2
-1
0
1
2
3
4
5
6
7
1900 1950 2000 2050 2100
Year
Rad
iati
ve F
orc
ing
(W
/m2)
CO2CH4N2OHalogensTropospheric OzoneSOXNet ForcingAll Positive Forcings
Figure 4.7. Radiative Forcing of Greenhouse Gases in the Reference Case (Note: The green dashed line in Figure 4.7 represents the sum of all positive radiative forcing, and the blue dashed line represents the net radiative forcing. The solid lines represent the radiative forcing associated with individual gases and sulfate particles.)
5.1
5.0 Stabilizing Concentrations – Potential Implications for Emissions
As discussed in the previous chapters, most long-term modeling projections indicate that global emissions of GHGs will increase significantly over the course of the 21st Century, even as technology improves. Consequently, in order to make progress toward and eventually meet the UNFCCC goal of stabilizing atmospheric GHG concentrations at any given concentration level, GHG emissions would need to slow in growth, eventually level off, and begin a gradual decline, ultimately approaching low or near net-zero levels.
Stabilizing greenhouse gas concentrations in the Earth’s atmosphere is not the same as stabilizing greenhouse gas emissions. Annual emissions represent the amount of greenhouse gases added to the atmosphere in a given year. The concentration of greenhouse gases, measured at any point in time, is the amount of atmospheric greenhouse gas emissions present in a unit volume of air (measured in parts per million, ppm). The concentration results from the accumulation of all past emissions from all sources, minus the amount of greenhouse gases that have been withdrawn through natural processes or removed into carbon “sinks” over time. Even if annual additions of GHG emissions were to stabilize (i.e., remain at a steady level year after year), GHG concentrations would continue to increase. The level at which atmospheric GHG concentrations are harmful is not yet known. Thus, PNNL’s modeling analysis examined scenarios under a range of emission constraints that could each lead to stabilization of atmospheric greenhouse gas concentrations at alternative levels.
For the 100-year timeframe from 2000 to 2100, cumulative CO2 emissions (emissions from each year, added together) in the Reference Case amount to 1350 GtC. The hypothetical carbon constraints selected by CCTP for evaluation in the modeling portion of this study correspond to cumulative CO2 emissions reductions of 800, 500, 300 and 200 GtC from the Reference Case (see Table 5.1, which also shows the cumulative emissions in each case). These reductions are referred to as: a “very high” emissions constraint (corresponding to the lowest level of GHG emissions among the four alternative emissions constraints), a “high” emission constraint, a “medium” emissions constraint, and a “low” emissions constraint (corresponding to the highest level of GHG emissions among the four alternative emissions constraints), As shown in Figure 5.1, PNNL distributed these reductions over time using a mathematical algorithm consistent with standardized “WRE curves” (Wigley et al. 1996).
Figure 5.2 presents the CO2 emissions intensity (CO2 emissions per unit of gross domestic product – GDP – summed over the world) for the Reference Case and each of the emissions-constrained cases. For the purposes of this figure, we assume that the aggregate GDP is comparable in all cases. Relative to the Reference Case, CO2 intensity declines by 83 percent, 66 percent, 50 percent and 37 percent by 2100 for the very high, high, medium and low emissions-constrained cases, respectively.
Based upon input from the EPA, each of the emissions-constrained cases also includes non-CO2 GHG emission reductions. Although many models make projections of these gases, the capability of these models to rigorously examine the economic and environmental tradeoffs associated with reducing CO2 emissions versus other GHG emissions is still under development. Unlike the CO2 emissions that were constrained, by design, to particular levels, the non-CO2 emissions reductions were estimated based on

5.2
technical potential to reduce the different non-CO2 GHG gases from their various sources. As with CO2
emissions, in the emissions-constrained cases, the non-CO2 GHG emissions grow, peak and decline over the course of 21st Century.
0
5
10
15
20
25
1990 2005 2020 2035 2050 2065 2080 2095
Car
bo
n E
mis
sio
ns
(GtC
/yr)
Low Emissions Constraint
Medium Emissions Constraint
High Emissions Constraint
Very High Emissions Constraint
Reference Case
Figure 5.1. World CO2 Emissions for the Reference Case and Four Emissions-Constrained Cases
0
50
100
150
200
250
300
350
1990 2005 2020 2035 2050 2065 2080 2095A
nn
ual
Car
bo
n In
ten
sity
(G
tC/$
mill
ion
GD
P)
Low Emissions Constraint
Medium Emissions Constraint
High Emissions Constraint
Very High Emissions Constraint
Reference Case
Figure 5.2. World CO2 Intensity for the Reference Case and Four Emissions-Constrained Cases
Table 5.1. Emissions-Constrained Cases Examined
Emissions-Constrained Cases
Very High Constraint
High Constraint
Medium Constraint
Low Constraint
Cumulative CO2 Emissions, 2000-2100 (GtC)
550 850 1050 1150
Cumulative CO2 Emissions Reduced from the Reference Case (GtC)
800 500 300 200
Percentage Reduction in CO2 Intensity (GtC/GDP) from the Reference Case in 2100
83 66 50 37

6.1
6.0 Advanced Technology Scenarios
Future need for technology to address the climate change challenge will depend upon a diversity of factors that are presently not fully known, including population growth, future energy demand, climate sensitivity to greenhouse gas emissions, potential pathways to global economic development, and the stringency with which the world chooses to reduce its greenhouse gas intensity over the course of the century. Scenario analysis is a widely accepted approach to planning under complex, uncertain circumstances where a wide range of futures is possible. Scenarios can provide a framework to help understand, among other things, what climate change technologies may be important contributors in the future, when they might need to be available, and at what scales they might need to be deployable to provide a robust technological response to the uncertain climate change challenge.
As part of this study, three “advanced technology scenarios” were formulated. Each is a qualitative description of a set of complementary future technological developments that could lead to stabilization of atmospheric greenhouse gas concentrations at a variety of stabilization levels, while simultaneously sustaining economic development. This chapter describes the process for developing three scenarios, as well as the scenarios themselves.
As initial step in the scenario development process, a wide range of existing scenario analyses developed by other organizations were reviewed, including Shell International (2001), the National Academy of Sciences (NAS 1999), the United Kingdom Department of Trade and Industry (2000, 2001), Natural Resources Canada (2000), the World Business Council for Sustainable Development (1999), and the International Energy Agency (IEA, 2002). Of particular interest was the extensive set of “Post-SRES” modeling runs developed by the IPCC and included in the IPCC’s Working Group Report on Mitigation (IPCC 2001a).
In general, the review of existing scenarios evaluated ones that led to stabilization levels between 450 ppm CO2, which is higher than today’s levels, and 650 ppm CO2, which is lower than many “business as usual” analyses conducted by others. Based on this review and consultation with experts in R&D planning, technology, climate change, and economics, three general classes of technology futures that led to reduced GHG emissions emerged. Each of these advanced technology scenarios include the technological advances necessary to sustain economic prosperity, while simultaneously deploying the technologies necessary to stabilize GHG concentrations at various levels. The scenarios do not define the policy methods that may or may not be necessary to achieve the deployment of climate change technologies.
The three scenarios have several common characteristics. First, in all three, substantial gains in energy-efficiency (both production and demand) lead to substantial reductions in the need for carbon-free primary energy. Additionally, energy carriers of one type or another (e.g., hydrogen, alternative fuels, electricity, etc.) are also important in all three scenarios; for example, alternative energy carriers (e.g., hydrogen or methanol) might serve the transportation sector with energy derived from fossil fuels,

6.2
accompanied by CO2 capture and storage. Further, almost all of the scenarios allow significant realization of the resource potential of conventional oil and gas.(a)
While energy is the organizing principle for the scenarios, it is not the only factor relevant to stabilization. All scenarios assume cost-effective management and significant reductions of emissions of other greenhouse gases (e.g., methane and nitrous oxide) through advanced technology and improvement in management practices. In all scenarios, when non-CO2 greenhouse gases (e.g., methane, nitrous oxide, and aerosols) are managed early in the century, more CO2 can be emitted to the atmosphere early in the century, buying additional time for development of carbon-free or carbon-neutral sources. Similarly, when efforts to “pull” CO2 from the atmosphere through terrestrial sequestration are successful, the CO2 emissions can be higher. Therefore, all three scenarios also include significant deployment of low-cost terrestrial sequestration. Many of these technologies are well established or in advanced stages of development, are relatively cost effective, and can have benefits in the near- to mid-term of the century.
In addition to these common characteristics, the advanced technology scenarios are characterized as follows:
1. Closing the Loop on Carbon is an advanced technology future in which the viability of engineered CO2 sequestration enables the continued use of fossil fuels, which in turn is substantially complemented by other energy sources and derivative energy carriers, including hydrogen . In this scenario, CO2 capture and storage meets key technical, economic, and environmental goals. Coal-based energy-plexes produce electricity, hydrogen, fuels and chemicals, with near-zero emissions. As a result, the existing fossil-based systems have the ability to become carbon-neutral and remain the backbone of the energy system through the century. High efficiency gains are experienced in coal combustion technologies. Supply of nuclear, biomass and renewable energy also increase in this scenario, but these forms of energy do not dominate the energy future in the same way as coal, oil and natural-gas based systems.
2. A New Energy Backbone is an advanced technology future in which nuclear and renewable energy sources become dominant, reducing the proportionate role of fossil fuels and replacing them as the backbone of the energy system. This scenario would most likely come about as a result of either improvements in renewable and nuclear energy technology performance that enable them to capture a larger share of the energy market based purely on their inherent advantages, or limitations that would inhibit CO2 capture and storage from more significant market penetration. In this scenario, the increase in market share for biomass, renewable energy, and nuclear energy leads to a peak and decline in coal use. While diminished in terms of relative market share, fossil fuels could continue to play an important role in 2100.
3. Beyond the Standard Suite is an advanced technology future in which novel and advanced technologies grow to play a major role in the energy system, complementing the standard suite of energy technologies (including improved versions of the traditional technologies). This future explores the possibilities of new breakthrough technologies, such as: fusion energy; combinatorial applications of genetic engineering, nano-technology, and biotechnology as new ways to produce
(a) Except under cases with very high emission reduction requirements.

6.3
fuels or hydrogen and sequester CO2; and technologies for power transmission or beaming that might enable unprecedented expansion of large-scale solar applications. Given the size of the global energy system, it is likely that the standard suite of technologies, including energy efficiency, renewable energy, biomass, and fossil fuels would continue to play a dominant role in this future, as these highly advanced or “exotic” technologies would take decades to mature and penetrate the global energy system to a large extent. However, particularly in the latter half of the 21st Century, such technologies could potentially play a major role in the energy system, especially if research is effective.
These generalized advanced technology scenarios provide the framework for developing more specific advanced technology assumptions and model runs, as described in the next chapter.

6.4

7.1
7.0 Modeling Advanced Technology under Emissions Constraints
In order to explore each of the advanced technology scenarios quantitatively, a series of more specific, illustrative cases were modeled in MiniCAM. These cases simulate significant advancements in technology beyond those included in the CCTP Reference Case.
MiniCAM is an “integrated assessment” model. Integrated assessment models are tools for exploring the complex interrelationships among economic activity, the energy and industrial system, managed and unmanaged ecosystems, the associated greenhouse gas emissions, and the resulting impacts on greenhouse gas concentrations in the atmosphere. Consistent with the nature of the climate change challenge, integrated assessment models generate results over a century-long time scale. MiniCAM was one of the six models included in the IPCC’s Special Report on Emissions Scenarios (SRES) [IPCC 2000]. Appendix A further discusses the MiniCAM.
In the exercise described in this report, the MiniCAM was supplied with various sets of advanced technology cost and performance assumptions, and run under various emissions constraints. MiniCAM made projections of advanced technology market penetration, the associated worldwide GHG emissions, and the cost of meeting the various emission constraints. The assumptions behind the cases were developed in close coordination with CCTP in an effort to support the CCTP strategic planning process. The cases developed are not the only ones that could have been developed with the framework of the three advanced technology scenarios. The particular cases discussed here were conceived by CCTP to: 1) illustrate the plausibility of achieving reduced emissions through various combinations of advanced technologies, and 2) provide rough, order-of-magnitude estimates of the potential cost reductions that might be accompanied by significant levels of technology advancement.
The case-specific assumptions are not explicitly tied to outcomes of Federal R&D efforts, and they are not an attempt to project what is “most likely” to happen. Instead, all of the cases model a specific set of technological advances that could potentially sustain a prosperous future while simultaneously reducing GHG emissions at a cost lower than today’s options. For comparison purposes, the set of cases evaluated for CCTP also includes a Reference Case and baseline cases, as described below.
A total of seventeen cases were modeled using MiniCAM (see Table 7.1). These cases include:
• A “Reference Case” that assumes: 1) future end-use energy efficiency improvements that are generally consistent with historical rates, and technological improvements in energy supply that are based on judgments of how technology might progress over time (see Appendix A for more detail), and 2) no actions aimed specifically at reducing GHG emissions. The Reference Case was designed to be in the middle of the range of “business-as-usual” scenarios in the open literature. This case provides projections of GHG emissions that serve as a basis for comparison to the emission levels in the emissions-constrained cases.

7.2
Table 7.1. Cases Modeled
Technology Scenarios Cases 1) Reference Case – No Emissions Constraint 2) Baseline - Low Emissions Constraint 3) Baseline - Medium Emissions Constraint 4) Baseline - High Emissions Constraint
Reference Case Technology
5) Baseline – Very High Emissions Constraint 6) CLC - Low Emissions Constraint 7) CLC - Medium Emissions Constraint 8) CLC - High Emissions Constraint
Closing the Loop on Carbon (CLC)
9) CLC - Very High Emissions Constraint 10) NEB - ow Emissions Constraint 11) NEB - Medium Emissions Constraint 12) NEB - High Emissions Constraint
New Energy Backbone (NEB)
13) NEB - Very High Emissions Constraint 14) BSS - Low Emissions Constraint 15) BSS - Medium Emissions Constraint 16) BSS - High Emissions Constraint
Beyond the Standard Suite (BSS)
17) BSS - Very High Emissions Constraint
• Four “baseline cases” that include: 1) the same level of technological improvement as in the Reference Case, and 2) four different levels of hypothetical future CO2 emissions constraints (as described in Chapter 5). These baseline scenarios provide projections of the costs associated with meeting various CO2 emissions constraints, which serve as basis for comparison of the costs in the advanced technology cases.
• Twelve “advanced technology cases” that combine 1) the three sets of assumptions that serve as illustrative examples of the three “advanced technology” scenarios (CLC, NEB and BSS), with (2) the same four hypothetical emissions constraints as in the baseline cases.
The cases assume success in the development and commercial deployment of the advanced technolo-gies. They also assume that there is global participation in the effort to stabilize greenhouse gas emis-sions over the long-term. In the short-term, they assume that the United States achieves its planned 18% reduction in GHG intensity by 2012 and that countries participating in the alternative Kyoto approach achieve their reduction goals. However, the cases do not define specific policies or measures that may be necessary to achieve the carbon constraints, nor do they assume a specific pathway of R&D leads to the improved technology performance. Instead, they were developed to illustrate the kinds of technology combinations that could feasibly meet various levels of carbon constraint and the potential economic benefits that might result from accelerating technology development. Appendix A provides more detail on the technology assumptions in the CLC, NEB and BSS cases.
The non-CO2 gases were treated somewhat differently in the analysis, because advanced technologies for reducing these gases were not fully integrated into the modeling framework. As with CO2, a Reference Case was developed for the other greenhouse gases. This Reference Case incorporates fairly

7.3
aggressive deployment of current technology for some methane sources, particularly coal mines, and more limited emission reductions for most other sources. For the baseline cases, cost-effective increases in the non-CO2 emission reductions for the CLC, NEB, and BSS cases(a) were projected using the MiniCAM, based on the current GHG control technologies included in the model. Then, an advanced technology case for the non-CO2 gases was developed by EPA, as described in Appendix A. The estimates of the non-CO2 emissions reductions from advanced technology estimates were made outside the modeling framework for the level of emission reduction that could reasonably be assumed to result from the application of advanced technology. Analyses being conducted by the Stanford Energy Modeling Forum show that reductions of non-CO2 GHGs tend to be cost competitive with CO2 reductions in most instances. For the types of cases evaluated in this report, it was thus assumed that available non-CO2 reductions would be fully implemented and cost effective, although a comprehensive, optimized economic analysis was not conducted. In the Autumn of 2004, the Stanford Energy Modeling Forum will be releasing the results of EMF 21, a study of the non-CO2 gases, which will provide substantial additional data for and insights into the role of non-CO2 GHGs.(b)
(a) Cost-effectiveness, in this context, means reductions in other gases that were less costly than the price of carbon
reductions projected by the model in any given scenario. (b) A brief description of the study can be found at URL:
http://www.stanford.edu/group/EMF/research/doc/emf21des.html

7.4

8.1
8.0 Energy, Emissions and Economic Results of the Modeling Exercise
This chapter discusses the results of the modeling exercise, including trends in energy supply and end-use, reductions in CO2 emissions, reductions in other GHG emissions, and economic benefits for the advanced technology cases that were evaluated. The chapter concludes with some overarching observations and an integrated summary of the potential contributions of advanced technology to GHG emissions reduction.
8.1 Results – Energy Supply and End-Use
Under the varying hypothetical carbon emissions constraints (see Chapter 5), each set of illustrative cases(a) significantly reduces GHG emissions while meeting the energy demand requirements necessary to sustain moderate economic growth. However, each set meets the hypothetical constraints using its unique mix of technologies, as portrayed in example cases presented in Figure 8.1. The particular examples shown in the figure are for the hypothetical high emissions constraint case associated with each advanced technology scenario. These cases all result in a cumulative reduction of about 500 GtC over the span of the 21st Century (compared to the unconstrained levels of the Reference Case). Similar figures for the other carbon-constrained cases are shown in Appendix A. The terms used in the figures are explained in Box 8.1.
As Figure 8.1 shows, in the Closing the Loop on Carbon (CLC) cases, CO2 capture and storage and other advanced fossil-based energy technologies play large roles, primarily because these cases assume that development of CO2 capture and storage technology is successful, has been technically proven, is available for widespread application, and is relatively cost-effective compared to other options. In CLC, the non-fossil technologies are projected to continue to compete in the energy market and exhibit strong and continued growth, but in this case the technical advances in the fossil-based systems are assumed to be particularly successful, resulting in their extra market share. (See Appendix A for more discussion of assumptions).
In the New Energy Backbone cases, nuclear and renewable energy play large roles, as they are assumed to exhibit a high level of technical progress and become relatively cost-effective compared to other technologies. In addition, constraints on and higher costs of CO2 capture and storage limit their effectiveness in reducing carbon emissions in this scenario, compared to Closing the Loop on Carbon. So, CO2 capture and storage are projected to continue playing a role, but not as large as that projected in Closing the Loop on Carbon.
(a) Each advanced technology scenario is represented by four illustrative emissions constraint cases.

8.2
-
200
400
600
800
1,000
1,200
1,400
1990 2005 2020 2035 2050 2065 2080 2095
EJ/
yr
Fossil w/o Capture & Storage Fossil w/ Capture & StorageNuclear RenewablesBiomass Energy Use Reduction
-
200
400
600
800
1,000
1,200
1,400
1990 2005 2020 2035 2050 2065 2080 2095
EJ/
yr
Fossil w/o Capture & Storage Fossil w/ Capture & StorageNuclear RenewablesBiomass Energy Use Reduction
-
200
400
600
800
1,000
1,200
1,400
1990 2005 2020 2035 2050 2065 2080 2095
EJ/
yr
Fossil w/o Capture & Storage Fossil w/ Capture & StorageNuclear RenewablesBiomass ExoticsEnergy Use Reduction
Figure 8.1. World Primary Energy Demand Under Illustrative Advanced Technology Cases, 1990-2100 (High Emissions Constraint)
1. Closing the Loop on Carbon
2. A New Energy Backbone
3. Beyond the Standard Suite

8.3
In Beyond the Standard Suite, more of the very advanced forms of energy supply and distribution become important, because it is assumed that they make technological progress to the point that they can compete for market share, particularly in the latter part of the 21st Century.
Total energy demand is lower in each of the of the advanced technology cases than in the Reference Case (see Figure 4.1). This results primarily from the accelerated adoption of high effi-ciency end-use technologies, as well as price-induced energy efficiency. Unlike the Reference Case, fossil fuel combustion without CO2 capture and storage (at the bottom of the charts in Figure 8.1) peaks toward the middle of the century and then declines, as markets move toward more carbon-neutral technologies (i.e., fossil technologies with CO2 capture and storage) and carbon-free technologies (i.e., nuclear, biomass, and renewable energy).
Total cumulative energy consumption for each energy source in the sets of alternative technology cases is shown in Figure 8.2. In this chart, the solid-filled bars indicate the amount of energy supplied under the high emissions constraint.(a) The “whisker” marks indicate variation in energy supplied across the full range of other emissions constraints (i.e., Very High to Low). Energy use reduction plays an important role in all scenarios. This is also shown in Figure 8.3, which
(a) In the case of energy end use reduction, the quantity shown is for energy saved, not energy supplied.
Box 8.1 Explanation of Energy Terms in the Text, Tables and Charts
Advanced Biotechnology includes novel biological approaches to the production of hydrogen and other clean fuels, energy carriers and storage media; the production of electricity from bio-sources, the production of bio-based alternatives to industrial processes and feedstocks, and bio-processes for carbon-dioxide capture and permanent sequestration. It also includes biotechnologies that combine genetic engineering and nanoscience in novel energy production processes.
Biomass is non-fossil material of biological origin constituting a renewable energy source. It is used to produce electricity and liquid fuels.
Carbon-Free Energy is energy from solar, wind, biomass, nuclear, and advanced technologies.
Carbon-Neutral Energy is energy from sequestered fossil fuel combustion. (Solar, wind, and nuclear technologies are not actually carbon-free; some carbon is expended in production, transport, installation and maintenance of these sources.)
Energy-Use Reduction includes improvements in energy efficiency in end use applications and energy production and transformation. It also includes reduction in energy intensity related to energy conservation, usually due to price effects.
Exotics include fusion energy, space-solar satellites and other novel concepts not yet discovered.
Fuel Switching means the substitution in the economy of a lower carbon fuel such as natural gas for a higher carbon fuel such as coal. It does not necessarily mean existing plants switch from one fuel to another; rather it means there is a general shift in the economy toward a different fuel.
Nuclear refers to nuclear fission technology used to produce electricity.
Renewables includes solar energy, wind, biomass, hydroelectric and geothermal energy. Note that in the advanced technology scenarios, most of the incremental renewable energy is from solar and wind technologies. Note: most graphics in this chapter show biomass separately from the other renewables; hence in those graphics, “renewables” excludes biomass.
Fossil w/ Carbon Capture and Storage is coal, oil or natural gas combustion combined with or accompanied by CO2 capture and storage.
Fossil w/o Carbon Capture and Storage is coal, oil or natural gas combustion with free-venting CO2 emissions.

8.4
0
10
20
30
40
50
60
70
Fos
sil w
/0C
aptu
re &
Sto
rage
Fos
sil w
/ C
atpu
re &
Sto
rage
Bio
mas
s
Nuc
lear
Ren
ewab
les
Ene
rgy
Use
Red
uctio
n*
Exo
ticsTh
ou
san
ds
of C
um
ula
tive
Exa
jou
les
Closing the Loop on CarbonNew Energy BackboneBeyond the Standard Suite
Figure 8.2. World Cumulative Primary Energy Demand Under Advanced Technology Cases, 2000-2100 (Note: Solid bars represent the high emission constrained case and the ‘whiskers’ represent the range across all emissions constrained cases.) *Energy Use Reduction includes energy efficiency improvements in end use and energy production, and price-induced energy efficiency.
Figure 8.3. Varying Patterns of Energy Supply and Use in 2100 Under Three Advanced Technology Assumptions and Four Emissions Constraints (CLC = Closing the Loop on Carbon; NEB = New Energy Backbone; BSS= Beyond the Standard Suite)
-400
-200
0
200
400
600
800
1,000
1,200
1,400
CLC NEB BSS CLC NEB BSS CLC NEB BSS CLC NEB BSS
Exa
joule
s per
Yea
r (E
J/yr
)
Fossil w/o Capture & Storage Fossil w/ Capture & StorageBiomass NuclearRenewables Energy Use Reduction*Exotics
Very HighConstraint
HighConstraint
MediumConstraint
LowConstraint

8.5
presents energy patterns in the year 2100 in all of the emissions constrained cases. Energy use reduction is represented by the light purple sections of the bars below the horizontal axis. The results suggest that highly efficient energy end-use technologies, combined with increased efficiency in energy production and distribution, could play an important role in a low-carbon future. (Note that energy use reduction tends to be somewhat higher in the CLC cases, because they assume considerable efficiency increases in fossil-based energy supply technologies, as well as the energy end-use efficiency improvements assumed in the other scenarios.)
Despite the significant contributions projected for energy efficiency in the advanced technology cases, large contributions from energy supplies with low or near net-zero GHG emissions are also projected to occur. These include wind and solar (renewable energy), nuclear energy, and biomass, especially in the A New Energy Backbone cases, in which renewable and nuclear technologies are assumed to achieve significant technical and cost advances. Fossil fuels with CO2 capture and storage supply some energy in all cases, but have a much larger role in Closing the Loop on Carbon.
Additionally, technical breakthroughs could bring forth a series of non-traditional and more futuristic technologies. Advanced biotechnology, for example, may enable highly efficient molecular processes to convert sunlight into fuel, split water into hydrogen and oxygen, produce useable energy from biological processes in the absence of sunlight, or capture and store CO2. Fusion promises a clean, safe, and virtually inexhaustible supply of energy, should it overcome its formidable technical challenges. Large space solar energy applications may be possible, provided advances occur in enabling technologies. Such technologies, which are assumed to advance significantly in Beyond the Standard Suite, could make important contributions to the energy mix and complement other more traditional technologies.
Based on the particular cases examined, in all but the very high emissions constraint, the use of fossil fuels without CO2 capture and storage remains the primary form of energy supply over the course of the 21st Century, although all cases show substitution of near net-zero carbon and carbon-neutral energy technologies for conventional fossil technologies.
The differences in assumptions about technology supply, cost and performance in the cases used to illustrate the advanced technology scenarios strongly influence the level of penetration of the various technologies that displace fossil fuel combustion without CO2 capture and storage, across the varying assumptions about hypothetical carbon constraints.
8.2 Results – Reductions in CO2 Emissions
Figure 8.4 depicts the sources of cumulative GHG emissions reduction (compared to the Reference Case) under the various emissions-constrained cases. (Figure 8.4A shows reductions for the period between 2000 and 2050, and Figure 8.4B shows the 2000-2100 time period.) As discussed in Section 8.1, end-use energy reduction is projected to play a major role in all of the cases in both the first and second halves of the 21st Century. Under the assumptions used in this analysis, energy efficiency is one of the most robust contributors to GHG emission reductions. Other important contributors to CO2 emissions reduction across all cases, especially in the first half of the century, include fuel switching (which is defined as shifts from higher carbon fuels, such as coal, to lower-carbon fuels, such as natural gas) and
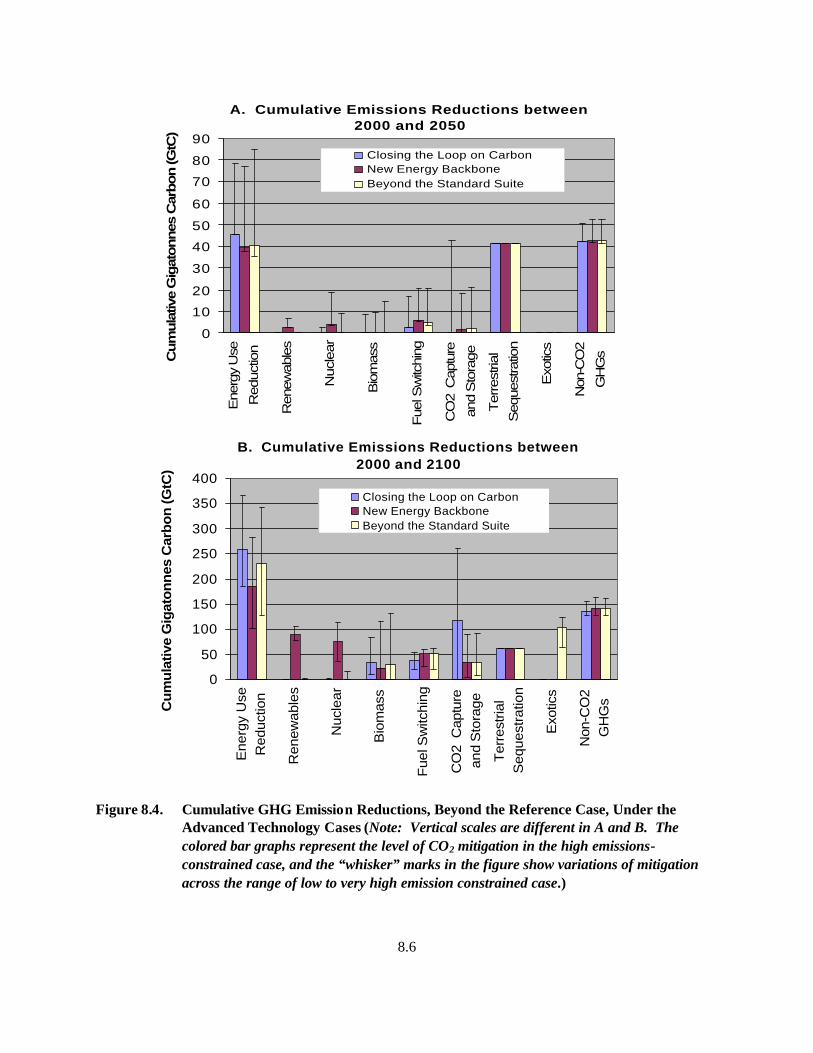
8.6
0
10
20
30
40
50
60
70
80
90
Ene
rgy
Use
Red
uctio
n
Ren
ewab
les
Nuc
lear
Bio
mas
s
Fue
l Sw
itchi
ng
CO
2 C
aptu
re
and
Sto
rage
Ter
rest
rial
Seq
uest
ratio
n
Exo
tics
Non
-CO
2
GH
GsCum
ula
tive
Gig
atonnes
Car
bon (G
tC)
Closing the Loop on CarbonNew Energy BackboneBeyond the Standard Suite
A. Cumulative Emissions Reductions between 2000 and 2050
B. Cumulative Emissions Reductions between
2000 and 2100
0
50
100
150
200
250
300
350
400
Ene
rgy
Use
Red
uctio
n
Ren
ewab
les
Nuc
lear
Bio
mas
s
Fue
l Sw
itchi
ng
CO
2 C
aptu
rean
d S
tora
ge
Ter
rest
rial
Seq
uest
ratio
n
Exo
tics
Non
-CO
2G
HG
sCu
mu
lativ
e G
igat
on
nes
Car
bo
n (G
tC)
Closing the Loop on CarbonNew Energy BackboneBeyond the Standard Suite
Figure 8.4. Cumulative GHG Emission Reductions, Beyond the Reference Case, Under the Advanced Technology Cases (Note: Vertical scales are different in A and B. The colored bar graphs represent the level of CO2 mitigation in the high emissions-constrained case, and the “whisker” marks in the figure show variations of mitigation across the range of low to very high emission constrained case.)
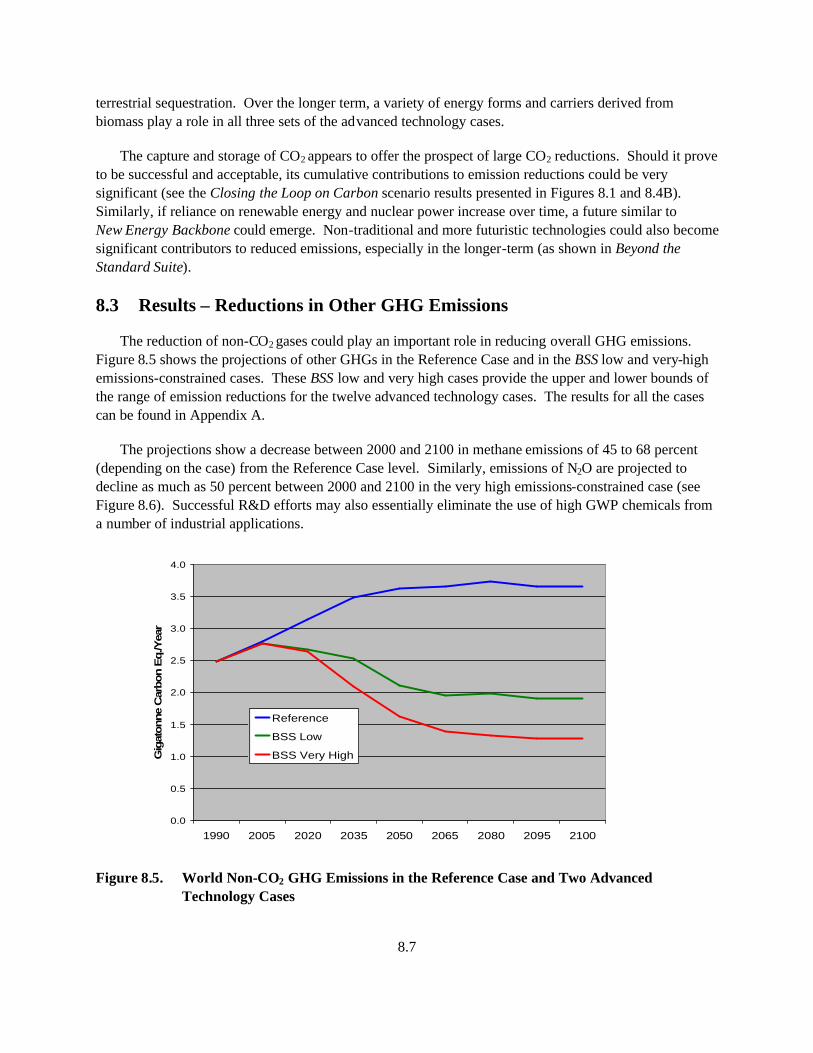
8.7
terrestrial sequestration. Over the longer term, a variety of energy forms and carriers derived from biomass play a role in all three sets of the advanced technology cases.
The capture and storage of CO2 appears to offer the prospect of large CO2 reductions. Should it prove to be successful and acceptable, its cumulative contributions to emission reductions could be very significant (see the Closing the Loop on Carbon scenario results presented in Figures 8.1 and 8.4B). Similarly, if reliance on renewable energy and nuclear power increase over time, a future similar to New Energy Backbone could emerge. Non-traditional and more futuristic technologies could also become significant contributors to reduced emissions, especially in the longer-term (as shown in Beyond the Standard Suite).
8.3 Results – Reductions in Other GHG Emissions
The reduction of non-CO2 gases could play an important role in reducing overall GHG emissions. Figure 8.5 shows the projections of other GHGs in the Reference Case and in the BSS low and very-high emissions-constrained cases. These BSS low and very high cases provide the upper and lower bounds of the range of emission reductions for the twelve advanced technology cases. The results for all the cases can be found in Appendix A.
The projections show a decrease between 2000 and 2100 in methane emissions of 45 to 68 percent (depending on the case) from the Reference Case level. Similarly, emissions of N2O are projected to decline as much as 50 percent between 2000 and 2100 in the very high emissions-constrained case (see Figure 8.6). Successful R&D efforts may also essentially eliminate the use of high GWP chemicals from a number of industrial applications.
0.0
0.5
1.0
1.5
2.0
2.5
3.0
3.5
4.0
1990 2005 2020 2035 2050 2065 2080 2095 2100
Gig
atonne
Car
bon E
q./Y
ear
Reference
BSS Low
BSS Very High
Figure 8.5. World Non-CO2 GHG Emissions in the Reference Case and Two Advanced Technology Cases

8.8
-
0.50
1.00
1.50
2.00
2.50
3.00
1990 2005 2020 2035 2050 2065 2080 2095 2100
Em
issi
ons
in G
tC-e
q./y
r
CF4C2F6SF6HFC143aHFC125(227ea)HFC134aHFC245faN2OCH4
Figure 8.6. World Non-CO2 GHG Emissions in the Very High Carbon-Constrained Case (A New Energy Backbone)
8.4 Results – Economic Benefits
The model employed for this analysis provides estimated costs for meeting the CO2 reductions in the hypothetical emissions-constrained cases over the course of the 21st Century. The estimated costs can be compared for cases with and without the use of advanced technology to suggest the extent to which advanced technology could reduce the costs, should the technologies advance as assumed. Conversely, scenario analysis can suggest the extent to which a particular technology R&D program would need to successfully reduce costs, compared to other technology programs, to realize the envisioned benefits.
To explore these opportunities and provide a common basis for comparative analysis, costs were esti-mated for a series of baseline cases that used (1) the Reference Case technology assumptions, and (2) various emissions-constraints described in Chapter 5. In these baseline cases, the total global cost in the year 2095 of meeting the hypothetical carbon-constraints ranged from $0.5 trillion to $5.8 trillion per year (in constant 2004 $), which would be equal to 0.2 to 2.0 percent, respectively, of the projected world economic output in that year. The cost estimates suggest that, as expected, higher emissions constraints correspond to higher costs.
Using a 2 percent discount rate, the present value (PV) of the total annual costs over the 100-year period ranged from $1.7 trillion to $52 trillion. Using a 5 percent discount rate, the PV range was $0.15 trillion to $8.3 trillion.
8.9
The costs for meeting the hypothetical emissions constraints in the advanced technology scenarios were significantly lower than those in the baselines.(a) The present values were projected to be 60 to 99 percent lower in the advanced technology cases than in the baselines (see Figure 8.7A through C) under the same range of hypothetical carbon constraints, across all the advanced technology scenarios. Additional detail is presented in Appendix A.
8.5 Results – Summary of Insights Relevant to CCTP Planning
The analysis described in this report consisted of two distinct components. First, PNNL identified three classes of technology futures, the “advanced technology scenarios,” in which technological advance allows for significant reductions in GHG emissions, beyond those in the Reference Case. These scenarios are differentiated by the roles that different technologies play in reducing emissions. The three scenarios were designed specifically as classes of futures so that, together, they cover the broad spectrum of the possible developments that could lead to reduced emissions while maintaining economic prosperity.
The second component of the scenario analysis was to develop and explore several specific illustrative advanced technology cases nested within each scenario using the MiniCAM integrated assessment model. While these cases represent only a small set of the possible manifestations of each scenario, they provide plausible examples of futures in which technological advance enables reduced emissions with minimal economic consequences.
The Reference Case developed during the course of this analysis, as well as scenarios reviewed from the literature, illustrate the potential scope of the climate change challenge. Even when significant technological progress is assumed to occur, energy demand and GHG emissions may triple by the end of the 21st Century. The advanced technology cases illustrate the strong contributions advanced technologies can make to lowering GHG emissions and the associated costs. In fact, the specific cases modeled suggest that accelerated technology development offers the potential to reduce the cost of stabilization by hundreds of billions to trillions of dollars globally.
The advanced technology cases were built on a foundation of common assumptions, advised by expert opinion, and shaped around three different, alternative views of possible advanced technology futures. The insights gained from the analysis are necessarily limited by the fact that they are fundamentally an outcome of the assumptions about technology advancement and other assumptions used in the model runs. Even considering that limitation, the modeled cases illuminate a range of alternative technology futures that lead to lower GHG emission levels and help identify the conditions under which certain technologies could be successful. Similar conclusions to those drawn from this analysis can be drawn from the range of previously conducted scenario analyses reviewed as part of this effort.
Driven by their varied assumptions, all of the hypothetical emission-constrained cases follow trends that gradually reduce emissions over time. As compared to the Reference Case, the cumulative
(a) Note: The cost reductions do not consider the cost associated with performing any R&D that might be
necessary to achieve the improved technology performance.

8.10
A. Very High Emissions Constraint
$0
$1,000
$2,000
$3,000
$4,000
$5,000
$6,000
$7,000
2005 2020 2035 2050 2065 2080 2095
Year
Miti
gat
ion
Co
st ($
bill
ion
) Baseline
Closing the Loop on Carbon
A New Energy Backbone
Beyond the Standard Suite
B. High Emissions Constraint
$0
$500
$1,000
$1,500
$2,000
$2,500
$3,000
2005 2020 2035 2050 2065 2080 2095
Year
Miti
gat
ion C
ost
($bill
ion)
Baseline
Closing the Loop on Carbon
A New Energy Backbone
Beyond the Standard Suite
C. Medium Emissions Constraint
$0
$200
$400
$600
$800
$1,000
$1,200
2005 2020 2035 2050 2065 2080 2095
Year
Miti
gat
ion C
ost
($bill
ion) Baseline
Closing the Loop on Carbon
A New Energy Backbone
Beyond the Standard Suite
Figure 8.7. Annual Costs of Meeting Emissions Constraints (Real 2004 $ billion)

8.11
reduction of GHG emissions over the course of the 21st Century ranged from about 200 to 800 GtC-equivalent, depending on the level of the hypothetical carbon constraint. Each set of illustrative advanced technology cases resulted in the deployment of a different mix of energy technologies for achieving the emission reductions. The respective emission reduction contributions of the various technology options, under the range of cases, are summarized in Figure 8.8. In this figure, the contributions to the total emissions reductions have been grouped by technology category. The categories mirror the relevant mitigation-related CCTP strategic goals:
• Goal 1: Reduce Emissions from Energy End-Use and Infrastructure • Goal 2: Reduce Emissions from Energy Supply • Goal 3: Capture and Sequester Carbon Dioxide (CO2) • Goal 4: Reduce Emissions of Other Greenhouse Gases
Figure 8.8. Cumulative Contributions Between 2000 and 2100 to the Reduction, Avoidance, Capture and Sequestration of Greenhouse Gas Emissions for the Three Advanced Technology Scenarios, Under Varying Emissions Constrained Cases (Note: The thick bars show the contribution under the high emission constraint and the thinner, semi-transparent bars show the variation in the contribution between the very high emissions constraint and the low emissions constraint.)

8.12
Figure 8.8 reflects the potential reductions beyond the Reference Case. The Reference Case already assumes significant improvements in end-use energy intensity and supply-side energy technology efficiency, including significant market penetration of carbon-free renewable and nuclear energy. This should be factored into the interpretation of the contributions shown in the figure.
Within the figure, “Energy End-Use” includes reductions in total primary energy use through efficiency improvements in both end-use technology (e.g., energy-consuming technology in buildings, industry, and other sectors) and energy supply (e.g., improvements in the efficiency of fossil-fueled power plants), as well as through price-induced energy conservation (i.e., as energy prices rise, energy users consume less energy). “Energy Supply” in the figure includes increases in the market penetration of carbon-free or near net-zero-emissions energy supply technologies, such as nuclear, wind, solar, and biomass, that lead to reductions in CO2 emissions compared to those in the Reference Case. The “Sequestration” category includes terrestrial sequestration in forests and soils, as well as CO2 capture and storage, e.g., in geologic formations. Finally, the “Other GHGs” category includes reductions of non-CO2 greenhouse gases (discussed in Section 8.3). Emissions reductions from fuel switching are not included in the figure.
One insight apparent from Figure 8.8 is that, under a wide range of differing assumptions, all four of the CCTP emissions reduction-related strategic goals could potentially contribute to progress at meaningful levels. In other words, substantial roles are plausible for a variety of technologies across a wide range of futures. Future technological advances can not be predicted today, so any number of technologies may take on substantial future roles, depending on their how well they progress. Furthermore, even if a single technology were to make dramatic leaps forward, the magnitude and complexity of the climate change challenge likely would allow for substantial contributions from a variety of technologies. For example, a future that includes significant penetration of CO2 capture and storage does not necessarily imply a minimal role for nuclear and renewable energy, and a future that transitions to a new energy backbone of nuclear and/or renewable energy does not necessarily mean an end to the use of fossil fuels over the remainder of the century. Regardless of the primary energy mix, there are important opportunities to reduce energy consumption, directly sequester carbon from the atmosphere, and manage the emissions of the non-CO2 greenhouse gases. The cases examined in this study help visualize circumstances that would encourage the use of each of the advanced technologies – energy efficiency improvements; advanced energy supply technologies; CO2 capture, storage and sequestration; and reduction of non-CO2 GHGs.
With regard to the CCTP strategic goal aimed at reducing emissions from energy end-use and related infrastructure (Goal 1), the cases suggest that increased use of highly energy-efficient technologies and other means of reducing energy use could play a major role in contributing to cost-effective emissions reductions. In the cases evaluated, the successful contribution of energy use reduction was based on the assumption that energy efficiency would advance at rates that would not only need to keep pace with historical rates of improvement (about one percent per year), as embodied in the Reference Case and baselines, but achieve accelerated progress.
Regarding energy supply (Goal 2), despite the relatively large contributions projected from energy efficiency and the continuing role played by conventional fossil fuels without CO2 capture and storage,

8.13
the cases suggest that a significant supply of energy from sources with zero or near net-zero GHG emissions, such as nuclear, renewable and biomass energy technologies, could be required under a range of hypothetical carbon-constrained futures.
The cases also show that CO2 capture and storage technology and carbon sequestration (Goal 3) could play a major role under at least one set of future circumstances, represented by Closing the Loop on Carbon, and to a lesser extent under other circumstances, shown in cases within the New Energy Backbone and Beyond the Standard Suite. In the cases described in this report, terrestrial sequestration was assumed to play a significant role in all future technology scenarios, based on the premise that it is technically feasible and not very costly. Terrestrial sequestration could make important contributions in the first half of the century, “buying time” for zero-carbon energy supply technologies to advance or be developed.
For non-CO2 greenhouse gases (Goal 4), the cases assume that reductions in emissions of the other greenhouse gases could potentially contribute 120 to 160 Gt of carbon-equivalent emission reduction, cumulated over the century. The cases envision development of advanced technologies in areas such as methane emissions from the waste disposal and energy sectors, methane and nitrous oxide emissions from agriculture, and high GWP emissions from the industrial sector.
Another insight gained from the case analysis is that significant progress toward lower emissions could be made, while also allowing for the significant economic potential of conventional oil and gas reserves to be realized. Most cases we analyzed suggest that stabilization of GHGs at the levels explored in this study does not imply a near- or mid-term phase-out of oil and natural gas, even if sequestration proves economically or technically unattractive.
The cases further suggest that successful development of advanced technologies may result in potentially large economic benefits. Independent of the particular combination of technologies examined, all of the advanced technology cases resulted in significantly lower overall costs in meeting the various hypothetical carbon constraints. These savings could be measured in hundreds of billions to trillions of dollars, globally.
The analysis also suggests that the timing of the commercial readiness of advanced technology options is an important planning consideration. Previously published scenarios indicate that, particularly for stabilization levels consistent with the very high, high, and medium emissions cases, economically-efficient stabilization of GHGs will require a near-term slowing of the growth in GHG emissions intensity, followed by a peak prior to, and in some cases well before, the year 2065. Allowing for capital stock turnover and other inertia inherent in the energy system, technologies with zero or near net-zero GHG emissions would need to be available and moving rapidly into the marketplace well before the “peaks” occur in the hypothetical carbon-constrained cases. Given that appropriate lead-in periods will be needed for technology to establish itself in the market, in some carbon-constraint cases, technologies would need to be commercially ready for widespread implementation as early as 2020, and possibly no later than 2040. Such considerations suggest that the technologies would need to be proven technically viable before this time, and that initial demonstrations would be needed between 2010 and 2030.

8.14
This analysis demonstrated that there are at least three combinations of advanced technologies that could lead to significant reductions in GHG emissions at much lower costs than would be incurred using the current generation of technologies. Further scenario analysis may be warranted to examine additional technology combinations and to evaluate in more depth the performance and cost assumptions used in these cases.

9.1
9.0 References
CCSP (See U.S. Climate Change Science Program)
Carbon Dioxide Information Analysis Center (CDIAC). 2004. Carbon Flux to the Atmosphere from Land-Use Changes. [Online]. Available URL: http://cdiac.esd.ornl.gov/trends/landuse/houghton/houghton.html
Energy Information Administration (EIA). 2003a. International Energy Annual, 2001 Edition. US Department of Energy, Washington, DC. [Online]. Available at URL: http://www.eia.doe.gov/iea/
Energy Information Administration (EIA). 2003b. International Energy Outlook 2003, DOE/EIA-0484 (2003). US Department of Energy, Washington, DC. [Online]. Available at URL: http://www.eia.doe.gov/oiaf/archive/ieo03/index.html
Energy Information Administration (EIA) 2004a. International Energy Annual, 2002 Edition. U.S. Department of Energy, Washington, DC. [Online]. Available at URL: http://www.eia.doe.gov/iea/
Energy Information Administration (EIA). 2004b. International Energy Outlook 2004, DOE/EIA-0484 (2004), U.S. Department of Energy, Washington, DC. [Online]. Available at URL: http://www.eia.doe.gov/oiaf/ieo/index.html
EPA (See US Environmental Protection Agency)
Humphreys K, M Mahasenan, M Placet and K Fowler. 2002. Toward a Sustainable Cement Industry, Substudy 8: Climate Change, World Business Council for Sustainable Development, Conches, Switzerland.
Intergovernmental Panel on Climate Change (IPCC). 2000. Special Report on Emissions Scenarios. Cambridge University Press, Cambridge.
Intergovernmental Panel on Climate Change (IPCC). 2001a. Climate Change 2001. Mitigation: A Report of Working Group III of the Intergovernmental Panel on Climate Change. Cambridge University Press, Cambridge.
Intergovernmental Panel on Climate Change (IPCC). 2001b. Climate Change 2001: The Scientific Basis. Cambridge University Press, Cambridge, UK.
Intergovernmental Panel on Climate Change (IPCC). 2001c. Summary for Policymakers to Climate Change 2001: Synthesis Report of the IPCC Third Assessment Report. Cambridge University Press, Cambridge, UK.
International Energy Agency (IEA) 2001. World Energy Outlook. Paris.

9.2
International Energy Agency (IEA). 2002. Longer Term Energy and Environment Scenarios. Standing Group on Long-Term Co-Operation (IEA/SLT), Paris.
National Academy of Science (NAS). 1999. Our Common Journey: A Transition toward Sustainability. National Academy Press, Washington, DC.
Natural Resources Canada. 2000. Canada 2050, Four Long Term Scenarios for Canada’s Energy Future. Ottawa.
Shell International Ltd-Global Business Environment Unit (Shell). 2001. Energy Needs, Choices and Possibilities – Scenarios to 2050. London.
The White House. June 11, 2001. Climate Change Policy Review – Initial Report . [Online]. Available URL: www.whitehouse.gov/news/releases/2001/06/climatechange.pdf
United Kingdom Department of Trade and Industry. 2000. Fueling the Future – A Report by the Energy Futures Task Force. Foresight Programme, Office of Science and Technology. London.
United Kingdom Department of Trade and Industry. 2001. Energy for Tomorrow: Powering the 21st Century. Foresight Programme, Office of Science and Technology. London.
United Nations (UN). 1992. United Nations Framework Convention on Climate Change. New York.
United Nations Development Program (UNDP). 2000. World Energy Assessment. New York.
US Climate Change Science Program (CCSP). 2003. Strategic Plan for the Climate Change Science Program. [Online]. Available URL: http://www.climatescience.gov/Library/stratplan2003/final/default.htm
US Environmental Protection Agency (EPA). 2004a. Global Emissions of Non-CO2 Greenhouse Gases: 1990-2020. [Draft] [Online]. Available URL: http://www.epa.gov/ghginfo
US Environmental Protection Agency (EPA). 2004b. Inventory of U.S. Greenhouse Gas Emissions and Sinks: 1990-2002. Washington D.C. [Online]. Available at URL: http://yosemite.epa.gov/oar/globalwarming.nsf/content/ResourceCenterPublicationsGHGEmissionsUSEmissionsInventory2004.html
Wigley T, R Richels, and J Edmonds. 1996. “Economic and Environmental Choices in the Stabilization of Atmospheric CO2 Concentrations.” Nature, Volume 379, Number 6562, pp. 240-243.
World Business Council for Sustainable Development. 1999. Energy 2050 – Risky Business. Conches, Switzerland.

Appendix A
Details on Methodology and Results


A.1
Appendix A Details on Methodology and Results
This appendix provides additional detail on the methodology, underlying assumptions, and computer model that were used to generate the cases presented in the main body of the report, and presents more detail on the results of the computer model runs. The appendix is organized as follows: Section A.1 explains the general approach to developing the illustrative advanced technology cases; Section A.2 provides energy and GHG emissions results for the Reference Case—the common point of comparison for the illustrative advanced technology cases; Section A.3 provides energy and emissions results for the illustrative advanced technology cases under the assumption of emissions constraints; Section A.4 presents cost results for these same emissions-constrained, illustrative advanced technology cases.
A.1 Overview of the Modeling Approach
As discussed in the main body of the report, PNNL was charged with: (1) defining three broad advanced technology scenarios and (2) creating and exploring a set of illustrative cases that fall within each of these broad scenarios. The three scenarios are entitled (1) Closing the Loop on Carbon (CLC), (2) A New Energy Backbone (NEB), and (3) Beyond the Standard Suite (BSS). (These scenarios are discussed in more detail in Chapter 6 in the main report.)
The advanced technology cases were created using a PNNL-developed model called the Mini Climate Assessment Model (MiniCAM). The MiniCAM model is an “integrated assessment” model. Integrated assessment models are tools for exploring the complex interrelationships among economic activity, the energy and industrial system, managed and unmanaged ecosystems, the associated greenhouse gas emissions, and the resulting impacts on climate. Consistent with the nature of the GHG management challenge, integrated assessment models generate results over a century-long time scale. MiniCAM was one of the six models included in the Intergovernmental Panel on Climate Change (IPCC) Special Report on Emissions Scenarios (SRES). Box A.1 provides a brief description of the model.
In the exercise described here, the MiniCAM was supplied with (1) a set of Reference Case assumptions, and (2) three sets of advanced technology assumptions that were designed to be representative of the three broad scenarios. Based on these assumption sets, MiniCAM was used to make projections of advanced technology market penetration, the associated worldwide GHG emissions, and the cost of reducing world GHG emissions to various levels. The assumptions behind the cases were developed in close coordination with CCTP. Many other illustrative advanced technology cases could have been developed that would have been consistent with the three scenarios. The illustrative advanced technology assumptions are not explicitly tied to outcomes of specific federal R&D efforts, and they are not an attempt to project what is “most likely” to happen. Instead, all of the illustrative advanced

A.2
Box A.1 The MiniCAM
MiniCAM models the energy and industrial system, including land use, in an economically consistent global framework. It has sufficient technical detail to enable analysis of a wide variety of technology systems and impacts over medium to long timescales (up to 100 years in the future). MiniCAM is referred to as a partial equilibrium model in that it explicitly models specific markets and solves for equilibrium prices only in its areas of focus: energy, agriculture and other land uses, and emissions. It does not cover the entire economy (e.g., it leaves out some aspects of the service sector and labor markets). This targeted focus allows MiniCAM to be a more technologically detailed model of global and regional markets in fuels, energy carriers, and agricultural products than what has been practical with a general equilibrium approach. MiniCAM operates through a projected time horizon of 100 years by solving, for each modeled time step (currently 15 years), for a set of energy, agriculture, and greenhouse gas emissions markets. The supply and demand behaviors for all of these markets are modeled as a function market prices, technology characteristics, and demand sector preferences. Market prices, including feedbacks between energy markets, are adjusted until supply and demand for each market good are equal. At this equilibrium set of prices, production levels, demand, and market penetration are mutually consistent. For example, gas production will increase with a rise in gas price, which drives a decrease in gas demand. In equilibrium, these market clearing prices (e.g., the prices of gas, coal, electricity, emissions, etc.) are by definition internally consistent with all other prices. And in parallel, all supply and demand behavior is consistent with assumptions about the key model parameters and drivers, including the following: (1) technology characteristics (from production to end-use), (2) fossil fuel resource bases (cost-graded resources of coal, oil, and natural gas); (3) renewable and land resources (hydroelectric potential, cropland, etc.); (4) population and economic growth (drivers of demand growth); (5) policies (about energy, emissions, etc.). In every individual market, technology or fuel shares are allocated according to a logit function. The logit function captures the idea that every market actually characterizes a range of different suppliers and purchasers, and each supplier and purchaser is different and may have different needs and may experience different local prices. These differences may call for an individual bias toward one particular fuel or technology over the others. The logit allocates shares based on prices, but ensures that even higher priced goods will gain some share of the market. Hence, the logit approach is intended to capture the observed heterogeneity of real markets. The MiniCAM is based on three end-use sectors (buildings, industry, transportation) and a range of energy supply sectors, including fossil-fuels, biomass (traditional biomass such as use of wood for heat, and modern biomass that can be used as a fuel for electricity production or as a feedstock for bio-fuels or hydrogen production), electricity, hydrogen, and synthetic fuels. For electricity generation, the model’s technological detail covers generation from coal, oil, natural gas, biomass, hydroelectric power, fuel cells, nuclear, wind, solar photovoltaics, electricity storage (e.g., coupled with production of electricity using solar and wind generation), and exotic technologies such as space solar and fusion. Hydrogen can be produced from coal, oil, natural gas, biomass, and electrolysis (using electricity). Synthetic fuels may come from coal, oil, natural gas, and biomass. MiniCAM also includes engineered carbon capture and storage (sequestration) from fossil fuels, and commercial biomass supply generated regionally by an agricultural-land use model. The MiniCAM includes regional detail for 14 regions, which include the United States, Canada, Western Europe, Japan, Australia & New Zealand, Former Soviet Union, Eastern Europe, Latin America, Africa, Middle East, China and the Asian Reforming Economies, India, South Korea, Rest of South & East Asia.

A.3
technology cases assume that a specific set of technological advances takes place over the course of the century that sustains a prosperous future while simultaneously reducing GHG emissions at a cost lower than today’s options. For comparison purposes, the set of cases conducted for CCTP also includes reference and baseline cases, as described below.
A total of seventeen individual cases were modeled using MiniCAM. These cases include:
• A “Reference Case” that assumes: (1) a rate of future technological improvement that is generally consistent with historical trends, and (2) an absence of GHG emissions constraints. This case provides projections of GHG emissions that serve as a basis for comparison to the emission levels in the emission-constrained cases.
• Four “baseline cases” that include: (1) the same technology assumptions that were used in the Reference Case, and (2) four different levels of future hypothetical CO2 emissions constraints. These baseline cases provide projections of the costs associated with meeting various CO2 emissions constraints that serve as basis for comparison of the costs in the advanced technology cases.
• Twelve illustrative advanced technology cases, which combine (1) the three different technology assumption sets (one representing each scenario: Closing the Loop on Carbon, A New Energy Backbone, and Beyond the Standard Suite) with (2) the same four hypothetical CO2 emission constraints as in the baseline cases.
The remainder of this section provides more detail on the assumptions behind these seventeen cases.
The initial economic assumptions, such as the rate of growth and composition of GDP, regional population growth, and the future disparity in wealth between rich and poor countries, were kept constant for all seventeen cases.(a) These basic economic assumptions are consistent with the B2 “storyline” from the IPCC’s SRES and include the following: (1) world population grows to approximately 9.5 billion in 2100; (2) the world economy grows to over $200 trillion in 2100; and (3) primary energy demand grows to roughly 1200 EJ by 2100 (from about 400 EJ in the year 2000).(b) Note: of the scenarios examined in the IPCCs SRES process, the majority projected growth in primary global energy demand from today’s levels of ~400 exajoules (EJ) to between 650 and 1800 EJ in 2100.
To formulate the seventeen cases, these basic economic assumptions are combined with sets of assumptions about technological change and with hypothetical CO2 emissions constraints. In the Reference Case, there are no emissions constraints. However, technology does improve in comparison to today’s technology. For instance, energy efficiency is assumed to increase over time in all end-use
(a) Note that the initial assumptions input to the model are the same, but as the model makes its projections, there
are some feedbacks between the costs of meeting various emission reductions and the overall economic performance of the economy, so the final projections of global economic output and other factors vary somewhat between the scenarios.
(b) The calibration to B2 is actually based on final energy demand (roughly 900 EJ in 2100) rather than primary energy demand. Final energy demand is lower than primary energy demand because of losses in converting primary energy to final energy.
A.4
sectors (hence energy intensity, measured as energy consumed per unit of economic activity, is assumed to decline). In addition, advancements are assumed to occur in fossil fuel technology (e.g., synfuels are available toward the end of the century), as well as renewable energy and nuclear energy technology (see Table A.1, which provides more detail about the assumptions). These assumptions were developed with an eye toward ensuring that the energy and emissions characteristics in the absence of emissions constraints fell toward the middle of the range of previously developed scenarios, for example, those developed in the SRES process.
In the four baseline cases, the model was used simulate four alternative CO2-emissions-constraints, which are shown in Figure A.1.(a)(b) The timing and level of emissions reductions in the scenario analysis was a direct result of the use of these particular hypothetical emissions-constrained cases, and is not a result or conclusion of the analysis. For the baseline cases, the model projected different mixes of technologies to minimize overall costs for each emissions-constrained case, using the Reference Case assumptions about technology improvement.
The economic value of carbon is applied as a price signal in the model and is varied upwards or downwards until the emissions in any given period are consistent with the constrained level of CO2 emissions in that period.(c) Using this method, MiniCAM meets the emissions-constrained cases at a minimum economic cost, because the marginal costs of emissions reductions are equalized among different options and across regions of the world. This is consistent with economically-efficient, global participation in achieving emissions reductions. However, the projected costs of achieving the emissions constraints are dependent on the assumptions about the cost of various technologies. This part of the
(a) These emissions trajectories are consistent with various trajectories developed by Wigley, Richels, and
Edmonds (WRE ) -- see Wigley et al. 1996. The WRE trajectories are a set of emissions trajectories created in the mid-1990’s that were projected to lead toward stabilization of CO2 emissions over the next several hundred years at minimum economic cost. While the WRE trajectories were developed several years ago and are only one of many possible trajectories consistent with stabilization of CO2 emissions at minimum cost, they continue to serve as a commonly accepted “standard” set and a common point of reference for analysis of GHG emission reductions aimed at stabilizing global concentrations. They are used here for illustrative purposes, not as examples of desired emission reduction levels. The level and timing of emission reductions needed to meet UNFCCC ultimate objective remains uncertain.
(b) As shown in Figure A.1, the Reference Case emissions trajectory is lower than the WRE trajectories early in the century. This is primarily a result of the significant contraction of the economy in the Former Soviet Union and other changes, which have put the world on a recent emissions trajectory below what was expected when the WRE trajectories were developed.
(c) The emissions cannot exceed those in the imposed emission constraints, but they sometimes fall slightly below in the early part of the century, because the technology advancement assumptions lead to reductions in GHG emissions even without emissions constraints. Because of the accelerated technology development in the three advanced technology scenarios, emissions may naturally fall below the emissions constraints in the early part of the century when these constraints are not very demanding. In some sense, early emissions reductions resulting from advancements in technology can come for free. However, the extent to which these emission reductions occur varies among the advanced technology scenarios. For this reason, the cumulative emissions over the century for the three scenarios do not always perfectly match each other.

A.5
Table A.1. Assumptions in the Reference Case and Baseline Cases, as well as Advanced Technology Cases
Scenario Fossil Efficiency Sequestration and CO2
capture/Storage Exotics(a) Renewables and
Nuclear Other Greenhouse
Gases Reference Case and Baseline Cases
Limitations on unconven-tional oil limit long-term penetration. The natural gas resource base is large, but large-scale unconventional sources (i.e., methane hydrates) are limited. Synfuels from coal are available in large quantities late in the century.
The world experiences an approximately one percent annual decrease in global energy intensity (energy/GDP) over the century.
Engineered sequestration is not economically or technically feasible. Terrestrial sequestration is also precluded.
No exotic forms of energy are competitive over the full century.
Substantial cost decreases in renewables and nuclear bring their costs below today’s levels. The aver-age price for wind power drops to 4 cents/kWh, and the average price of solar PV drops to 6 cents/kWh by the end of the century. The average price for nuclear power is 5.9 cents/ kWh by century’s end.
In the Reference Case, non-CO2 GHG emis-sions rise with increased activity in the industries that emit them, but emission reductions per unit of activity occur. In the baseline cases, emission of other GHGs decline in response to the carbon constraint (i.e., due to changes in energy prices and underlying emission drivers), but only technologies available today are deployed.
Closing the Loop on Carbon
The efficiency of fossil electricity generating technologies increases by approximately 10% beyond the assumed gains in the Reference Case over the century.
Energy intensity improvement increases annually starting in 2020 so that it is 10% lower than the Reference Case by the end of the century.
Average carbon storage costs drop from $37/tonne in 2020 to $10/tonne in 2035 and remain constant thereafter. A total of 60 GtC of terrestrial sequestration is deployed over the century (no cost is assumed).
Same as Reference Case
Same as Reference Case Advanced technologies are deployed to reduce emissions of non-CO2 gases from many sources and sectors – see Table A.2. As above, there also are indirect emission reductions due to the carbon constraint.

A.6
Table A.1. (contd)
Case Fossil Efficiency Sequestration and CO2
capture/Storage Exotics(a) Renewables and
Nuclear Other Greenhouse
Gases A New Energy Backbone
Same as Reference Case Same as Closing the Loop on Carbon
Technical and other limitations on CO2 capture and storage limit the allowable resource base. The effective average cost of storage is $37/tonne in 2035 and rises by almost a factor of four by the end of the century. A total of 60 gtc of terrestrial sequestration is deployed over the century (no cost is assumed).
Same as Reference Case
Increased rates of improvement in solar, wind, and nuclear technology. The average cost of wind power drops to 3 cents/kwh, and the average cost of energy from solar pvs drops to 3 cents/kwh by 2100. The average cost of nuclear power drops to 4.5 cents/kwh in 2100.
Same percentage reductions as in Closing the Loop on Carbon (shown in Table A.2) but the reduction percentages were applied to the non-CO2 GHG emission levels projected in the NEB baseline.
Beyond the Standard Suite
Same as Reference Case Same as Closing the Loop on Carbon
Same as New Energy Backbone
Competitive “representative exotic” comes on after mid-century, and reaches an average cost of approximately $4 cents/kWh by 2100.
Same as Reference Case Same percentage reductions as in Closing the Loop on Carbon (shown in Table A.2) but the reduction percentages were applied to the non-CO2 GHG emission levels projected in the BSS baseline.
(a) Exotics include fusion , space-based solar power, and other novel concepts.

A.7
0
5
10
15
20
25
1990 2005 2020 2035 2050 2065 2080 2095
Car
bo
n E
mis
sio
ns
(GtC
/yr)
Low Emissions Constraint
Medium Emissions Constraint
High Emissions Constraint
Very High Emissions Constraint
Reference Case
Figure A.1. CO2 Emissions for the Four CO2-Emissions-Constrained Cases
analysis focused specifically on CO2 emissions, although there are associated emission reductions of non-CO2 GHGs as a result of the carbon constraint.(a)
In each of the illustrative advanced technology cases, the Reference Case technology assumptions are altered by assuming accelerated advances in technology performance and cost, above and beyond those assumed in the Reference Case and the baseline cases. Some of these assumptions are common to all of the advanced technology cases, whereas others vary among the cases. Using these assumptions about improved technology, the model then projects GHG emissions and the costs of achieving the same hypothetical CO2 emission constraints as in the baseline cases (shown in Figure A.1).
Several common assumptions were made in all three of these illustrative advanced technology cases. All of the illustrative advanced technology cases assume additional advancements in end-use energy efficiency, beyond the levels assumed in the Reference Case and baseline cases. In addition, all assume
(a) In addition to achieving the hypothetical CO2 emissions constraints, the baseline scenarios also show reductions
of non-CO2 GHGs, compared to the Reference Case, resulting from (1) changes in energy patterns and economic activity in the baselines compared to the Reference Case (i.e., the carbon constraints have some impacts on energy patterns and the economy, which may have ripple-down effects on the sources that produce other GHGs), (2) changes in energy prices (e.g., in some baseline scenarios, the model projects higher natural gas prices than in the Reference Case, hence more methane emissions are captured because it is economical to do so and sell the methane in the energy market), and (3) the assumption that, as the economic value of carbon increases (due to the carbon dioxide constraints), reductions will be made in non-CO2 GHG emissions if those reductions cost less than the equivalent value of carbon.

A.8
terrestrial sequestration is available and can remove 60 GtC of CO2 emissions over the course of the 21st Century. Further, all assume a set of reductions in non-CO2 GHGs that reflect the technical potential to reduce emissions across many sectors and sources.(a) The levels of reduction assumed for various GHG-emitting activities are shown in Table A.2. These technologies (energy efficient end-use technologies, terrestrial sequestration, and technologies to reduce non-CO2 GHGs gases) are core to all cases.
Table A.2. Advanced Technology Assumptions for Other GHGs
Sector/Source Advanced Technology Assumptions Methane (CH4)
Coal Mining No change from Reference Case, because the Reference Case and baseline cases deployed substantial advanced technology.
Natural Gas & Oil Systems 2005: Begin reductions 2050: Emissions reduced by 50% 2095: Same as 2050
Landfills & Wastewater Systems 2005: Begin reductions 2050: Emissions reduced by 50% 2095: Emissions reduced by 90%
Enteric Fermentation 2050: Emissions reduced by 40% 2095: Emissions reduced by 50%
Livestock Manure Management 2035: Emissions reduced by 50 2095: Emissions reduced by 90%
Rice Cultivation 2020: Emissions reduced by 30% 2065: Emissions reduced by 50%
Nitrous Oxide (N2O) Stationary and Mobile Combustion 2005: Begin reductions
2050: Emissions reduced by 50% Wastewater Treatment 2005: Begin reductions
2050: Emissions reduced by 50% 2095: Emissions reduced by 90%
Industrial N2O Emissions 2005: Begin reductions 2035: Emissions reduced by 90%
Agricultural Soils 2035: Emissions reduced by 15% 2065: Emissions reduced by 35%
Manure Management 2035: Emissions reduced by 50% 2095: Emissions reduced by 90%
Fluorinated or High GWP Gases Substitutes for Ozone Deleting Substances
2050: Emissions reduced by 50%
SF6 and PFCs 2005: Begin reductions 2020: Emissions reduced by 40% 2050: Emissions eliminated
(Source: Personal communication from Dina Kruger, U.S. EPA., Washington, DC.)
(a) The levels of non-CO2 GHG emissions reduction were based on the technical potential of various technologies
being studied by the U.S. EPA. EPA worked with PNNL to develop the reduction percentages shown in Table A.2.

A.9
In addition to these common assumptions, each of the three sets of illustrative advanced technology cases assumes significant advancement occurs in a particular set of energy supply technologies. The differences among these energy technology assumptions distinguish the sets of cases from each other. In the CLC set of cases, engineered CO2 capture and storage is assumed to become available at reasonable costs. (Engineered capture and storage is also assumed to be available in the NEB and BSS cases, but the cost is considerably higher than in the CLC cases). In the NEB cases, nuclear and renewable technologies are assumed to improve significantly, beyond the levels in the Reference Case and baseline cases. In the BSS cases, new forms of energy (e.g., advanced bio-technology, fusion energy, and others) are assumed to be available at costs that allow them to compete for market share. More detail on the assumptions is shown in Table A.1. The technology assumptions in the table reflect midpoints in a range of costs for the technology when it is deployed at very large scales (tens to hundreds of EJs); there will be applications where the costs are either higher or lower.
In addition to the basic assumptions about technology shown in Table A.1, every run of an integrated assessment model, even a compact one such as MiniCAM, requires literally hundreds of numerical assumptions about regional resource sizes, extraction costs, technology costs, and more. Many such assumptions are embedded in the logic of the model. Others are specified for a given case. Therefore, the results of the model runs are heavily dependent on a wide range of assumptions and should be interpreted as illustrative, not in any way predictive.
A.2 The Reference Case: Energy and Emissions Projections
In the Reference Case, world primary energy demand rises from approximately 400 EJ today to 1200 EJ by the end of the century (Figure A.2). Fossil fuels remain dominant in the energy system (accounting for 75% of cumulative energy supply between 2000 and 2100), coupled with a significant global expansion of renewable energy (11% of cumulative energy supply), nuclear energy (5% of cumulative energy supply), and energy derived from biomass (9% of cumulative energy supply). Coal and natural gas use increase three-fold over the century, and oil use increases through the middle of the century and then begins a decline, as increasingly expensive sources of oil are tapped. These fossil fuel increases, particularly in the latter half of the century, are based on the assumption that unconventional fossil resources (e.g., oil shale, tar sands, and methane hydrates) ultimately become available. Renewable energy (solar and wind) and biomass-derived energy, combined, rival the scale of today’s petroleum industry by the end of the century in the Reference Case. The cumulative amount of energy supplied by various sources is shown in Figure A.3. (Note that while the Reference Case was not explicitly calibrated to EIA’s projections over the next several decades, it is generally consistent with EIA projections, which extend to 2025.)
As a result of increasing energy use and industrial activity, greenhouse gas emissions rise in the Reference Case. Carbon dioxide emissions increase by a factor of three, from 6.5 GtC in 2000 to 19.4 GtC/yr by 2100 (Figure A.4). This is primarily a result of continuing reliance on fossil fuels throughout

A.10
-
200
400
600
800
1,000
1,200
1,400
1990 2005 2020 2035 2050 2065 2080 2095Year
EJ/
yr
Coal Oil Gas Nuclear Renewables Biomass
Figure A.2. World Energy Demand in the Reference Case
World Primary Energy DemandCumulative Exajoules (EJ) over the Century
Unsequestered Fossil 75%
Renewables 11%
Nuclear 5%
Biomass 9%
Figure A.3. Cumulative World Energy Demand in the Reference Case

A.11
-
5
10
15
20
25
1990 2005 2020 2035 2050 2065 2080 2095
Year
GtC
/yr
Coal Oil Gas
Figure A.4. World CO2 Emissions in the Reference Case
the century. Of the total CO2 emissions, about one half is attributable to coal and the remaining half to natural gas and oil combined. The CO2 emissions fall in the middle of the range projected in the IPCC SRES analysis, as shown in Box A.2.(a)
Regarding non-CO2 GHG emissions, methane (CH4) emissions in the Reference Case rise to 1.7 gigatons of carbon equivalent (GtC-eq)(b) by 2035 and stay essentially flat thereafter. Nitrous oxide (N2O) emissions rise to 1.22 GtC-eq by 2020, remain roughly level through 2035, and decline somewhat thereafter (Figure A.5). In addition to CH4 and N2O, a number of other fluorinated gases, contribute to the growing amounts of GHG emissions over the course of the century.
(a) While the Reference Case developed for CCTP is consistent with the B2 storyline, it is not identical to the
MiniCAM B2 scenario that was used as part of the SRES process. For example, in the CCTP Reference Case, CO2 emissions approach 19.5 GtC by the end of the century; whereas they were slightly above 15GtC/yr in the SRES MiniCAM B2 run. The difference is a result of variations in assumptions.
(b) The emissions for non-CO2 GHGs are stated in units of “GtC-equivalents”, which is a common way of comparing emissions of different greenhouse gases. This conversion is performed based on physical emissions, weighted by each gas’ global warming potential (GWP). The GWP is the relative ability of a gas to trap heat in the atmosphere over a given time frame, compared to the CO2 reference gas (per unit weight). The choice of time frame is significant, and can change relative GWPs by orders of magnitude. All non-CO2 gases are compared to CO2, which has a GWP of 1. The global warming potentials of other GHGs, using a 100-year time horizon, range from 23 for methane to 22,200 for SF6, (IPCC 2001).

A.12
0.0
0.5
1.0
1.5
2.0
2.5
3.0
3.5
4.0
1990 2005 2020 2035 2050 2065 2080 2095
Year
Car
bon
Equ
ival
ent
Em
issi
ons
(GtC
/yr)
CF4C2F6SF6HFC-143aHFC125(227ea)HFC-134aHFC-245faN2OCH4
Figure A.5. Emissions of Other (Non-CO2) GHGs in the Reference Case, in terms of Carbon-Equivalent Emissions
Figures A.6 and A.7 show the CH4 and N2O emissions, respectively, in the Reference Case, compared to the respective IPCC SRES ranges and also to a more recent international study being conducted by the Stanford Energy Modeling Forum (EMF21).(a) For both CH4 and N2O, these MiniCAM results fall in the lower part of the range of those being examined by EMF. The lower emissions in these cases result from assumptions about the slowing of agricultural activity in the latter part of the century, increases in agricultural productivity and fertilizer efficiency, methane capture due to rising natural gas prices, and other assumptions made in the cases conducted for CCTP or embedded in the MiniCAM model.
A.3 Emissions-Constrained Cases: Energy and Emissions Results
In each of the hypothetical CO2-emissions-constrained cases conducted for CCTP, carbon emissions are not permitted to exceed the constraints presented previously in Figure A.1.(b) We analyzed sixteen CO2-emissions-constrained cases, including the four baselines (based on the four hypothetical carbon constraints shown in Figure A.1) and twelve illustrative advanced technology cases (the four hypothetical carbon constraints were used to generate the four CLC cases, four NEB cases, and four BSS cases). For each of the sixteen emission-constrained cases, non-CO2 GHGs are also lower than in the Reference Case due to economic considerations or technology progress (or both). Sections A.3.1 through A.3.4 present
(a) See URL: http://www.stanford.edu/group/EMF/research/doc/emf21des.html (b) Sometimes the CO2 emissions in the advanced technology scenarios are projected to be lower than those in the
hypothetical emissions constrained cases presented in Figure 3-1, because advanced technology is assumed to be cost effective and to penetrate the market even more than the constraint requires.

A.13
Box A.2 Emissions Projections for Various Energy-Economic Models
The Intergovernmental Panel on Climate Change’s (IPCC) Special Report on Emission Scenarios (SRES) included four families of scenarios: A1, A2, B1, and B2. Each family of scenarios has its own demographic, economic, and technology assumptions. Using these assumptions, six energy-economic models were used in the IPCC study to estimate future energy demand and the associated CO2 emissions. The results from the analysis are shown below. The B2 scenario is a mid-range SRES scenario. When MiniCAM, the specific model employed as part of this analysis, participated in the IPCC SRES process, its B2 results (see red bold line) fell within the mid-range of projections made by the other models. The key (to the right) indicates the name of the model used (AIM, ASF, IMAGE, MESSAGE, MARIA, and MiniCAM) and the scenario (A1, A2, B1, B2). See the SRES report (IPCC 2000) for more detail.
0
5
10
15
20
25
30
35
40
1990 2000 2010 2020 2030 2040 2050 2060 2070 2080 2090 2100
[GtC] A1 AIMA1 ASFA1 IMAGEA1 MESSAGEA1 MINICAMA1 MARIAA1C AIMA1C MESSAGEA1C MINICAMA1G AIMA1G MESSAGEA1G MINICAMA1V1 MINICAMA1V2 MINICAMA1T AIMA1T MESSAGEA1T MARIAA2 ASFA2 AIMA2G IMAGEA2 MESSAGEA2 MINICAMA2-A1 MINICAMB1 IMAGEB1 AIMB1 ASFB1 MESSAGEB1 MARIAB1 MINICAMB1T MESSAGEB1HIGH MESSAGEB1HIGH MINICAMB2 MESSAGEB2 AIMB2 ASFB2 IMAGEB2 MARIAB2 MINICAMB2HIGH MINICAMB2C MARIA5%25%meanmedian75%95%
MiniCAM B2 Reference Case

A.14
0.0
1.0
2.0
3.0
4.0
5.0
6.0
2000 2025 2050 2075 2100
Gt C
eq /
yr
A2-ASF
EMF 21 range
B2-MESSAGE
CCTP MiniCAM
A1-AIM
B1-IMAGE
CCTP Reference Case
Figure A.6. Range of Global Anthropogenic Methane Emissions
0.0
0.5
1.0
1.5
2.0
2.5
3.0
2000 2025 2050 2075 2100
Gt
Ceq
/yr
EMF 21 rangeA2-ASFCCTP MiniCAMA1-AIMB2-MESSAGEB1-IMAGE
CCTP Reference Case
Figure A.7. Range of Global Anthropogenic Nitrous Oxide Emissions
the energy and CO2 results for the baseline and twelve illustrative advanced technology cases. Section A.3.5 discusses the non-CO2 GHG emissions reductions.
In Sections A.3.1 through A.3.4, four charts are provided for each of the sixteen cases to show the energy and CO2 emissions results (see Figures A.8 through A.23). The first chart in each set (upper left) shows the primary energy mix over the century, including the relative contributions of carbon-emitting, carbon-free, and carbon-neutral energy technology. Classes of technology delivering this energy include:
A.15
• Energy use reduction, which includes energy efficiency(a)
• Fossil fuel use without CO2 capture and storage
• Fossil fuel use integrated with or offset by CO2 capture and storage
• Nuclear energy
• Renewable energy (primarily solar and wind energy)(b)
• Energy from biomass
• Highly-advanced technologies such as advanced biotechnology and “exotic” new energy forms, such as fusion, space solar, and others.(c)
The contribution of each of these classes of technology varies by case (see Figures A.8 through A.23). However, a fundamental pattern that persists across the three of the advanced technology cases is that fossil fuel use without CO2 capture and storage (shown by the gray area at the base of the charts) peaks and then declines over the course of this century.(d) This is a result of the imposed emissions constraints. In all cases, the decline is accompanied by the introduction of carbon-neutral energy (i.e., fossil fuel use accompanied by CO2 capture and storage) and carbon-free energy (i.e., nuclear, renewable and biomass based energy), as well as a reduction in total energy use (beyond the level resulting from the energy efficiency improvements in the Reference Case).
The second chart provided in each set (lower left) shows the projected CO2 emissions from fossil fuel use without CO2 capture and storage (the gray area at the bottom of the chart), together with CO2 emissions that are mitigated from the level projected in the Reference Case (the mitigated emissions, for each mitigation source, are shown as the colored areas above the gray area). The sources of emission mitigation include:
• Terrestrial sequestration
• Capture and storage of CO2
(a) Energy use reduction reflects a reduction in overall energy demand as a result of both supply and end-use
energy efficiency gains that are achieved through increased technological performance, price-induced penetration of energy efficiency into the marketplace, and structural change in the economy as it grows. Thus, efficiency is clearly a fundamental factor in energy use reduction, but is not the only factor.
(b) Biomass is also considered a renewable energy form, but is shown separately in these figures (c) Both advanced biotechnology and the “exotic” or novel forms of energy, such as fusion and space-solar
applications, are combined under the term “exotic” in the figures. This does not imply that biotechnology and fusion are on the same timeline for development. For instance, biotechnology could have commercial success sooner.
(d) An exception to this trend occurs in some of the low CO2 emissions constraint scenarios, in which CO2 emissions level off toward the end of the century but do not decline.

A.16
• Energy use reduction (including energy saved as a result of energy efficiency in energy end use sectors and in energy production)
• Renewable energy
• Nuclear energy
• Changes in the global fuel mix (e.g., switching from coal to natural gas)
• Highly-advanced technologies, such as advanced biotechnology and “exotic” forms of energy, as described previously.
Note that some of these key classes of technology (e.g., energy use reduction, as well as renewable, nuclear, and biomass energy) deliver significant reductions in carbon intensity of the world economy as part of the Reference Case. The mitigation shown in the charts presented in Figures A.7 through A.22 represents mitigation beyond the levels in the Reference Case. Hence, this chart does not capture the full mitigation benefits of these technologies in comparison to today’s level of technology. Had a different Reference Case been used, the results might be substantially different. In general, the more technological advance that is included the in the Reference Case for a technology, the lower will be its contributions to movements beyond the Reference Case. For this reason, these charts should be interpreted carefully.
The next chart (upper right) shows the cumulative energy consumption over the century (the sum of annual energy consumption in every year of the century, by energy source). The final chart (lower right) shows cumulative CO2 emissions mitigation, by source, and is subject to the same limitations as discussed above.
The sections below (A.3.1 through A.3.4) discuss the energy and CO2 emissions results for the sixteen cases – the baselines, as well as the twelve advanced technology cases: four cases each for CLC, NEB, and BSS. The final section (A.3.5) presents the results for each of the cases for the non-CO2 gases. These results were developed by the EPA with assistance from PNNL.
A.3.1 Baseline Cases Assuming Reference Case Technology Assumptions: Energy and CO2 Emissions
Figures A.8 through A.11 provide energy and CO2 emissions results for the baseline cases that meet the four hypothetical levels of CO2 emissions constraint. The baseline cases use the same technology assumptions as the Reference Case. Under the very high carbon constraint, fossil fuel use without CO2
capture and storage and the corresponding CO2 emissions are considerably lower than in the other cases. In terms of cumulative contributions, energy use reduction and biomass supply a large portion of the energy in this very high constraint case, although fossil fuel combustion without CO2 capture and storage remains the largest single source of cumulative energy supply over the course of the 21st Century. At the same time, a transition takes place away from fossil fuel use without CO2 capture and storage, so that,

A.17
World Primary Energy Demand, 1990-2095
-
200
400
600
800
1,000
1,200
1,400
1990 2005 2020 2035 2050 2065 2080 2095
Year
EJ/
yr
Fossil w/o Capture & Storage NuclearRenewables BiomassEnergy Use Reduction
Projected and Mitigated World Carbon Emissions, 1990-2095
0
5
10
15
20
25
1990 2005 2020 2035 2050 2065 2080 2095Year
GtC
/yr
Vented Emissions NuclearRenewables Biomass
Fuel Mix Energy Use Reduction
Mitigated World Carbon Emissions Beyond the Reference Case
Cumulative Gigatonnes (GtC) 2000-2100
0
50
100
150
200
250
300
350
Ene
rgy
Use
Red
uctio
n
Ren
ewab
les
Nuc
lear
Bio
mas
s
Fue
l Mix
Fos
sil w
/ C
aptu
re &
Sto
rage
Terr
estri
alS
eque
stra
tion
Exo
tics
GtC
World Primary Energy DemandCumulative Exajoules (EJ) 2000-2100
Fossil w/o Capture & Storage
33%
Renewables 12%
Nuclear 13%
Biomass 25%
Energy Use Reduction
17%
Figure A.8. Results for Baseline (Using Reference Case Technologies) for Very High Emissions Constraint

A.18
World Primary Energy Demand, 1990-2095
-
200
400
600
800
1,000
1,200
1,400
1990 2005 2020 2035 2050 2065 2080 2095
Year
EJ/
yr
Fossil w/o Capture & Storage NuclearRenewables BiomassEnergy Use Reduction
Projected and Mitigated World Carbon Emissions, 1990-2095
0
5
10
15
20
25
1990 2005 2020 2035 2050 2065 2080 2095Year
GtC
/yr
Vented Emissions NuclearBiomass Fuel Mix
Energy Use Reduction
Mitigated World Carbon Emissions Beyond the Reference Case
Cumulative Gigatonnes (GtC) 2000-2100
0
50
100
150
200
250
Ene
rgy
Use
Red
uctio
n
Ren
ewab
les
Nuc
lear
Bio
mas
s
Fue
l Mix
Fos
sil w
/ C
aptu
re &
Sto
rage
Ter
rest
rial
Seq
uest
ratio
n
Exo
tics
GtC
World Primary Energy DemandCumulative Exajoules (EJ) 2000-2100
Fossil w/o Capture & Storage
52%
Renewables 11%
Nuclear 9%
Biomass 17%
Energy Use Reduction
11%
Figure A.9. Results for Baseline (Using Reference Case Technologies) for High Emissions Constraint

A.19
World Primary Energy Demand, 1990-2095
-
200
400
600
800
1,000
1,200
1,400
1990 2005 2020 2035 2050 2065 2080 2095
Year
EJ/
yr
Fossil w/o Capture & Storage NuclearRenewables BiomassEnergy Use Reduction
Projected and Mitigated World Carbon Emissions, 1990-2095
0
5
10
15
20
25
1990 2005 2020 2035 2050 2065 2080 2095Year
GtC
/yr
Vented Emissions Nuclear
Renewables Biomass
Fuel Mix Energy Use Reduction
Mitigated World Carbon Emissions Beyond the Reference Case
Cumulative Gigatonnes (GtC) 2000-2100
0
20
40
60
80
100
120
140
Ene
rgy
Use
Red
uctio
n
Ren
ewab
les
Nuc
lear
Bio
mas
s
Fue
l Mix
Fos
sil w
/ C
aptu
re &
Sto
rage
Terr
estri
alS
eque
stra
tion
Exo
tics
GtC
World Primary Energy DemandCumulative Exajoules (EJ) 2000-2100
Fossil w/o Capture &
Storage 62%
Renewables 11%
Nuclear 7%
Biomass 13%
Energy Use Reduction
7%
Figure A.10. Results for Baseline (Using Reference Case Technologies) for Medium Emissions Constraint

A.20
World Primary Energy Demand, 1990-2095
-
200
400
600
800
1,000
1,200
1,400
1990 2005 2020 2035 2050 2065 2080 2095
Year
EJ/
yr
Fossil w/o Capture & Storage NuclearRenewables BiomassEnergy Use Reduction
Projected and Mitigated World Carbon Emissions, 1990-2095
0
5
10
15
20
25
1990 2005 2020 2035 2050 2065 2080 2095Year
GtC
/yr
Vented Emissions NuclearBiomass Fuel Mix
Energy Use Reduction
Mitigated World Carbon Emissions Beyond the Reference Case
Cumulative Gigatonnes (GtC) 2000-2100
0
10
20
30
40
50
60
70
80
90
Ene
rgy
Use
Red
uctio
n
Ren
ewab
les
Nuc
lear
Bio
mas
s
Fuel
Mix
Fos
sil w
/ C
aptu
re &
Sto
rage
Ter
rest
rial
Seq
uest
ratio
n
Exo
tics
GtC
World Primary Energy DemandCumulative Exajoules (EJ) 2000-2100
Fossil w/o Capture & Storage
66%Renewables
11%
Nuclear7%
Biomass11%
Energy Use Reduction
5%
Figure A.11. Results for Baseline (Using Reference Case Technologies) for Low Emissions Constraint

A.21
by the end of the century, fossil fuel use without capture and storage contributes only about one-fifth of all primary energy. Nuclear, renewable, and biomass energy play important roles in energy supply in the baseline cases.
In the cases where the emission constraint is lower, the cumulative contribution of energy use reduction and biomass energy is lower, while the total cumulative amount of renewable and nuclear energy stays relatively constant. (This result is highly dependent on the relative costs assumed for these energy technologies in the Reference Case. As the constraint gets tighter, the relatively more expensive technologies must be called upon to meet the higher levels of reduction.)
In the low emission reduction case, a large portion of the required emissions reduction can be met by energy use reduction (use of highly energy-efficient end use technology and improved efficiency of energy supply) and terrestrial sequestration.
A.3.2 The CLC Cases: Energy and CO2 Emissions
Figures A.12 through A.15 presents results for the four CLC cases. Under the very high emission constraint, fossil fuel use without CO2 capture and storage remains the largest cumulative energy source, supplying 36% of cumulative energy over the course of the century, but its role declines substantially toward the end of the century. After the middle of the century, fossil fuels with CO2 capture and storage become a key energy supplier. In this case, the early penetration of low-cost terrestrial sequestration and energy efficiency helps buy time, while these advanced technologies are developed and deployed. Energy end-use reduction also plays a big role by reducing the total energy demand; this decreases the burden on CO2 capture and storage, as well as on other energy sources that have zero (or near net-zero) emissions, such as renewables, biomass, and nuclear. By the end of the century, though, these zero- or near-net-zero emissions sources provide nearly as much energy as the total global energy of today.
In cases where the carbon constraint is more relaxed, fossil fuel use without CO2 capture and storage is higher. Compared to use of CO2 capture and storage, energy use reduction plays a more dominant role in meeting the required emissions reductions in the low and medium reduction cases than in the very high and high emissions reduction case. Nuclear and renewables play an important role in reducing emissions over the course of the century under all the carbon constraint cases within the CLC cases.
Looking across all of the cases (Figures A.8 through A.23), energy use reduction is generally projected to be highest in the CLC cases than in the BSS and NEB cases for the same level of carbon constraint. This occurs because the CLC cases assume a higher level of efficiency in the fossil-fueled energy supply technologies (e.g., coal-based power production), in addition to including the same level advanced energy efficiency in the end-use sectors that all of the illustrative advanced technology cases assume. The supply-side efficiency decreases the primary energy required to meet the demand for primary energy, thereby adding to the energy use reduction, even before the imposition of any constraint on carbon. The BSS and NEB cases do not include the fossil technology energy efficiency improvements, and therefore energy use reduction is lower in these two.

A.22
World Primary Energy Demand, 1990-2095
-
200
400
600
800
1,000
1,200
1,400
1990 2005 2020 2035 2050 2065 2080 2095
Year
EJ/
yr
Fossil w/o Capture & Storage Fossil w/ Capture & StorageNuclear RenewablesBiomass Energy Use Reduction
Projected and Mitigated World Carbon Emissions, 1990-2095
0
5
10
15
20
25
1990 2005 2020 2035 2050 2065 2080 2095Year
GtC
/yr
Vented Emissions Fossil w/ Capture & StorageTerrestrial Sequestration NuclearBiomass Fuel MixEnergy Use Reduction
Mitigated World Carbon Emissions Beyond the Reference Case
Cumulative Gigatonnes (GtC) 2000-2100
0
50
100
150
200
250
300
350
400
Ene
rgy
Use
Red
uctio
n
Ren
ewab
les
Nuc
lear
Bio
mas
s
Fue
l Mix
Fos
sil w
/ C
aptu
re &
Sto
rage
Ter
rest
rial
Seq
uest
ratio
n
Exo
tics
GtC
World Primary Energy DemandCumulative Exajoules (EJ) 2000-2100
Fossil w/o Capture & Storage
36%
Renewables 10%
Nuclear 5%
Fossil w/ Capture & Storage
15%
Biomass 13%
Energy Use Reduction
21%
Figure A.12. Results for Closing the Loop on Carbon for Very High Emissions Constraint

A.23
World Primary Energy Demand, 1990-2095
-
200
400
600
800
1,000
1,200
1,400
1990 2005 2020 2035 2050 2065 2080 2095
Year
EJ/
yr
Fossil w/o Capture & Storage Fossil w/ Capture & StorageNuclear RenewablesBiomass Energy Use Reduction
Projected and Mitigated World Carbon Emissions, 1990-2095
0
5
10
15
20
25
1990 2005 2020 2035 2050 2065 2080 2095Year
GtC
/yr
Vented Emissions Fossil w/ Capture & StorageTerrestrial Sequestration Biomass
Fuel Mix Energy Use Reduction
Mitigated World Carbon Emissions Beyond the Reference Case
Cumulative Gigatonnes (GtC) 2000-2100
0
50
100
150
200
250
300
Ene
rgy
Use
Red
uctio
n
Ren
ewab
les
Nuc
lear
Bio
mas
s
Fuel
Mix
Fos
sil w
/ C
aptu
re &
Sto
rage
Terr
estr
ial
Seq
uest
ratio
n
Exo
tics
GtC
World Primary Energy DemandCumulative Exajoules (EJ) 2000-2100
Fossil w/o Capture & Storage
54%
Renewables 9%
Nuclear 4%
Fossil w/ Capture &
Storage 7%
Biomass 10%
Energy Use Reduction
16%
Figure A.13. Results for Closing the Loop on Carbon for High Emissions Constraint

A.24
World Primary Energy Demand, 1990-2095
-
200
400
600
800
1,000
1,200
1,400
1990 2005 2020 2035 2050 2065 2080 2095
Year
EJ/
yr
Fossil w/o Capture & Storage Fossil w/ Capture & StorageNuclear RenewablesBiomass Energy Use Reduction
Projected and Mitigated World Carbon Emissions, 1990-2095
0
5
10
15
20
25
1990 2005 2020 2035 2050 2065 2080 2095Year
GtC
/yr
Vented Emissions Fossil w/ Capture & Storage
Terrestrial Sequestration Biomass
Fuel Mix Energy Use Reduction
Mitigated World Carbon Emissions Beyond the Reference Case
Cumulative Gigatonnes (GtC) 2000-2100
0
50
100
150
200
250
Ene
rgy
Use
Red
uctio
n
Ren
ewab
les
Nuc
lear
Bio
mas
s
Fue
l Mix
Fos
sil w
/ C
aptu
re &
Sto
rage
Terr
estri
alS
eque
stra
tion
Exo
tics
GtC
World Primary Energy DemandCumulative Exajoules (EJ) 2000-2100
Fossil w/o Capture & Storage
59%
Renewables 9%
Nuclear 4%
Fossil w/ Capture &
Storage 4%
Biomass 10%
Energy Use Reduction
14%
Figure A.14. Results for Closing the Loop on Carbon for Medium Emissions Constraint

A.25
World Primary Energy Demand, 1990-2095
-
200
400
600
800
1,000
1,200
1,400
1990 2005 2020 2035 2050 2065 2080 2095
Year
EJ/
yr
Fossil w/o Capture & Storage NuclearRenewables BiomassEnergy Use Reduction
Projected and Mitigated World Carbon Emissions, 1990-2095
0
5
10
15
20
25
1990 2005 2020 2035 2050 2065 2080 2095Year
GtC
/yr
Vented Emissions Terrestrial Sequestration
Fuel Mix Energy Use Reduction
Mitigated World Carbon Emissions Beyond the Reference Case
Cumulative Gigatonnes (GtC) 2000-2100
0
20
40
60
80
100
120
140
160
180
200
Ene
rgy
Use
Red
uctio
n
Ren
ewab
les
Nuc
lear
Bio
mas
s
Fue
l Mix
Fos
sil w
/ C
aptu
re &
Sto
rage
Terr
estri
alS
eque
stra
tion
Exo
tics
GtC
World Primary Energy DemandCumulative Exajoules (EJ) 2000-2100
Fossil w/o Capture & Storage
65%
Renewables 9%
Nuclear 4%
Biomass 9%
Energy Use Reduction
13%
Figure A.15. Results for Closing the Loop on Carbon for Low Emissions Constraint

A.26
World Primary Energy Demand, 1990-2095
-
200
400
600
800
1,000
1,200
1,400
1990 2005 2020 2035 2050 2065 2080 2095
Year
EJ/
yr
Fossil w/o Capture & Storage Fossil w/ Capture & StorageNuclear RenewablesBiomass ExoticsEnergy Use Reduction
Projected and Mitigated World Carbon Emissions, 1990-2095
0
5
10
15
20
25
1990 2005 2020 2035 2050 2065 2080 2095Year
GtC
/yr
Vented Emissions Fossil w/ Capture & StorageTerrestrial Sequestration NuclearRenewables BiomassFuel Mix Energy Use Reduction
Mitigated World Carbon Emissions Beyond the Reference Case
Cumulative Gigatonnes (GtC) 2000-2100
0
50
100
150
200
250
300
Ene
rgy
Use
Red
uctio
n
Ren
ewab
les
Nuc
lear
Bio
mas
s
Fue
l Mix
Fos
sil w
/ C
aptu
re &
Sto
rage
Terr
estri
alS
eque
stra
tion
Exo
tics
GtC
World Primary Energy DemandCumulative Exajoules (EJ) 2000-2100
Fossil w/o Capture & Storage
36%
Renewables 16%
Nuclear 12%
Fossil w/ Capture & Storage 5%Biomass
15%
Energy Use Reduction
16%
Figure A.16. Results for A New Energy Backbone for Very High Emissions Constraint
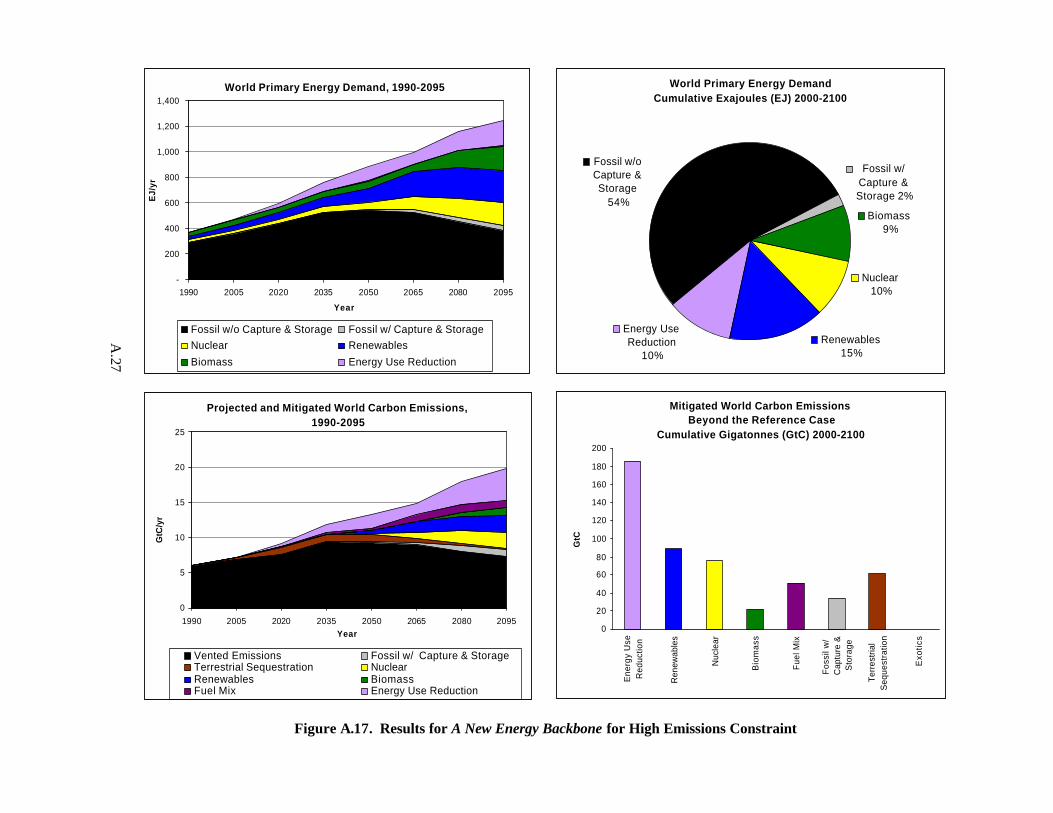
A.27
-
200
400
600
800
1,000
1,200
1,400
1990 2005 2020 2035 2050 2065 2080 2095
Year
EJ/
yr
Fossil w/o Capture & Storage Fossil w/ Capture & StorageNuclear Renewables
Biomass Energy Use Reduction
World Primary Energy Demand, 1990-2095
Projected and Mitigated World Carbon Emissions, 1990-2095
0
5
10
15
20
25
1990 2005 2020 2035 2050 2065 2080 2095Year
GtC
/yr
Vented Emissions Fossil w/ Capture & StorageTerrestrial Sequestration NuclearRenewables BiomassFuel Mix Energy Use Reduction
Mitigated World Carbon Emissions Beyond the Reference Case
Cumulative Gigatonnes (GtC) 2000-2100
0
20
40
60
80
100
120
140
160
180
200
Ene
rgy
Use
Red
uctio
n
Ren
ewab
les
Nuc
lear
Bio
mas
s
Fue
l Mix
Fos
sil w
/ C
aptu
re &
Sto
rage
Terr
estri
alS
eque
stra
tion
Exo
tics
GtC
World Primary Energy DemandCumulative Exajoules (EJ) 2000-2100
Renewables 15%
Fossil w/o Capture & Storage
54%
Nuclear 10%
Fossil w/ Capture & Storage 2%
Biomass 9%
Energy Use Reduction
10%
Figure A.17. Results for A New Energy Backbone for High Emissions Constraint

A.28
World Primary Energy Demand, 1990-2095
-
200
400
600
800
1,000
1,200
1,400
1990 2005 2020 2035 2050 2065 2080 2095
Year
EJ/
yr
Fossil w/o Capture & Storage Fossil w/ Capture & StorageNuclear RenewablesBiomass Energy Use Reduction
Projected and Mitigated World Carbon Emissions, 1990-2095
0
5
10
15
20
25
1990 2005 2020 2035 2050 2065 2080 2095Year
GtC
/yr
Vented Emissions Fossil w/ Capture & StorageTerrestrial Sequestration NuclearRenewables Fuel MixEnergy Use Reduction
Mitigated World Carbon Emissions Beyond the Reference Case
Cumulative Gigatonnes (GtC) 2000-2100
0
20
40
60
80
100
120
140
Ene
rgy
Use
Red
uctio
n
Ren
ewab
les
Nuc
lear
Bio
mas
s
Fue
l Mix
Fos
sil w
/ C
aptu
re &
Sto
rage
Terr
estri
alS
eque
stra
tion
Exo
tics
GtC
World Primary Energy DemandCumulative Exajoules (EJ) 2000-2100
Fossil w/o Capture & Storage
61%
Renewables 15%
Nuclear 8%
Fossil w/ Capture &
Storage 1%
Biomass 7%
Energy Use Reduction
8%
Figure A.18. Results for A New Energy Backbone for Medium Emissions Constraint

A.29
World Primary Energy Demand, 1990-2095
-
200
400
600
800
1,000
1,200
1,400
1990 2005 2020 2035 2050 2065 2080 2095
Year
EJ/
yr
Fossil w/o Capture & Storage NuclearRenewables BiomassEnergy Use Reduction
Projected and Mitigated World Carbon Emissions, 1990-2095
0
5
10
15
20
25
1990 2005 2020 2035 2050 2065 2080 2095Year
GtC
/yr
Vented Emissions Fossil w/ Capture & StorageTerrestrial Sequestration NuclearRenewables Fuel MixEnergy Use Reduction
Mitigated World Carbon Emissions Beyond the Reference Case
Cumulative Gigatonnes (GtC) 2000-2100
0
20
40
60
80
100
120
Ene
rgy
Use
Red
uctio
n
Ren
ewab
les
Nuc
lear
Bio
mas
s
Fue
l Mix
Foss
il w
/ C
aptu
re &
Sto
rage
Ter
rest
rial
Seq
uest
ratio
n
Exo
tics
GtC
World Primary Energy DemandCumulative Exajoules (EJ) 2000-2100
Fossil w/o Capture & Storage
63%
Renewables 16%
Energy Use Reduction
6%
Biomass 7%
Nuclear 8%
Figure A.19. Results for A New Energy Backbone for Low Emissions Constraint

A.30
World Primary Energy Demand, 1990-2095
-
200
400
600
800
1,000
1,200
1,400
1990 2005 2020 2035 2050 2065 2080 2095
Year
EJ/
yr
Fossil w/o Capture & Storage Fossil w/ Capture & StorageNuclear RenewablesBiomass ExoticsEnergy Use Reduction
Projected and Mitigated World Carbon Emissions, 1990-2095
0
5
10
15
20
25
1990 2005 2020 2035 2050 2065 2080 2095Year
GtC
/yr
Vented Emissions Fossil w/ Capture & StorageTerrestrial Sequestration NuclearRenewables BiomassExotics Fuel MixEnergy Use Reduction
Mitigated World Carbon Emissions Beyond the Reference Case
Cumulative Gigatonnes (GtC) 2000-2100
0
50
100
150
200
250
300
350
400
Ene
rgy
Use
Red
uctio
n
Ren
ewab
les
Nuc
lear
Bio
mas
s
Fue
l Mix
Fos
sil w
/ C
aptu
re &
Sto
rage
Terr
estri
alS
eque
stra
tion
Exo
tics
GtC
World Primary Energy DemandCumulative Exajoules (EJ) 2000-2100
Fossil w/o Capture &
Storage 37%
Renewables 10%
Nuclear 6%
Fossil w/ Capture &
Storage 5%
Biomass 16%
Exotics 7%
Energy Use Reduction 19%
Figure A.20. Results for Beyond the Standard Suite for Very High Emissions Constraint

A.31
World Primary Energy Demand, 1990-2095
-
200
400
600
800
1,000
1,200
1,400
1990 2005 2020 2035 2050 2065 2080 2095
Year
EJ/
yr
Fossil w/o Capture & Storage Fossil w/ Capture & StorageNuclear RenewablesBiomass ExoticsEnergy Use Reduction
Projected and Mitigated World Carbon Emissions, 1990-2095
0
5
10
15
20
25
1990 2005 2020 2035 2050 2065 2080 2095Year
GtC
/yr
Vented Emissions Fossil w/ Capture & StorageTerrestrial Sequestration BiomassExotics Fuel MixEnergy Use Reduction
Mitigated World Carbon Emissions Beyond the Reference Case
Cumulative Gigatonnes (GtC) 2000-2100
0
50
100
150
200
250
Ene
rgy
Use
Red
uctio
n
Ren
ewab
les
Nuc
lear
Bio
mas
s
Fue
l Mix
Fos
sil w
/ C
aptu
re &
Sto
rage
Terr
estr
ial
Seq
uest
ratio
n
Exo
tics
GtC
World Primary Energy DemandCumulative Exajoules (EJ) 2000-2100
Fossil w/o Capture &
Storage 53%
Renewables 10%
Nuclear 5%
Fossil w/ Capture & Storage 2%
Biomass 10%
Exotics 6%Energy Use Reduction 14%
Figure A.21. Results for Beyond the Standard Suite for High Emissions Constraint
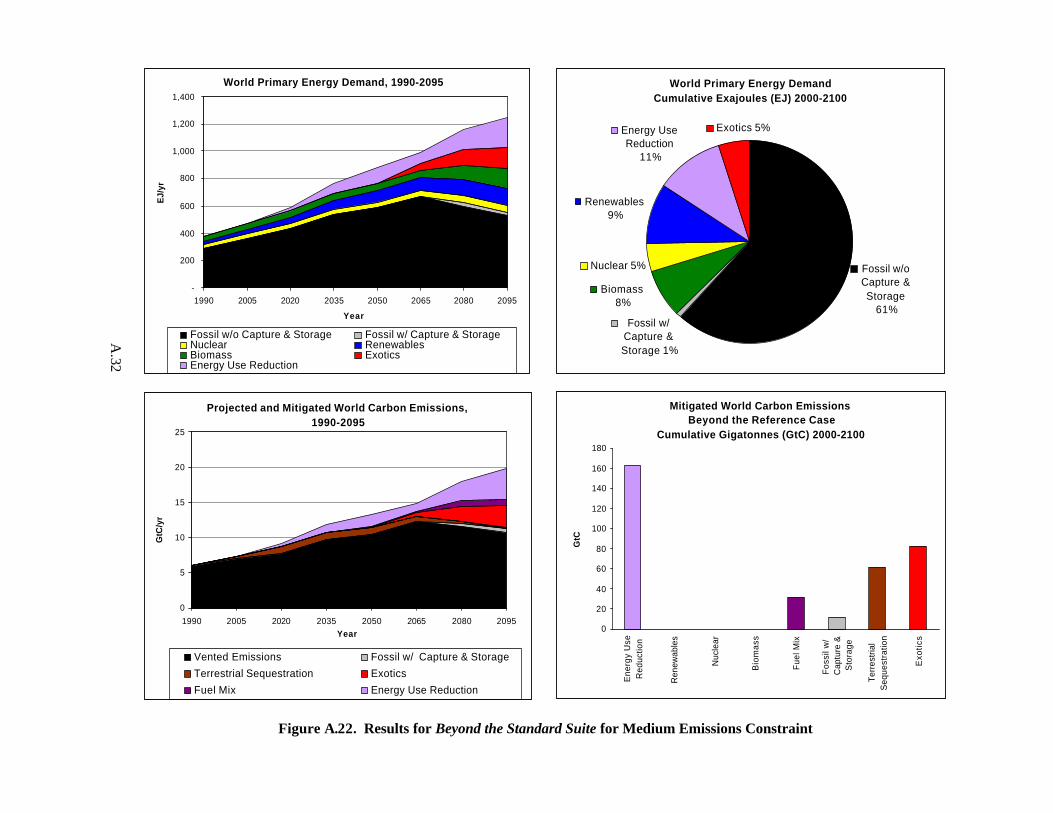
A.32
World Primary Energy Demand, 1990-2095
-
200
400
600
800
1,000
1,200
1,400
1990 2005 2020 2035 2050 2065 2080 2095
Year
EJ/
yr
Fossil w/o Capture & Storage Fossil w/ Capture & StorageNuclear RenewablesBiomass ExoticsEnergy Use Reduction
Projected and Mitigated World Carbon Emissions, 1990-2095
0
5
10
15
20
25
1990 2005 2020 2035 2050 2065 2080 2095Year
GtC
/yr
Vented Emissions Fossil w/ Capture & Storage
Terrestrial Sequestration Exotics
Fuel Mix Energy Use Reduction
Mitigated World Carbon Emissions Beyond the Reference Case
Cumulative Gigatonnes (GtC) 2000-2100
0
20
40
60
80
100
120
140
160
180
Ene
rgy
Use
Red
uctio
n
Ren
ewab
les
Nuc
lear
Bio
mas
s
Fue
l Mix
Fos
sil w
/ C
aptu
re &
Sto
rage
Terr
estri
alS
eque
stra
tion
Exo
tics
GtC
World Primary Energy DemandCumulative Exajoules (EJ) 2000-2100
Fossil w/o Capture & Storage
61%
Renewables 9%
Nuclear 5%
Fossil w/ Capture & Storage 1%
Biomass 8%
Exotics 5%Energy Use Reduction
11%
Figure A.22. Results for Beyond the Standard Suite for Medium Emissions Constraint

A.33
World Primary Energy Demand, 1990-2095
-
200
400
600
800
1,000
1,200
1,400
1990 2005 2020 2035 2050 2065 2080 2095
Year
EJ/
yr
Fossil w/o Capture & Storage Fossil w/ Capture & StorageNuclear RenewablesBiomass ExoticsEnergy Use Reduction
Projected and Mitigated World Carbon Emissions, 1990-2095
0
5
10
15
20
25
1990 2005 2020 2035 2050 2065 2080 2095Year
GtC
/yr
Vented Emissions Fossil w/ Capture & Storage
Terrestrial Sequestration Exotics
Fuel Mix Energy Use Reduction
Mitigated World Carbon Emissions Beyond the Reference Case
Cumulative Gigatonnes (GtC) 2000-2100
0
20
40
60
80
100
120
140
Ene
rgy
Use
Red
uctio
n
Ren
ewab
les
Nuc
lear
Bio
mas
s
Fue
l Mix
Fos
sil w
/ C
aptu
re &
Sto
rage
Terr
estri
alS
eque
stra
tion
Exo
tics
GtC
World Primary Energy DemandCumulative Exajoules (EJ) 2000-2100
Fossil w/o Capture & Storage
65%
Renewables 9%
Nuclear 4%
Fossil w/ Capture & Storage 1%
Biomass 7%
Exotics 5%Energy Use Reduction
9%
Figure A.23. Results for Beyond the Standard Suite for Low Emissions Constraint

A.34
Another observation is that, in the low-emissions-constraint CLC case, no CO2 capture and storage occurs. The main difference between this case and the corresponding baseline case is that there is more end-use reduction in the CLC. This occurs because, as just discussed, both end use and supply-side efficiency is assumed to be substantially higher in the CLC case than in the baseline case. The increased efficiency results in lower energy use even without the imposition of a GHG emissions constraint. Furthermore, terrestrial sequestration is assumed to contribute 60 GtC of carbon emissions reductions over the course of the century in all of the carbon constraint cases. Together, these changes lead to carbon emissions that are low enough to meet the low emissions constraint without the introduction of any CO2 capture and storage technologies.
A.3.3 The NEB Cases: Energy and CO2 Emissions
These cases illustrate a future in which the energy system transitions to a new backbone of nuclear fission and/or renewable energy. Figures A.16 through A.19 illustrate the four NEB cases. In these cases, an increase in market share for biomass, renewable energy, and nuclear energy, along with reductions in energy use, are accompanied by a peak and decline in fossil fuel use. While diminished in terms of relative market share, the energy contribution of fossil fuels, including fossil fuel use with and without CO2 capture and storage, at the end of the century in all of the NEB cases is comparable to or higher than today’s level in absolute terms (i.e., exajoules).(a) Also, fossil fuel use with CO2 capture and storage penetrates the market in all of the NEB cases except the low-emission-reduction case. However, the penetration rate is generally considerably lower than in the corresponding CLC cases. This is a function of the optimistic assumptions regarding nuclear and renewable energy technology improvements, and the less optimistic assumptions regarding fossil conversion efficiency and the availability and cost of CO2 capture and storage technology (see Table A.1).
A.3.4 The BSS Cases: Energy and CO2 Emissions
These cases illustrate a future in which new breakthrough technologies come to prominence in the energy system. Given the size of the global energy system, it is assumed that the standard suite of technologies, including energy efficiency, renewables, biomass, and fossil fuels will continue to play a dominant role in this future, and that highly advanced biotechnologies and “exotic” technologies, such as fusion energy, take many decades to penetrate the global energy system to a large scale. It is in the later half of the century that advanced biotechnology and exotics play a major role in the energy system. Such technologies compete most directly with higher priced renewable energy, biomass, nuclear, sequestration, and efficiency than against the lower cost traditional fossil energy system. The results are shown in Figures A.20 through A.23.
When comparing the four BSS to the four NEB cases, the results show that energy use reduction is generally higher in the BSS cases than in the NEB cases. In the BSS cases, the “exotic” technologies come on line later than the advanced nuclear and renewable technologies that are included in the NEB cases, and in general, the exotics are assumed to have a somewhat higher cost than the advanced
(a) In the very high emissions-constrained scenario, fossil fuel use is slightly lower than today’s level, but still
roughly comparable.

A.35
technologies in NEB cases. It is therefore relatively more costly to eliminate emissions from energy production in the BSS cases and more economically-efficient to reduce energy use. Therefore, more carbon emissions reductions are projected to occur from energy use reductions in the BSS cases than in the NEB cases.
When the cumulative energy patterns are compared, the “exotic” energy technologies in the BSS cases tend to replace nuclear and renewable energy instead of biomass-based energy. This occurs because exotics primarily participate in the electricity sector and not the transportation sector (given the assumptions in these cases). In these particular cases formulated for CCTP, biomass makes a relatively larger share of its contribution to the transportation sector than do renewable and nuclear energy. Hence, when exotics compete in the electricity sector in the BSS cases, they tend to take the place of renewable and nuclear supply technologies.
A.3.5 Emissions of Non-CO2 Greenhouse Gases
In the baseline cases, only currently-available technologies for reducing non-CO2 gases are assumed to be deployed, and they are deployed only when the cost of using them is lower than or equal to the equivalent value of carbon or if other economic drivers encourage their use.(a) These baseline projections of non-CO2 GHG emissions are shown in Figure A.24. As the carbon constraint increases from low to very high, the value of carbon increases and more mitigation of non-CO2 gases is projected to occur. The carbon constraints also affect the energy mix and affect levels of economic activity, and hence influence the non-CO2 GHGs. For instance, methane emissions from coal and natural gas production activities differ among the cases due to the cases’ different projections of energy supply patterns. In addition, the price of natural gas is higher as the carbon constraint becomes tighter, and this brings on the cost-effective recovery of methane emissions. Figure A.24 shows the GHGs in aggregate; the trends in the individual gases are shown in Figure A.25 for one of the cases (the high carbon-constrained baseline case).
Unlike the three different sets of assumptions about advanced energy technologies in the twelve illustrative advanced technology cases, there is only one set of assumptions about advanced technology for mitigation of non-CO2 GHGs, which is used across all illustrative advanced technology cases. This set of assumptions, which was shown in Table A.2, was provided to PNNL by EPA. These advanced technologies are not currently developed or on the market, but are assumed to be developed and deployed
(a) For this analysis, the MiniCAM projected the value of carbon (based on the carbon constraints and other
assumptions about technology) . Based on this value of carbon, the model projected that all non-CO2 GHG reductions that would cost less than or equal to, on a carbon equivalent basis, the value of carbon would be implemented. The costs curves for non-CO2 emission reductions in the model do not reflect significant increases in technology advancement. The cost of carbon varies among scenarios based on the level of carbon constraint and the assumptions about various technology costs, therefore the amount of other gases that are cost effective will vary among scenarios. In addition to reductions driven by the value of carbon, reductions in methane emissions are also driven by the cost of natural gas projected by the model. As the price increases, more methane emissions will be captured for the purpose of selling the captured methane. Differences in the energy mix among scenarios also result in differences in methane emissions from coal and natural gas production.

A.36
0.0
0.5
1.0
1.5
2.0
2.5
3.0
3.5
4.0
1990 2005 2020 2035 2050 2065 2080 2095
Car
bo
n E
qu
ival
ent E
mis
sio
ns
(GtC
/yr)
Low Emissions Constraint
Medium Emissions Constraint
High Emissions Constraint
Very High Emissions Constraint
Reference Case
Figure A.24. World Emissions of Non-CO2 Greenhouse Gases in the Baseline Cases
0.0
0.5
1.0
1.5
2.0
2.5
3.0
3.5
1990 2005 2020 2035 2050 2065 2080 2095
Year
Car
bo
n E
qu
ival
ent E
mis
sio
ns
(GtC
/yr)
CF4
C2F6
SF6
HFC-143a
HFC125(227ea)
HFC-134a
HFC-245fa
N2O
CH4
Figure A.25. World Emissions of Non-CO2 Greenhouse Gases in the High Emissions-Constrained Baseline Case
A.37
in all of the illustrative advanced technology cases. For each of the twelve illustrative advanced technology cases, the percentage reductions shown in Table A.2 were applied to the projected emissions for each source category and gas.(a) While the reduction parameters are constant across all cases, non-CO2 GHG emissions vary among cases because of differences in the total energy use, fuel mix, economic activity and other emission drivers. The non-CO2 GHG emissions results of the illustrative advanced technology cases are shown in Figures A.26 through A.28. More detail on the individual gases is shown for one case: the NEB Very High Carbon-Constrained Case (Figure A.29).
A.3.6 Economic Analysis of the Cases
This section examines the cost of reducing CO2 emissions under the four baseline and the twelve illustrative advanced technology cases.(b) The costs presented here are based on the long-term cost curves associated with the technologies built into the MiniCAM model and on simplifying assumptions (see Table A.1) about how the cost curves might shift as a result of technology advancement. The absolute values of the costs must be viewed with some caution, like the results of any long-term energy-economic model, the general trends and comparisons among cases provide useful insights.
Table A.3 presents the annual costs (in real 2004 dollars) of achieving the different levels of emission reductions in selected years, along with the present value of the sum of discounted annual costs over the entire 100-year time period. (Costs before 2035 are minimal because, based on the assumed carbon constraints, most of the CO2 emissions reductions needed to meet the constraints occur after 2035.(c)) The cumulative CO2 emission reductions for the different cases are approximately equal to: 800GtC for the very high emission constraint cases, 500GtC for the high emissions constraint cases, 300GtC for the medium emissions constraint cases, and 200GtC for the low emissions constraint cases.(d) The costs are shown for both the four baseline cases and the twelve advanced technology cases.(e) The present values of the costs are shown for two discount rates – 5% and 2%. Because these highest annual mitigation costs occur toward the end of the century, the discount rate chosen for the present value calculation strongly affects the resulting present value. Presenting two discount rates allows for a better understanding of the impact of different perceptions of the importance of costs incurred in the near term relative to those incurred in the long term.
(a) Adjustments were made to account for the emission reductions driven by the value of carbon, so that these were
not double counted. (b) Note that the cost numbers presented in this section are associated only with the CO2 reductions; they do not
include any costs for reductions in non-CO2 GHGs. (c) In the advanced technology scenarios, emissions begin their decline from the Reference Case before 2035, but
these reductions are not assumed to incur any cost because they are a result of improved technology performance that is independent of the emissions constraints. The costs presented here only assume costs are incurred once emissions are actually constrained by the imposed emissions trajectory.
(d) The exact emissions reductions vary slightly among the advanced technology scenarios. They are sometimes slightly more than the values cited here for the reasons described in the previous footnote.
(e) Note: The cost reductions do not consider the cost associated with performing any R&D that might be necessary to achieve the improved technology performance.

A.38
0
0.5
1
1.5
2
2.5
3
3.5
4
1990 2005 2020 2035 2050 2065 2080 2095 2100
Non
-CO
2 G
HG
Em
issi
ons
per
Yea
r G
tC/y
r
BaselineCLC LowCLC MediumCLC HighCLC Very High
Figure A.26. World Emissions of Non-CO2 GHGs for Closing the Loop on Carbon
0
0.5
1
1.5
2
2.5
3
3.5
4
1990 2005 2020 2035 2050 2065 2080 2095 2100
Non-C
O2
GH
G E
mis
sions
per
Yea
r G
tC/y
r
BaselineNEB LowNEB MediumNEB HighNEB Very High
Figure A.27. World Emissions of Non-CO2 GHGs for A New Energy Backbone

A.39
0
0.5
1
1.5
2
2.5
3
3.5
4
1990 2005 2020 2035 2050 2065 2080 2095 2100
Non
-CO
2 G
HG
Em
issi
ons
per
Yea
r G
tC/y
r
BaselineBSS LowBSS MediumBSS HighBSS Very High
Figure A.28. World Emissions of Non-CO2 GHGs for Beyond the Standard Suite
-
0.50
1.00
1.50
2.00
2.50
3.00
1990 2005 2020 2035 2050 2065 2080 2095 2100
Em
issi
ons
in G
igat
onne
Car
bon e
q./Y
ear
CF4
C2F6
SF6
HFC143a
HFC125(227)
HFC134a
HFC245fa
N2O
CH4
Figure A.29. World Emissions of Non-CO2 Greenhouse Gases under A New Energy Backbone, Very High Emissions-Constrained Case
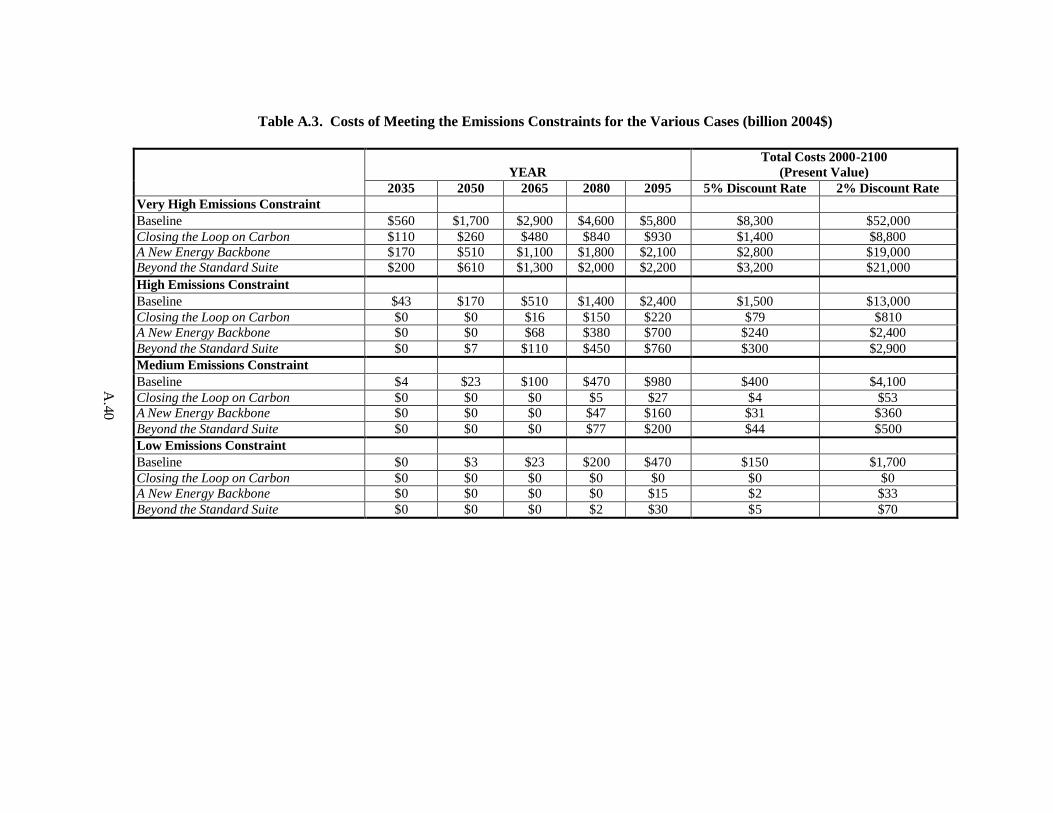
A.40
Table A.3. Costs of Meeting the Emissions Constraints for the Various Cases (billion 2004$)
YEAR Total Costs 2000-2100
(Present Value) 2035 2050 2065 2080 2095 5% Discount Rate 2% Discount Rate
Very High Emissions Constraint Baseline $560 $1,700 $2,900 $4,600 $5,800 $8,300 $52,000 Closing the Loop on Carbon $110 $260 $480 $840 $930 $1,400 $8,800 A New Energy Backbone $170 $510 $1,100 $1,800 $2,100 $2,800 $19,000 Beyond the Standard Suite $200 $610 $1,300 $2,000 $2,200 $3,200 $21,000 High Emissions Constraint Baseline $43 $170 $510 $1,400 $2,400 $1,500 $13,000 Closing the Loop on Carbon $0 $0 $16 $150 $220 $79 $810 A New Energy Backbone $0 $0 $68 $380 $700 $240 $2,400 Beyond the Standard Suite $0 $7 $110 $450 $760 $300 $2,900 Medium Emissions Constraint Baseline $4 $23 $100 $470 $980 $400 $4,100 Closing the Loop on Carbon $0 $0 $0 $5 $27 $4 $53 A New Energy Backbone $0 $0 $0 $47 $160 $31 $360 Beyond the Standard Suite $0 $0 $0 $77 $200 $44 $500 Low Emissions Constraint Baseline $0 $3 $23 $200 $470 $150 $1,700 Closing the Loop on Carbon $0 $0 $0 $0 $0 $0 $0 A New Energy Backbone $0 $0 $0 $0 $15 $2 $33 Beyond the Standard Suite $0 $0 $0 $2 $30 $5 $70

A.41
As expected, both the annual costs and the present value of the cumulative costs are highest in the baseline case under the very high emissions-constrained case, for which the present value of the stream of annual costs ranges from $8 trillion to $52 trillion, depending on the discount rate (5% versus 2%). The annual costs and the present value of the cumulative costs decrease as emissions become less constrained. For instance, in the medium emissions-constrained case, the present value of the costs ranges from about $400 million to $4.1 trillion under the baseline technology assumptions.
Under each emission reduction case, the cost of achieving the hypothetical carbon constraint is significantly lower in the advanced technology cases compared to the baseline cases. Table A.4 shows the percentage reduction in costs achieved by the advanced technology cases, compared to the baselines. The sets of assumptions behind these advanced technology cases are only three possibilities among a multitude that could have been used, so the costs presented should be viewed as illustrative. A variety of sets of technological developments might lead to stabilization at minimal cost. If emissions must be constrained in the future to meet UNFCCC goals, the degree and manner in which technologies advance will play a big role in determining future energy patterns and costs.
A.4 References
Intergovernmental Panel on Climate Change (IPCC). 2000. Special Report on Emissions Scenarios. Cambridge University Press, Cambridge. Intergovernmental Panel on Climate Change (IPCC). 2001. Climate Change 2001: The Scientific Basis. Cambridge University Press, Cambridge, UK.
Wigley T, R Richels, and J Edmonds. 1996. “Economic and Environmental Choices in the Stabilization of Atmospheric CO2 Concentrations.” Nature, Volume 379, Number 6562, pp. 240-243.
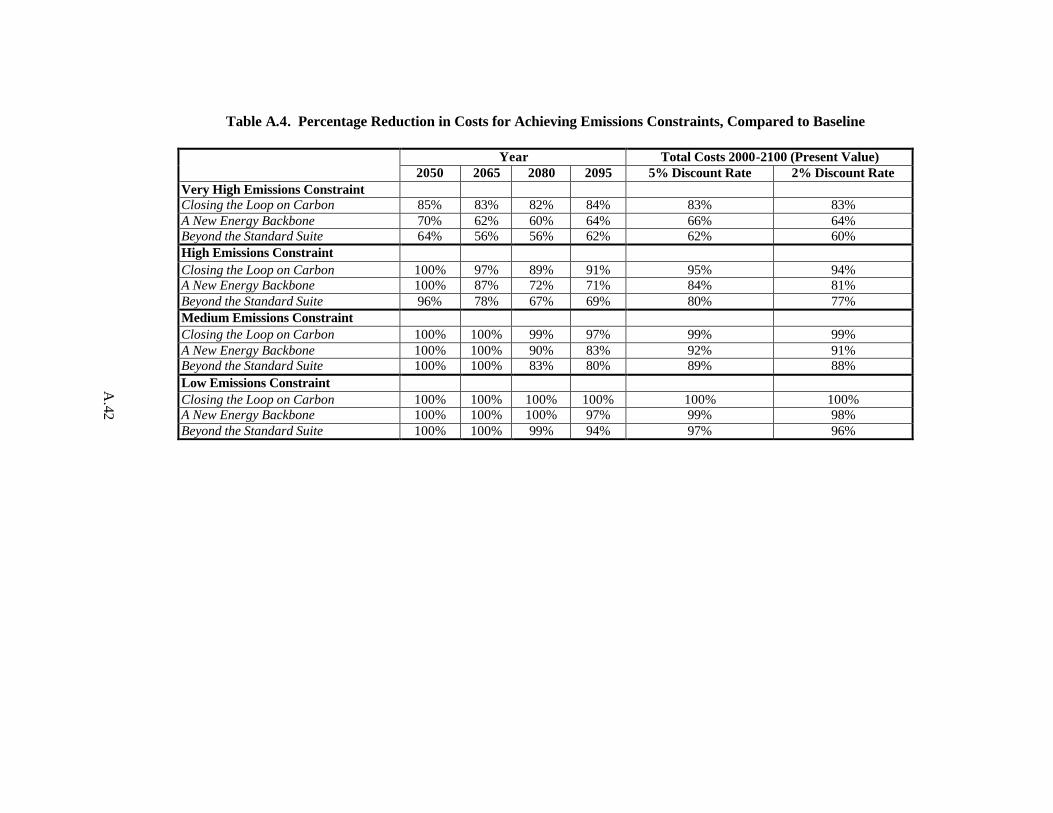
A.42
Table A.4. Percentage Reduction in Costs for Achieving Emissions Constraints, Compared to Baseline
Year Total Costs 2000-2100 (Present Value) 2050 2065 2080 2095 5% Discount Rate 2% Discount Rate
Very High Emissions Constraint Closing the Loop on Carbon 85% 83% 82% 84% 83% 83% A New Energy Backbone 70% 62% 60% 64% 66% 64% Beyond the Standard Suite 64% 56% 56% 62% 62% 60% High Emissions Constraint Closing the Loop on Carbon 100% 97% 89% 91% 95% 94% A New Energy Backbone 100% 87% 72% 71% 84% 81% Beyond the Standard Suite 96% 78% 67% 69% 80% 77% Medium Emissions Constraint Closing the Loop on Carbon 100% 100% 99% 97% 99% 99% A New Energy Backbone 100% 100% 90% 83% 92% 91% Beyond the Standard Suite 100% 100% 83% 80% 89% 88% Low Emissions Constraint Closing the Loop on Carbon 100% 100% 100% 100% 100% 100% A New Energy Backbone 100% 100% 100% 97% 99% 98% Beyond the Standard Suite 100% 100% 99% 94% 97% 96%