climate change impact assessment on hydrological regime of kali gandaki basin
TRANSCRIPT

Climate change impact assessment on
hydrological regime of Kali Gandaki
basin in Nepal using RCP scenarios
Ajay Ratna Bajracharya
Sagar Ratna Bajracharya
Arun Bhakta Shrestha
8th Nepal Geological Congress
Geoscience in National Development and Disaster Management
November 27-29, 2016
Kathmandu, Nepal

Study Area
Sub-basin of Narayani basin
Total Area 11,830 sq km
Elevation 188 m to 8143 m
14 Rainfall Stations
9 Temperature Stations
1 Hydrological stations
Kali Gandaki Basin
Fig 1 Location map of Kali Gandaki basin of Nepal (left) and Spatial distribution of Hydrological, Precipitation
and Temperature Stations (Right)

Data Description Source
Hydro-meteorological data of Kali
Gandaki basin
Department of Hydrology and Meteorology,
Nepal
Land use/ cover data European Space Agency (ESA), 300 m
Digital Elevation Model (DEM) Shuttle Radar Topography Mission (SRTM) DEM
(90 m), NASA
Soil Data Soil and Terrain Database Programme (SOTER),
FAO, 1:1 million scale
Future Projected Climate Data Lutz et al ( 2016), 10km X 10km (IGB)
Table 1 Data Sources and Type used in study
Data Collection

Data collection
0
20
40
60
80
100
0 2000 4000 6000 8000
% A
rea
Bel
ow
Ele
vat
ion
Elevation (m)
Fig 2 DEM, Land Use
and Soil map for Kali
Gandaki basin used in
SWAT model

Methodology
Table 2 Ensemble of GCM runs with projected change in
mean temperature and precipitation during 2090s for IGB
basin (Lutz et al., 2016).
Fig 3 Mean annual precipitation and mean
temperature from 1981-2010 for IGB basin
(Lutz et al., 2016)
Climate Change Analysis

Methodology
Projection WGS 84 UTM Zone 45N (EPSG: 32645)
Extent xmin: -1600000 ymin: 2300000
xmax: 160000 ymax: 420000
Spatial resolution 10000 x 10000 meter
Temporal resolution Daily Time step, 1 Jan 2011 - 31 Dec 2100
Variables and units prec Daily precipitation sum mm
tavg Daily mean air temperature °C
tmax Daily maximum air temperature °C
tmin Daily minimum air temperature °C
Data format Netcdf (1 file per year and per variable per GCM)
Table 3 Total IGB dataset (Lutz et al., 2016)
Climate Change Analysis

Methodology
Model Interface: ArcSWAT 2012
Total Year of Study: 1995 - 2004
Warm up period: 1997 – 1999 (3 years)
Calibration Period: 2000 - 2004 (5 years)
Validation Period: 1995 – 1999 (5 years)
Time Step: Daily Average
Model Evaluation: Statistical Evaluation
(NSE, PBIAS, R2, RSR)
Hydrological Modeling (SWAT)
Model Setup
Fig 4 Sub-basins delineated from SWAT model

Methodology
Hydrological Modeling (SWAT)
• Semi distributed hydrological model
• Computationally efficient and capable of simulating long periods
• Suitable for modeling of ungauged catchment
Statistical Evaluation Criteria Equation
Nash and Sutcliffe Efficiency (NSE) NSE = 1 - 𝑖=1
𝑛 (𝑄𝑖−𝑄𝑖′)2
𝑖=1𝑛 (𝑄𝑖− 𝑄𝑖)
2
Coefficient of Determination (R2) R2= 𝑛 𝑥𝑦− 𝑥 𝑦
𝑛( 𝑥2)−( 𝑥)2 × 𝑛( 𝑦2)−( 𝑦)2
Percent bias (PBIAS) PBIAS = 𝑖
𝑛 𝑌𝑖𝑜𝑏𝑠−𝑌𝑖𝑠𝑖𝑚 ∗100
𝑖𝑛 𝑌𝑖𝑜𝑏𝑠
RMSE Observations standard deviation
ratio (RSR) RSR = 𝑅𝑀𝑆𝐸
𝑆𝑇𝐷𝐸𝑉𝑜𝑏𝑠 = 𝑖=1
𝑛 (𝑌𝑖𝑜𝑏𝑠−𝑌𝑖𝑠𝑖𝑚)2
𝑖=1𝑛 (𝑌𝑖𝑜𝑏𝑠−𝑌𝑚𝑒𝑎𝑛)2
Table 4 Evaluation of SWAT model
Model Setup
Future Timeline
2030s (2011 – 2040)
2060s (2041 – 2070)
2090s (2071 – 2100)
Results and Discussion
-6
-4
-2
0
2
4
6
8
10
12
∆T
max
(C
)
2090s RCP 4.5
inmcm4 BNU-ESMCMCC CMS CSIRO-Mk3-6-0
-6
-4
-2
0
2
4
6
8
10
12∆
Tm
ax (C
)
2090s RCP 8.5
inmcm4 bcc-csm1-1CMCC CMS CanEsm2
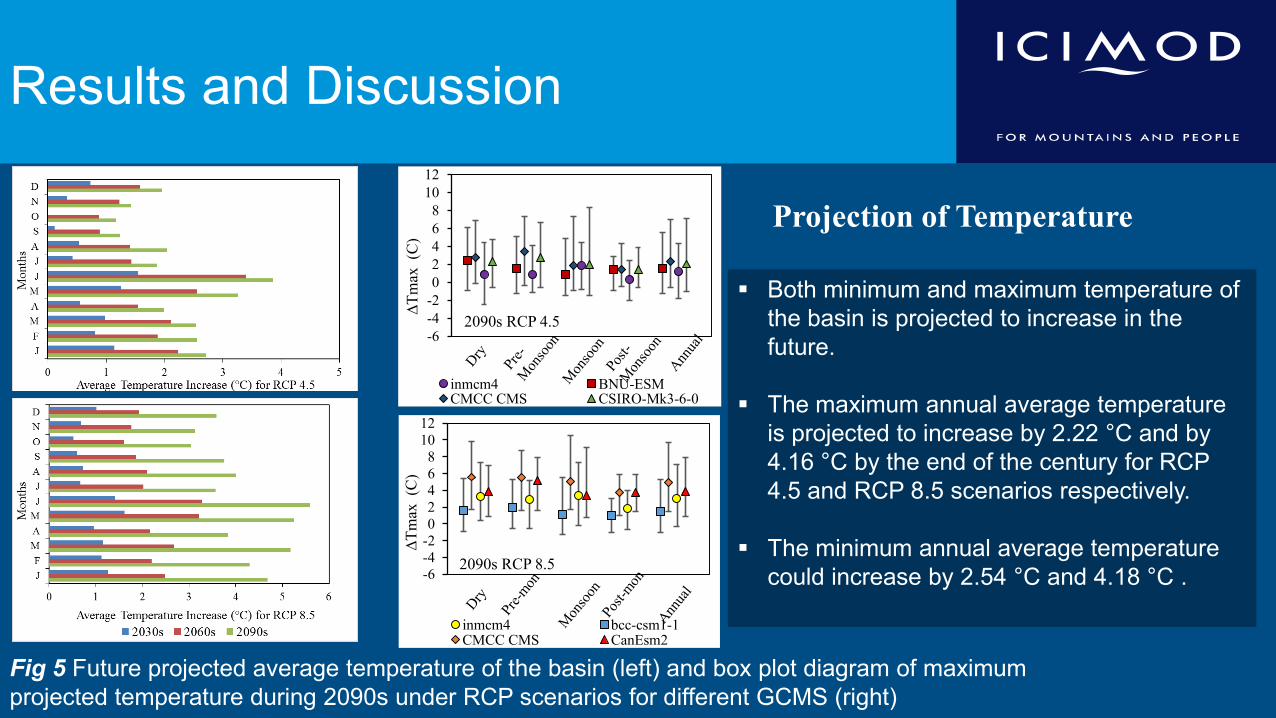
Projection of Temperature
Both minimum and maximum temperature of
the basin is projected to increase in the
future.
The maximum annual average temperature
is projected to increase by 2.22 °C and by
4.16 °C by the end of the century for RCP
4.5 and RCP 8.5 scenarios respectively.
The minimum annual average temperature
could increase by 2.54 °C and 4.18 °C .
Fig 5 Future projected average temperature of the basin (left) and box plot diagram of maximum
projected temperature during 2090s under RCP scenarios for different GCMS (right)

Results and Discussion
Projection of Precipitation
Precipitation is projected to increase for all seasons, timelines (2030s,
2060s, 2090s) and scenarios (RCP 4.5 and RCP 8.5).
Large Difference in precipitation between wet and dry seasons could be
projected.
The difference is even more pronounced in case of RCP 8.5 scenario
during 2090s.
The average annual precipitation of Kali Gandaki basin is projected to
increase maximum by 19.67% during 2090s under RCP 4.5 scenario.
Under RCP 8.5 scenario, the maximum increase in average annual
precipitation is projected to occur during 2090s, by 26.14%
Fig 6 Future projected average precipitation of Kali Gandaki basin under RCP scenarios

Results and Discussion
0
2000
4000
6000
Jan-00 Dec-00 Dec-01 Dec-02 Dec-03 Dec-04
Dis
char
ge
(m3
/s)
0
2000
4000
6000
8000
Jan-95 Jan-96 Dec-96 Dec-97 Dec-98 Dec-99
Dis
char
ge
(m3
/s)
Simulated Observed
Parameter Value
NSE 0.78
PBIAS -4.01%
R2 0.78
RSR 0.52
Parameter Value
NSE 0.8
PBIAS 9.6%
R2 0.82
RSR 0.49
Calibration and Validation
Fig 7 Calibration (2000-2004) and Validation (1995-1999) of SWAT
model at the outlet of Kali Gandaki basin
Table 5 Model performance during calibration (2000-2004)
Table 6 Model performance during validation (1995-1999)

Results and Discussion
Impact on Water Balance (RCP 4.5)
Fig 8 Seasonal separation of
climate change impacts on key
water balance components of
Kali Gandaki basin during
2030s, 2060s and 2090s
under RCP 4.5 scenarios
Figure 8 shows significant impact on seasonal
water balance components leading to increase
in precipitation, snowmelt, evapotranspiration
and water yield for future period.
In terms of percentage change, snowmelt of
the basin is mostly affected by increase in
precipitation and temperature.
Snowmelt is maximum during the monsoon
season for all timelines for RCP 4.5 scenario.
Increase in snowmelt could be projected to
increase more than 80% during 2090s under
RCP 4.5 scenario

Results and Discussion
Fig 9 Seasonal separation of
climate change impacts on
key water balance
components of Kali Gandaki
basin during 2030s, 2060s
and 2090s under RCP 8.5
scenarios
Impact on Water Balance (RCP 8.5)
Snowmelt is also the most affected
component of water balance under RCP 8.5
scenarios during the future period.
Both winter and monsoon precipitation are
projected to increase, which could be
observed maximum during 2090s under RCP
8.5 scenario.
The seasonal change in evapotranspiration
ranges from 1% to 29%.
Increase in water yield is maximum during
the dry season, and is expected to increase
more than 50% during 2090s under RCP 8.5
scenario.

Results and Discussion
0
500
1000
1500
2000
2500
3000
Precip Snowmelt PET ET SurQ Wyield
Un
it (
mm
)
RCP 4.5
0
500
1000
1500
2000
2500
3000
Precip Snowmelt PET ET SurQ Wyield
Un
it (
mm
)
Water Balance ComponentsHistorical 2030s 2060s 2090s
RCP 8.5
Compared to 1980s, The average annual precipitation of
Kali Gandaki basin is projected to increase maximum by
19.67% during 2090s under RCP 4.5 scenario.
Snowmelt is projected to be maximum during 2090s
under RCP 8.5 scenario, and is expected to increase
more than 80%.
Annual average evapotransipiration is projected to
increase by 6.9% and 14.3% during 2090s under RCP
4.5 and RCP 8.5 scenario respectively.
Maximum increase in water yield could be observed
during 2090s by 41% and 51% under RCP 4.5 and RCP
8.5 scenario respectively.
Fig 10 climate change impacts on annual average water balance components of
Kali Gandaki basin during 2030s, 2060s and 2090s under RCP scenarios
Impact on Water Balance

Results and Discussion
The percentage increase in discharge at
the outlet of Kali Gandaki basin is
projected to be maximum during the pre-
monsoon season under RCP 4.5 scenario.
The percentage increase in discharge at
the outlet of Kali Gandaki basin is
projected to be maximum during monsoon
season under RCP 8.5 scenario.
Maximum increase in discharge could be
observed during 2090s by 41% and more
than 50% under RCP 4.5 and RCP 8.5
scenario respectively.
Impact on DischargeRCP 4.5
RCP 8.5
Fig 11 Impact of climate change on discharge of Kali Gandaki basin
during 2030s, 2060s and 2090s under RCP scenarios
RCP 4.5
RCP 8.5

Fig 12 Spatial distribution of historical and future projected
change in snowmelt (mm) Kali Gandaki basin for RCP 4.5
scenario
The spatial distribution of snowmelt shows minimum
or no snowmelt at lower elevations and are not
affected by climate change.
Snowmelt is maximum at the higher elevation sub-
basins and is expected to increase in the future.
Maximum increase in snowmelt up to 30 mm at higher
elevation could be projected during 2090s under RCP
4.5 scenario
Impact on Snowmelt (RCP 4.5)
Results and Discussion

Fig 13 Spatial distribution of historical and future projected
change in snowmelt (mm) of Kali Gandaki basin for RCP
8.5 scenario
Lower basin shows minimum effect of climate change
on snowmelt under RCP 8.5 scenario
Significant increase in snowmelt could be observed
during the future scenarios for individual sub-basins
Maximum increase in snowmelt ranging from 20 mm to
30 mm could be projected in the upper basins and
mid-basins.
Impact on Snowmelt (RCP 8.5)
Results and Discussion

Fig 14 Spatial distribution of future
projected change in Evapotranspiration
(%) of Kali Gandaki basin for RCP 4.5
(top) and RCP 8.5 scenario (bottom)
Increase in temperature is
projected to increaser the
evapotranspiration of the basin.
Increase in evapotranspiration is
higher at upper and mid- basins
during 2090s ranging from 10%
to 15% increase under RCP 4.5
scenario and from 25% to 40%
under RCP 8.5 scenario.
Impact on Evapotranspiration
Results and Discussion

Results and Discussion
Impact on Water Yield
Fig 15 Spatial distribution of future
projected change in Water Yield (%)
of Kali Gandaki basin for RCP 4.5
(top) and RCP 8.5 scenario (bottom)
Increase in water yield is
relatively higher at the upper
and mid basins.
The water yield is expected to
increase by no more than 30%
at lower basins during future
period.
Maximum increase in water yield
could be observed at upper
basin ranging from 60% to
100%.

Conclusions
Both temperature and precipitation of Kali Gandaki is projected to increase affecting the annual
averaged water balance components of the basin.
Large Difference in precipitation between wet and dry seasons could be projected.
Maximum increase in discharge could be observed during 2090s by 41% and more than 50%
under RCP 4.5 and RCP 8.5 scenario respectively.
The water balance component of the upper and mid-basin are largely affected compared to lower
basins.
In terms of percentage change, snowmelt of the basin is mostly affected by increase in
precipitation and temperature. Average annual snowmelt is projected to increase more than 80%
during 2090s.

THANK YOU !!!!
Dr. Arun Bhakta Shrestha
Regional Programme Manager
River Basin Management
Ajay Ratna Bajracharya
Water Resources Modeler-SSA
Water and Air
Acknowledgement: This work was carried out by the Himalayan Adaptation, Water and Resilience
(HI-AWARE) consortium under the Collaborative Adaptation Research Initiative in Africa and Asia
(CARIAA) with financial support from the UK Government’s Department for International
Development and the International Development Research Centre, Ottawa, Canada.
Sagar Ratna Bajracharya
Hydrometeorological Analyst
Water and Air