climate and weather impacts on agriculture: … and weather impacts on agriculture: the case of...
TRANSCRIPT
Climate and Weather Impacts on Agriculture: The Case of Brazil
Paula Carvalho Pereda
Denisard C. O. Alves
RSA Global Conference Brazil
Fortaleza - 29th April 2014

Outline
1. Introduction
2. Methodology
3. Climate Change and Brazilian Agriculture
4. Extreme Weather Events’ Impact on Agriculture
5. Policy Discussion
6. Future research and limitations
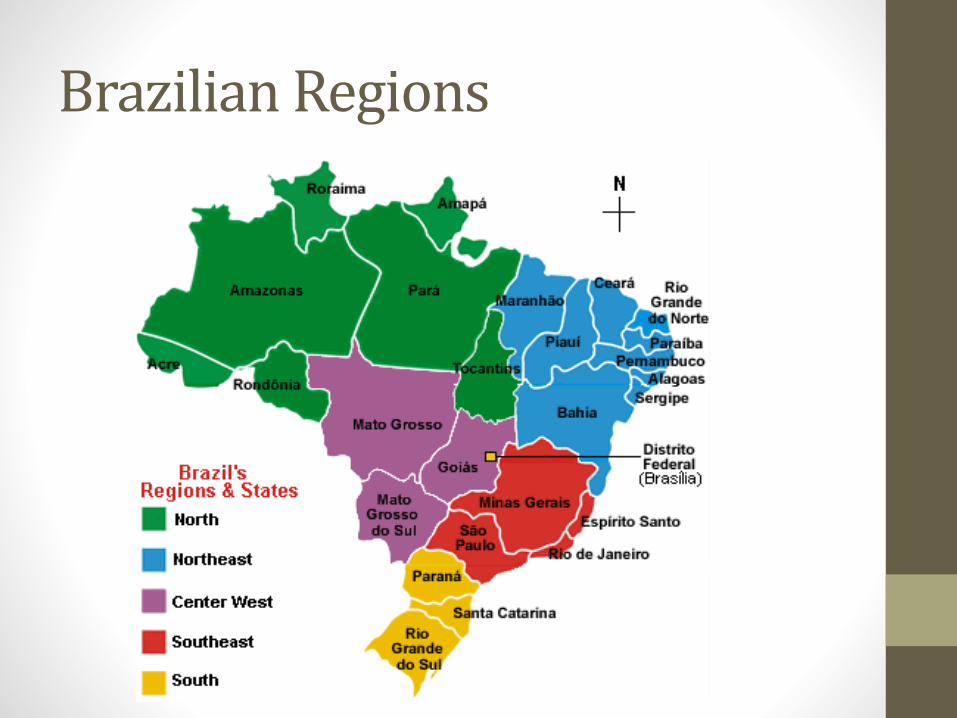
Brazilian Regions

Introduction: Motivation
• Brazil is one of the main grain producers and exporter.
• No. 1: Sugar, Coffee, beef, tobacco, timber
• No.2: Soybeans,
• No. 3: Corn/Maize
• The country has large climate variability.
• This article focuses on the measurement of specific climate effects on agriculture.
• Climate is an important factor influencing agricultural production.
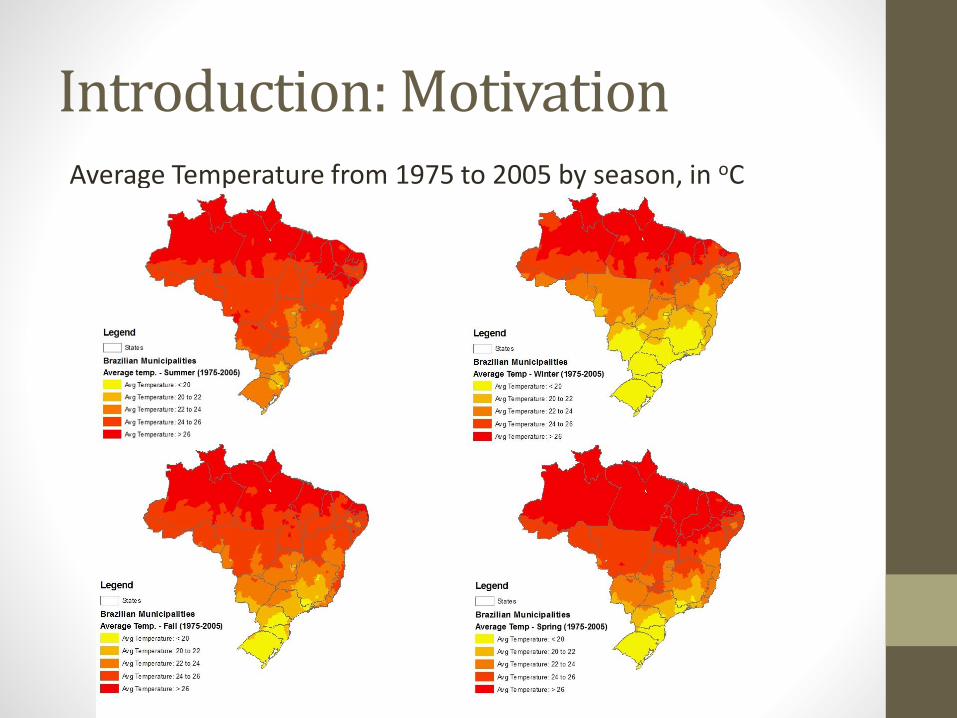
Introduction: MotivationAverage Temperature from 1975 to 2005 by season, in oC
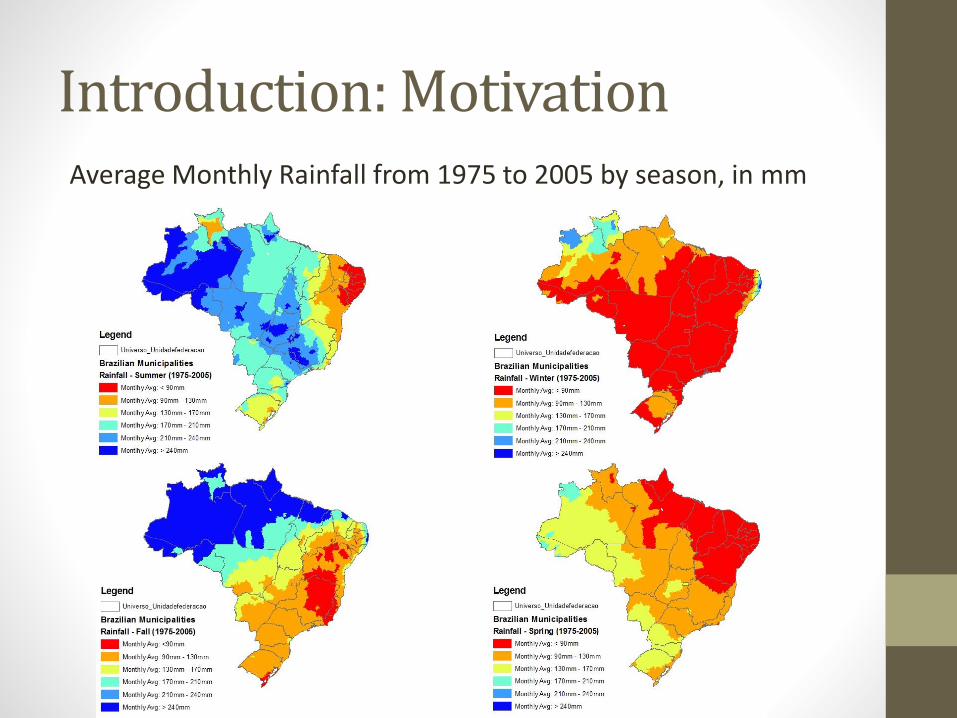
Introduction: MotivationAverage Monthly Rainfall from 1975 to 2005 by season, in mm
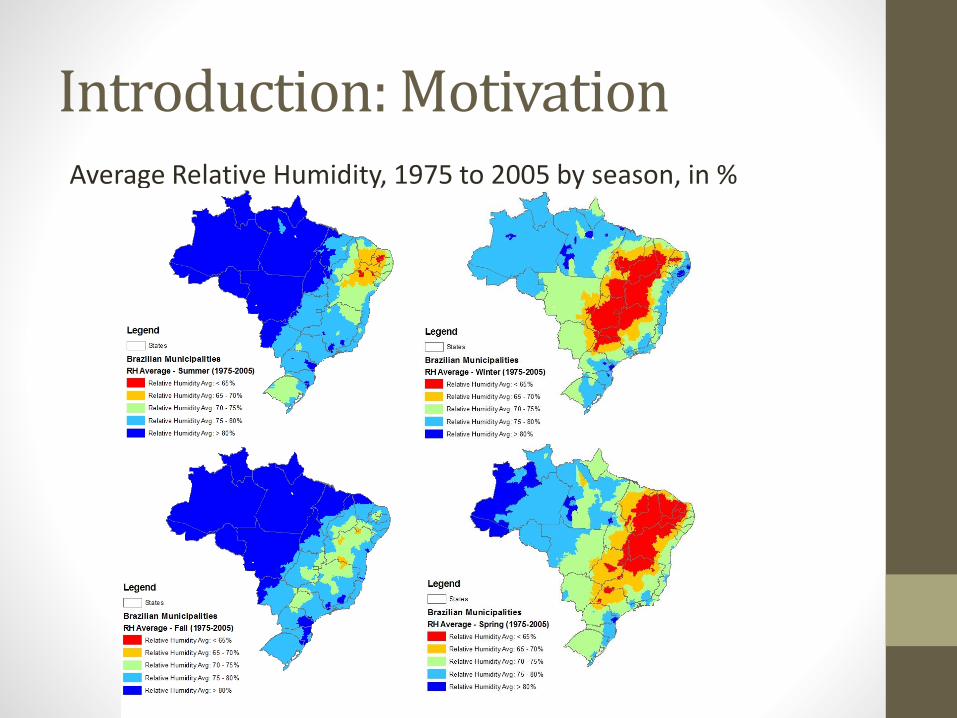
Introduction: MotivationAverage Relative Humidity, 1975 to 2005 by season, in %

Introduction: Motivation
Climate/Weather has important impacts on agricultural activities:
Climate might be a direct input for crop and animal production:
• planning decision of producers
• land use configuration
Climate can be a determinant of crop/livestock failure/loss of productivity:
• RS and SC states calculated US$ 480 million of losses due to droughts in the summer of 2012 (maize, dairy products and beans)
• soybean production in South America fell 3% due to adverse weather in 2012
• contribute to the existence of rural poverty
Introduction: Motivation
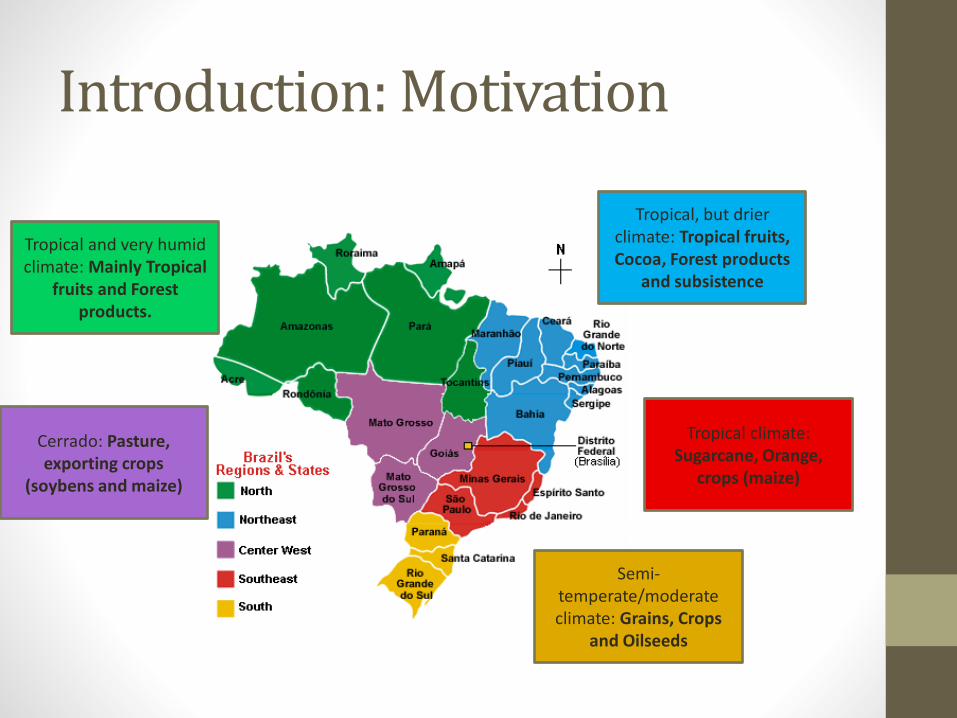
Semi-temperate/moderateclimate: Grains, Crops
and Oilseeds
Tropical, but drierclimate: Tropical fruits, Cocoa, Forest products
and subsistence
Tropical climate: Sugarcane, Orange,
crops (maize)
Cerrado: Pasture, exporting crops
(soybens and maize)
Tropical and very humidclimate: Mainly Tropical
fruits and Forest products.
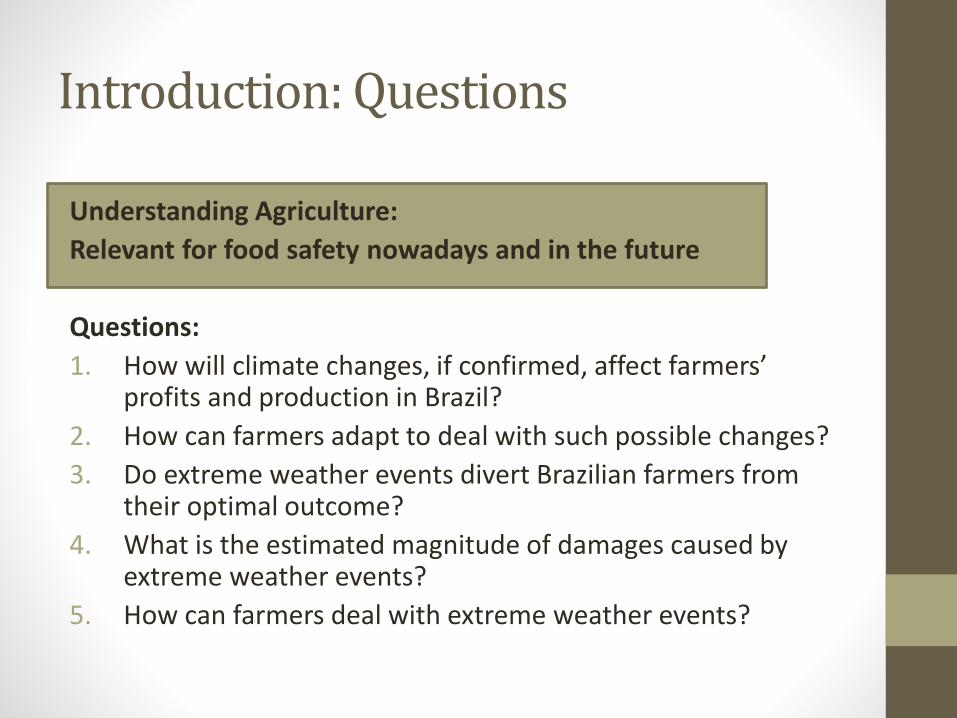
Introduction: Questions
Understanding Agriculture:
Relevant for food safety nowadays and in the future
Questions:
1. How will climate changes, if confirmed, affect farmers’ profits and production in Brazil?
2. How can farmers adapt to deal with such possible changes?
3. Do extreme weather events divert Brazilian farmers from their optimal outcome?
4. What is the estimated magnitude of damages caused by extreme weather events?
5. How can farmers deal with extreme weather events?

Methodology
Main hypotheses:
I. Farmers observe the average climate of the region and use this information to decide production (optimally): Suggesting a producer theory approach (microeconomics)
II. Deviations from the average climate (such as extreme events) might deviate farmers from their above mentioned optimal choices: Suggesting the inclusion of an efficiency analysis inside the producer theory approach (market failure)
Methodology
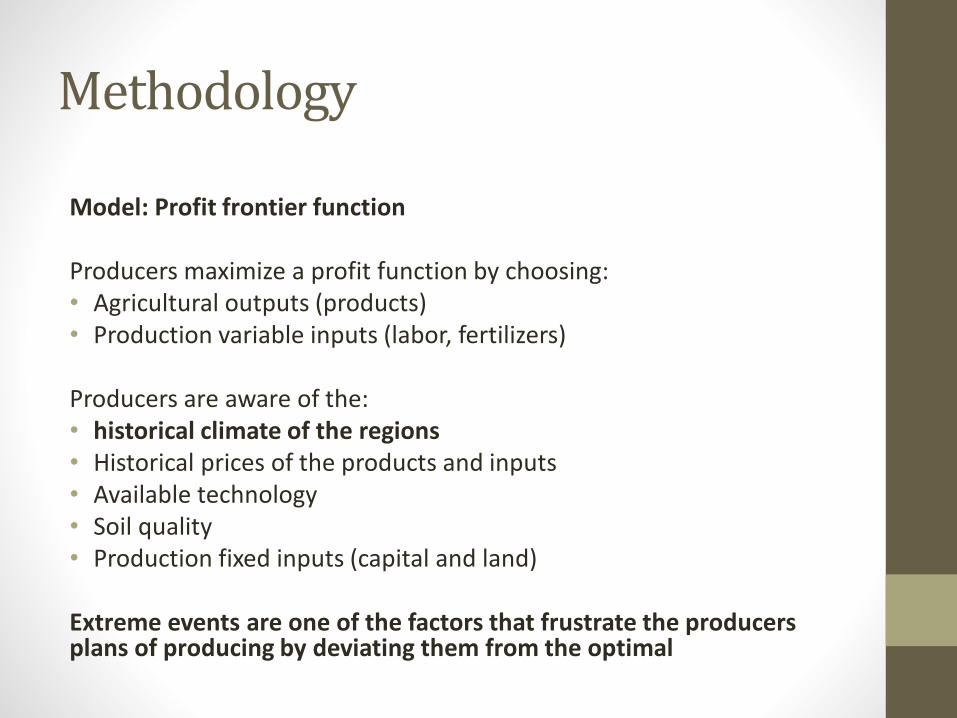
Model: Profit frontier function
Producers maximize a profit function by choosing:• Agricultural outputs (products) • Production variable inputs (labor, fertilizers)
Producers are aware of the:• historical climate of the regions • Historical prices of the products and inputs• Available technology• Soil quality• Production fixed inputs (capital and land)
Extreme events are one of the factors that frustrate the producers plans of producing by deviating them from the optimal
Methodology
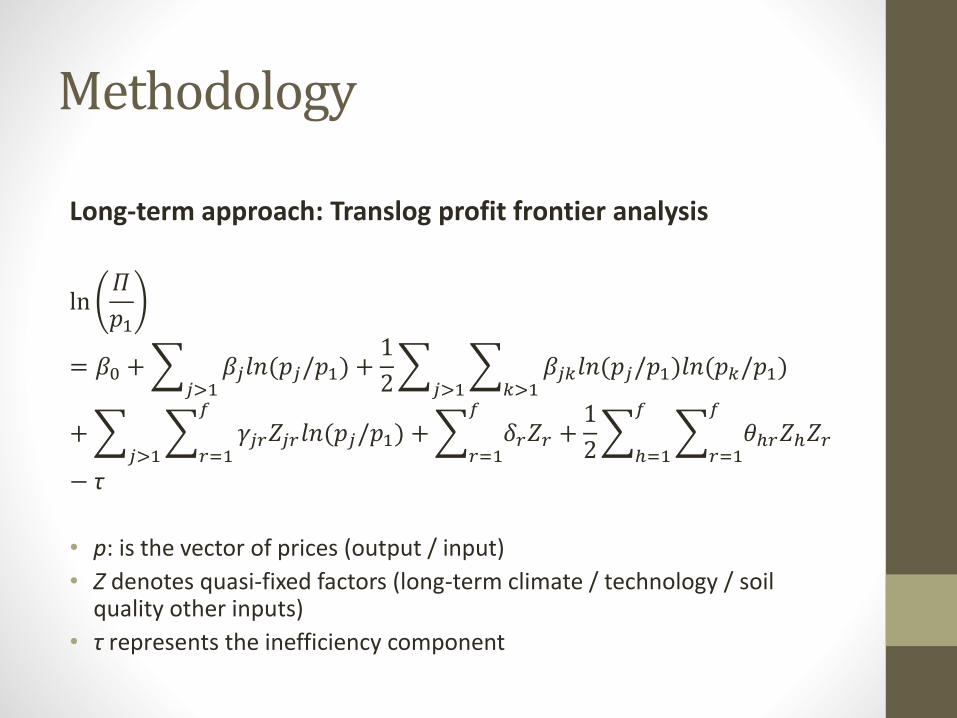
Long-term approach: Translog profit frontier analysis
ln𝛱
𝑝1
= 𝛽0 + 𝑗>1𝛽𝑗𝑙𝑛(𝑝𝑗/𝑝1) +
1
2 𝑗>1 𝑘>1𝛽𝑗𝑘𝑙𝑛(𝑝𝑗/𝑝1)𝑙𝑛(𝑝𝑘/𝑝1)
+ 𝑗>1 𝑟=1
𝑓
𝛾𝑗𝑟𝑍𝑗𝑟𝑙𝑛(𝑝𝑗/𝑝1) + 𝑟=1
𝑓
𝛿𝑟𝑍𝑟 +1
2 ℎ=1
𝑓
𝑟=1
𝑓
𝜃ℎ𝑟𝑍ℎ𝑍𝑟
− τ
• p: is the vector of prices (output / input)
• Z denotes quasi-fixed factors (long-term climate / technology / soil quality other inputs)
• τ represents the inefficiency component
Methodology
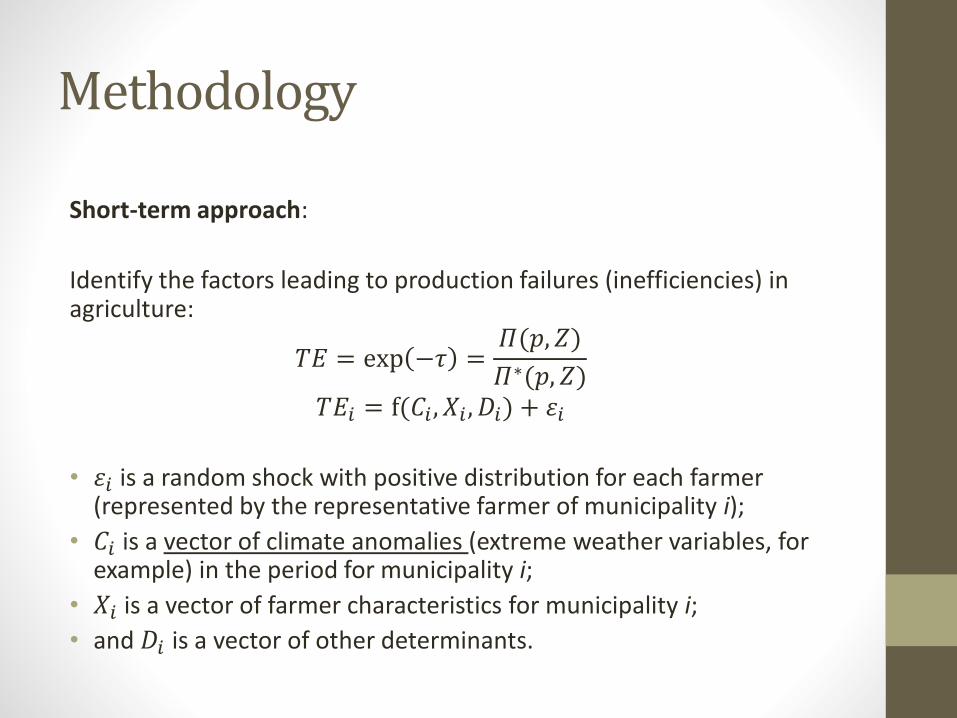
Short-term approach:
Identify the factors leading to production failures (inefficiencies) in agriculture:
𝑇𝐸 = exp −𝜏 =𝛱(𝑝, 𝑍)
𝛱∗(𝑝, 𝑍)𝑇𝐸𝑖 = f(𝐶𝑖 , 𝑋𝑖 , 𝐷𝑖) + 휀𝑖
• 휀𝑖 is a random shock with positive distribution for each farmer (represented by the representative farmer of municipality i);
• 𝐶𝑖 is a vector of climate anomalies (extreme weather variables, for example) in the period for municipality i;
• 𝑋𝑖 is a vector of farmer characteristics for municipality i;
• and 𝐷𝑖 is a vector of other determinants.
Methodology
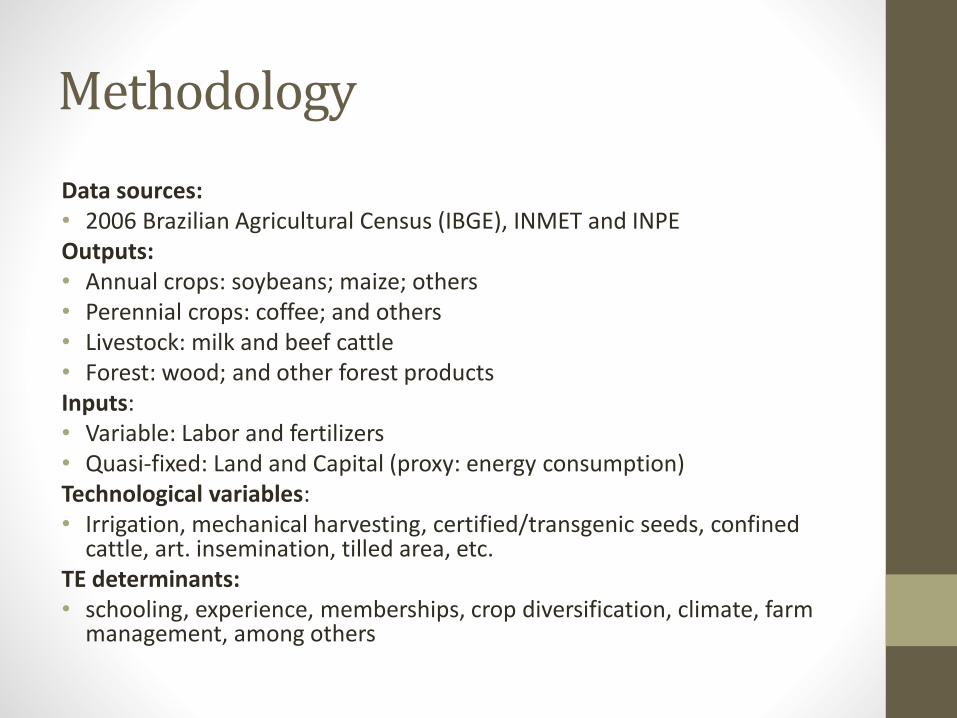
Data sources: • 2006 Brazilian Agricultural Census (IBGE), INMET and INPE Outputs:• Annual crops: soybeans; maize; others• Perennial crops: coffee; and others• Livestock: milk and beef cattle• Forest: wood; and other forest productsInputs:• Variable: Labor and fertilizers• Quasi-fixed: Land and Capital (proxy: energy consumption)Technological variables: • Irrigation, mechanical harvesting, certified/transgenic seeds, confined
cattle, art. insemination, tilled area, etc.TE determinants:• schooling, experience, memberships, crop diversification, climate, farm
management, among others

LONG-TERM RESULTS: Analyzing historical climate
Climate change and Agriculture
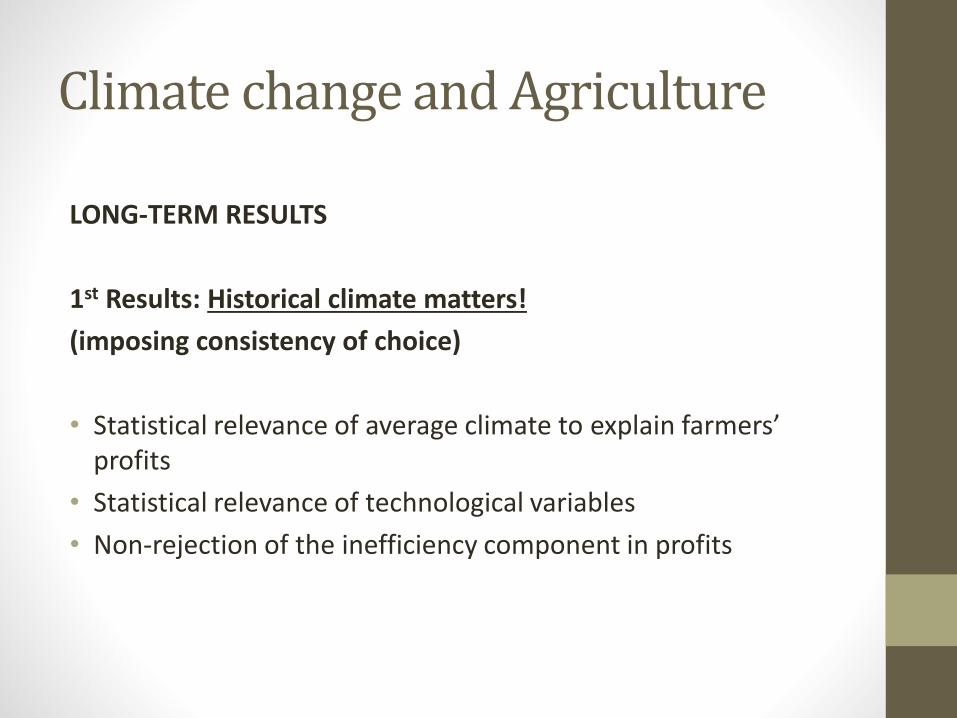
LONG-TERM RESULTS
1st Results: Historical climate matters!
(imposing consistency of choice)
• Statistical relevance of average climate to explain farmers’ profits
• Statistical relevance of technological variables
• Non-rejection of the inefficiency component in profits
Climate change and Agriculture
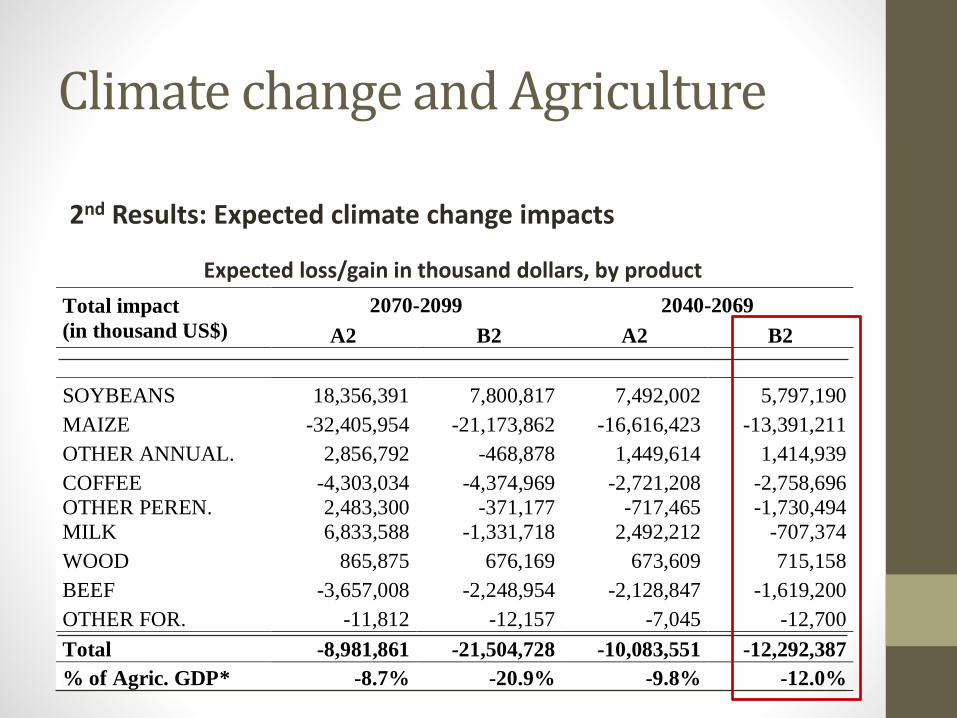
2nd Results: Expected climate change impacts
Expected loss/gain in thousand dollars, by product
Total impact
(in thousand US$)
2070-2099 2040-2069
A2 B2 A2 B2
SOYBEANS 18,356,391 7,800,817 7,492,002 5,797,190
MAIZE -32,405,954 -21,173,862 -16,616,423 -13,391,211
OTHER ANNUAL. 2,856,792 -468,878 1,449,614 1,414,939
COFFEE -4,303,034 -4,374,969 -2,721,208 -2,758,696
OTHER PEREN. 2,483,300 -371,177 -717,465 -1,730,494
MILK 6,833,588 -1,331,718 2,492,212 -707,374
WOOD 865,875 676,169 673,609 715,158
BEEF -3,657,008 -2,248,954 -2,128,847 -1,619,200
OTHER FOR. -11,812 -12,157 -7,045 -12,700
Total -8,981,861 -21,504,728 -10,083,551 -12,292,387
% of Agric. GDP* -8.7% -20.9% -9.8% -12.0%
Climate change and Agriculture
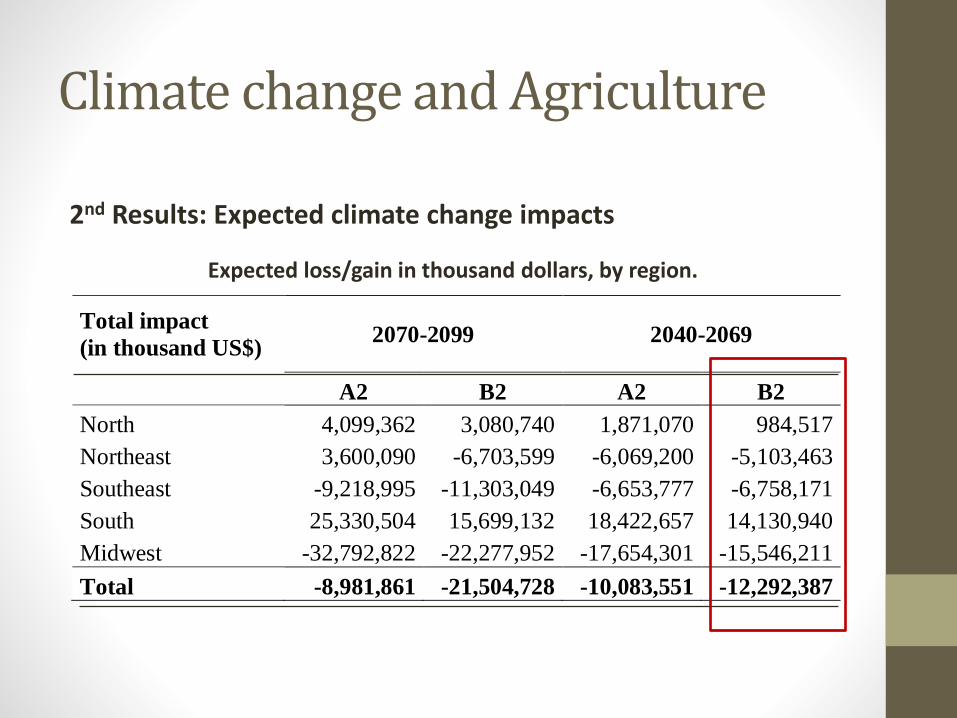
2nd Results: Expected climate change impacts
Expected loss/gain in thousand dollars, by region.
Total impact
(in thousand US$) 2070-2099 2040-2069
A2 B2 A2 B2
North 4,099,362 3,080,740 1,871,070 984,517
Northeast 3,600,090 -6,703,599 -6,069,200 -5,103,463
Southeast -9,218,995 -11,303,049 -6,653,777 -6,758,171
South 25,330,504 15,699,132 18,422,657 14,130,940
Midwest -32,792,822 -22,277,952 -17,654,301 -15,546,211
Total -8,981,861 -21,504,728 -10,083,551 -12,292,387
Climate change and Agriculture
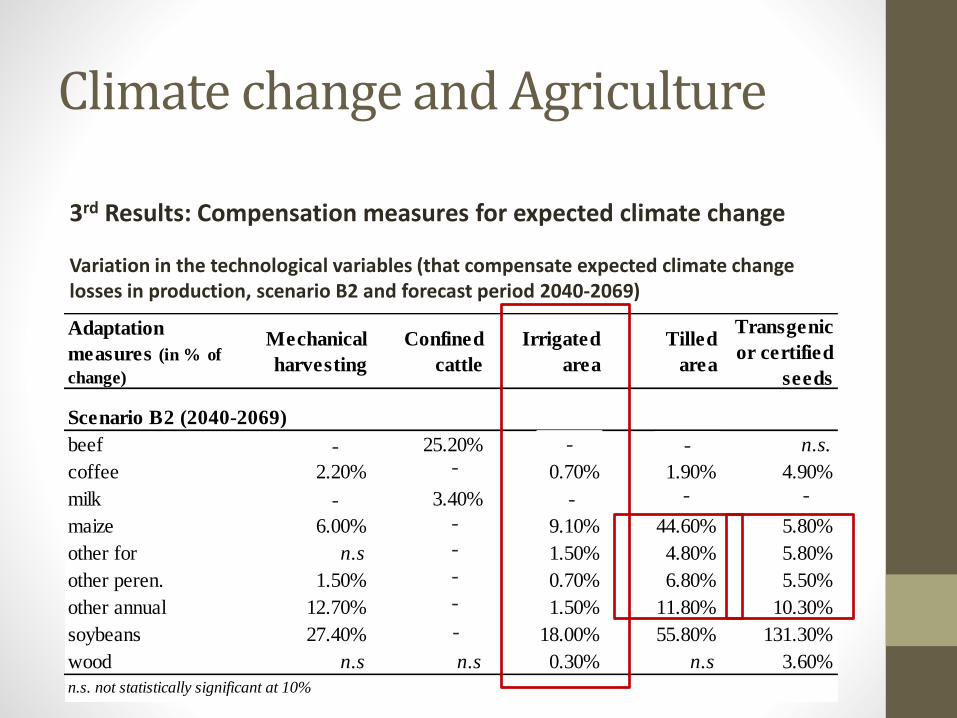
3rd Results: Compensation measures for expected climate change
Variation in the technological variables (that compensate expected climate change losses in production, scenario B2 and forecast period 2040-2069)
Adaptation
measures (in % of
change)
Mechanical
harvesting
Confined
cattle
Irrigated
area
Tilled
area
Transgenic
or certified
seeds
beef 47.30% 25.20% 9.50% 75.80% n.s.
coffee 2.20% 2.80% 0.70% 1.90% 4.90%
milk 8.80% 3.40% 2.20% 2.60% 11.10%
maize 6.00% 3.40% 9.10% 44.60% 5.80%
other for n.s 6.20% 1.50% 4.80% 5.80%
other peren. 1.50% 5.40% 0.70% 6.80% 5.50%
other annual 12.70% 10.30% 1.50% 11.80% 10.30%
soybeans 27.40% 30.80% 18.00% 55.80% 131.30%
wood n.s n.s 0.30% n.s 3.60%
n.s. not statistically significant at 10%
Scenario B2 (2040-2069)
-
-----
-
-
-
- -
-
-

Climate Change and Agriculture
Conclusions:
• Soybean production: positively affected by higher summer temperatures in most regions
• Expected climate changes (net losses in % of agricultural GDP, 2011):
• 9.8 to 12% for 2040-2069 / 8.7 to 21% for 2070-2099
• More damage in the Midwest, Northeast and Southeast regions
• Positive effects: South and North regions
• Compensation/productivity measures:
• Irrigation seems to be the most important compensation technique
• Transgenic and certified seeds are relevant for crops in general
• Cattle confinement to compensate milk and beef losses
• Mechanical harvesting for maize and other annual crops, and tilled area for coffee and other annual and perennial crops

SHORT-TERM RESULTS: Analyzing extreme events
Extreme Weather and Agriculture
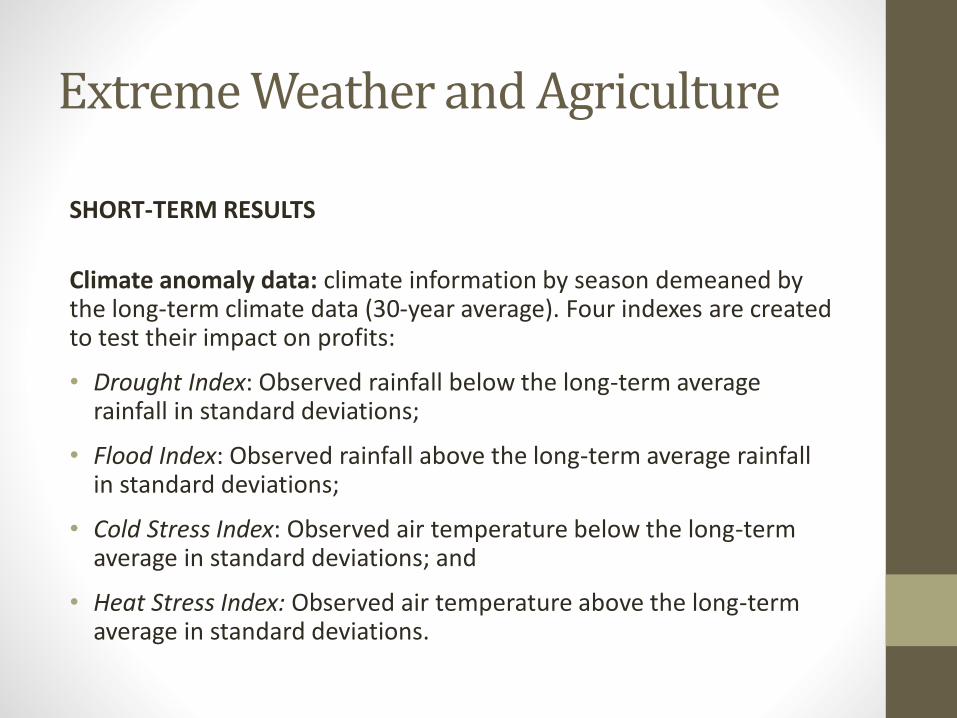
SHORT-TERM RESULTS
Climate anomaly data: climate information by season demeaned by the long-term climate data (30-year average). Four indexes are created to test their impact on profits:
• Drought Index: Observed rainfall below the long-term average rainfall in standard deviations;
• Flood Index: Observed rainfall above the long-term average rainfall in standard deviations;
• Cold Stress Index: Observed air temperature below the long-term average in standard deviations; and
• Heat Stress Index: Observed air temperature above the long-term average in standard deviations.

Extreme Weather & Agriculture
Results:
• Extreme weather events impact farmers’ outcomes
• The most relevant actions to increase farmers’ efficiency are:
• membership in cooperatives or other associations;
• local higher education;
• credit access; and
• crop specialization.
Extreme Weather & Agriculture
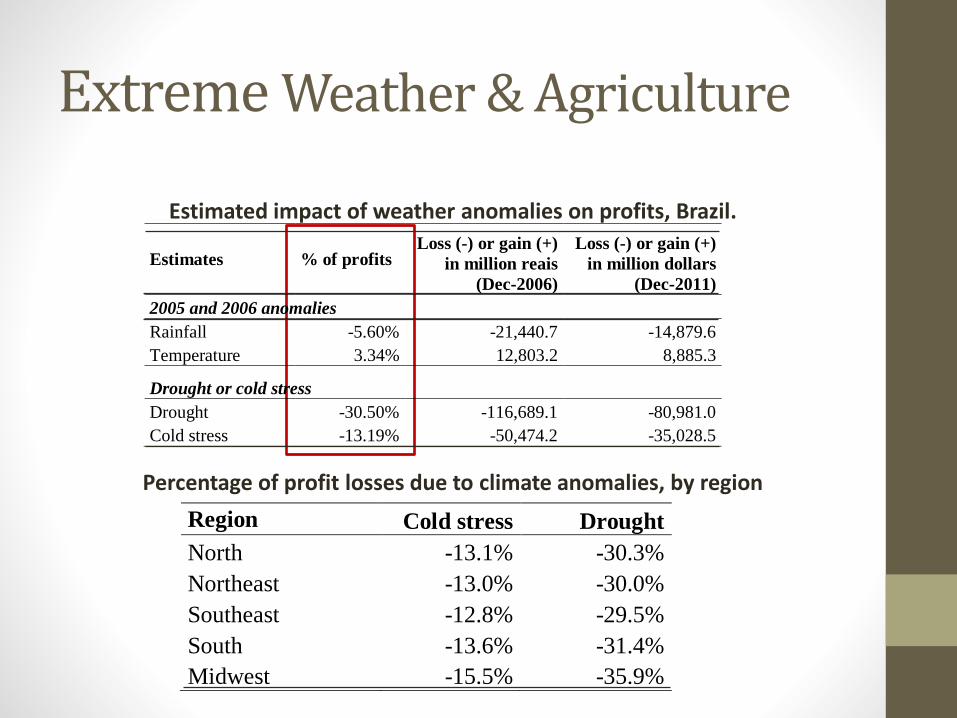
Estimated impact of weather anomalies on profits, Brazil.
Percentage of profit losses due to climate anomalies, by region
Estimates % of profits Loss (-) or gain (+)
in million reais
(Dec-2006)
Loss (-) or gain (+)
in million dollars
(Dec-2011)
2005 and 2006 anomalies
Rainfall -5.60% -21,440.7 -14,879.6
Temperature 3.34% 12,803.2 8,885.3
Drought or cold stress
Drought -30.50% -116,689.1 -80,981.0
Cold stress -13.19% -50,474.2 -35,028.5
Region Cold stress Drought
North -13.1% -30.3%
Northeast -13.0% -30.0%
Southeast -12.8% -29.5%
South -13.6% -31.4%
Midwest -15.5% -35.9%

Policy Discussion
Expected climate change
Policymakers are the only agents that can think about the sustainability of the country in the long run in order to plan specific actions.
Agriculture: Actions to build flexible production systems (technology)
• use of irrigation is the main compensation instrument
• transgenic/certified seeds, confined cattle and tilled area are also important adaptation measures to smooth the climate change effects.
• In particular, transgenic/certified seeds: sustainable way that serve as an insurance policy in response to potential changes in production conditions.
Policy Discussion
Short-term interventions
Monetary and social losses due to weather : equitable problem
Public intervention to stimulate the market to produce alternatives
In agriculture:
• cooperatives, crop specialization, credit access help farmers to be more efficient
• Discussion of insurance instruments: important actions to protect farmers from extreme weather harmful situations (max. farmer propensity to pay is 15 billion dollars due to the lack of rainfall)
• Weather index insurance mechanism: market-driven solution.
• Many barriers in the current Brazilian rural insurance market: mainly lack of information, data management, rural insurance consolidation

Future research and limitations
Future research:
• Agricultural studies:
• Account costs and barriers of the adaptation measures (compare techniques)
• Map investment need/penetration of each technique in the municipalities
• Include new questions regarding those technologies (Agricultural Census)
• Develop frost/hail index instead of cold stress index
Limitations:
• Method: Partial analysis
• Risk assess. in agriculture: lack of precision/ frequency of climate data for Brazil to implement better rural insurance.
• Time horizon of the analysis: data limitation

Obrigada.