the impacts of weather on tourist travel
TRANSCRIPT

The impacts of weather on tourist travel
Author
Becken, Susanne, Wilson, Jude
Published
2013
Journal Title
Tourism Geographies
DOI
https://doi.org/10.1080/14616688.2012.762541
Copyright Statement
© 2013 Taylor & Francis. This is an electronic version of an article published in TourismGeographies, Volume 15, Issue 4, 2013, Pages 620-639. Tourism Geographies is availableonline at: http://www.tandfonline.com with the open URL of your article.
Downloaded from
http://hdl.handle.net/10072/52549
Griffith Research Online
https://research-repository.griffith.edu.au

1
The impacts of weather on tourist travel
Abstract
Interest in the interactions between climate, weather and tourism has increased markedly in
the last decade in response to climate change concerns; however, there is little empirical
research on how tourists respond to the weather conditions they encounter. Thus, in this paper
we examine the impact of the weather on a sample of international tourists visiting New
Zealand during the 2009-10 summer season. Based on weather-related changes made to
tourists’ travel routes, the timing of their travel and activity participation whilst in New
Zealand, respondents were segmented into three groups: those with ‘no travel changes’
during their trip, ‘some travel changes’ and ‘substantial travel changes’ to their trip. The
results show a generally high level of changes made to trips, particularly in the less settled
early summer season, and an interesting link with satisfaction. The research provides an
empirical basis for a framework that would facilitate further research into the adaptive
capacity of tourists towards climate variability and change.
Keywords
Weather, travel changes, adaptive capacity, satisfaction, tourist behaviour
Cite as follows: Becken, S. & Wilson, J. (2013). The impacts of weather on tourist travel.
Tourism Geographies DOI: 10.1080/14616688.2012.762541.

2
Introduction
Climate and weather are key ingredients of a destination’s geography: they influence tourist
flows, have significant on-site impacts on the tourism resource base and influence tourists’
activity participation, satisfaction and safety. Therefore, considerable attention has been paid
to climate as a destination attribute (Hu & Ritchie, 1993), for example in relation to
destination image construction (Pike, 2002) and the development of advertising materials
(Gómez Martín, 2005). The relevance of climate and weather has also been analysed in the
context of destination choice and timing of travel (Hamilton & Lau, 2005, Hadwen et al.,
2011) and the relative changes in climatic conditions in tourists’ home countries (Rossello-
Nadal et al., 2011). Interest in the interactions between climate, weather and tourism has
increased markedly in the last decade in response to climate change concerns. Changes in
destination attractiveness, both in relation to climatic parameters (Giles & Perry, 1998; Hein
et al., 2009; Maddison, 2001) and climate change induced environmental changes (Scott et
al., 2008a), have been examined for different climate change scenarios.
Climate and weather denote different temporal scales of the same phenomenon (i.e. climate is
the average weather) and are of interest to tourists at different times in their travel. Climate,
for example, is most relevant in trip-planning stages, whereas weather (and weather forecasts)
becomes more important during the trip (Scott & Lemieux, 2010). Several studies have
attempted to measure the optimal climatic conditions for particular tourist activities through
the creation of climate-recreation indices (e.g. Morgan et al., 2000; Mieczkowski, 1985; Yu
et al., 2009). However, fewer studies have considered the immediate impacts of the weather
on tourists’ travel behaviour and experiences once they are in situ. The weather acts as a
facilitator that makes tourism activities possible and enjoyable (Gómez Martin, 2005), or
conversely may act as an inhibitor to participation and lead to trip cancellations (Tervo,
2008). The atmospheric effects of weather can be modified by behavioural responses such as
avoiding unfavourable weather, changing activities to suit weather conditions, the use of
structural or mechanical aids such as umbrellas, and adjusting the thermal insulation of the
body through changing clothing (de Freitas, 2001). Weather conditions can also impact on
tourists through transportation delays, cancellations and accidents (Koetse & Rietveld, 2009).
Tourists’ safety has been linked to extreme weather events such as heat waves (Scott &
Lemieux, 2010) and tropical storms (Becken et al., 2011). Climate change will exacerbate
these risks in the future (Nyaupane & Chhetri, 2009).

3
Weather impacts may be moderated by a variety of factors including those associated with
the destination itself and the type of holiday the tourist is on (Denstadli et al., 2011; Limb &
Spellman, 2001). Urban breaks or cultural tours, for example, are not as dependent on
weather conditions as are holidays reliant on natural resources, or primarily involving
participation in outdoor activities (Smith, 1993). However, not all tourists perceive the
weather in the same way. Limb and Spellman (2001) explored the importance of tourist
memories and experiences in relation to climate for domestic holidaymakers in the UK. They
found that weather is embedded in people’s holiday experiences and that different groups of
people evaluate and remember weather in different ways. Also, ‘good’ and ‘bad’ weather
may vary with circumstances and with individual’s preferences, rather than being absolute
concepts.
Weather also influences how enjoyable an experience is and therefore tourists’ satisfaction is
likely to be at least partly weather dependent. Poor weather as an important source of
dissatisfaction has been identified in studies in Scotland (Smith, 1993) and Australia
(Coghlan & Prideaux, 2009). The focus in many tourist satisfaction studies, however, has
been on the provision of tourism and hospitality services, taking little account of the weather
encountered by tourists. Surveys measuring tourists’ satisfaction often demonstrate bias
towards positive ratings for destination attributes (Oh, 2001; Ryan & Huyton, 2002). Alegre
and Garau (2010), however, suggest that this focus on positive attributes of a destination in
satisfaction measurement scales misses the negative features that may become determining
factors of overall satisfaction. They also challenge the one-dimensional construct (i.e. that
one single factor can, if positive, generate satisfaction, or if negative, generate dissatisfaction)
used in many studies. Instead they argue that, while the presence of certain factors might
generate satisfaction, their absence does not necessarily generate dissatisfaction, and vice
versa.
Despite the importance of weather to tourists, empirical research on how tourists respond to
the weather conditions they encounter is relatively limited, especially for studies that give a
deeper insight into behavioural responses by tourists (e.g. Dawson et al., 2011; Gössling et
al., 2012). Some studies developed regression models to relate weather and participation in
tourist activities (e.g. Shi et al., 2009; Scott & Jones, 2007). Thus, in this paper we examine
the impact of the weather on a sample of international tourists visiting New Zealand during
the 2009-10 summer season. A tourist survey collected data about weather-related changes
made to tourists’ travel routes, the timing of their travel and activity participation whilst in

4
New Zealand. This information formed the basis of a segmentation analysis, which
categorized tourists into three groups: those with ‘no travel changes’, ‘some travel changes’
and ‘substantial changes’ to their travel. Further analysis examined these segments in respect
of demographic and trip characteristics, pre-trip weather expectations, during-trip
engagement with weather information and the impact of the weather on their trip satisfaction.
With a focus on tourists, and on the impacts of the weather on their travel, the paper
highlights an important piece of the tourism, weather and climate puzzle, and offers a more
complete view of the factors that might influence adaptive capacity of tourists in New
Zealand. This addresses the finding of Gössling et al. (2012) that “little is actually known
about the complexity of demand responses” when it comes to responding to climate
variability or change. It has long been noted that for climate change strategies to be effective,
it is useful to understand the present sensitivities to climate and weather (e.g. Smit & Wandel,
2006). This is highly relevant as many of the projected climate changes for New Zealand are
an intensification of current weather events, for example the West Coast of New Zealand is
getting wetter and the eastern parts are getting drier (National Institute of Water &
Atmosphere (NIWA), 2008a).
Tourists and the weather in New Zealand
Tourism in New Zealand is a highly weather and climate dependent industry with many of
the popular attractions enjoyed by tourists based outdoors. Further, visitation is seasonal: the
peak summer months of December 2010 to February 2011 attracted 35% of all international
tourist arrivals in the year ended March 2011 (Ministry of Economic Development, 2012). It
is common practice in New Zealand for international tourists to take touring holidays during
which they visit multiple regions and sub-destinations within the country (Becken, 2005) and
participate in highly weather-sensitive activities. Even in benign conditions, the New Zealand
climate exposes international tourists to a wide variety of weather conditions (Wilson &
Becken, 2011) which result from the country’s complex climatic geography.
While relatively narrow – the coast is never more than 120 kilometres away – New Zealand
stretches almost 1,600 kilometres from north to south (spanning 13° of latitude), and reaches
elevations of almost 4,000 metres in the Southern Alps. The temperature ranges from
subtropical in the far north, to cool temperate climates in the far south. The prevailing
westerly winds provide for very wet conditions on the west coast of the South Island and a

5
dry climate in the east (NIWA, 2008a). In addition to the regional climatic diversity created
by these conditions, the speed and frequency of weather changes are of note (Tourism New
Zealand, 1999-2010). It is often said that in New Zealand you can experience ‘four seasons in
one day’. To date, however, limited empirical attention has been paid to the interaction of
tourism, climate and weather in New Zealand. An earlier study explored the role of rainfall
on the (wet) West Coast in relation to visitation at the Franz Josef visitor centre. However,
other factors, including annual seasonality, dominated the model with rainfall accounting
only for a very small proportion of variation (Meyer & Dewar, 1999).
More recently, Scott et al. (2008b) investigated preferred climates for tourism, which
included New Zealand as one of three case studies. The research attempted to define optimal
climatic conditions by examining four climatic parameters (temperature, precipitation,
sunshine and wind) in three major tourism environments (beach-coastal, urban and
mountains). The study was notable for incorporating multiple weather parameters, destination
types and nationality preferences. Other research includes an analysis of media articles on
tourists/tourism and the weather which identified a range of weather impacts on tourists
(Wilson & Becken, 2011) and an exploration of tourists’ awareness of, and preparedness for,
extreme weather events (Jeuring, 2011). A number of other tourism and recreation studies,
while not specifically addressing climate or weather, have also noted ‘climatic’ impacts on
tourists. In a study of self-drive tourists’ trip planning and decision-making, Becken and
Wilson (2006) found that tourists’ travel plans commonly changed because of the weather.
Ritchie (1998) identified weather as an important factor for cycling while Bentley and Page
(2008) highlighted the role played by weather in adventure tourism accidents.
Method
Against the background of limited research on how tourists respond to weather conditions,
we took an exploratory approach to investigate the impacts of the weather on tourists’ travel.
A survey of international tourists and their weather expectations and experiences in New
Zealand was administered to collect a large number of data, thus generating a wide-ranging
overview of the key issues. In addition, the survey format allowed for the inclusion of open-
ended questions (further supporting the research’s exploratory nature) to collect qualitative
data. Weather details were captured through the open-ended responses to several of the
weather-experience questions. In addition, survey period served as a proxy to represent the
type of weather tourists may have encountered. The validity of this proxy was supported by

6
the 2009-10 seasonal climate summary which reported that it was a “... topsy-turvy summer.
It started out extremely cold, with record cold temperatures in early December, but finished
hot, with heat waves and above average temperatures in February” (NIWA, 2008b). Thus, it
was hypothesised that those surveyed in early summer would have been more disrupted by
the weather.
Data collection
Data were collected from international tourists at the end of their New Zealand holidays. The
15 minute-survey was in English and designed for self-completion by respondents. Two
survey periods were selected to represent times when there are usually variations in the
weather conditions: an ‘early summer’ (mid-December 2009 – early January 2010) period
with more unsettled weather; and a ‘late summer’ (February 2010) period, reflecting more
settled weather. The survey was carried out in central Christchurch and at the KEA Campers
Christchurch depot. In Christchurch, several sites popular with tourists were selected and any
persons who appeared to be international tourists were approached and asked to participate in
the survey. To be eligible, tourists had to be from overseas, aged over 18 years, at the end of
their New Zealand holiday, and understand English to a sufficient standard. Only one person
in each travel group completed the survey. At the KEA Campers Depot, the survey was
distributed to international tourists returning campervans, and KEA staff were asked to
explain that tourists’ participation was voluntary and the research was in no way connected to
KEA Campers.
Altogether, 436 surveys were completed. More than half of the surveys (N= 251) were
completed in central Christchurch and 185 surveys were completed at the KEA depot.
Because of the differences in the sampling frameworks comparative response rates are
difficult to calculate. Of the eligible tourists approached in central Christchurch there were 26
and 23 refusals during the first and second survey periods, respectively. The completion rate
at the KEA depot was influenced by how busy the staff were and by how much time the
tourists had to spare. During the first survey period, when 93 surveys were completed, there
were 260 campervan returns; during the second survey period, when 92 surveys were
completed, there were 219 campervan returns. Some of these returns may have been New
Zealanders, who were not eligible to complete the surveys. A number of survey forms were
returned at the KEA depot with an insufficient number of questions answered for inclusion in
the final data set. The response rates across both survey periods were 84 percent in
Christchurch and 39 percent at the KEA depot.

7
Analysis
Three questions in the larger survey (Becken et al., 2010) were of particular interest, namely
respondents’ weather-related changes to a) the time they spent in a place; b) the route they
travelled; or, c) their activities. For each of these questions, tourists could respond ‘no
change’, ‘occasionally’, and ‘frequently’, and they were asked to provide examples if they
had made any changes. It is acknowledged that tourists’ assessment of occasional versus
frequent is subjective; however, the segmentation (see below) was based on combining these
two answers into ‘any change’. Only those 309 respondents who answered all three ‘change’
questions have been included in the analysis for this paper. The three travel components for
which changes were examined are likely inter-related. This potential collinearity would need
to be considered in future statistical models, for example regression analysis.
The survey data were analysed using SPSS Version 17.0 for the purpose of descriptive
statistical analyses, and nonparametric tests (Chi Square). Open-ended questions were
manually coded and analysed qualitatively. The 309 respondents were coded into three
groups: those who made ‘substantial travel changes’, i.e. they reported having changed all
three dimensions (i.e. timing, route and activity) because of weather conditions; those who
made ‘some changes’, i.e. they made changes in only one or two of these dimensions; and
those who made ‘no changes’. The segmentation into three travel change groups was the
basis of further statistical analysis including: key data describing respondents’ demographics
(age, country of residence) and trip characteristics (transport used, length of stay);
expectations of weather pre-trip and engagement with weather information during-trip; and
weather impact on satisfaction. Data were aggregated to a level that allowed Chi-square tests
(i.e. cell counts of 5 or more) to avoid Type II error where there are differences between
groups but because of small sample sizes they remain undetected.
Limitations
A major limitation is that the survey did not collect specific weather data. The reason for this
was that because the survey was an exit survey and tourists were asked about their
experiences of their total trip, it was not practical to collect detailed daily weather data. For
the case of New Zealand, this would be particularly difficult considering that the average
tourists stays for about 21 days and would have been likely to have experienced changeable
weather throughout their trip. Thus, it would be challenging to ask tourists to summarise the
weather they experienced. Instead, the impact of weather was captured more indirectly by
asking how tourists changed components of their travel and whether weather affected their

8
satisfaction. These are subjective measures and reflect the tourists’ perception of how
weather affected their trip.
Another limitation is that the survey did not count how many times tourists made changes,
nor did it explore the nature of changes in any detail. Further, tourists who reported no
changes because of the weather could have been fortunate in that they encountered
favourable weather or they chose not to make any changes despite the weather. The
framework developed at the end of this paper accounts for this possibility and proposes
further avenues for research. Finally, due to the survey approach, the sample is biased
towards independent tourists from European countries. For example, the most common
countries of origin in this sample are Germany (20%) and the UK (16%), which compares to
a proportion of 2% and 8% in the whole tourist population. The proportion of tourists who
travel in a car, van or campervan is 74% in this sample compared with 73% in the tourist
population. Tour group visitors, however, are slightly underrepresented (15% compared with
24%) (Ministry of Economic Development, 2012). For the development of the framework
and the underlying principles of adaptive capacity, this bias is not problematic.
Results
The results are presented in three parts: 1) Changes due to the weather; 2) Travel change
group and key demographic and trip characteristics; 3) Travel change group and weather
experiences, information engagement and satisfaction.
Changes due to weather
Respondents reported a number of changes to their trip in response to the weather with most
changes made to activities, followed by length of stay (timing) in a particular destination;
travel route was the least likely to change as a result of the weather (Table 1). For all three
types of change, however, most changes were made only occasionally, suggesting that the
weather did not have a significant impact on tourists’ travel and activities, either because it
was generally favourable or because tourists made no change despite detrimental weather.
TABLE 1
The open-ended responses provided insight into what weather-related changes tourists made.
The most common change reported with respect to travel timing was to either leave a place

9
early because of bad weather, or stay longer because of good weather. Some respondents
waited for the weather to improve or, based on the weather forecast, they cancelled plans to
visit a place. Some also reported having driven past intended stops because of bad weather, or
continued driving in the hope of finding better weather, both of which resulted in covering
more ground than intended in one day. Many of the examples provided related to the typical
weather conditions found in specific destinations, e.g. leaving the (very wet) West Coast of
the South Island early because of bad weather, staying longer in (sunny) Golden Bay because
of good weather and waiting at Milford Sound for the (notoriously bad) weather to improve.
Milford Sound is one of the major tourist attractions in New Zealand and a priority for
tourists to visit (Becken, 2005). Only a quarter of respondents changed the routes they
travelled, reflecting the popularity of a number of iconic destinations and the limited variation
of road routes available to connect these sites (Becken & Wilson, 2006; Pearce, 1990). Some
respondents, however, changed the order in which they visited particular destinations, or the
direction in which they travelled (“there was much rain west, so went east”; “came down the
West Coast first to follow the sun”).
Just over half of all respondents changed activities because of the weather. The specific
locations mentioned, were the primary tourist destinations of the Glaciers, Tongariro, Milford
Sound, Abel Tasman, Kaikoura and Queenstown. Land-based activities were the most
affected followed by water and air-based ones, which reflects the frequency of participation
in these different types of activity. The wide range of weather impacts on commercial
activities included: the cancellation of guided walks and because of heavy rain; the
cancellation of scenic flights, sky diving, paragliding because of poor visibility and high
winds; the closure of gondolas and cancellation of Whale Watch because of high winds; and
the cancellation of jet boating, canyoning, sea and river kayaking because of heavy rain and
high water levels. Of the activities commonly undertaken independently, walking/tramping,
beach visits and swimming were the most frequently mentioned in respect of weather
impacts. Some respondents reported waiting for good weather to do particular hikes (“we
timed some bush walks for the weather, we also walked a lot in the rain”; “scheduled summit
trip on Mt Taranaki after weather change”). A number of respondents reported doing more
indoor activities when the weather was bad (”museum instead of hiking”).
When examined by survey period, the number of respondents who made no changes was
smaller in early summer compared with late summer for all three measures (Figure 1);
however, this was only statistically significant with respect to activities (X2=13.767, df=2,

10
p=0.001). For example, in early summer 56 respondents made no changes to their activities
(while 92 did), compared with 94 in late summer who made no changes (and 67 did change
their activities).
FIGURE 1
Travel change group and key demographic and trip characteristics
According to the segmentation described earlier, 51 tourists (16.5%) reported making
‘substantial travel changes’ and 145 (46.9%) respondents made ‘some changes’ to their trip;
the remaining 113 (36.6%) respondents reported ‘no travel changes’ as a result of the weather
(Figure 2). A significant relationship was found between survey period and travel change
group (X2=14.548, df=2, p=0.001). Altogether, almost two thirds (66.4%) of tourists making
no travel changes were surveyed in late summer, compared to less than half of each of the
tourists making some or substantial changes (44.1% and 43.1% respectively).
FIGURE 2
Further analyses were undertaken to examine whether different types of tourists (i.e.
according to demographics and key trip variables) were relatively more likely to have
changed their trip or not (assuming that tourists typically encounter a similar mix of weather
conditions). These data included country of residence, age, number of previous visits to New
Zealand, length of stay on current trip, and main mode of transport used (Table 2). While
following intuitive patterns, only age produced a significant relationship as shown in Table 2.
Respondents in the age group of 41-44 years, were most likely to have made substantial
changes to their trip, while both the young tourists (18 to 25 years) and the older ones (over
56) were least inclined. No clear pattern of travel changes because of the weather by country
of residence was found. First time visitors were slightly more likely to have made substantial
travel changes, i.e. 18.9% of all first timers were of the ‘substantial travel change’ group,
compared to 13.7% of those who had made one previous visit and only 8.6% of those who
had made more than one previous visit. Tourists who had visited more than once previously
were much more likely to report no changes to their trip (48.6% compared to 35.8% of first
time visitors and 32.9% of those who made one previous visit). This suggests that, as the

11
number of previous visits a tourist has made to New Zealand increases, so too does their
understanding of the weather’s impact on their travel plans.
The degree to which tourists made changes in response to weather conditions was moderated
by transport mode and length of stay although, again, no statistically significant relationships
were found. Tourists travelling by campervan were most likely to have made substantial
changes, followed by those using public transport or travelling independently. As might be
expected, those on tours were more likely to be of the ‘no travel change’ group (50.0%) and
less likely to have made substantial changes (4.3%). Tourists on short stays (under 2 weeks)
were more likely to report no changes compared with those on longer stays (48.1% compared
to only 29%). This is possibly a consequence of shorter stay tourists having more components
of their trip pre-booked, thus reducing their ability to change their trip. Also, tourists’
exposure to a greater variability of weather conditions increases with length of stay.
TABLE 2
Travel change group and weather expectations, information seeking and satisfaction
Respondents were asked what they thought the weather would be like before they got to New
Zealand and if the weather they experienced was different to what they had expected. Most
respondents (60.8%) found the weather in New Zealand different to what they expected. A
statistically significant relationship was found whereby, encountering different weather to
expected, increased the likelihood of making travel changes. Of those who did find the
weather different to expected, almost half (47.9%) had made some travel changes and a fifth
(20.2%) made substantial changes because of the weather (Table 3). This relationship was
even more pronounced in early summer. The 188 respondents who found the weather
different to expected were also asked in what way it differed. These responses were
compared with the open-ended responses recorded for ‘expected weather pre-trip’ and coded
into three categories: better than expected; worse than expected; and unexpected/different
(e.g. “varied”) (13 respondents did not provide further comment). Tourists who experienced
worse than expected weather were much more likely to make changes to their travel (82%)
compared with those who perceived the weather to be better or different.
TABLE 3

12
Altogether, 25.3 percent reported seeking weather information regularly, 165 (53.6%)
occasionally and 21.1 percent not at all. The results in Table 3 show that information use
increases with the extent to which tourists changed their travel, i.e. regular users of weather
information were more likely to be in the ‘substantial travel change’ group (28.2%),
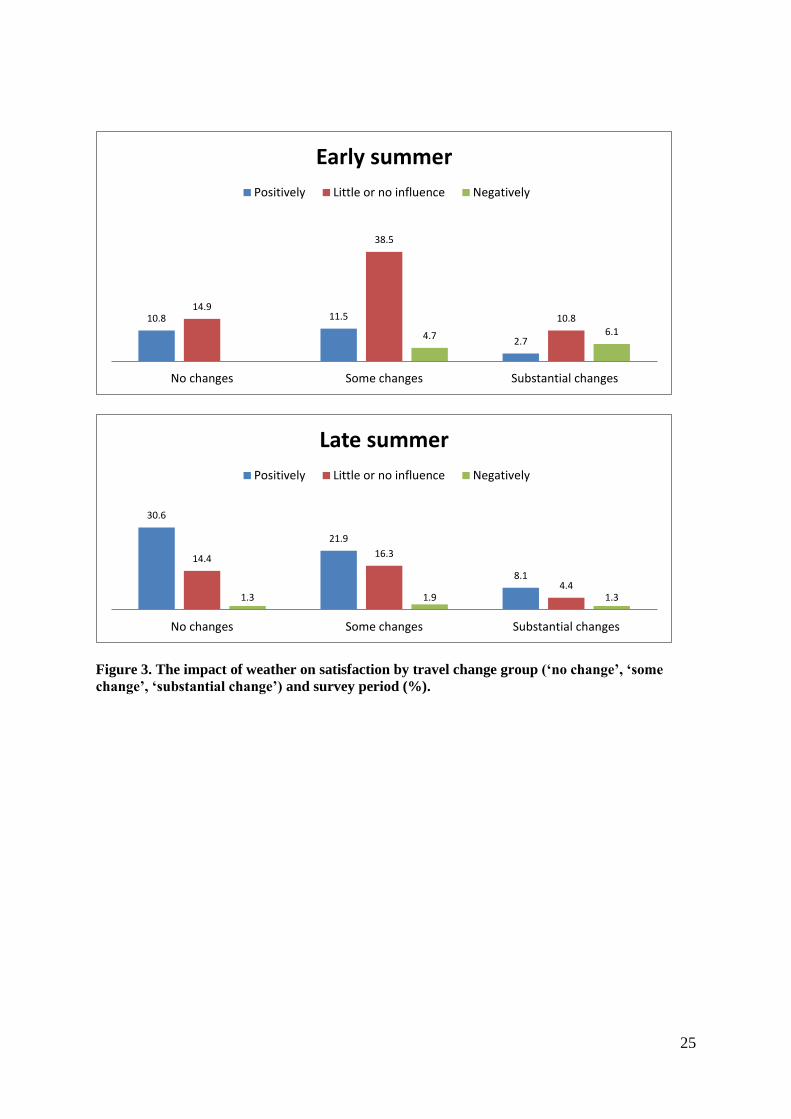
compared with those who did not access weather information. The final analysis examined
whether the extent to which tourists made changes to their trip related to the impact that
weather had on their satisfaction (Figure 3). Overall, a large number of tourists reported a
positive weather impact on their holiday satisfaction (43.5%), compared to only a relatively
small proportion (7.5%) for whom the weather impacted negatively. Almost half (49.0%)
were ambivalent, i.e. they reported that the weather had little or no influence. As the level of
changes made increased, the likelihood of reporting a positive weather experience decreased,
indicating that making changes is an undesired measure. The proportion of tourists reporting
positive effects was much smaller in early summer, a reflection of more disruptive weather
conditions and higher incidence of weather-related changes in early summer. Accordingly,
the tourists surveyed in early summer were more likely to report that the weather had little or
no influence, or even a negative influence on their satisfaction (Figure 3).
FIGURE 3
Discussion
Climate and weather are important drivers for international tourism, and the decision by
tourists to travel to New Zealand in summer (i.e. December to February) indicates that the
weather plays some part in the overall timing of New Zealand holidays, particularly for
tourists from the northern hemisphere who may wish to escape their own winter season. Once
in New Zealand, the combination of multi-destination travel, with a focus on outdoor
activities, and the variability of the weather, both spatially and temporally, does appear to
have some impact on tourists’ itineraries and activity patterns.
This research found that the majority of respondents (63%) made some changes to their trip
as they travel because of the weather. Tourists changed the length of time they stay in a
destination and, to a lesser extent, the routes they take, but the weather had most impact on
their activities. Tourists were segmented into three groups based on whether they made no
weather-related changes, some or substantial travel changes. Those who made no changes
were more likely to be older, to have visited a number of times previously, travel by tour or

13
car and stay the shortest length of time. This suggests a combination of adequate previous
knowledge to make realistic plans, less interest in weather-impacted activities, less scope to
make changes even if they wanted to because of time and other constraints. ‘No travel
change’ tourists were the least likely to find the weather different to expected or to use
weather information whilst travelling. This group was also more prominent in late summer,
the more settled weather period, and were the most likely to report a positive weather
influence on satisfaction.
At the other extreme, tourists who made changes to all three dimensions of their travel
(‘substantial travel change’, the smallest of the three groups), were more likely to be in the
middle age groups, on their first visit, travel by campervan and stay either short (i.e. less than
2 weeks) or long (over a month). This group had the highest percentage of tourists who found
the weather different to expected and the highest percentage of regular users of weather
information whilst travelling. This suggests less prior knowledge of New Zealand weather,
alongside greater flexibility to change plans. These tourists were also the most likely to report
that the weather had a negative influence on satisfaction, suggesting that having to change
one’s trip because of the weather is not desirable. The early less settled summer period saw a
slightly higher percentage of tourists with substantial trip changes. Finally, tourists who made
‘some changes’ (the largest group) were more likely to be young, to be on their first visit or
to have visited once, travel by campervan and stay for medium or long time. This group had
the highest percentages of tourists who found the weather different to expected, collected
weather information occasionally and reported that the weather had little or no influence on
satisfaction. These tourists’ responses to the weather were moderate and reflected general
ambivalence to the weather (as in a small-scale study by Limb & Spellman, 2001).
This study has highlighted some of the difficulties of understanding weather impacts on
tourists. Because of their diverse itineraries and activity patterns, the (highly variable)
weather tourists encounter in New Zealand cannot simply be described in terms of a single
destination and activity type (e.g. Moreno et al., 2008). This complexity raises questions
about the assessment of ‘optimal climatic conditions’ through indices based on coarse
monthly scale data for destinations such as New Zealand. Rather than trying to assess ideal
conditions the better approach might be to understand tourists’ preferences for specific
locations and activities (Rutty & Scott, 2010) and contrast these with the realities occurring at
the destination. To study the detailed impact of weather on travel decisions it would be
necessary to collect (half) daily data from individual tourists on what they had planned, what

14
the weather was, and what they decided to do. The trade-off would be that such a diary
approach would only be able to cover a limited number of days of a tourist’s trip, if
reasonable response rates are expected.
In this research, a broader approach examined tourists’ experiences with the weather in New
Zealand across their whole trip. Thus, no detailed weather data were collected and the
behavioural responses by tourists could not been controlled for by specific conditions. To
introduce some element of weather context, the use of survey periods served as a proxy for
the weather tourists were likely to encounter. Thus, surveying tourists at the end of their
holidays ensured that, within the sample, tourists had experienced either ‘early summer’ or
‘late summer’ conditions. The difference in weather conditions between these was validated
by the NIWA (2008b) seasonal climate summary, and by the research data themselves, which
showed that early summer tourists made more weather-related changes to their trips. The
examination of tourists’ weather expectations, and the finding that many more tourists
experienced ‘worse than expected’ weather in early summer, also supports our early and late
summer weather-proxies.
While this study was exploratory in nature and the sample of tourists is biased towards
European free independent travellers a conceptual framework for tourists’ responses to
weather is proposed (Figure 4). This framework could be used as a starting point for a
detailed quantitative survey to disentangle the different antecedents that lead to the particular
(observed) behaviour of changing one’s trip or not. The framework first assumes that
international tourists arrive at a destination with specific expectations, levels of preparation
(including in anticipation of the destination’s climate), travel plans and budgets, and decision
making heuristics, including hedonic behaviour (Hyde, 1999; Woodside & King, 2001).
Decision-making relates to demographics, previous travel experience, and trip characteristics,
amongst others. The weather is treated as a situational factor that influences en route decision
making, sometimes in a planned way (e.g. in response to a weather forecast) and other times
more impulsively (Becken & Wilson, 2006). Hence, the weather tourists encounter facilitates
what tourists had planned to do, and it is the pivotal base from which tourists are likely to
consider making changes or not. This research indicates that if the weather is suitable for
what tourists want to do, no changes occur because of the weather. If changes are made it is
typically in response to unfavourable weather, rather than maximising ‘utility’ by exploiting
favourable conditions. This asymmetry of weather impacts on behaviour is worthy of greater
investigation in future research.

15
If tourists encounter weather that may require a change of their route, timing or activities,
changes may or may not be possible. Some trip characteristics operate as constraints and
others facilitate change; a short length of stay, for example, restricts capacity to make
changes. Certain types of tourists have a greater built-in flexibility than others, for example
campervan tourists who reported greater levels of change compared with group tourists.
Finally, not all tourists who are able to make changes in response to detrimental weather will
chose to do so. This could relate to tourist personalities or different levels of tolerance
towards weather conditions, and further research on this would be useful. Tourists who chose
to make changes then fall into the ‘some travel changes’ or ‘substantial travel changes’
group. The availability and use of climate and weather information before and during the trip
constitutes an important element of the framework. Tourists who use climate information
before their trip are better prepared, have realistic expectations and are less likely to change
their trip. Using information during the trip, in this research, appeared to be more relevant for
those tourists who had to or decided to make changes to their trip because of the weather.
This is an important finding, as the use of information may not only lead to better choices,
but also contribute to protecting tourists from severe weather events and (Jeuring, 2011).
Given that more than half of the respondents in this research found the weather different to
expected, the role of weather information deserves greater attention.
The relationship between changing one’s trip and satisfaction is of great interest. Tourists
who reported more changes than others were more likely to report that the weather had a
negative impact on satisfaction. To what extent this drives overall satisfaction has not been
explored in this research, but should be considered more specifically in future market
research. Higher levels of changes made, i.e. moving through the grey shaded boxes in Figure
4, may reduce satisfaction, perhaps because of the effort changes involve. The fact that more
people reported negative impacts in the early summer season, compared with the February
survey period, raises questions about New Zealand’s attempt to extend the shoulder seasons
into periods that are possibly offering less favourable weather conditions. Implications on
tourist experience and resulting word-of-mouth messaging should be assessed (Becken et al.,
2010).
FIGURE 4
The findings from this weather-related research provide a first insight into tourists’ responses
to climate variability and future climate change, thus further exploring Scott et al.’s (2008)

16
and Gössling et al.’s (2012) proposition that tourists have a great adaptive capacity. Climate
change adaptation starts at home. Tourists who prepare for their trip and understand the
climate of their destination are better prepared than those who travel with little knowledge of
potential weather conditions they might encounter. Such adaptation includes a conscious
decision to travel during times that provide most likely suitable weather (e.g. the late summer
in New Zealand). Further, some forms of tourism might be more amenable to ‘adapting’ to
changing conditions during travel than others. Flexible arrangements, such as campervan
holidays, are probably more adaptable than pre-booked bus tours. At the same time, it is
important to note that, whilst more adaptable, campervan tourists are more exposed to the
climate. The individual tourist’s mind-set is also likely to influence adaptive capacity, but
research on this aspect has not been undertaken yet. Finally, high users of weather
information are also likely to have higher ‘adaptive capacity’ than tourists who do not engage
with local weather information and forecasts.
Conclusion
A tourist survey, undertaken to explore tourist and weather interactions, collected data about
weather-related changes made to tourists’ travel routes, the timing of their travel and activity
participation whilst in New Zealand. This information formed the basis of a segmentation,
which categorized tourists into those who made no changes to their trip, and those tourists
who made some or substantial travel changes. The research found that a large number of
tourists changed their trip because of the weather, typically in response to unfavourable
conditions, lending weight to the assumptions that tourists have a high adaptive capacity.
Notwithstanding, about a third of visitors made no changes to their trip, which can be
explained by them either ‘being lucky’ with the weather, facing constraints (e.g. being on a
fixed tour), or being unwilling to make changes. Whether tourists’ potential reluctance to
make changes relates to psychological variables or decision-making patterns remains an
interesting question. Importantly, tourists who made no changes appeared more satisfied with
the weather compared with those who did change their trip in response to weather. This
research indicates that tourists prefer not to make changes to their trip to accommodate
weather conditions. Thus, adapting to weather is a matter of ‘damage control’ rather than
optimising utility. Thus, the link between adaptation to weather and overall satisfaction is
potentially important for destinations that are exposed to highly variable weather. This
research highlights the complexity of understanding climate variability and change in relation

17
to tourist behaviour. Finally, the comparison between tourist behaviour and weather-
influenced satisfaction between the early summer and the more settled late summer season
with a reported greater need to make changes to travel plans in early summer, poses severe
challenges to those who wish to extend tourism beyond the peak season into the less popular
shoulder seasons.

18
References
Alegre, J., & Garau, J. (2010). Tourist satisfaction and dissatisfaction. Annals of Tourism
Research, 37(1), 52-73.
Becken, S. (2005). The role of tourist icons for sustainable tourism. Journal of Vacation
Marketing, 11(1), 17-26.
Becken, S., & Wilson, J. (2006). Trip planning and decision making of self-drive tourists – a
quasi-experimental approach. Journal of Travel and Tourism Marketing, 20(3/4), 47-
62.
Becken, S., Wilson, J. & Hughey, K. (2011). Planning for Climate, Weather and Other
Natural Disasters – Tourism in Northland. LEaP Research Paper 1. Available at
www.lincoln.ac.nz/leap
Becken, S., Wilson, J. & Reisinger, A. (2010). Weather, climate and tourism: a New Zealand
perspective. Lincoln University, New Zealand: LEaP. (Land Environment and People
Research Report No. 20). Available at www.linclon.ac.nz/leap
Bentley, T. A., & Page, S. J. (2008). A decade of injury monitoring in the New Zealand
adventure tourism sector. Tourism Management, 29(5), 857-869.
Coghlan, A. & Prideaux, B. (2009). Welcome to the Wet Tropics: the importance of weather
in reef tourism resilience. Current Issues in Tourism, 12(2), 89-104.
de Freitas, C.R. (2001). Theory, concepts and methods in tourism climate research. In
Proceedings of the First International Workshop on Climate, Tourism and Recreation
(pp. 3-20). A. Matzarakis and C. R. de Freitas (Eds.). Report of a Workshop held at
Porto Carras, Neos Marmaras, Halkidiki, Greece, 5 -10 October 2001. International
Society of Biometeorology. Downloaded from
http://www.urbanclimate.net/cctr/ws/papers/full_report.pdf
Dawson, J., Havitz, M., & Scott, D. (2011). The influence of ego involvement on climate-
induced substitution and place loyalty among alpine skiers. Journal of Travel and
Tourism Marketing, 28, 388–404.
Denstadli, J.M. Jacobsen, J.S. & Lohmann, M. (2011). Tourist perceptions of summer
weather in Scandinavia. Annals of Tourism Research, 38, 3, 920-940.
Giles A.R., Perry A.H. (1998). The use of a temporal analogue to investigate the possible
impact of projected global warming on the UK tourist industry. Tourism Management,
19(1), 75–80.
Gómez Martín, Ma. (2005). Weather, climate and tourism: a geographical perspective.
Annals of Tourism Research, 32(3), 571-591.
Gössling, S., Scott, D., Hall, C.M., Ceron, J.P. & Dubois, G. (2012). Consumer behaviour
and demand response of tourists to climate change. Annals of Tourism Research,
available online doi:10.1016/j.annals.2011.11.002
Hadwen, W., Arthington, A., Boon, P., Taylor, B. & Fellows, C. (2011). Do climatic or
institutional factors drive seasonal patterns of tourism visitation to Protected Areas
across diverse climate zones in Eastern Australia? Tourism Geograpies, Online.
Hamilton, J.M. & Lau, M. (2005). The role of climate information in tourist destination
choice decision-making. In Tourism and Global Environmental Change (pp. 229-250).
S. Gössling, and C.M. Hall (Eds.). London: Routledge.
Hein, L., Metzger, M. & Moreno, A. (2009). Potential impacts of climate change on tourism;
a case study for Spain. Current Opinion in Environmental Sustainability, 1, 170-178.
Hu, Y. & Ritchie, J. (1993). Measuring destination attractiveness: a contextual approach.
Journal of Travel Research, 32(2), 25-34.
Hyde, K. (1999). A hedonic perspective on independent vacation planning, decision-making
and behavior. In Consumer psychology of tourism, hospitality and leisure, A.

19
Woodside, G. Crouch, J. Mazanec, M. Oppermann and M. Sakai, eds., pp. 177–191.
Wallingford: CABI Publishing.
Jeuring, J. (2011). Intentions to seek severe weather information among travelers in New
Zealand. Master’s Thesis – Tourism, Leisure and Environment, Wageningen University
and Research Centre, The Netherlands.
Koetse, M.J. & Rietveld, R. (2009). The impact of climate change and weather on transport:
An overview of research findings. Transportation Research Part D.
Limb, M. & Spellman, G. (2001). Evaluating domestic tourists’ attitudes to British weather:
A qualitative approach. In Proceedings of the First International Workshop on Climate,
Tourism and Recreation. A. Matzarakis and C. R. de Freitas (Eds.), Report of a
Workshop held at Halkidiki, Greece, 5 -10 October. Available at (20/01/2011)
http://www.urbanclimate.net/cctr/ws/papers/full_report.pdf
Maddison, D. (2001). In search of warmer climates? The impact of climate change on flows
of British tourists. Climatic Change, 49, 193-2208.
Meyer, D. & Dewar, K. (1999). A new tool for investigating the effect of weather on visitor
numbers. Tourism Analysis, 4 (3/4), 145-155.
Mieczkowski, Z. (1985). “The Tourism Climatic Index: A Method of Evaluating World
Climates for Tourism.” Canadian Geographer, 29 (3): 220-233.
Ministry of Economic Development (2012). Core Tourism Data Set. Available at (29/07/12)
http://www.infotools.com/MEDviewer/?PageLocation=MED/CubePages/MED_IVS_T
ravelPatterns
Moreno, A., Amelung, B. & Santamarta, L. (2008). Linking Beach Recreation To Weather
Conditions. A Case Study In Zandvoort, Netherlands. Tourism in Marine
Environments, 5 (2/3),111-120.
Morgan, R., Gatell, E. Junyent, R. Micallef, A., Özhan E., & Williams, A.T. (2000). An
improved user-based beach climate index. Journal of Coastal Conservation, 6(1), 41-
50.
National Institute of Weather and Atmospheric Science (NIWA) (2008a). Overview of New
Zealand climate. Available at http://www.niwa.co.nz/education-and-
training/schools/resources/climate/overview
National Institute of Weather and Atmospheric Science (NIWA) (2008b). Summer 2009-10.
Available at (20/01/2012) http://www.niwa.co.nz/our-
science/climate/publications/all/cs/seasonal/summer-2009-10
Nyaupane, G. & Chhetri, N. (2009). Vulnerability to Climate Change of Nature-Based
Tourism in the Nepalese Himalayas. Tourism Geographies, 11(1), 95-119.
Oh, C.-O. H. (2001). Revisiting importance-performance analysis. Tourism Management,
22(6), 617-627.
Pearce, D. (1990). Tourism, the regions and restructuring in New Zealand. The Journal of
Tourism Studies 1(2): 33–42.
Pike, S. (2002). Destination image analysis – a review of 142 papers from 1973 to 2000.
Tourism Management, 23(5), 541-549.
Ritchie, B. (1998). Bicycle tourism in the South Island of New Zealand: planning and
management issues. Tourism Management, 19(6), 567-582.
Rossello-Nadal, J., Riera-Font, A. & Cardenas, V. (2011). The impact of weather variability
on British outbound flows. Climatic Change, 105, 281-292.
Rutty, M. & Scott, D. (2010). Will the Mediterranean Become “Too Hot” for Tourism? A
Reassessment. Tourism and Hospitality Planning & Development, 7(3), 267-281.
Ryan, C., & Huyton, J. (2002). Tourists and aboriginal people. Annals of Tourism Research,
29(3), 631-647.

20
Scott, D. & Jones, B. (2007). A regional comparison of the implications of climate change of
the golf industry in Canada. The Canadian Geographer, 51(2), 219-232.
Scott, D. & Lemieux, C. (2010). Weather and Climate Information for Tourism. Procedia
Environmental Sciences, 1, 146–183.
Scott, D., Jones, B. & Konopek, J. (2008a). Exploring the impact of climate-induced
environmental changes on future visitation to Canada’s Rocky Mountain National
Parks. Tourism Review International, 12, 43-56.
Scott, D., Gössling, S., & de Freitas, C. R. (2008b). Preferred climates for tourism: case
studies from Canada, New Zealand and Sweden. Climate Research, 38, 61-73.
Shih, C., Nicholls, S. & D. Holecek (2009). Impact of Weather on Downhill Ski Lift Ticket
Sales. Journal of Travel Research, 47(3): 359 - 372.
Smit, B. & Wandel, J. (2006). Adaptation, adaptive capacity and vulnerability. Global
Environmental Change-Human and Policy Dimensions, 16, 282-292.
Smith, K. (1993). The influence of weather and climate on recreation and tourism. Weather,
48, 398-404.
Tervo, K. (2008). The operational and regional vulnerability of winter tourism to climate
variability and change: the case of the Finnish nature-based tourism entrepreneurs.
Scandinavian Journal of Hospitality and Tourism, 8(4), 317-332.
Tourism New Zealand (1999-2010). Climate and weather. Available at
http://www.newzealand.com/travel/about-nz/nature/nature-climate-and-weather.cfm
Wilson, J. & Becken, S. (2011). Perceived Deficiencies in the Provision of Climate and
Weather Information for Tourism: A New Zealand Media Analysis. New Zealand
Geographer, 67(3), 148–160.
Woodside, A.G. & King, R.I. (2001).An updated model of travel and tourism purchase-
consumption systems. Journal of Travel and Tourism Marketing, 10 (1), 3–26.
Yu, G., Schwartz, Z. & Walsh, J.E. (2009). A weather-resolving index for assessing the
impact of climate change on tourism related climate resources. Climatic Change, 95 (3-
4), 551-573.
Table 1. Changes to trip timing, route and activities as a result of the weather (N=309)
No change Occasionally/To some
extent
Frequently/ Often
Number % Number % Number %
Timing 187 61 100 32 22 7
Route 228 74 71 23 10 3
Activity 150 49 146 47 13 4

21
Table 2. Key data describing research sample by ‘travel change’ group (N=309)
Sample characteristics Number
(%)
No changes
%
Some
changes%
Substantial
changes %
Country of
residence
Germany 63 (20.4) 31.7 49.2 19.0
UK 49 (15.9) 44.9 36.7 18.4
Other Europe (inc. Netherlands
and Switzerland)
101 (32.7) 35.6 51.5 12.9
USA/Canada 37 (12.0) 32.4 51.4 16.2
Australia 31 (10.0) 48.4 32.3 19.4
Asia and Other 28 (9.1) 28.6 53.6 17.9
Age*
(X2=13.091,
df= 6, p=
0.031)
18-25 yrs 60 (19.4) 26.7 61.7 11.7
26-40 yrs 126 (40.8) 37.3 46.0 16.7
41-55 yrs 72 (23.3) 31.9 44.4 23.6
Over 56 yrs 51 (16.5) 52.9 35.3 11.8
Number of
previous
visits
No previous 201 (65.0) 35.8 45.3 18.9
One previous 73 (23.6) 32.9 53.4 13.7
Two or more previous1)
35 (11.3) 48.6 42.9 8.6
Main
transport
mode
Campervan 153 (49.5) 30.1 49.0 20.9
Car (rental/private) 73 (23.6) 42.5 43.8 13.7
Tour (bus/cruise) 46 (14.9) 50.0 45.7 4.3
Public transport/independent 37 (12.0) 35.1 45.9 18.9
Length of
stay
Short (≤ 2 weeks) 54 (17.5) 48.1 33.3 18.5
Medium (> 2 weeks ≤ 1 month) 162 (52.4) 37.0 47.5 15.4
Long (> 1 month) 93 (30.1) 29.0 53.8 17.2
* Significant at the 5% level.
1) One cell has less than 5 counts, however, aggregation into two groups did not reveal any different results.

22
Table 3. Chi-square results for planning, information and satisfaction variables by ‘travel
change’ group.
Number (%) No changes
%
Some
changes %
Substantial
changes %
Chi-
square
p-value
Weather
different to
expected
(N=309)
Yes 188 (60.8) 31.9 47.9 20.2 .031
No 121 (39.2) 43.8 45.5 10.7
Nature of
difference
(N=175)
Worse 88 (50.3) 18.2 56.8 25.0 0.001
Better 52 (29.7) 51.9 34.6 13.5
Different 35 (20.0) 40.0 42.9 17.1
Weather
information
whilst travelling
(N=308)
No 65 (21.1) 58.5 30.8 10.8 .000
Occasionally 165 (53.6) 32.1 54.5 13.3
Regularly 78 (25.3) 26.9 44.9 28.2
Weather
influence on
satisfaction
(N=308)1)
Positively 134 (43.5) 48.5 38.8 12.7 .000
Little or no
influence
151 (49.0) 29.8 55.0 15.2
Negatively 23 (7.5) 8.7 43.5 47.5
1) One cell has less than 5 counts.

23
Figure 1. Number of respondents who reported no changes to timing, route and activity by
survey period.
81
106 103
125
56
94
0
20
40
60
80
100
120
140
Early summer Late summer
No changes
Nu
mb
er
(N=3
09
)
Timing
Route
Activity

24
Figure 2. Prevalence of travel change groups (‘no change’, ‘some change’, ‘substantial change’)
for total sample and by survey period.
113
38 75
145
81
64
51
29 22
0
50
100
150
200
250
300
350
Total sample Early summer Late summer
Nu
mb
er
(N=3
09
) Substantial changes
Some changes
No changes
25
Figure 3. The impact of weather on satisfaction by travel change group (‘no change’, ‘some
change’, ‘substantial change’) and survey period (%).
10.8 11.5
2.7
14.9
38.5
10.8
4.7 6.1
No changes Some changes Substantial changes
Early summer
Positively Little or no influence Negatively
30.6
21.9
8.1
14.4 16.3
4.4 1.3 1.9 1.3
No changes Some changes Substantial changes
Late summer
Positively Little or no influence Negatively

26
Figure 4. Conceptual framework for tourist adaptation to weather.
Change not
possible
International tourists visiting NZ
(trip planning, weather preparedness, expectations,
demographics, travel experience, etc.)
Chose to
change
In line with plans
(as expected)
Encounter
weather
Different (usually
worse than expected)
Change
possible
Chose not to
change
No travel
change
Some travel
change
Substantial
travel change
Information
Info
rmat
ion