clearfield retail center - loopnet · actual market value after vacancy & leasing expenses...
TRANSCRIPT
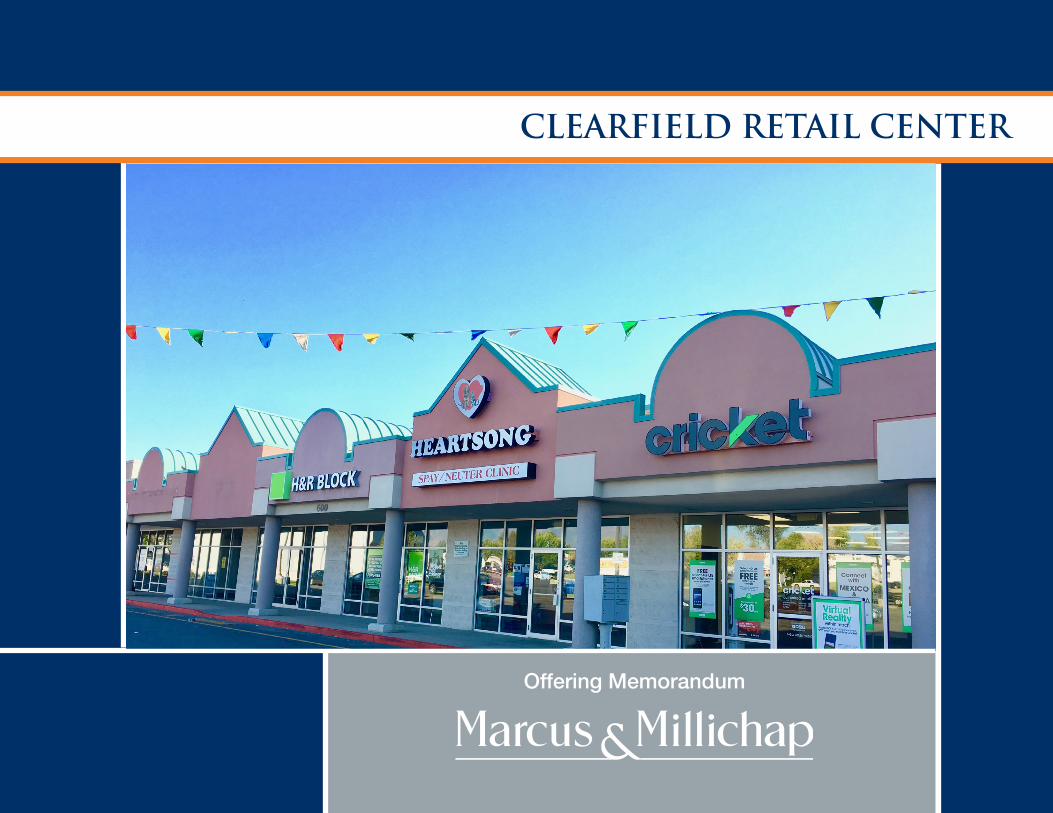
Offering Memorandum
CLEARFIELD RETAIL CENTER
Marcus & Millichap Real Estate Investment Services, Inc. (“M&M”) is not affiliated with, sponsored by, or endorsed by any commercial tenant or lessee identified in this marketing package. The presence of any corporation’s logo or name is not intended to indicate or imply affiliation with, or sponsorship or endorsement by, said corporation of M&M, its affiliates or subsidiaries, or any agent, product, service, or commercial listing of M&M, and is solely included for the purpose of providing tenant lessee information about this listing to prospective customers.
Marcus & Millichap is not affiliated with, sponsored by, or endorsed by any commercial tenant or lessee identified in this marketing package. The presence of any corporation’s logo or name is not intended to indicate or imply affiliation with, or sponsorship or endorsement by, said corporation of Marcus & Millichap, its affiliates or subsidiaries, or any agent, product, service, or commercial listing of Marcus & Millichap, and is solely included for the purpose of providing tenant lessee information about this listing to prospective customers.
ALL PROPERTY SHOWINGS ARE BY APPOINTMENT ONLY. PLEASE CONSULT YOURMARCUS & MILLICHAP AGENT FOR MORE DETAILS.
NON-ENDORSEMENT NOTICE
OFFICES NATIONWIDEwww.marcusmillichap.com
C l e a r f i e l d , U t a h
CLEARFIELD RETAIL CENTER
analysisM A R K E T A N D P R O P E R T Y A N A LY S I S

5This information has been secured from sources we believe to be reliable, but we make no representations or warranties, express or implied, as to the accuracy of the information. References to square footage or age are approximate. Buyer must verify the information and bears all risk for any inaccuracies. Any projections, opinions, assumptions or estimates herein are for example purposes only and do not represent the current of future performance of the property. Marcus & Millichap is a service mark of Marcus & Millichap Real Estate Investment Services, Inc. © 2016 Marcus & Millichap. All rights reserved.
This information has been secured from sources we believe to be reliable, but we make no representations or warranties, express or implied, as to the accuracy of the information. References to square footage or age are approximate. Buyer must verify the information and bears all risk for any inaccuracies. Any projections, opinions, assumptions or estimates herein are for example purposes only and do not represent the current of future performance of the property. Marcus & Millichap is a service mark of Marcus & Millichap Real Estate Investment Services, Inc. © 2016 Marcus & Millichap. All rights reserved.
Executive Summary
Clearfield Retail Center
TENANT GLA % of GLA LEASE EXP
Cricket Wireless 1,800 SF 19% 11/30/2019
Heartsong Spay/Neuter 1,500 SF 16% 7/31/2018
H&R Block 1,500 SF 16% 4/30/2018
Vacant 4,496 SF 48% N/A
Major Tenants
CLEARFIELD RETAIL CENTER600 South State StreetClearfield, UT 84015
INCOME CURRENT PRO FORMA
Base Rent / Occupied Space $58,647 $58,647
Base Rent / Vacant Space at Market Rents $49,456 $49,456
Gross Potential Rent $108,103 $108,103
Expense Reimbursments $25,170 $25,170
Gross Potential Income $133,273 $133,273
Vacancy/Uncollected CAM $62,056 5% / $6,664
Effective Gross Income $71,217 $126,609
Total Expenses $25,170 $25,170
Net Operating Income $46,047 $101,439
Annualized Operating Data
Investment Highlights�� Anchored by 39,000 SF Kent’s Market Grocery
�� Excellent Upside Opportunity with 48% Vacancy
�� Combined Traffic Counts in Excess of 30,075
�� 75 Free Surface Parking Spaces; 8 stalls per 1000 SF
�� Nearby Tenants Include Family Dollar, First National Bank, Kent’s Market, & Tai’pan Trading
�� Population of 187,809 within a 5-Mile Radius
Offering SummaryOffering Price $1,205,000
Total Gross Leasable Area (GLA) 9,296 SF
Price/SF $129.63
Cap Rate - Current 3.82%
Cap Rate - Pro Forma 8.42%
Year Built 2000
Lot Size 0.64 Acres
PRO FORMA MARKET VALUE - INCOME CAPITALIZATION APPROACH: Cap Rate
PRO FORMA MARKET VALUE (INCOME) 7.00% $1,449,130
6This information has been secured from sources we believe to be reliable, but we make no representations or warranties, express or implied, as to the accuracy of the information. References to square footage or age are approximate. Buyer must verify the information and bears all risk for any inaccuracies. Any projections, opinions, assumptions or estimates herein are for example purposes only and do not represent the current of future performance of the property. Marcus & Millichap is a service mark of Marcus & Millichap Real Estate Investment Services, Inc. © 2016 Marcus & Millichap. All rights reserved.
This information has been secured from sources we believe to be reliable, but we make no representations or warranties, express or implied, as to the accuracy of the information. References to square footage or age are approximate. Buyer must verify the information and bears all risk for any inaccuracies. Any projections, opinions, assumptions or estimates herein are for example purposes only and do not represent the current of future performance of the property. Marcus & Millichap is a service mark of Marcus & Millichap Real Estate Investment Services, Inc. © 2016 Marcus & Millichap. All rights reserved.
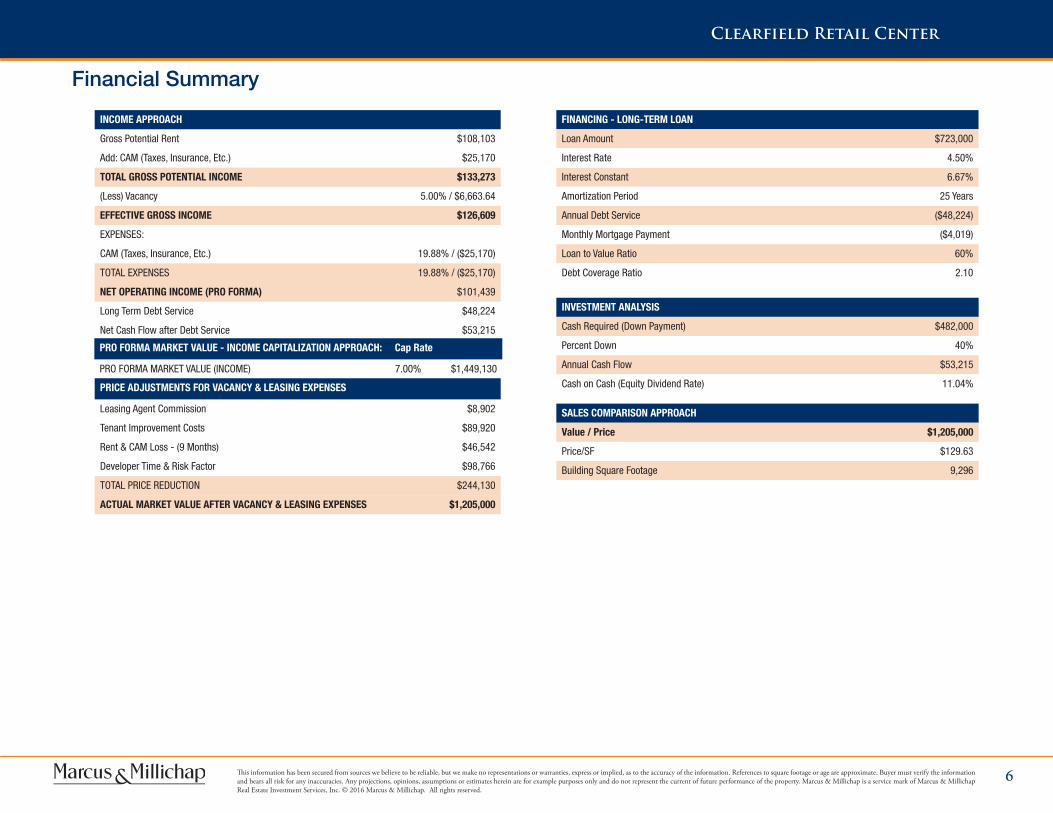
Financial Summary
Clearfield Retail Center
FINANCING - LONG-TERM LOAN
Loan Amount $723,000
Interest Rate 4.50%
Interest Constant 6.67%
Amortization Period 25 Years
Annual Debt Service ($48,224)
Monthly Mortgage Payment ($4,019)
Loan to Value Ratio 60%
Debt Coverage Ratio 2.10
INCOME APPROACH
Gross Potential Rent $108,103
Add: CAM (Taxes, Insurance, Etc.) $25,170
TOTAL GROSS POTENTIAL INCOME $133,273
(Less) Vacancy 5.00% / $6,663.64
EFFECTIVE GROSS INCOME $126,609
EXPENSES:
CAM (Taxes, Insurance, Etc.) 19.88% / ($25,170)
TOTAL EXPENSES 19.88% / ($25,170)
NET OPERATING INCOME (PRO FORMA) $101,439
Long Term Debt Service $48,224
Net Cash Flow after Debt Service $53,215
PRICE ADJUSTMENTS FOR VACANCY & LEASING EXPENSES
Leasing Agent Commission $8,902
Tenant Improvement Costs $89,920
Rent & CAM Loss - (9 Months) $46,542
Developer Time & Risk Factor $98,766
TOTAL PRICE REDUCTION $244,130
ACTUAL MARKET VALUE AFTER VACANCY & LEASING EXPENSES $1,205,000
INVESTMENT ANALYSIS
Cash Required (Down Payment) $482,000
Percent Down 40%
Annual Cash Flow $53,215
Cash on Cash (Equity Dividend Rate) 11.04%
SALES COMPARISON APPROACH
Value / Price $1,205,000
Price/SF $129.63
Building Square Footage 9,296
7This information has been secured from sources we believe to be reliable, but we make no representations or warranties, express or implied, as to the accuracy of the information. References to square footage or age are approximate. Buyer must verify the information and bears all risk for any inaccuracies. Any projections, opinions, assumptions or estimates herein are for example purposes only and do not represent the current of future performance of the property. Marcus & Millichap is a service mark of Marcus & Millichap Real Estate Investment Services, Inc. © 2016 Marcus & Millichap. All rights reserved.
This information has been secured from sources we believe to be reliable, but we make no representations or warranties, express or implied, as to the accuracy of the information. References to square footage or age are approximate. Buyer must verify the information and bears all risk for any inaccuracies. Any projections, opinions, assumptions or estimates herein are for example purposes only and do not represent the current of future performance of the property. Marcus & Millichap is a service mark of Marcus & Millichap Real Estate Investment Services, Inc. © 2016 Marcus & Millichap. All rights reserved.
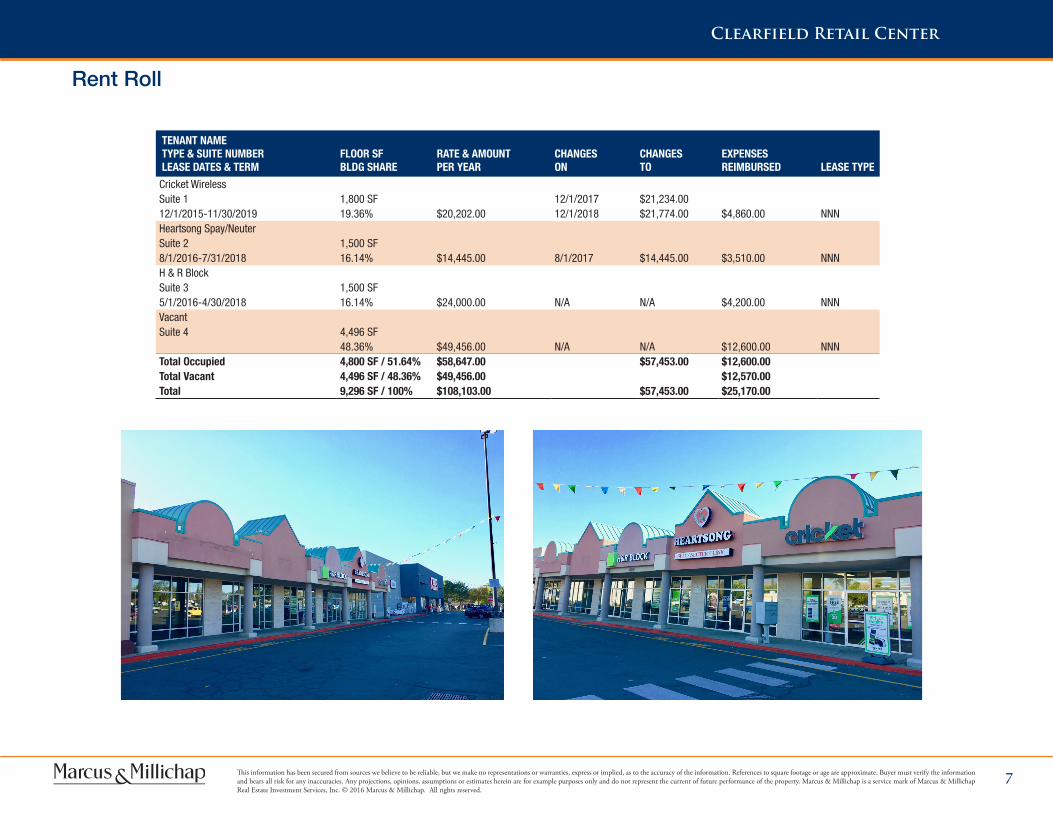
Rent Roll
Clearfield Retail Center
TENANT NAME TYPE & SUITE NUMBER LEASE DATES & TERM
FLOOR SFBLDG SHARE
RATE & AMOUNTPER YEAR
CHANGESON
CHANGESTO
EXPENSES REIMBURSED LEASE TYPE
Cricket WirelessSuite 1 1,800 SF 12/1/2017 $21,234.0012/1/2015-11/30/2019 19.36% $20,202.00 12/1/2018 $21,774.00 $4,860.00 NNNHeartsong Spay/NeuterSuite 2 1,500 SF8/1/2016-7/31/2018 16.14% $14,445.00 8/1/2017 $14,445.00 $3,510.00 NNNH & R BlockSuite 3 1,500 SF5/1/2016-4/30/2018 16.14% $24,000.00 N/A N/A $4,200.00 NNNVacantSuite 4 4,496 SF
48.36% $49,456.00 N/A N/A $12,600.00 NNNTotal Occupied 4,800 SF / 51.64% $58,647.00 $57,453.00 $12,600.00Total Vacant 4,496 SF / 48.36% $49,456.00 $12,570.00Total 9,296 SF / 100% $108,103.00 $57,453.00 $25,170.00

8This information has been secured from sources we believe to be reliable, but we make no representations or warranties, express or implied, as to the accuracy of the information. References to square footage or age are approximate. Buyer must verify the information and bears all risk for any inaccuracies. Any projections, opinions, assumptions or estimates herein are for example purposes only and do not represent the current of future performance of the property. Marcus & Millichap is a service mark of Marcus & Millichap Real Estate Investment Services, Inc. © 2016 Marcus & Millichap. All rights reserved.
This information has been secured from sources we believe to be reliable, but we make no representations or warranties, express or implied, as to the accuracy of the information. References to square footage or age are approximate. Buyer must verify the information and bears all risk for any inaccuracies. Any projections, opinions, assumptions or estimates herein are for example purposes only and do not represent the current of future performance of the property. Marcus & Millichap is a service mark of Marcus & Millichap Real Estate Investment Services, Inc. © 2016 Marcus & Millichap. All rights reserved.
Lease Expiration Schedule
PRICING AND FINANCIAL ANALYSISClearfield Retail CenterCLEARFIELD, UT
THIS IS A BROKER PRICE OPINION OR COMPARATIVE MARKET ANALYSIS AND SHOULD NOT BE CONSIDERED ANAPPRAISAL. This information has been secured from sources we believe to be reliable, but we make no representations or warranties, expressed orimplied, as to the accuracy of the information. References to square footage or age are approximate. Buyer must verify the information and bearsall risk for any inaccuracies. Marcus & Millichap is a trademark of Marcus & Millichap Real Estate Investment Services of Denver, Inc. © 2016Marcus & Millichap. All rights reserved.
For The Year Beginning Year 1Jan 2016
Year 2Jan 2017
Year 3Jan 2018
Year 4Jan 2019
Year 5Jan 2020
Year 6Jan 2021
Year 7Jan 2022
Year 8Jan 2023
Year 9Jan 2024
Year 10Jan 2025
Tenant(s) Name HeartsongSpay/Neuter
ClinicH & R Block
CricketWireless
Total Number of Tenants 2 1
Total Square Feet 3,000 1,800
Total Percentage 32.3% 19.4%
Cumulative Percentage 32.3% 51.6%
Percentage of SF Expiring Number of Tenants Expiring Cumulative % of SF Expiring
0%
5%
10%
15%
20%
25%
30%
35%
40%
45%
50%
Tota
l Pro
ject S
quar
e Fo
otag
e
0
1
2
Num
ber o
f Ten
ants
Jan 20160%
Jan 20170%
Jan 201832%
Jan 201919%
Jan 20200%
Jan 20210%
Jan 20220%
Jan 20230%
Jan 20240%
Jan 20250%
LEASE EXPIRATION SUMMARY
Any projections, opinions, assumptions or estimates used here within are for example purposes only and do not represent the current or future performance of the property.
Clearfield Retail Center
Year 1 Year 2 Year 3 Year 4 Year 5 Year 6 Year 7 Year 8 Year 9 Year 10For The Year Ending JAN-2016 JAN-2017 JAN-2018 JAN-2019 JAN-2020 JAN-2021 JAN-2022 JAN-2023 JAN-2024 JAN-2025
Tena
nts
Expi
ring
Heartsong Spay/Neuter ClinicH & R Block
Cricket Wireless
Total Number of Tenants 2 1
Total Square Feet 3,000 1,800
Total Percentage 32.3% 19.4%
Cumulative Percentage 32.3% 51.6%

9This information has been secured from sources we believe to be reliable, but we make no representations or warranties, express or implied, as to the accuracy of the information. References to square footage or age are approximate. Buyer must verify the information and bears all risk for any inaccuracies. Any projections, opinions, assumptions or estimates herein are for example purposes only and do not represent the current of future performance of the property. Marcus & Millichap is a service mark of Marcus & Millichap Real Estate Investment Services, Inc. © 2016 Marcus & Millichap. All rights reserved.
This information has been secured from sources we believe to be reliable, but we make no representations or warranties, express or implied, as to the accuracy of the information. References to square footage or age are approximate. Buyer must verify the information and bears all risk for any inaccuracies. Any projections, opinions, assumptions or estimates herein are for example purposes only and do not represent the current of future performance of the property. Marcus & Millichap is a service mark of Marcus & Millichap Real Estate Investment Services, Inc. © 2016 Marcus & Millichap. All rights reserved.
Tenant and Lease Summaries
Lease Summary
Clearfield Retail Center
Cricket Wireless is a prepaid wireless service provider in the United States. Headquar-tered in Atlanta, GA, they offer voice, text, and data plans at competitive prices. In July of 2013, AT&T Inc. agreed to buy Cricket Wireless’ parent company, Leap Wireless, for $1.2 billion and was finalized in April of 2014. Cricket now has over 3800 stores cover-ing customers across the United States.
Cricket Wireless
Lease Commencement 12/1/2015
Lease Expiration 11/30/2019
Gross Leasable Area 1,800 SF
Original Term 4 Years
Pro Rata Share of Project 19%
Headquartered Atlanta, Georgia
No. of Locations 3800+
Website https://www.cricketwireless.com
Lease Years Annual Rent Monthly Rent Annual Rent/SF
12/1/2015-11/30/16 $20,202.00 $1,684 $11.28
12/1/2016-11/30/2017 $20,694.00 $1,725 $11.52
12/1/2017-11/30/2018 $21,234.00 $1,770 $11.76
12/1/2018 - 11/30/2019 $21,774.00 $1,815 $12.12

10This information has been secured from sources we believe to be reliable, but we make no representations or warranties, express or implied, as to the accuracy of the information. References to square footage or age are approximate. Buyer must verify the information and bears all risk for any inaccuracies. Any projections, opinions, assumptions or estimates herein are for example purposes only and do not represent the current of future performance of the property. Marcus & Millichap is a service mark of Marcus & Millichap Real Estate Investment Services, Inc. © 2016 Marcus & Millichap. All rights reserved.
This information has been secured from sources we believe to be reliable, but we make no representations or warranties, express or implied, as to the accuracy of the information. References to square footage or age are approximate. Buyer must verify the information and bears all risk for any inaccuracies. Any projections, opinions, assumptions or estimates herein are for example purposes only and do not represent the current of future performance of the property. Marcus & Millichap is a service mark of Marcus & Millichap Real Estate Investment Services, Inc. © 2016 Marcus & Millichap. All rights reserved.
Tenant and Lease Summaries
Lease Summary
Clearfield Retail Center
Heartsong Spay Neuter Clinic’s mission is to provide high quality, low cost spays and neuters “to stop the killing of our nations ‘surplus’ pet population.” The clinic was founded by Loretta & Erik Emmons who originally started a 501(c) 3 non profit rescue but realized it wasn’t doing enough to save the many lives of pets in their own coun-try. They came up with a better way to ebb the tide of pet overpopulation. Heartsong already has 3 locations in the United States including Utah, Georgia, & South Carolina with more stores opening and franchise opportunities available.
Heartsong Spay/Neuter Clinic
Lease Commencement 8/1/2016
Lease Expiration 7/31/2018
Gross Leasable Area 1,500 SF
Original Term 2 Years
Pro Rata Share of Project 16%
Headquartered N/A
No. of Locations N/A
Website www.heartsongspayneuter.com
Lease Years Annual Rent Monthly Rent Annual Rent/SF
8/1/2016-7/31/2017 $14,444.76 $1,204 $9.60
8/1/2017-7/31/2018 $14,733.00 $1,228 $9.84

11This information has been secured from sources we believe to be reliable, but we make no representations or warranties, express or implied, as to the accuracy of the information. References to square footage or age are approximate. Buyer must verify the information and bears all risk for any inaccuracies. Any projections, opinions, assumptions or estimates herein are for example purposes only and do not represent the current of future performance of the property. Marcus & Millichap is a service mark of Marcus & Millichap Real Estate Investment Services, Inc. © 2016 Marcus & Millichap. All rights reserved.
This information has been secured from sources we believe to be reliable, but we make no representations or warranties, express or implied, as to the accuracy of the information. References to square footage or age are approximate. Buyer must verify the information and bears all risk for any inaccuracies. Any projections, opinions, assumptions or estimates herein are for example purposes only and do not represent the current of future performance of the property. Marcus & Millichap is a service mark of Marcus & Millichap Real Estate Investment Services, Inc. © 2016 Marcus & Millichap. All rights reserved.
Tenant and Lease Summaries
Lease Summary
Clearfield Retail Center
H & R Block is a tax preparation company in North America, Austrailia, Brazil and India. The Kansas City-based company also offers banking, payroll, personal finance and buisness consulting services. Founded in 1955 by brothers Henry W. Bloch & Richard Bloch, Block now operates approximately 12,000 stores worldwide and employs over 90,000 tax preparers. Revenue in 2015 was $3.1 billion with total equity at $1.8 bil-lion as of 2015. In January 2016, H & R Block launched Block Advisors, a service that provides year-round consumer tax preparation.
H & R Block
Lease Commencement 8/1/2016
Lease Expiration 7/31/2018
Gross Leasable Area 1,500 SF
Original Term 2 Years
Pro Rata Share of Project 16%
Headquartered Kansas City, MO
No. of Locations 12,000
Website www.hrblock.com
Lease Years Annual Rent Monthly Rent Annual Rent/SF
5/1/2016-4/30/2018 $24,000.00 $2,000 $15.96
12This information has been secured from sources we believe to be reliable, but we make no representations or warranties, express or implied, as to the accuracy of the information. References to square footage or age are approximate. Buyer must verify the information and bears all risk for any inaccuracies. Any projections, opinions, assumptions or estimates herein are for example purposes only and do not represent the current of future performance of the property. Marcus & Millichap is a service mark of Marcus & Millichap Real Estate Investment Services, Inc. © 2016 Marcus & Millichap. All rights reserved.
This information has been secured from sources we believe to be reliable, but we make no representations or warranties, express or implied, as to the accuracy of the information. References to square footage or age are approximate. Buyer must verify the information and bears all risk for any inaccuracies. Any projections, opinions, assumptions or estimates herein are for example purposes only and do not represent the current of future performance of the property. Marcus & Millichap is a service mark of Marcus & Millichap Real Estate Investment Services, Inc. © 2016 Marcus & Millichap. All rights reserved.
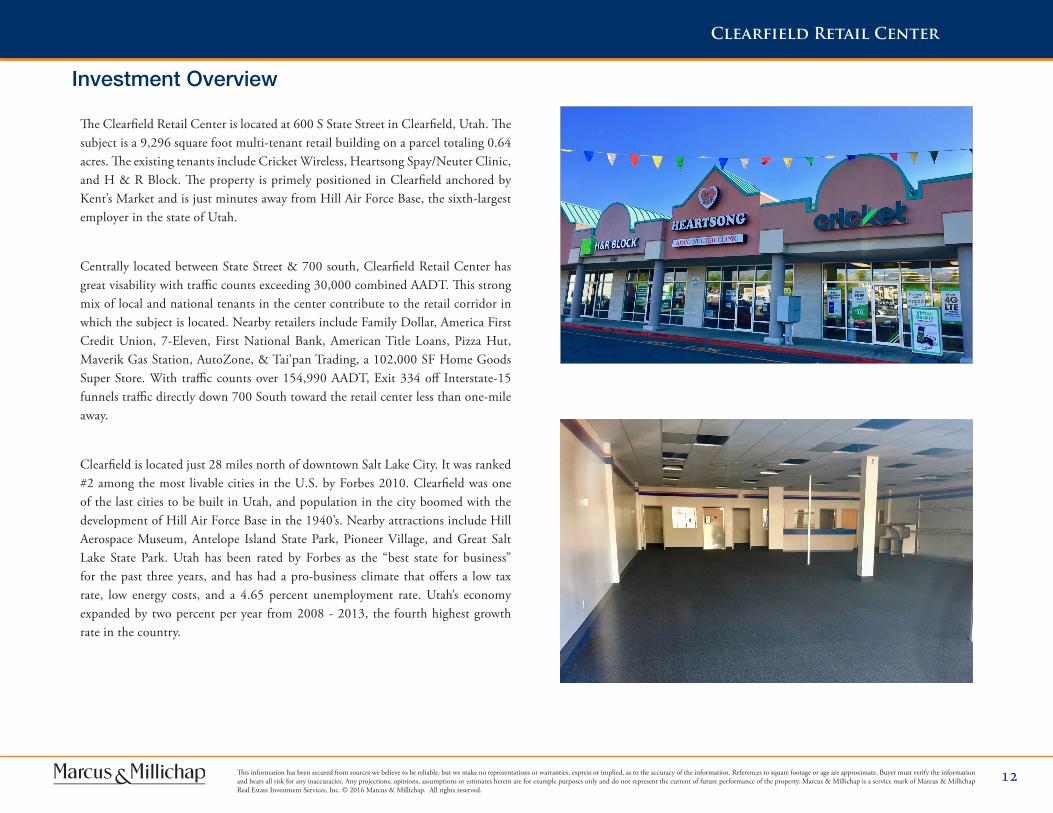
Investment Overview
Clearfield Retail Center
The Clearfield Retail Center is located at 600 S State Street in Clearfield, Utah. The subject is a 9,296 square foot multi-tenant retail building on a parcel totaling 0.64 acres. The existing tenants include Cricket Wireless, Heartsong Spay/Neuter Clinic, and H & R Block. The property is primely positioned in Clearfield anchored by Kent’s Market and is just minutes away from Hill Air Force Base, the sixth-largest employer in the state of Utah.
Centrally located between State Street & 700 south, Clearfield Retail Center has great visability with traffic counts exceeding 30,000 combined AADT. This strong mix of local and national tenants in the center contribute to the retail corridor in which the subject is located. Nearby retailers include Family Dollar, America First Credit Union, 7-Eleven, First National Bank, American Title Loans, Pizza Hut, Maverik Gas Station, AutoZone, & Tai’pan Trading, a 102,000 SF Home Goods Super Store. With traffic counts over 154,990 AADT, Exit 334 off Interstate-15 funnels traffic directly down 700 South toward the retail center less than one-mile away.
Clearfield is located just 28 miles north of downtown Salt Lake City. It was ranked #2 among the most livable cities in the U.S. by Forbes 2010. Clearfield was one of the last cities to be built in Utah, and population in the city boomed with the development of Hill Air Force Base in the 1940’s. Nearby attractions include Hill Aerospace Museum, Antelope Island State Park, Pioneer Village, and Great Salt Lake State Park. Utah has been rated by Forbes as the “best state for business” for the past three years, and has had a pro-business climate that offers a low tax rate, low energy costs, and a 4.65 percent unemployment rate. Utah’s economy expanded by two percent per year from 2008 - 2013, the fourth highest growth rate in the country.
13This information has been secured from sources we believe to be reliable, but we make no representations or warranties, express or implied, as to the accuracy of the information. References to square footage or age are approximate. Buyer must verify the information and bears all risk for any inaccuracies. Any projections, opinions, assumptions or estimates herein are for example purposes only and do not represent the current of future performance of the property. Marcus & Millichap is a service mark of Marcus & Millichap Real Estate Investment Services, Inc. © 2016 Marcus & Millichap. All rights reserved.
This information has been secured from sources we believe to be reliable, but we make no representations or warranties, express or implied, as to the accuracy of the information. References to square footage or age are approximate. Buyer must verify the information and bears all risk for any inaccuracies. Any projections, opinions, assumptions or estimates herein are for example purposes only and do not represent the current of future performance of the property. Marcus & Millichap is a service mark of Marcus & Millichap Real Estate Investment Services, Inc. © 2016 Marcus & Millichap. All rights reserved.
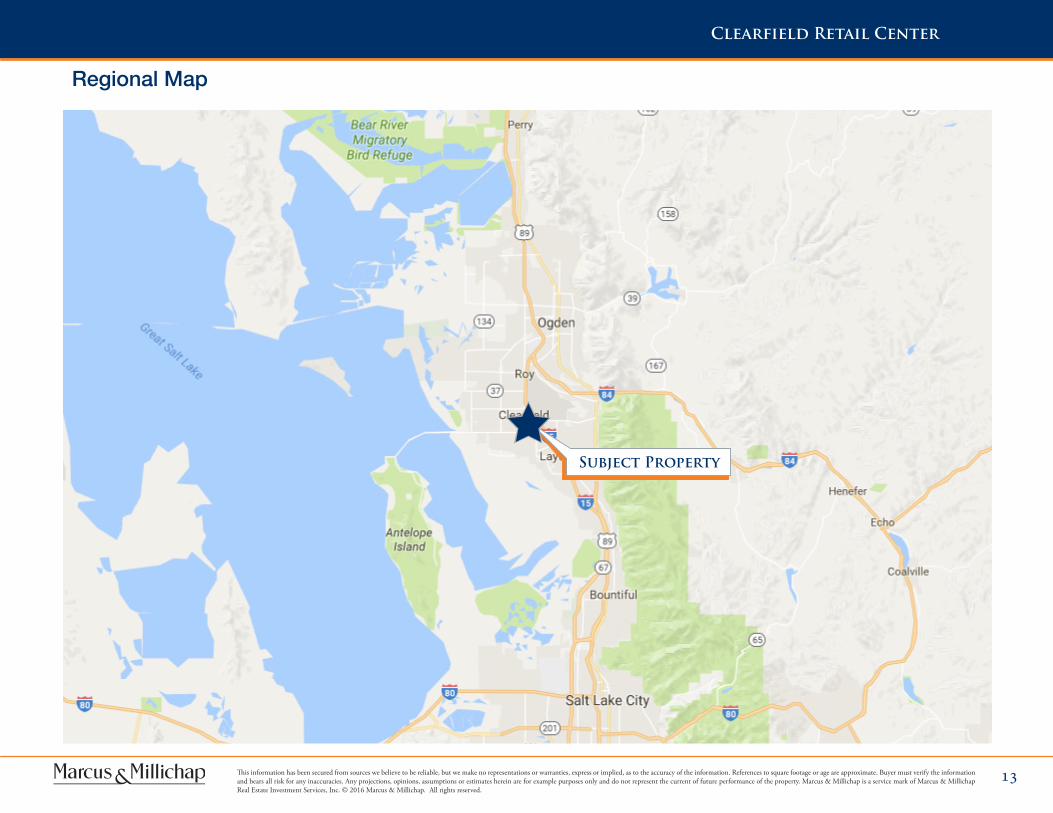
Regional Map
Clearfield Retail Center
Subject Property

14This information has been secured from sources we believe to be reliable, but we make no representations or warranties, express or implied, as to the accuracy of the information. References to square footage or age are approximate. Buyer must verify the information and bears all risk for any inaccuracies. Any projections, opinions, assumptions or estimates herein are for example purposes only and do not represent the current of future performance of the property. Marcus & Millichap is a service mark of Marcus & Millichap Real Estate Investment Services, Inc. © 2016 Marcus & Millichap. All rights reserved.
This information has been secured from sources we believe to be reliable, but we make no representations or warranties, express or implied, as to the accuracy of the information. References to square footage or age are approximate. Buyer must verify the information and bears all risk for any inaccuracies. Any projections, opinions, assumptions or estimates herein are for example purposes only and do not represent the current of future performance of the property. Marcus & Millichap is a service mark of Marcus & Millichap Real Estate Investment Services, Inc. © 2016 Marcus & Millichap. All rights reserved.
Local Map
Clearfield Retail Center
Subject Property

15This information has been secured from sources we believe to be reliable, but we make no representations or warranties, express or implied, as to the accuracy of the information. References to square footage or age are approximate. Buyer must verify the information and bears all risk for any inaccuracies. Any projections, opinions, assumptions or estimates herein are for example purposes only and do not represent the current of future performance of the property. Marcus & Millichap is a service mark of Marcus & Millichap Real Estate Investment Services, Inc. © 2016 Marcus & Millichap. All rights reserved.
This information has been secured from sources we believe to be reliable, but we make no representations or warranties, express or implied, as to the accuracy of the information. References to square footage or age are approximate. Buyer must verify the information and bears all risk for any inaccuracies. Any projections, opinions, assumptions or estimates herein are for example purposes only and do not represent the current of future performance of the property. Marcus & Millichap is a service mark of Marcus & Millichap Real Estate Investment Services, Inc. © 2016 Marcus & Millichap. All rights reserved.
Aerial Photo
Clearfield Retail Center
Subject Property

North Davis Junior High
School
Clearfield High School
Subject Property
16This information has been secured from sources we believe to be reliable, but we make no representations or warranties, express or implied, as to the accuracy of the information. References to square footage or age are approximate. Buyer must verify the information and bears all risk for any inaccuracies. Any projections, opinions, assumptions or estimates herein are for example purposes only and do not represent the current of future performance of the property. Marcus & Millichap is a service mark of Marcus & Millichap Real Estate Investment Services, Inc. © 2016 Marcus & Millichap. All rights reserved.
This information has been secured from sources we believe to be reliable, but we make no representations or warranties, express or implied, as to the accuracy of the information. References to square footage or age are approximate. Buyer must verify the information and bears all risk for any inaccuracies. Any projections, opinions, assumptions or estimates herein are for example purposes only and do not represent the current of future performance of the property. Marcus & Millichap is a service mark of Marcus & Millichap Real Estate Investment Services, Inc. © 2016 Marcus & Millichap. All rights reserved.
Retail Market
Clearfield Retail Center
17This information has been secured from sources we believe to be reliable, but we make no representations or warranties, express or implied, as to the accuracy of the information. References to square footage or age are approximate. Buyer must verify the information and bears all risk for any inaccuracies. Any projections, opinions, assumptions or estimates herein are for example purposes only and do not represent the current of future performance of the property. Marcus & Millichap is a service mark of Marcus & Millichap Real Estate Investment Services, Inc. © 2016 Marcus & Millichap. All rights reserved.
This information has been secured from sources we believe to be reliable, but we make no representations or warranties, express or implied, as to the accuracy of the information. References to square footage or age are approximate. Buyer must verify the information and bears all risk for any inaccuracies. Any projections, opinions, assumptions or estimates herein are for example purposes only and do not represent the current of future performance of the property. Marcus & Millichap is a service mark of Marcus & Millichap Real Estate Investment Services, Inc. © 2016 Marcus & Millichap. All rights reserved.
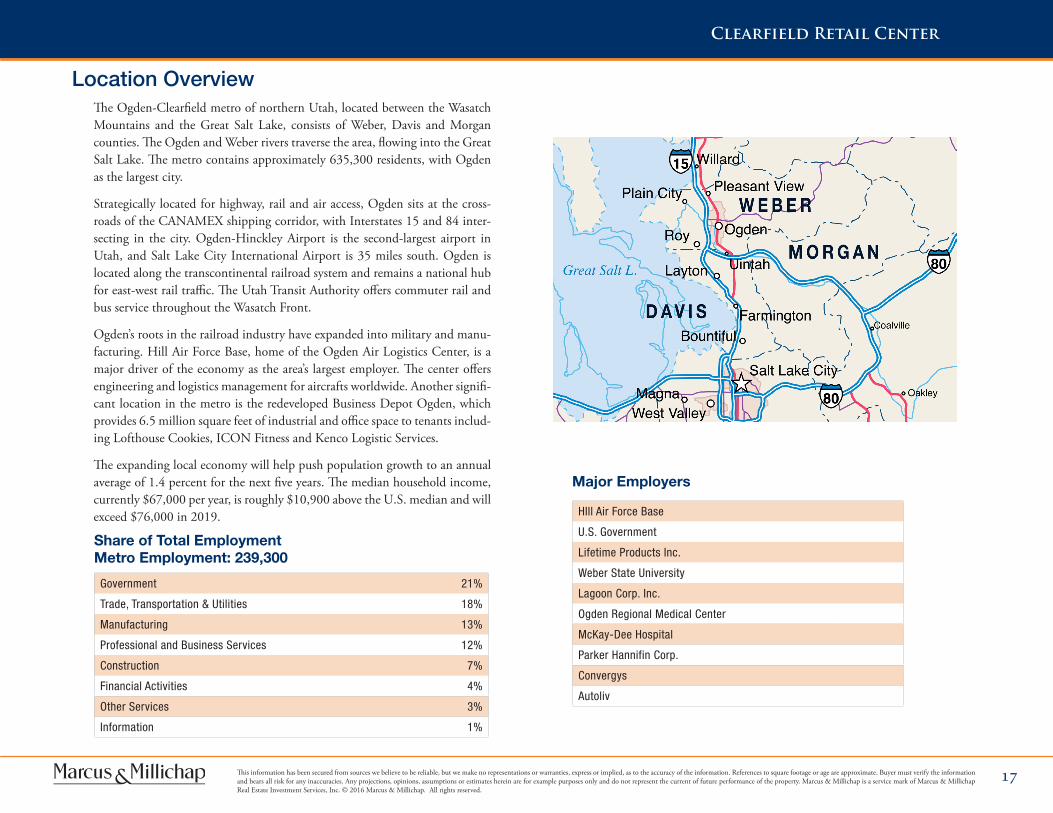
Location Overview
Clearfield Retail Center
The Ogden-Clearfield metro of northern Utah, located between the Wasatch Mountains and the Great Salt Lake, consists of Weber, Davis and Morgan counties. The Ogden and Weber rivers traverse the area, flowing into the Great Salt Lake. The metro contains approximately 635,300 residents, with Ogden as the largest city.
Strategically located for highway, rail and air access, Ogden sits at the cross-roads of the CANAMEX shipping corridor, with Interstates 15 and 84 inter-secting in the city. Ogden-Hinckley Airport is the second-largest airport in Utah, and Salt Lake City International Airport is 35 miles south. Ogden is located along the transcontinental railroad system and remains a national hub for east-west rail traffic. The Utah Transit Authority offers commuter rail and bus service throughout the Wasatch Front.
Ogden’s roots in the railroad industry have expanded into military and manu-facturing. Hill Air Force Base, home of the Ogden Air Logistics Center, is a major driver of the economy as the area’s largest employer. The center offers engineering and logistics management for aircrafts worldwide. Another signifi-cant location in the metro is the redeveloped Business Depot Ogden, which provides 6.5 million square feet of industrial and office space to tenants includ-ing Lofthouse Cookies, ICON Fitness and Kenco Logistic Services.
The expanding local economy will help push population growth to an annual average of 1.4 percent for the next five years. The median household income, currently $67,000 per year, is roughly $10,900 above the U.S. median and will exceed $76,000 in 2019.
Government 21%
Trade, Transportation & Utilities 18%
Manufacturing 13%
Professional and Business Services 12%
Construction 7%
Financial Activities 4%
Other Services 3%
Information 1%
HIll Air Force Base
U.S. Government
Lifetime Products Inc.
Weber State University
Lagoon Corp. Inc.
Ogden Regional Medical Center
McKay-Dee Hospital
Parker Hannifin Corp.
Convergys
Autoliv
Major Employers
Share of Total EmploymentMetro Employment: 239,300
18This information has been secured from sources we believe to be reliable, but we make no representations or warranties, express or implied, as to the accuracy of the information. References to square footage or age are approximate. Buyer must verify the information and bears all risk for any inaccuracies. Any projections, opinions, assumptions or estimates herein are for example purposes only and do not represent the current of future performance of the property. Marcus & Millichap is a service mark of Marcus & Millichap Real Estate Investment Services, Inc. © 2016 Marcus & Millichap. All rights reserved.
This information has been secured from sources we believe to be reliable, but we make no representations or warranties, express or implied, as to the accuracy of the information. References to square footage or age are approximate. Buyer must verify the information and bears all risk for any inaccuracies. Any projections, opinions, assumptions or estimates herein are for example purposes only and do not represent the current of future performance of the property. Marcus & Millichap is a service mark of Marcus & Millichap Real Estate Investment Services, Inc. © 2016 Marcus & Millichap. All rights reserved.
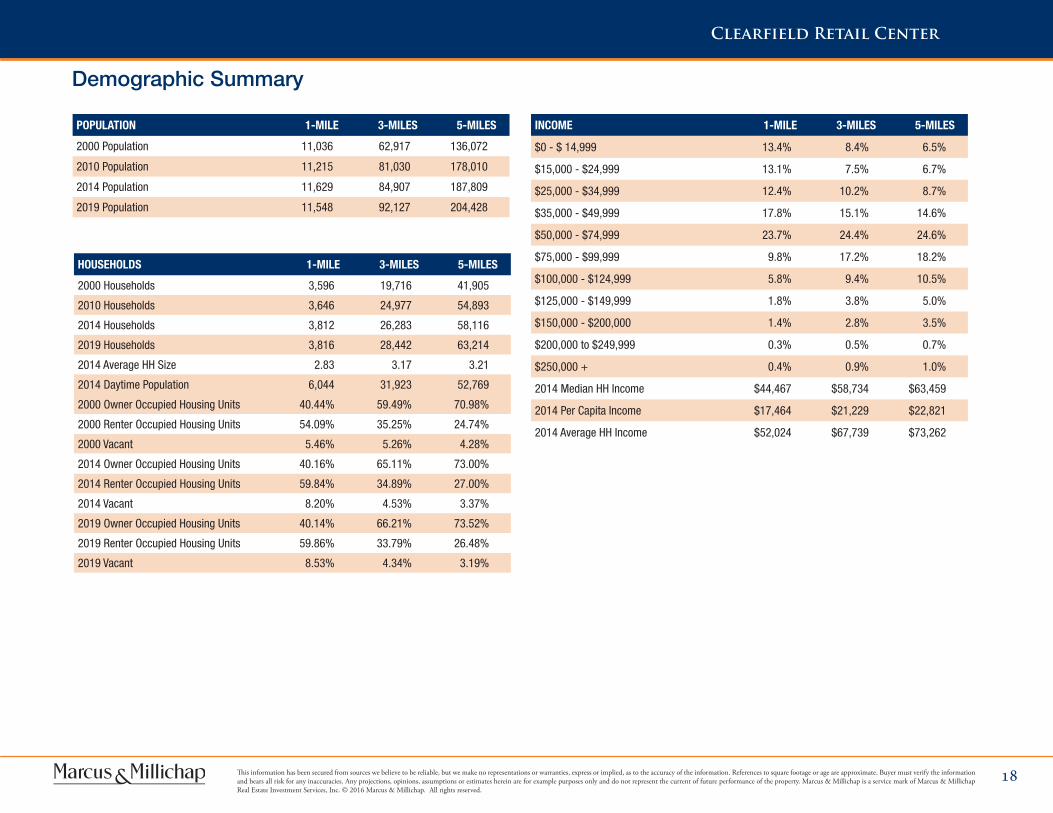
Demographic Summary
Clearfield Retail Center
INCOME 1-MILE 3-MILES 5-MILES
$0 - $ 14,999 13.4% 8.4% 6.5%
$15,000 - $24,999 13.1% 7.5% 6.7%
$25,000 - $34,999 12.4% 10.2% 8.7%
$35,000 - $49,999 17.8% 15.1% 14.6%
$50,000 - $74,999 23.7% 24.4% 24.6%
$75,000 - $99,999 9.8% 17.2% 18.2%
$100,000 - $124,999 5.8% 9.4% 10.5%
$125,000 - $149,999 1.8% 3.8% 5.0%
$150,000 - $200,000 1.4% 2.8% 3.5%
$200,000 to $249,999 0.3% 0.5% 0.7%
$250,000 + 0.4% 0.9% 1.0%
2014 Median HH Income $44,467 $58,734 $63,459
2014 Per Capita Income $17,464 $21,229 $22,821
2014 Average HH Income $52,024 $67,739 $73,262
HOUSEHOLDS 1-MILE 3-MILES 5-MILES
2000 Households 3,596 19,716 41,905
2010 Households 3,646 24,977 54,893
2014 Households 3,812 26,283 58,116
2019 Households 3,816 28,442 63,214
2014 Average HH Size 2.83 3.17 3.21
2014 Daytime Population 6,044 31,923 52,769
2000 Owner Occupied Housing Units 40.44% 59.49% 70.98%
2000 Renter Occupied Housing Units 54.09% 35.25% 24.74%
2000 Vacant 5.46% 5.26% 4.28%
2014 Owner Occupied Housing Units 40.16% 65.11% 73.00%
2014 Renter Occupied Housing Units 59.84% 34.89% 27.00%
2014 Vacant 8.20% 4.53% 3.37%
2019 Owner Occupied Housing Units 40.14% 66.21% 73.52%
2019 Renter Occupied Housing Units 59.86% 33.79% 26.48%
2019 Vacant 8.53% 4.34% 3.19%
POPULATION 1-MILE 3-MILES 5-MILES
2000 Population 11,036 62,917 136,072
2010 Population 11,215 81,030 178,010
2014 Population 11,629 84,907 187,809
2019 Population 11,548 92,127 204,428

19This information has been secured from sources we believe to be reliable, but we make no representations or warranties, express or implied, as to the accuracy of the information. References to square footage or age are approximate. Buyer must verify the information and bears all risk for any inaccuracies. Any projections, opinions, assumptions or estimates herein are for example purposes only and do not represent the current of future performance of the property. Marcus & Millichap is a service mark of Marcus & Millichap Real Estate Investment Services, Inc. © 2016 Marcus & Millichap. All rights reserved.
This information has been secured from sources we believe to be reliable, but we make no representations or warranties, express or implied, as to the accuracy of the information. References to square footage or age are approximate. Buyer must verify the information and bears all risk for any inaccuracies. Any projections, opinions, assumptions or estimates herein are for example purposes only and do not represent the current of future performance of the property. Marcus & Millichap is a service mark of Marcus & Millichap Real Estate Investment Services, Inc. © 2016 Marcus & Millichap. All rights reserved.
Demographic data © 2015 by Experian/Applied Geographic Solutions.
Clearfield Retail Center
Race and Ethnicity The current year racial makeup of your selected area is as follows: 86.46% White, 1.71% African American, 0.50% Native American and 2.22% Asian/Pacific Islander. Compare these to U.S. averages which are: 71.60% White, 12.70% African American, 0.18% Native American and 5.02% Asian/Pacific Islander. People of Hispanic origin are counted independently of race. People of Hispanic origin make up 12.04% of the current year population in your selected area. Compare this to the U.S. average of 17.13%.
Housing In 2000, there were 31,072 owner occupied housing units in your area and there were 10,832 renter occupied housing units in your area. The median rent at the time was $549.
Employment In 2014, there are 52,768 employees in your selected area, this is also known as the daytime population. The 2000 Census revealed that 59.72% of employees are employed in white-collar occupations in this geography, and 40.30% are employed in blue-collar occupations. In 2014, unemployment in this area is 4.24%. In 2000, the average time traveled to work was 25.2 minutes.
PopulationIn 2014, the population in your selected geography is 187,808. The population has changed by 38.02% since 2000. It is estimated that the population in your area will be 204,427 five years from now, which represents a change of 8.84% from the current year. The current population is 50.45% male and 49.54% female. The median age of the population in your area is 28.9, compare this to the Entire US average which is 37.3. The population density in your area is 2,387.09 people per square mile.
Households There are currently 58,115 households in your selected geography. The number of households has changed by 38.68% since 2000. It is estimated that the number of households in your area will be 63,213 five years from now, which represents a change of 8.77% from the current year. The average household size in your area is 3.20 persons.
Income In 2014, the median household income for your selected geography is $63,458, compare this to the Entire US average which is currently $51,972. The median household income for your area has changed by 31.24% since 2000. It is estimated that the median household income in your area will be $72,055 five years from now, which represents a change of 13.54% from the current year.
The current year per capita income in your area is $22,820, compare this to the Entire US average, which is $28,599. The current year average household income in your area is $73,261, compare this to the Entire US average which is $74,533.
Geography: 5 Miles
Demographic Summary
OFFICES NATIONWIDEwww.marcusmillichap.com
C l e a r f i e l d , U t a h
CLEARFIELD RETAIL CENTER