clean development mechanism - the center for international
TRANSCRIPT

Clean Development Mechanism Achievement and developments
Daniele ViolettiSecretary to
the CDM Executive BoardManager,
CDM Process ManagementSustainable Development Mechanisms Programme
UNFCCC
6th session of the high-level task force on the implementation of the right to development
14 January 2010 Geneva

2011+ registered CDM projects> 1.72 billion CERsexpected to the end of 2012 ** assumption: no extension of crediting periods
Status of the CDM | Measuring success
Map and statistics accessible from http://cdm.unfccc.int
Large scale projectsSmall scale projects
Status: 11 January 2010
To date: > 4,400 projects> 2.9 billion CERs expected by the end of 2012**
In the pipeline:
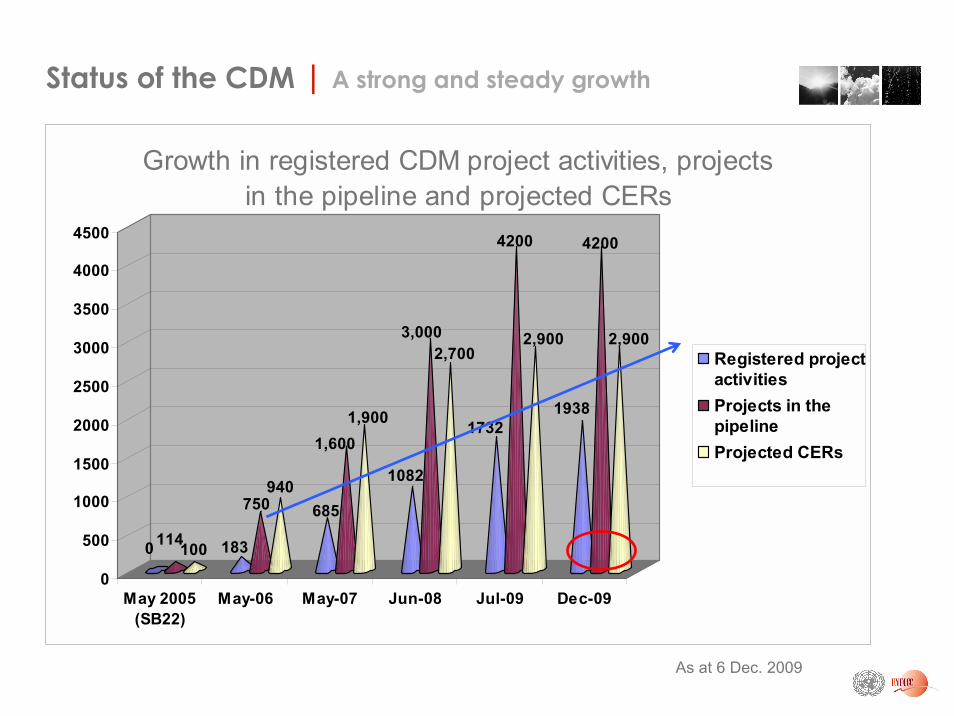
0 114100 183
750940
685
1,6001,900
1082
3,0002,700
1732
4200
2,900
1938
4200
2,900
0
500
1000
1500
2000
2500
3000
3500
4000
4500
May 2005(SB22)
May-06 May-07 Jun-08 Jul-09 Dec-09
Growth in registered CDM project activities, projects in the pipeline and projected CERs
Registered projectactivitiesProjects in thepipelineProjected CERs
As at 6 Dec. 2009
Status of the CDM | A strong and steady growth

Progress of the CDM | Registered CDM projects (2)
Distribution of registered project activities by scope

Progress of the CDM | Registered CDM projects (3)
Registered project activities by host partyTotal: 2,011
Expected average annual CERsfrom registered projects by host party
Total: 339,594,771
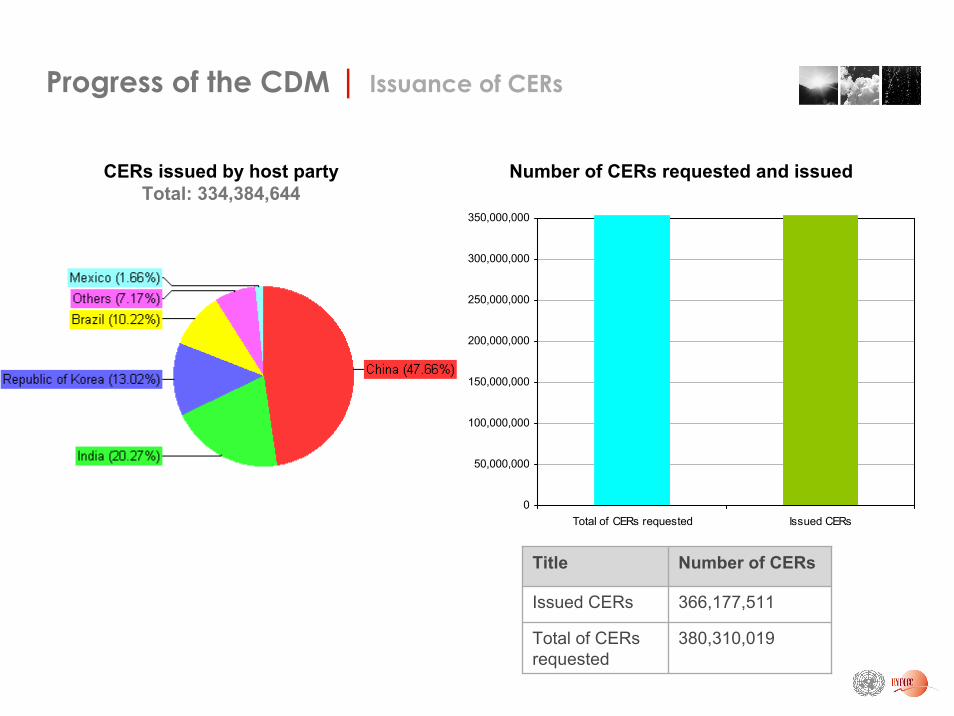
Progress of the CDM | Issuance of CERs
CERs issued by host partyTotal: 334,384,644
Number of CERs requested and issued
Title Number of CERs
Issued CERs 366,177,511
Total of CERsrequested
380,310,019
0
50,000,000
100,000,000
150,000,000
200,000,000
250,000,000
300,000,000
350,000,000
Total of CERs requested Issued CERs

Progress of the CDM | Regional Distribution
Registered projects by regionTotal: 2,011
Africa2%
Latin America and
Caribbean24%
Other1%
Asia and Pacific73%

� CDM is suffering from its success ! increasing delays in the (rigorous) approval process
� Actions EB last year included:� Policy + guidelines on how to treat project changes to the PDD� Improved criteria and procedures for PoAs (2 registered)� Timelines set for DOEs and secretariat + status published
� Transparency:� More open sessions� More information provided on decisions (revamped catalogue of decisions)
� Methodology development revisited ! prioritize� Many methodologies hardly or never used� Only 13 out of 100 methodologies = 88% reductions� Priority for transport , energy efficiency and agriculture
Ongoing work | Actions to reduce delays in the CDM

� Improvements to the process:� Methodologies (top-down development to be
applicable in under-represented project types or regions)
� Registration and issuance (revision of timelines and processes including an appeal possibility)
� Governance (enhance transparency and communication with stakeholders)
� Continue to improve procedures for PoAs
Ongoing work | CMP decision on CDM (1) in Copenhagen

� Regional Distribution:� Allocate financial resources from the Trust
Fund for the CDM, as well as any voluntary contributions from donors, to provide loans to cover in countries with fewer than 10 registered clean development mechanism project activities:(a) Costs of PDDs development;(b) Costs of validation and the first verification for these project activities;
� Encouraged DNAs to publish their sustainable development criteria
Ongoing work | CMP decision on CDM (2) in Copenhagen

� Regional Distribution:� Requests the secretariat to enhance its
support to designated national authorities and the Designated National Authorities Forum by, inter alia:
� (a) Providing training opportunities for CDM stakeholders on a continuous basis on the different elements of the CDM project cycle;(b) Facilitating information exchange and awareness-raising at the regional and subregional levels;
� Requests the secretariat to continue its work in facilitating coordination among partner agencies in the implementation of the Nairobi Framework;
Ongoing work | CMP decision on CDM (3) in Copenhagen

Where: Khayelitsha, a low-income housing development on the outskirts of Cape TownWhat: Residents have turned to the sun to provide for their heating needsHow: Houses have been equipped with insulated ceilings, solar water heaters and energy efficiency lightingResults: The project improves thermal performance, lighting and water heating efficiency of the housing units
Sustainable Development Benefits� Reduction of greenhouse gas emissions� Families have cut their electricity costs� Each solar water heater saves 1.29 tonnes of CO2 per household
annually� Reduction of local air pollution� Decreases in pulmonary pneumonia, respiratory illnesses and carbon
monoxide poisoning
Example | South Africa � Project 0079

Sustainable Development Benefits� Reduction of greenhouse gas emissions� Reduction of local air pollution from wood smoke � Reduction of harmful health consequences resulting from wood smoke� Reduction of fuel wood consumption in an area where deforestation is a
major concern � Natural recovery of forests and reforestation can take place
Where: Guinea Savannah ZoneWhat: The purpose of the project is to disseminate up to 12,500 efficient fuel wood stoves and heat retaining boxes at subsidized prices How: The new wood stoves are suitable for cooking, frying, heating, and baking flat bread. After reaching the boiling point, food can be transferred to the heat retaining box, where it can simmer until it is well cooked. Results: The wood stoves save up to 80 per cent of fuel wood
Example | Nigeria � Project 2711

Sustainable Development Benefits� The local government can improve collection services for the city� Collection services can increase at the same rate as population
growth (estimated at 2 per cent per year)� A percentage of the revenues from CERs generated by the project will
be used to finance programmes that concentrate on supply of clean water and improving the local living environment
Where: City of Pontianak�s landfillWhat: The project involves the installation of a landfill gas (LFG) collection system and flaring facility to destroy the methane gas generated at the landfillHow: The project will invest in waste collection systems and utilize some of the collected LFG to generate electricityResults: Development of solid waste collection and disposal services and improvement of the living and working environment for the landfill workers and the surrounding community
Example | Indonesia � Project 1582

Key source for this study:� PDD of 3,296 projects in the CDM pipeline (registered and
proposed) as of June 2008, located in 67 host countries
TT by project type:� 36% projects claims TT� TT is more common for larger projects� Unilateral and small-scale projects involve less TT (only 30% claims
TT)
TT by host country characteristic:� Frequency of TT claims is high for �Least Developed Countries�
(65%)� Host country can influence the extent of TT: The DNA approval
criteria may include provision for TT or technology development
Technology Transfer (TT) | Key findings (2008)

Agriculture
TT is more likely for: HFCN2OLandfill gasWind projects
Project sizeProbability of TT increases with:
Foreign participants
TT is less likely for:
Biomass energy
Cement
Fugitive
Hydro
Technology Transfer (TT) | Regression analysis
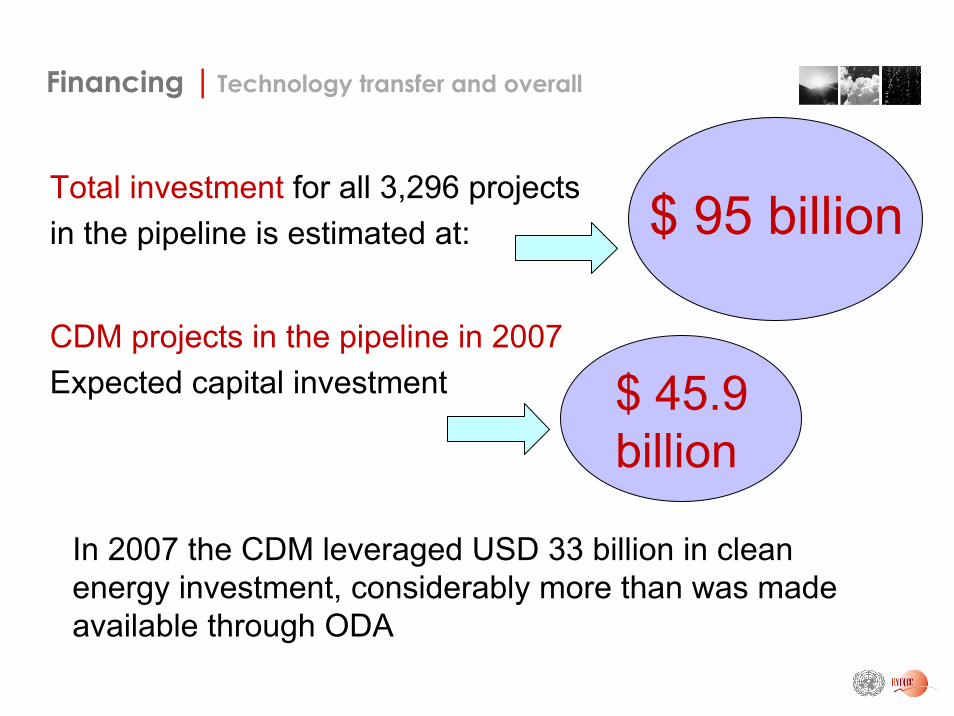
Total investment for all 3,296 projects in the pipeline is estimated at:
CDM projects in the pipeline in 2007Expected capital investment
$ 95 billion
$ 45.9 billion
In 2007 the CDM leveraged USD 33 billion in clean energy investment, considerably more than was made available through ODA
Financing | Technology transfer and overall

THANK YOU!
CDM Process ManagementSustainable Development Mechanisms
UNFCCC
CDM Bazaarhttp://www.cdmbazaar.net/
Catalogue of decisionshttp://cdm.unfccc.int/Reference/catalogue/search
Informationcdm.unfccc.int