1 clean development mechanism project design …
TRANSCRIPT

PROJECT DESIGN DOCUMENT FORM (CDM PDD) - Version 03 CDM – Executive Board page 1
CLEAN DEVELOPMENT MECHANISM PROJECT DESIGN DOCUMENT FORM (CDM-PDD)
Version 03 - in effect as of: 28 July 2006
CONTENTS A. General description of project activity B. Application of a baseline and monitoring methodology C. Duration of the project activity / crediting period D. Environmental impacts E. Stakeholders’ comments
Annexes Annex 1: Contact information on participants in the project activity Annex 2: Information regarding public funding Annex 3: Baseline information
Annex 4: Monitoring plan
PROJECT DESIGN DOCUMENT FORM (CDM PDD) - Version 03 CDM – Executive Board page 2 SECTION A. General description of project activity A.1 Title of the project activity: Pure-low Temperature Waste Heat Recovery for Power Generation (2×7MW) in Guangdong Tapai Cement Co., Ltd. (“the Project” or “the Project Activity”) Version 01, 12/2/2008 A.2. Description of the project activity:
The Project Activity involves the construction of two 7MW waste heat recovery electricity
generators, one for each of two new 4500t/day dry process clinker production lines already under construction at the Huizhou Longmen Cement Plant (the Longmen Plant) owned by Guangdong Tapai Group Co., Ltd. (Tapai Group), and situated in Longmen County of Guangdong Province, PR China. The Project Activity will recover and use the waste heat from the rotating kilns of the cement clinker lines and lead to the mitigation of greenhouse gas emissions through the generation of electricity which will be used to displace electricity imported to the cement plant from the Southern China Power Grid.
The completed generators are expected to produce in the region of 86,400 MWh per year, 8% of
which will be used in the Project Activity, and the remainder, 79,488 MWh, will be available for use by the cement plant, which should meet approximately 28% of the plant’s needs. Displacement of this amount of electricity from the local grid will lead to a reduction in greenhouse gas emissions by the grid-connected generation facilities of approximately 63,551 tCO2/year, leading to a total reduction of 444,857 tCO2 over the first seven-year crediting period.
Tapai Group is the largest cement manufacturer in Guangdong Province, operating nine large and
medium sized clinker and cement production plants with a total production capacity of 8 million tonnes per year. The Longmen Plant is one of those cement factories and is currently undergoing comprehensive redevelopment. The redevelopment involves the replacement of both the old clinker lines with two new, more efficient 4,500 t/day dry process clinker production lines. The redevelopment work started in 2005 and will be completed in 2008 Alongside, but separately to, the redevelopment of the Longmen Plant, Tapai Group have proposed and implemented the installation of power generation facilities that will utilise the waste heat from the plant. Whilst the installation of waste heat-based generation facilities at cement plants is strongly encouraged in national policies and regulations, there are no laws requiring installation as such.
The Project will contribute to sustainable development in the following ways: Job creation: The Project Activity will lead to the creation of new job opportunities. Reduction in GHG emissions: Generation of electricity using waste heat will allow the displacement of electricity generated by the local grid which mostly uses fossil fuel sources for its power. Reduction of fossil fuel use: The Project Activity will reduce reliance on imported fossil fuels, which will contribute to increasing China’s energy security, and will also improve local air quality as it will reduce the emissions of SO2 and NOx associated with fossil fuel use. Pollution reduction: The Project Activity will lead to a reduction in the amount of dust present in the stack gas from the cement plant and thus reduce the discharge of dust into the local environment.

PROJECT DESIGN DOCUMENT FORM (CDM PDD) - Version 03 CDM – Executive Board page 3
Sustainable development: The Project will make efficient use of the waste heat from both new cement lines, generating power and, in the process, reducing energy wastage at the plant, reducing the demand on fossil fuel-heavy grid based power generation, and easing environmental pressure caused by pollution from the plant. Construction of the Project, therefore, conforms to national industrial policies for energy saving and clean production.
A.3. Project participants:
Name of Party involved(*) ((host) indicates a host
Party)
Private and/ or Public entity(ies) Project participants(*)
(as applicable)
Kindly indicate if the Party involved wishes to be
considered a project participant(Yes/ No)
China (host) Guangdong Tapai Group Co., Ltd. No
Japan (buyer’s country) Mitsubishi Heavy Industries, Ltd. No
(*) In accordance with the CDM modalities and procedures, at the time of making the PDD public at the stage of validation, a Party involved may or may not have provided its approval. At the time of requesting registration, the approval by the Party(ies) involved is required.
A.4. Technical description of the project activity: A.4.1. Location of the project activity: A.4.1.1. Host Party(ies):
China
A.4.1.2. Region/State/Province etc.:
Guangdong Province A.4.1.3. City/Town/Community etc:
Longmen County A.4.1.4. Detail of physical location, including information allowing the unique identification of this project activity (maximum one page):

PROJECT DESIGN DOCUMENT FORM (CDM PDD) - Version 03 CDM – Executive Board page 4
Guangdong Province, PR China
Tapai Cement
The Project site is located at Guangdong Tapai Group Co., Ltd.’s Huizhou Longmen Cement
Plant in Longmen County of Guangdong Province, PR China. It lies 200 km away from Guangzhou, 160 km from Shenzhen, and 90 km from Huizhou. To the north of the Project site runs the Jinlong highway, and to the east the Zenglong highway. The geographical coordinates are longitude 114º 20’ N and latitude 23º 38’ E. A.4.2. Category(ies) of project activity: The Project comes under sectoral scopes 1 and 4, “Energy industries (renewable / non-renewable sources)” and “Manufacturing industries”, respectively. A.4.3. Technology to be employed by the project activity:
The waste heat recovery facilities to be installed under the Project Activity include an AQC boiler and an SP boiler at the front and rear, respectively, of the kiln in each of two under-construction dry

PROJECT DESIGN DOCUMENT FORM (CDM PDD) - Version 03 CDM – Executive Board page 5 process production lines. The steam generated by the boilers will be used to rotate two 7000kW steam-additional condensing turbines which will, in turn, power two 10.5kV/7000kVA generator sets. An auxiliary workshop will also be built containing water-filtering and cooling systems. The equipment will be purchased from a Chinese manufacturer. The process diagram is as follows:
The following table lists the equipment and material flows to be used in the Waste Heat Plant:
I Waste Heat Utilization Part 1) The kiln rear waste heat boiler (SP boiler) 2 sets Inlet waste gas amount: 340,000Nm3/h Temperature for inlet waste gas: 330ºC Dustiness degree for inlet waste gas: 80g/ Nm3
Temperature for outlet waste gas : 230ºC Steam pressure: 1.6MPa Steam temperature: 310ºC Resistance of flue gas side: ≤1000Pa Total air leakage rate: ≤5% Ash cleaning way: Mechanical vibrating
On-site use of electricity

PROJECT DESIGN DOCUMENT FORM (CDM PDD) - Version 03 CDM – Executive Board page 6
Feed water temperature: 125ºC 2) The kiln entry waste heat boiler (AQC boiler) 2 sets Inlet waste gas amount: 180,000Nm3/h Temperature for inlet waste gas: 350ºC Dustiness degree for inlet waste gas: ≤8g/ Nm3 (out from the dust pre-cleaning
device) Temperature for outlet waste gas : ≤100ºC Resistance of flue gas side: ≤600Pa Total air leakage rate: ≤5% 1.6MPa Steam production capacity: Steam temperature: 320ºC Feed water temperature: 130ºC 0.35MPa Steam production capacity: Steam temperature: 170ºC Feed water temperature: 42ºC Hot water temperature: 130ºC Feed water temperature: 42ºC II Steam Turbine and Generator System 1) Condensing steam turbine engine 2 sets Rated power: 7000kW Standard rate speed: 3000r/min Steam pressure of control valve: 1.5MPa Steam temperature of control valve: 320ºC Steam pressure of gulp valve: 0.35MPa Steam temperature of control valve: 165ºC Exhaust pressure: 6.86kPa 2) Generator 2 sets Rated power: 7000kVA Voltage of outgoing line: 10500V Standard rate speed: 3000r/min 3) Condensed water pump 2 sets 4) Water feed pump of boiler 2 sets III Chemical water treatment system (including Phase II) Including activated carbon filter, soft water device, soft water tank and etc., each with 2 sets (of which one for Phase I and the other for Phase II).
PROJECT DESIGN DOCUMENT FORM (CDM PDD) - Version 03 CDM – Executive Board page 7
Design output: 15 t/h IV Circulating Cooling Water System 1) Cooling tower 4sets 2) circulating cooling water pump 5 sets V The Kiln Rear Ash Transferring System 2 sets VI The Kiln Entry Settling Chamber and Ash Transferring System
2 sets
VII Electrical Equipment 2 sets VIII Thermodynamic control equipment 2 sets IX Steam water pipelines
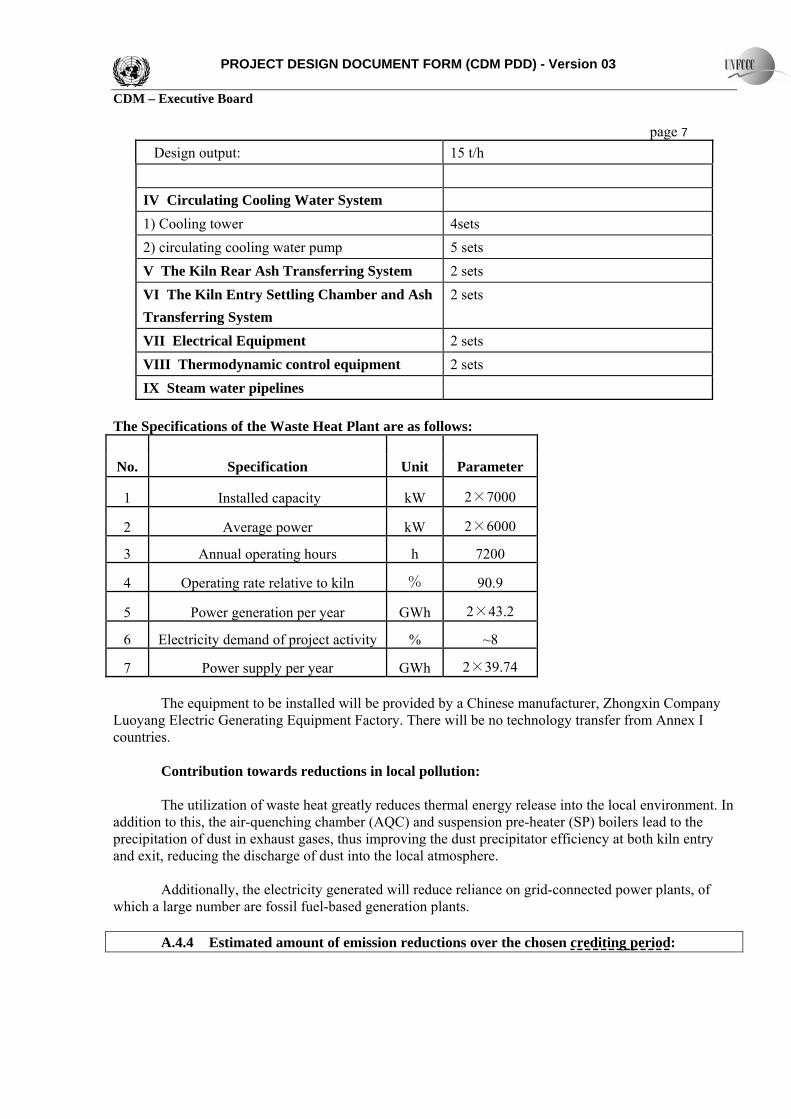
The Specifications of the Waste Heat Plant are as follows:
No. Specification Unit Parameter
1 Installed capacity kW 2×7000
2 Average power kW 2×6000
3 Annual operating hours h 7200
4 Operating rate relative to kiln % 90.9
5 Power generation per year GWh 2×43.2
6 Electricity demand of project activity % ~8
7 Power supply per year GWh 2×39.74 The equipment to be installed will be provided by a Chinese manufacturer, Zhongxin Company
Luoyang Electric Generating Equipment Factory. There will be no technology transfer from Annex I countries.
Contribution towards reductions in local pollution: The utilization of waste heat greatly reduces thermal energy release into the local environment. In
addition to this, the air-quenching chamber (AQC) and suspension pre-heater (SP) boilers lead to the precipitation of dust in exhaust gases, thus improving the dust precipitator efficiency at both kiln entry and exit, reducing the discharge of dust into the local atmosphere.
Additionally, the electricity generated will reduce reliance on grid-connected power plants, of
which a large number are fossil fuel-based generation plants.
A.4.4 Estimated amount of emission reductions over the chosen crediting period:

PROJECT DESIGN DOCUMENT FORM (CDM PDD) - Version 03 CDM – Executive Board page 8 The Project selects the renewable, 7-year crediting period option, and is expected to achieve emission reductions of, on average, 63,551 tonnes of CO2e per year over the first period, leading to a total saving of 444,857 tCO2e over the course of the crediting period.
Years Annual estimation of emission reductionsin tonnes CO2e
Year 1 (beginning 01/10/2008) 63,551 Year 2 (beginning 01/10/2009) 63,551 Year 3 (beginning 01/10/2010) 63,551 Year 4 (beginning 01/10/2011) 63,551 Year 5 (beginning 01/10/2012) 63,551 Year 6 (beginning 01/10/2013) 63,551 Year 7 (beginning 01/10/2014) 63,551
Total estimated reductions (tonnes CO22) 444,857 Total number of crediting years 7
Annual average over the crediting period of estimated reductions (tonnes of CO2e) 63,551
A.4.5. Public funding of the project activity: There is no public funding from any Annex 1 country.
PROJECT DESIGN DOCUMENT FORM (CDM PDD) - Version 03 CDM – Executive Board page 9 SECTION B. Application of a baseline and monitoring methodology B.1. Title and reference of the approved baseline and monitoring methodology applied to the project activity:
This section was prepared using ACM0012, Version 02, “Consolidated baseline methodology for
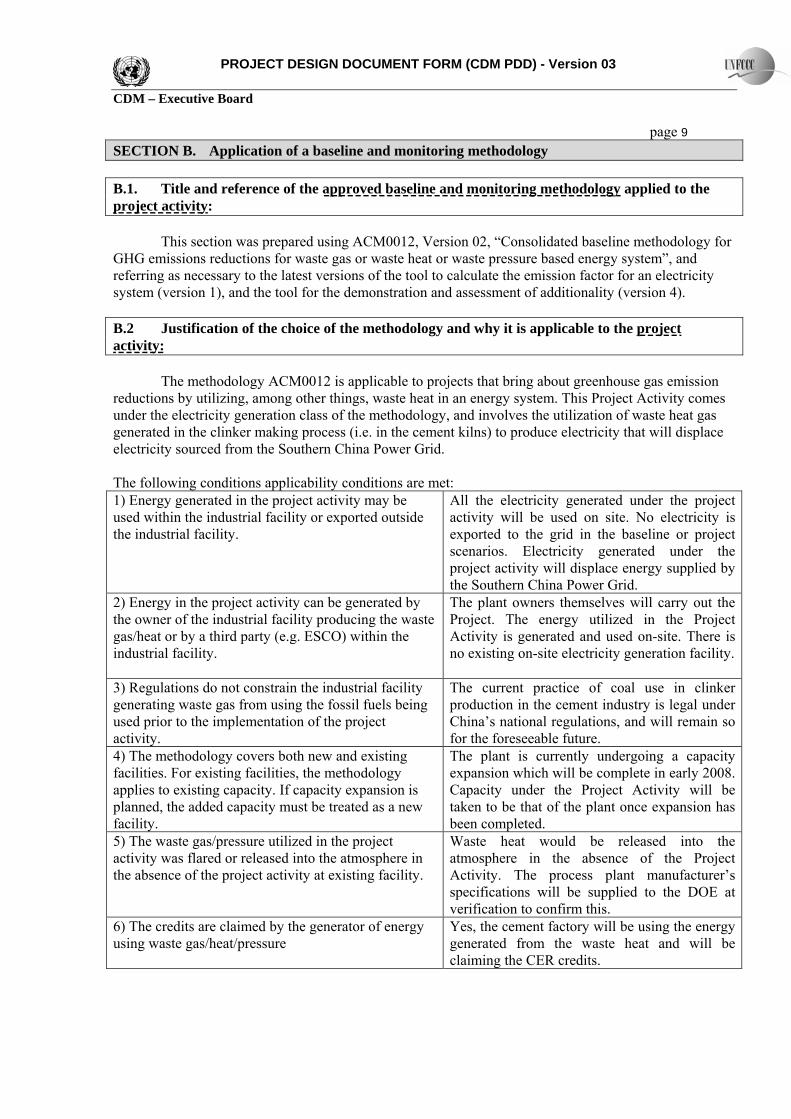
GHG emissions reductions for waste gas or waste heat or waste pressure based energy system”, and referring as necessary to the latest versions of the tool to calculate the emission factor for an electricity system (version 1), and the tool for the demonstration and assessment of additionality (version 4). B.2 Justification of the choice of the methodology and why it is applicable to the project activity: The methodology ACM0012 is applicable to projects that bring about greenhouse gas emission reductions by utilizing, among other things, waste heat in an energy system. This Project Activity comes under the electricity generation class of the methodology, and involves the utilization of waste heat gas generated in the clinker making process (i.e. in the cement kilns) to produce electricity that will displace electricity sourced from the Southern China Power Grid. The following conditions applicability conditions are met: 1) Energy generated in the project activity may be used within the industrial facility or exported outside the industrial facility.
All the electricity generated under the project activity will be used on site. No electricity is exported to the grid in the baseline or project scenarios. Electricity generated under the project activity will displace energy supplied by the Southern China Power Grid.
2) Energy in the project activity can be generated by the owner of the industrial facility producing the waste gas/heat or by a third party (e.g. ESCO) within the industrial facility.
The plant owners themselves will carry out the Project. The energy utilized in the Project Activity is generated and used on-site. There is no existing on-site electricity generation facility.
3) Regulations do not constrain the industrial facility generating waste gas from using the fossil fuels being used prior to the implementation of the project activity.
The current practice of coal use in clinker production in the cement industry is legal under China’s national regulations, and will remain so for the foreseeable future.
4) The methodology covers both new and existing facilities. For existing facilities, the methodology applies to existing capacity. If capacity expansion is planned, the added capacity must be treated as a new facility.
The plant is currently undergoing a capacity expansion which will be complete in early 2008. Capacity under the Project Activity will be taken to be that of the plant once expansion has been completed.
5) The waste gas/pressure utilized in the project activity was flared or released into the atmosphere in the absence of the project activity at existing facility.
Waste heat would be released into the atmosphere in the absence of the Project Activity. The process plant manufacturer’s specifications will be supplied to the DOE at verification to confirm this.
6) The credits are claimed by the generator of energy using waste gas/heat/pressure
Yes, the cement factory will be using the energy generated from the waste heat and will be claiming the CER credits.

PROJECT DESIGN DOCUMENT FORM (CDM PDD) - Version 03 CDM – Executive Board page 10 7) Waste gas/pressure that is released under abnormal operation (emergencies / shut down) of the plant shall not be accounted for.
The Project will be run on the waste heat produced under normal operation conditions
B.3. Description of the sources and gases included in the project boundary
In accordance with the methodology, the physical extent of the Project Boundary includes the industrial facility where waste heat is generated, the facility where electricity is generated, and the facility where the generated electricity is used. Therefore, this includes the kilns generating the waste heat, the heat recovery boilers, the electricity generator units and their associated auxiliary facilities, and all power plants connected to the Southern China Power Grid. According to the grid-related data released on the Chinese DNA’s website, the Southern China Power Grid includes Guangdong, Guangxi, Yunnan, and Guizhou.
The spatial extent of the electricity grid is as defined in the tool to calculate the emission factor
for an electricity system. The Project boundary is shown in the following diagram:
Tapai Cement Plant Southern China
Power Grid
WHR Electricity Generation
Release of waste heat
Electricity
Waste heat
The waste heat can be used as is, and will not require any treatment. The Project Activity will not
require any supplemental fossil fuel consumption. At certain times, such as when shutting down and starting up for maintenance purposes, electricity supplied by the grid may be required; however, imports from the grid to the equipment installed under the Project Activity are not included in CER calculations, in line with the methodology.
The following table describes which emissions are included and which are omitted from the
Project emissions calculations.
Source Gas Included? Justification / Explanation CO2
Included Main emission source.
Bas
elin
e Grid electricity generation CH4 Excluded Excluded for simplification. This is
conservative.

PROJECT DESIGN DOCUMENT FORM (CDM PDD) - Version 03 CDM – Executive Board page 11
N2O Excluded Excluded for simplification. This is conservative.
CO2 Excluded Excluded in line with the methodology. CH4 Excluded Excluded for simplification. This emission
source is assumed to be very small.
Proj
ect
Act
ivity
Supplemental electricity consumption N2O Excluded Excluded for simplification. This emission
source is assumed to be very small. B.4. Description of how the baseline scenario is identified and description of the identified baseline scenario:
When identifying the baseline scenario, the most realistic and credible options for waste heat use in the absence of the project activity, and power generation in the absence of the project activity were considered. Step 1 - Defining the most plausible baseline scenario The facility at the Project site is where the waste heat is generated, the energy is produced and the energy is consumed. For the use of waste heat, the realistic and credible alternatives are as follows: W1 Waste heat is released into the atmosphere W2 Waste heat is sold as an energy source W3 Waste heat is used for meeting energy demand For power generation, the realistic and credible alternatives are as follows: P1 Proposed project activity not undertaken as a CDM project activity P2 On-site or off-site existing/new fossil-fuel-fired or renewable cogeneration plant P3 On-site or off-site existing/new fossil fuel based existing captive or identified plant P4 On-site or off-site existing/new renewable energy based existing captive or identified plant P5 Sourced Grid-connected power plants P6 Captive electricity generation from waste heat at a lower efficiency than the Project Activity
In the case of waste heat, W1, the continuation of current practice, is feasible Because there are no legal requirements for cement plants to utilize the waste heat, and the practice is by far the most common in the province, as well as in China.
Whilst expensive infrastructure could be installed to capture the waste heat to export it from the
plant, as is described by W2, there are no other major heat users in the vicinity to make this worthwhile. Whilst there are a number of small potential users in the vicinity who could utilize a small fraction of the waste heat, such as the plant offices and local housing, this demand is very limited, therefore, the small scale and seasonal nature of such use would not make it economically feasible to invest in the necessary infrastructure.

PROJECT DESIGN DOCUMENT FORM (CDM PDD) - Version 03 CDM – Executive Board page 12
In the case of W3, the factory already recycles as much of the heat into its various processes as is economical, such as the drying of raw materials and the pre-heating of coal, and further increases in this recycling are not likely to occur given the high costs of installation of equipment and the relatively small gains that could be made.
It is clear that, in the absence of the Project activity, the most likely scenario for waste heat is the current practice of venting it directly into the atmosphere.
In the case of power generation, P1 is not a realistic scenario because the Project activity requires supplementary income from the sale of CERs to overcome the barriers to implementation described in further detail in section B.5 below.
P2 is not applicable since the Project only involves power generation. P3 would not be feasible as the construction and operation of a fossil fuel fired power plant below
135 MW in capacity is not permitted under current Chinese regulations for areas connected to large grids. P4 would face similar investment problems to P2 above, but more importantly, the area lacks the
necessary resources and infrastructure to provide biomass or biogas on a significant enough scale for the plant. Wind and water resources in the area are also not plentiful enough to warrant investment in renewable energy generation facilities, without some form of additional revenue.
P5, electricity demand continuing to be met by the grid, is a feasible scenario. P6, a lower efficiency of waste heat capture than that which is proposed under the Project
Activity, would still require significant investment not just in boilers, turbines and generators, but also in monitoring equipment and control facilities. The investment and technology barriers would be too great for the plant to consider without an additional revenue stream as is shown by the fact that this project requires CDM revenue to be implemented.
The most likely alternatives of those listed above are options W2 and P5: the waste heat is released into the atmosphere and the electricity needs of the plant are met fully by the grid. The Project activity is, therefore, fully in-line with the requirements of ACM0012.
Step 2 – Identify the fuel to be used in the baseline The fuel to be used in the baseline scenario is the mix of fuels currently used by the power generators connected to the local grid. Step 3 and Step 4 of the methodology are completed in section B.5. below. Given that the Project concerns the generation of electricity only, and that the most likely baseline options for the Project are W2 and P5 (waste heat is released into the atmosphere, and power is sourced from grid-connected power plants), of the scenarios described in ACM0012, the Project is best described by scenario 1, “electricity is obtained from the grid”. Baseline emissions are calculated accordingly. B.5. Description of how the anthropogenic emissions of GHG by sources are reduced below those that would have occurred in the absence of the registered CDM project activity (assessment and demonstration of additionality):

PROJECT DESIGN DOCUMENT FORM (CDM PDD) - Version 03 CDM – Executive Board page 13
Construction of the two new 4500 t/day dry process clinker production lines began in 2005. One was commissioned in August 2007, and the other is expected to be commissioned in April 2008. Installation of the waste heat recovery and energy generation equipment was implemented as a separate project to the clinker line construction. The feasibility study for the waste-heat recovery power generation was completed in October 2006, and the equipping of the clinker with the waste heat recovery equipment began in early 2007. In its financial analysis, the feasibility study considered CER revenue to be crucial to the successful financial closure of the Project.
Prohibitive barriers that the Project activity faces are clearly identified using the tool for the
demonstration and assessment of additionality. The following steps from the additionality tool are completed below: STEP 1 – Identification of alternatives to the project activity consistent with current laws and regulations STEP 3 – Barrier analysis STEP 4 – Common practice analysis Step 1 - Identification of alternatives to the project activity consistent with current laws and regulations. Sub-step 1a. Define alternatives to the project activity
• Alternative use(s) of waste heat; • Existing or new captive power generation on-site or off-site using other energy
sources than waste heat; • Electricity is imported from the grid (BAU); • A mix of captive power and imports from the grid; • Proposed project activity not undertaken as a CDM project activity.
Sub-step 1b. Enforcement of applicable laws and regulations
All scenarios are in compliance with applicable laws and regulations. As described in section B.4 above, the cement factory already utilizes as much of the waste heat
as is economical, and also there is no potential customer in the region for its waste heat. There are no existing on-site or off-site generation plants supplying the site, and the construction, operation and fuel costs of such a site are too high to warrant investment.
Therefore, the only plausible alternatives to the Project Activity are:
• Business as usual: electricity is imported from the grid, and • The proposed project activity not undertaken as a CDM project activity.
Step 3 – Barrier Analysis The Project faces various investment and technological barriers that are described below. • Investment barriers
PROJECT DESIGN DOCUMENT FORM (CDM PDD) - Version 03 CDM – Executive Board page 14
At the end of 2005, China’s cement production capacity stood at 1.287 billion tonnes1, however, the actual cement production of that year was 1.064 billion tonnes2. There is clearly, therefore, a large excess of capacity in the country, making the market very competitive and placing significant downward pressure on the price that producers can charge. Furthermore, the recent national directive for banks to cut lending to industries with overcapacity3 has led to a tightening of available credit lines. In this highly competitive climate, Tapai Group instigated a program to redevelop the two clinker production lines at the Longmen Plant. At a total cost of 923 million Yuan, 60% of the financing for which was in the form of loans, both of the old clinker production lines at the plant are being replaced with two new, more efficient lines. Separately to this redevelopment, the Project Developer sought the implementation of the waste heat recovery project. For this, it was necessary for Tapai Group to obtain loans to meet 60% of the 140 million Yuan costs from the Agricultural Bank of China, which has no previous experience of lending to such power generation projects, and does not employ people with the necessary technical knowledge to fully understand the risks. As regards alternative financing channels, Tapai Group have no access to alternatives to Chinese Banks. Access to international markets is severely restricted for Chinese companies seeking to raise capital, and, furthermore, Tapai Group lack the necessary experience of dealing in such markets. Tapai Group’s existing level of borrowing, the constrained revenues from the highly competitive market, their bank’s lack of technical knowledge and experience of lending to such projects (power generation), and a general reluctance among Chinese banks to lend to Projects in industries with overcapacity, made the additional revenue available through the CDM an essential part of the financial plans for this project.
• Technological barriers
In terms of the equipment, given the credit squeeze, Tapai Group opted to purchase equipment from a Chinese manufacturer. The steam turbines of imported equipment could have used a lower steam inlet pressure, increasing the efficiency of steam use and thus increasing the efficiency of electricity generation. The Chinese equipment has a lower efficiency and higher operating costs and likelihood of malfunction than the 40% more expensive, but better performing equipment available from overseas. Therefore, the Project developer is taking on greater risks than they would otherwise if they purchased the more advanced foreign-made equipment. Furthermore, this is the first low-temperature waste heat recovery project that Tapai Group have implemented at any of their cement plants. They, therefore, have no experience in the operation and maintenance of such equipment, and the risk of problems which impact on normal operation is greater as a result.
1 http://news.xinhuanet.com/fortune/2006-05/08/content_4520155.htm 2 http://www.51report.com/research/detail/7256816.html 3 Credit policy for cement sector (2006 Revised edition), General guidelines for loans of China Construction Bank and the Basic Access for Cement industry of China National Development Bank

PROJECT DESIGN DOCUMENT FORM (CDM PDD) - Version 03 CDM – Executive Board page 15
The risks and additional operating and management costs that the Project carries in this regard are somewhat countered by the potential revenue obtainable through CDM.
Sub-step 3b Show how the identified barriers would not prevent the implementation of at least one of the alternatives: In the event that the Project Developer chose not to implement the Project Activity (BAU: Electricity is imported from the grid), then the investment barriers and technological barriers would cease to be obstacles to the operation of the plant, as the electricity would be bought as and when required from the grid which has many different facilities using equipment with a proven track record, and with minimal, well-understood risks. Step 4 – Common practice analysis At present there are approximately 5177 cement plants in operation in China; plants with rotary kilns number 3744, while plants with shaft kilns number 1433. Only approximately 300 plants have a production capacity of more than 5000 t/d, while approximately 1700 plants have a capacity of 1000 ~ 5000t/d. Of these plants, only a few utilize waste heat for electricity generation. In a study of the implementation of low-temperature waste heat recovery technology among Chinese cement manufacturers performed by the Tianjing Cement Industrial Design Institute in 2006, only eleven plants had such technology installed (see list below). Those plants that do utilize the technology have generally received funding for the activity through various bodies such as the Japanese New Energy Development Organization (NEDO), and the Green Aid Programme, or they are CDM projects and gain revenue through the sale of CERs. Even though certain projects have been implemented as examples to industry, one as early as 1998, it is clear that similar activities to the Project are still not widespread in China. Furthermore, of the plants identified by the Institute, only three are to be found in the South China region, and none are to be found in Guangdong province. The Project can, therefore, be considered the first of its kind in the region.

PROJECT DESIGN DOCUMENT FORM (CDM PDD) - Version 03 CDM – Executive Board page 16 Table: Overview of waste-heat utilization projects at cement plants in China as of 2006
Name of the company Province Cement production Installed capacity
Operational date
Hailuo Group Ningguo Cement Manufacturing
An’hui 4000t/d new dry-method process
6480kW Feb 1998
Shanghai wan’an Enterprise Shanghai 1200t/d new dry-method process
2500 kW
May 2003
Guangxi liuzhou Cement Manufacturing
Guangxi 4000t/d new dry-method process
6000 kW
July 2004
Zhejiang Shenhe Cement Stock Company
Zhejiang 2500t/d new dry-method process
3000 kW
March 2005
Zhejiang Qinglongshan Cement Stock Company
Zhejiang 1200t/d+2500t/d new dry-method process
2×
3000kW June 2005
Zhejiang Changxing Xiaopuzhongsheng Cement CO,.ltd
Zhejiang 2500t/d new dry-method process
3000 kW
June 2005
Zhejiang Changxing Meishanzhongshengjiancai CO,.ltd
Zhejiang 5000t/d new dry-method process
6000 kW
July 2005
Zhejiang Sanshi Cement Stock CO,.ltd Zhejiang 2500t/d+5000t/d new dry-method process
9000 kW
n.a.
Zhejiang Zhongxinyuan Cement CO,.ltd Zhejiang 2500t/d new dry-method process
3000 kW
November 2005
Hainan sanyahuashengtianya Cement CO,.ltd
Hainan 5000t/d new dry-method process
6000 kW
May 2006
Zhejiang Haolong Jiancai CO,.ltd Zhejiang 1200t/d new dry-method process
1500 kW
January 2006
Huarun Cement(Pingnan) CO,.ltd Guangxi 5000t/d new dry-method process
7500 kW
Under construction
Quzhai Cement CO,.ltd of Luquan City Hebei n.a. 2×
4500kW Under
constructionZhejiang Zhenfu Cement CO,.ltd Zhejiang n.a. 2000kW Under
constructionHuainan Shunyue Cement CO,.ltd Anhui n.a. 9000
kW Under
constructionHede Sanshi Cement CO,.ltd Anhui n.a. 9000kW Under
constructionChangsha Pingtang Cement CO,.ltd Hunan n.a. 3000kW Under
constructionZhejiang Hongshi Cement Sock CO,.ltd Zhejiang n.a. 2×
7500kW Under
constructionGaona Hongshi Cement CO,.ltd Jianxi n.a. 9000kW Under
constructionJiangsu Taihe Yuhua Cement CO,.ltd Jiangsu n.a. 2000kW Under
constructionShandong Zibo Donghua Cement
Company Shandong n.a. 6000kW Under
constructionBeijing Cement Manufacturing CO,.ltd Beijing 4000t/d new dry-
method process 6000kW Under
construction

PROJECT DESIGN DOCUMENT FORM (CDM PDD) - Version 03 CDM – Executive Board page 17
It is clear that, this Project fulfils the requirements of additionality, as described by the
additionality tool, as it would not have been implemented without additional funding, such as the revenue stream available from CDM.
B.6. Emission reductions:
B.6.1. Explanation of methodological choices: Of the Project scenarios mentioned in the methodology, the Project activity corresponds to scenario 1 under Generation of Electricity Only. In accordance with the methodology, emissions reductions are calculated as described below: Baseline Emissions
Baseline emissions for the Project Activity are the emissions from grid-generated electricity that
is to be displaced by electricity generated under the Project Activity. There is no alternative power generation source at the cement factory. There is no flaring in the baseline; therefore, emissions from such a source are not relevant. The calculations are performed as follows:
BEy = BEelec,y Where: BEy is the total baseline emissions in the year y in tons CO2 BEelec,y is the baseline emissions from electricity during the year y in tons CO2
Baseline emissions from electricity that is displaced by the project activity (BEelec,y) The emissions from the grid-electricity displaced in year y are calculated as follows: )( ,,,,,, ∑∑ ×××=
iyjielecyji
jwgcapyelec EFEGffBE
Where: EGy is the electricity supplied by the Project Activity to the cement plant that, in the absence
of the Project Activity, would have been supplied by the Southern China Power Grid, expressed in MWh;
EFelec,y is the CO2 emission factor for the Southern China Power Grid, in tCO2/MWh; fcap is the cap for the volume of waste heat generated by the project activity in year y,
calculated as described in method-2 of the methodology; fwg is the fraction of electricity produced using waste heat in the project activity.
As directed in the methodology, the emissions factor for the electricity grid is calculated according to the tool to calculate the emission factor for an electricity system, since the electricity generated from the waste heat will displace electricity that would have been generated by other power plants in the baseline grid. The calculation procedures are as follows:
PROJECT DESIGN DOCUMENT FORM (CDM PDD) - Version 03 CDM – Executive Board page 18 STEP 1. Identify the relevant electric power system
The Chinese DNA - Office of Climate Change under the National Development and Reform Commission - has published a delineation of the project electricity system and connected electricity system4. According to the delineation, the local grid to which the Project activity is connected is the Southern China Power Grid.
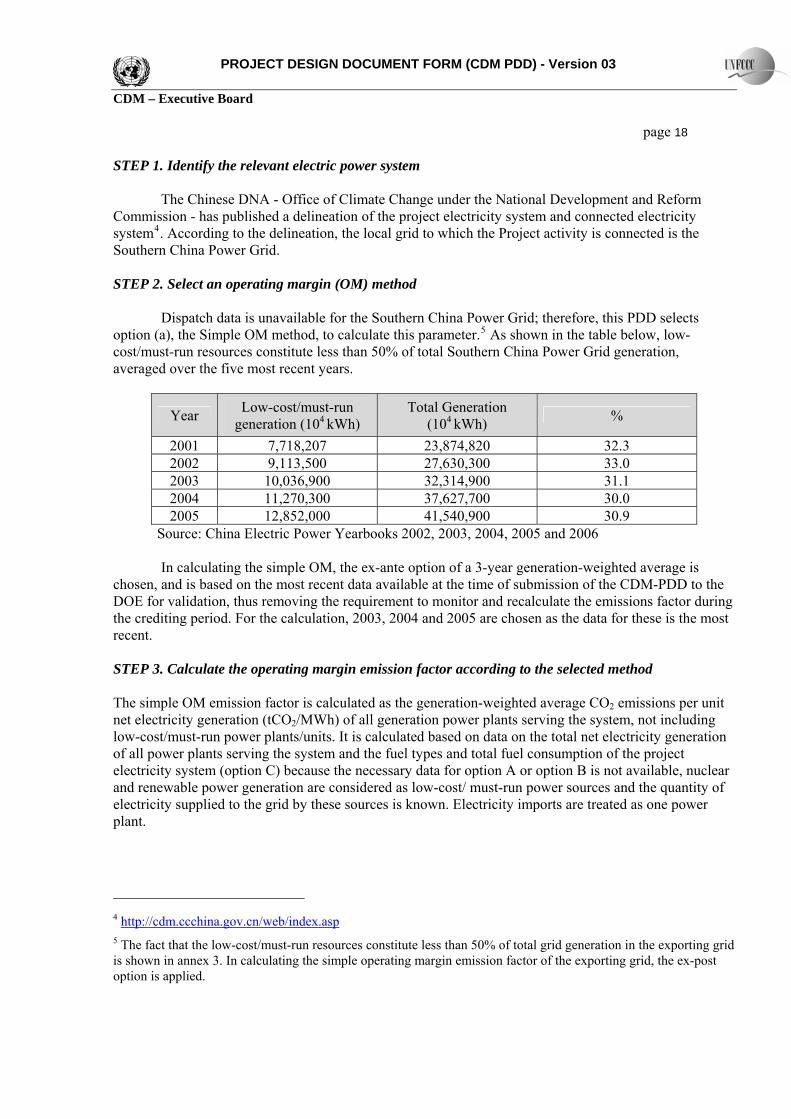
STEP 2. Select an operating margin (OM) method Dispatch data is unavailable for the Southern China Power Grid; therefore, this PDD selects option (a), the Simple OM method, to calculate this parameter.5 As shown in the table below, low-cost/must-run resources constitute less than 50% of total Southern China Power Grid generation, averaged over the five most recent years.
Year Low-cost/must-run generation (104 kWh)
Total Generation (104 kWh) %
2001 7,718,207 23,874,820 32.3 2002 9,113,500 27,630,300 33.0 2003 10,036,900 32,314,900 31.1 2004 11,270,300 37,627,700 30.0 2005 12,852,000 41,540,900 30.9
Source: China Electric Power Yearbooks 2002, 2003, 2004, 2005 and 2006 In calculating the simple OM, the ex-ante option of a 3-year generation-weighted average is
chosen, and is based on the most recent data available at the time of submission of the CDM-PDD to the DOE for validation, thus removing the requirement to monitor and recalculate the emissions factor during the crediting period. For the calculation, 2003, 2004 and 2005 are chosen as the data for these is the most recent.
STEP 3. Calculate the operating margin emission factor according to the selected method The simple OM emission factor is calculated as the generation-weighted average CO2 emissions per unit net electricity generation (tCO2/MWh) of all generation power plants serving the system, not including low-cost/must-run power plants/units. It is calculated based on data on the total net electricity generation of all power plants serving the system and the fuel types and total fuel consumption of the project electricity system (option C) because the necessary data for option A or option B is not available, nuclear and renewable power generation are considered as low-cost/ must-run power sources and the quantity of electricity supplied to the grid by these sources is known. Electricity imports are treated as one power plant.
4 http://cdm.ccchina.gov.cn/web/index.asp5 The fact that the low-cost/must-run resources constitute less than 50% of total grid generation in the exporting grid is shown in annex 3. In calculating the simple operating margin emission factor of the exporting grid, the ex-post option is applied.

PROJECT DESIGN DOCUMENT FORM (CDM PDD) - Version 03 CDM – Executive Board page 19
ygrid
iyiCOyiyi
yOMsimplegrid EG
EFNCVFCEF
,
,,2,,
,,
∑ ××=
Where: EFgrid,OMsimple,y Simple operating margin CO2 emission factor in year y (tCO2/MWh) FCi,y Amount of fossil fuel type i consumed in the project electricity system in year y (mass or
volume unit) NCVi,y Net calorific value (energy content) of fossil fuel type i in year y (GJ/mass or volume
unit) EFCO2,i,y CO2 emission factor of fossil fuel type i in year y (tCO2/GJ) EGgrid,y Net electricity generated and delivered to the grid by all power sources serving the
system, not including low-cost/must-run power plants/units in year y (MWh) i All fossil fuel types combusted in power sources in the project electricity system in year
y y The three most recent years for which data is available at the time of submission of the
CDM-PDD to the DOE for validation (ex-ante option)
STEP 4. Identify the cohort of power units to be included in the build margin Since the plant specific data for the Southern China Power Grid is not available, the capacity addition from one year to the next and the efficiency of the best available technology are used as a basis for determining the build margin of the grid, as clarified by the CDM Executive Board6. The build margin emission factor will be calculated ex-ante based on the most recent information available at the time of CDM-PDD submission to the DOE for validation and applied during the first crediting period. For the second crediting period, the build margin emission factor will be updated based on the most recent information available at the time of submission of the request for renewal of the crediting period to the DOE. For the third crediting period, the build margin emission factor calculated for the second crediting period will be used (Option 1). STEP 5. Calculate the build margin emission factor The procedure to calculate the Build Margin emission factor conservatively is as follows: 1) Using the latest available statistical data determine the two years with added capacity closest to 20% (above 20%)
- The capacity of each previous year x is compared with the capacity of the most recent year.
1001year x theofCapacity
yearrecent most theofCapacity (%)increaseCapacity ×⎟⎟⎠
⎞⎜⎜⎝
⎛−=
- Select the year of which the capacity increase is closest to and above 20% for the build margin emission factor calculation
2) Calculate the build margin emission factor for that year with the efficiency of the best available technology 6 http://cdm.unfccc.int/UserManagement/FileStorage/AM_CLAR_QEJWJEF3CFBP1OZAK6V5YXPQKK7WYJ
PROJECT DESIGN DOCUMENT FORM (CDM PDD) - Version 03 CDM – Executive Board page 20
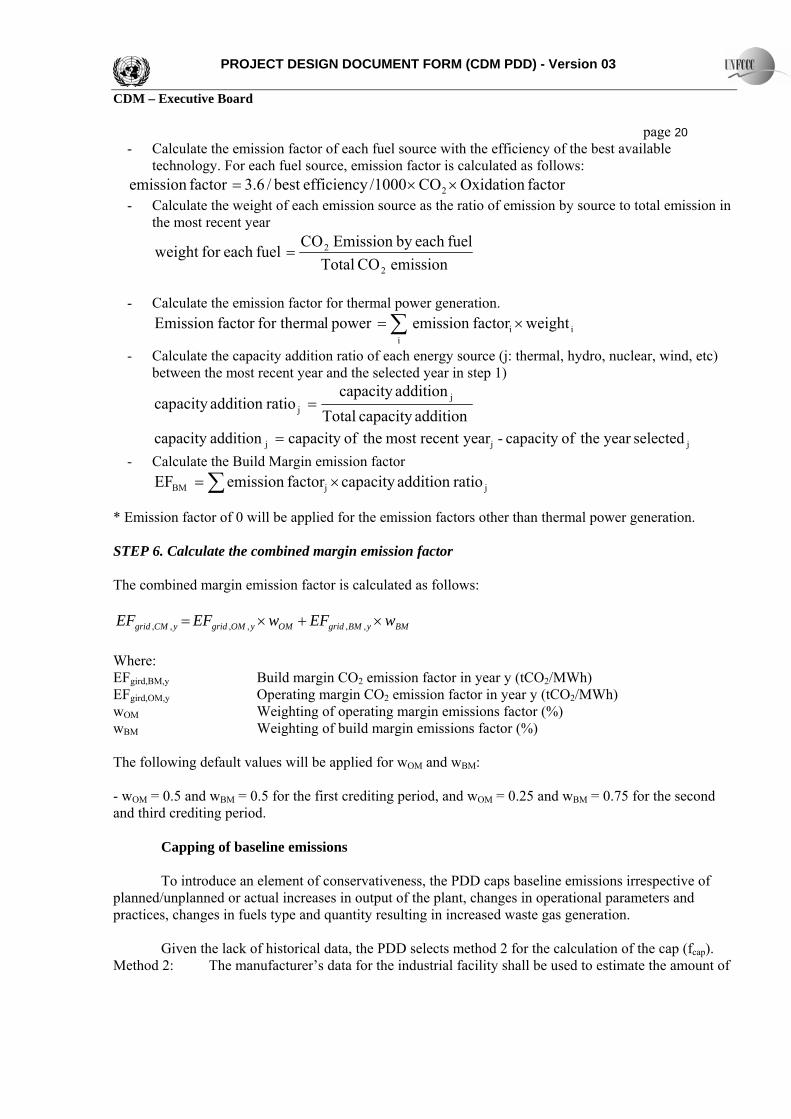
- Calculate the emission factor of each fuel source with the efficiency of the best available technology. For each fuel source, emission factor is calculated as follows:
factor Oxidation CO /1000efficiencybest /6.3factor emission 2 ××= - Calculate the weight of each emission source as the ratio of emission by source to total emission in
the most recent year
emission CO Totalfueleach by Emission CO fueleach for weight
2
2=
- Calculate the emission factor for thermal power generation.
ii
i weightfactoremission power lfor thermafactor Emission ∑ ×=
- Calculate the capacity addition ratio of each energy source (j: thermal, hydro, nuclear, wind, etc) between the most recent year and the selected year in step 1)
addition capacity Totaladditioncapacity
ratioaddition capacity jj =
jjj selectedyear theofcapacity - yearrecent most theofcapacity additioncapacity = - Calculate the Build Margin emission factor
∑ ×= jjBM ratioaddition capacity factoremission EF
* Emission factor of 0 will be applied for the emission factors other than thermal power generation. STEP 6. Calculate the combined margin emission factor The combined margin emission factor is calculated as follows:
BMyBMgridOMyOMgridyCMgrid wEFwEFEF ×+×= ,,,,,, Where: EFgird,BM,y Build margin CO2 emission factor in year y (tCO2/MWh) EFgird,OM,y Operating margin CO2 emission factor in year y (tCO2/MWh) wOM Weighting of operating margin emissions factor (%) wBM Weighting of build margin emissions factor (%) The following default values will be applied for wOM and wBM: - wOM = 0.5 and wBM = 0.5 for the first crediting period, and wOM = 0.25 and wBM = 0.75 for the second and third crediting period.
Capping of baseline emissions To introduce an element of conservativeness, the PDD caps baseline emissions irrespective of
planned/unplanned or actual increases in output of the plant, changes in operational parameters and practices, changes in fuels type and quantity resulting in increased waste gas generation.
Given the lack of historical data, the PDD selects method 2 for the calculation of the cap (fcap).
Method 2: The manufacturer’s data for the industrial facility shall be used to estimate the amount of

PROJECT DESIGN DOCUMENT FORM (CDM PDD) - Version 03 CDM – Executive Board page 21 waste heat the industrial facility generates per unit of product generated by the process that generates the waste heat.
The value arrived at based on the manufacturer’s information shall be used to estimate the baseline cap fcap. The documentation of the assessment shall be made available to the DOE for verification.
yWG
BLWGcap Q
Qf
,
,=
Where:
QWG,y Quantity of waste gas generated prior to the start of the project activity (Nm3) QWG,BL Estimated quantity of waste heat generated prior to the start of the project (Nm3),
estimated using the following equation: productwgproductBLBLWG qQQ ,,, ×=
QBL,product Production of clinker in the baseline. qwg,product Amount of waste heat the industrial facility generates per unit of product generated by the
process that generates waste heat. Project Activity
According to ACM0012, the project emissions (PEy) to consider are those associated with the
increased use of auxiliary fossil fuels (PEAF,y) and the electricity consumption of gas cleaning equipment (PEEL,y).
PEy = PEAF,y + PEEL,y
Project emissions due to auxiliary fuel The Project will not require any additional combustion of fossil fuel; emissions from this source
are, therefore, considered to be zero. Project emissions due to electricity consumption of gas cleaning equipment The Project will be using the same gas cleaning equipment as that which would have been used in
the baseline scenario so emissions from this potential source can be ignored. As described above, Project emissions, PEy, are therefore zero. Leakage No leakage is applicable under this methodology.
Emission Reductions
The project activity reduces CO2 emissions either from the grid by using waste heat to produce electricity. As described in the methodology, the emission reduction during a given year y, ERy, is calculated using the following equation:

PROJECT DESIGN DOCUMENT FORM (CDM PDD) - Version 03 CDM – Executive Board page 22
ERy = BEy - PEy Where:
ERy Total emissions reductions during the year y in tonnes CO2e PEy Emissions from the project activity during the year y in tonnes CO2e BEy Baseline emissions for the project activity during the year y in tonnes of CO2e
B.6.2. Data and parameters that are available at validation: Data / Parameter: EFgrid,y
Data unit: tCO2/MWh Description: CO2 emission factor of the grid Source of data used: Chinese DNA Value applied: 0.7995 Justification of the choice of data or description of measurement methods and procedures actually applied :
Calculated based on data published by the Chinese DNA, as described in Section B.6.1
Any comment: Data / Parameter: QWG,BL
Data unit: Nm3/hour Description: Quantity of waste heat (flue gas) generated prior to the start of the project
activity Source of data used: Calculated ex ante from the manufacturer’s specifications for the first crediting
period and using actual data for any subsequent crediting periods. Value applied: 540,000 (per production line) Justification of the choice of data or description of measurement methods and procedures actually applied :
Calculated as described in method-2 for calculation of the baseline cap in the methodology, using the manufacturer’s specifications, assuming production of 4,500 tonnes of clinker/hour.
Any comment: Data used to be reviewed by the DOE during validation. Data / Parameter: qwg,product
Data unit: Nm3
Description: Waste heat (flue gas) produced per tonne of clinker Source of data used: Calculated ex ante from the manufacturer’s specifications for the first crediting
period and using actual historical data for any subsequent crediting periods. Value applied: 120 Justification of the choice of data or description of measurement methods
Calculated using QWG,BL and assuming each line is producing 4,500t/h

PROJECT DESIGN DOCUMENT FORM (CDM PDD) - Version 03 CDM – Executive Board page 23 and procedures actually applied : Any comment: Data used to be reviewed by the DOE during validation. Data / Parameter: fcap
Data unit: Fraction
Description: Cap for baseline emissions Source of data used: Calculation Value applied: 1 Justification of the choice of data or description of measurement methods and procedures actually applied :
Calculated using method 2 from the methodology. Manufacturer’s specifications to be made available to the DOE at validation.
Any comment: Data / Parameter: fwg
Data unit: Fraction
Description: Fraction of electricity produced by the project using waste gas Source of data used: Calculated ex ante from the manufacturers specifications Value applied: 1 Justification of the choice of data or description of measurement methods and procedures actually applied :
The Project will be generating electricity purely from the waste heat from the kilns. As described in the methodology, this parameter is therefore equal to 1.
Any comment: Data / Parameter: EFgird,BM,y
Data unit: tCO2/MWh
Description: Build margin CO2 emission factor in year y Source of data used: Calculations Value applied: 0.6388 Justification of the choice of data or description of measurement methods and procedures actually applied :
Calculated as directed in B.6.1. Calculations shown in Annex 3.
Any comment: Data / Parameter: EFgird,OM,y
Data unit: tCO2/MWh
Description: Build margin CO2 emission factor in year y Source of data used: Calculations Value applied: 0.9602

PROJECT DESIGN DOCUMENT FORM (CDM PDD) - Version 03 CDM – Executive Board page 24 Justification of the choice of data or description of measurement methods and procedures actually applied :
Calculated as directed in B.6.1. Calculations shown in Annex 3.
Any comment: Data / Parameter: wOM
Data unit: %
Description: Weighting of operating margin emissions factor% Source of data used: Tool to calculate the emission factor for an electricity system Value applied: 0.5 Justification of the choice of data or description of measurement methods and procedures actually applied :
As directed in the tool, a value of 0.5 is to be used for the first crediting period; and a value of 0.25 is to be used for the second and third crediting periods.
Any comment: Data / Parameter: wBM
Data unit: %
Description: Weighting of build margin emissions factor Source of data used: Tool to calculate the emission factor for an electricity system Value applied: 0.5 Justification of the choice of data or description of measurement methods and procedures actually applied :
As directed in the tool, a value of 0.5 is to be used for the first crediting period; and a value of 0.75 is to be used for the second and third crediting periods.
Any comment: Data / Parameter: QBL,product
Data unit: Tonnes
Description: Production of clinker Source of data used: Equal to production for the first crediting period. Value applied: - Justification of the choice of data or description of measurement methods and procedures actually applied :
Because the current upgrade has yet to be fully completed, applicable historical production data for clinker does not exist; therefore, for the first crediting period, this is assumed to be equivalent to actual production. For the second and third crediting periods, historical data will be used.
Any comment:
B.6.3 Ex-ante calculation of emission reductions:

PROJECT DESIGN DOCUMENT FORM (CDM PDD) - Version 03 CDM – Executive Board page 25
Baseline Emissions
BEy = BEelec,y
Baseline emissions from electricity that is displaced by the project activity The emissions from the grid-electricity displaced in year y are calculated as follows: )( ,,,,,, ∑∑ ×××=
iyjielecyji
jwgcapyelec EFEGffBE
BEy = 1 × 1 × (79,488 × 0.7995) = 63,551 tCO2e
Project Activity
As described in section B.6.1., Project emissions, PEy, are equal to zero.
Leakage No leakage is applicable under this methodology.
Emission Reductions
ERy = BEy - PEy = 63,551 tCO2e – 0 B.6.4 Summary of the ex-ante estimation of emission reductions:
Year Estimation of
baseline emissions (tCO2e)
Estimation of project
emissions (tCO2e)
Estimation of leakage
(tCO2e)
Estimation of emission
reductions (tCO2e)
Year 1 (beginning 01/10/2008) 63,551 0 0 63,551 Year 2 (beginning 01/10/2009) 63,551 0 0 63,551 Year 3 (beginning 01/10/2010) 63,551 0 0 63,551 Year 4 (beginning 01/10/2011) 63,551 0 0 63,551 Year 5 (beginning 01/10/2012) 63,551 0 0 63,551 Year 6 (beginning 01/10/2013) 63,551 0 0 63,551 Year 7 (beginning 01/10/2014) 63,551 0 0 63,551
TOTAL 444,857 0 0 444,857 B.7 Application of the monitoring methodology and description of the monitoring plan:
PROJECT DESIGN DOCUMENT FORM (CDM PDD) - Version 03 CDM – Executive Board page 26
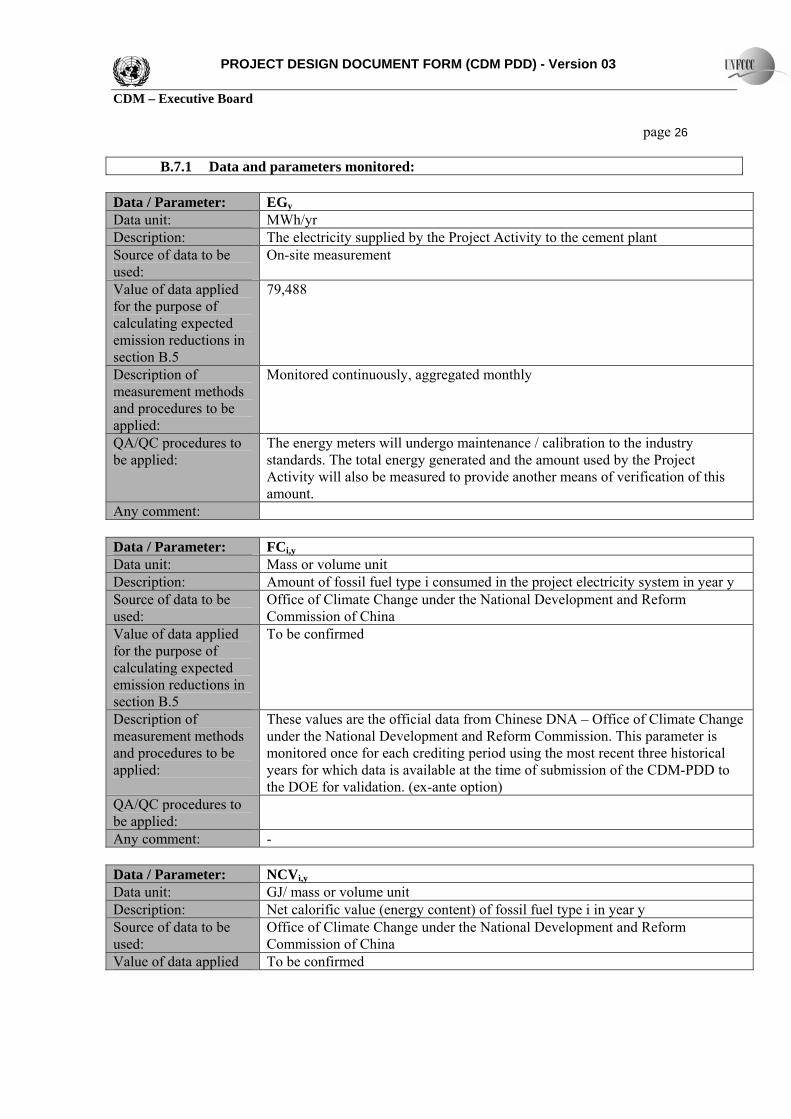
B.7.1 Data and parameters monitored:
Data / Parameter: EGy
Data unit: MWh/yr Description: The electricity supplied by the Project Activity to the cement plant Source of data to be used:
On-site measurement
Value of data applied for the purpose of calculating expected emission reductions in section B.5
79,488
Description of measurement methods and procedures to be applied:
Monitored continuously, aggregated monthly
QA/QC procedures to be applied:
The energy meters will undergo maintenance / calibration to the industry standards. The total energy generated and the amount used by the Project Activity will also be measured to provide another means of verification of this amount.
Any comment:
Data / Parameter: FCi,y
Data unit: Mass or volume unit Description: Amount of fossil fuel type i consumed in the project electricity system in year y Source of data to be used:
Office of Climate Change under the National Development and Reform Commission of China
Value of data applied for the purpose of calculating expected emission reductions in section B.5
To be confirmed
Description of measurement methods and procedures to be applied:
These values are the official data from Chinese DNA – Office of Climate Change under the National Development and Reform Commission. This parameter is monitored once for each crediting period using the most recent three historical years for which data is available at the time of submission of the CDM-PDD to the DOE for validation. (ex-ante option)
QA/QC procedures to be applied:
Any comment: - Data / Parameter: NCVi,y
Data unit: GJ/ mass or volume unit Description: Net calorific value (energy content) of fossil fuel type i in year y Source of data to be used:
Office of Climate Change under the National Development and Reform Commission of China
Value of data applied To be confirmed
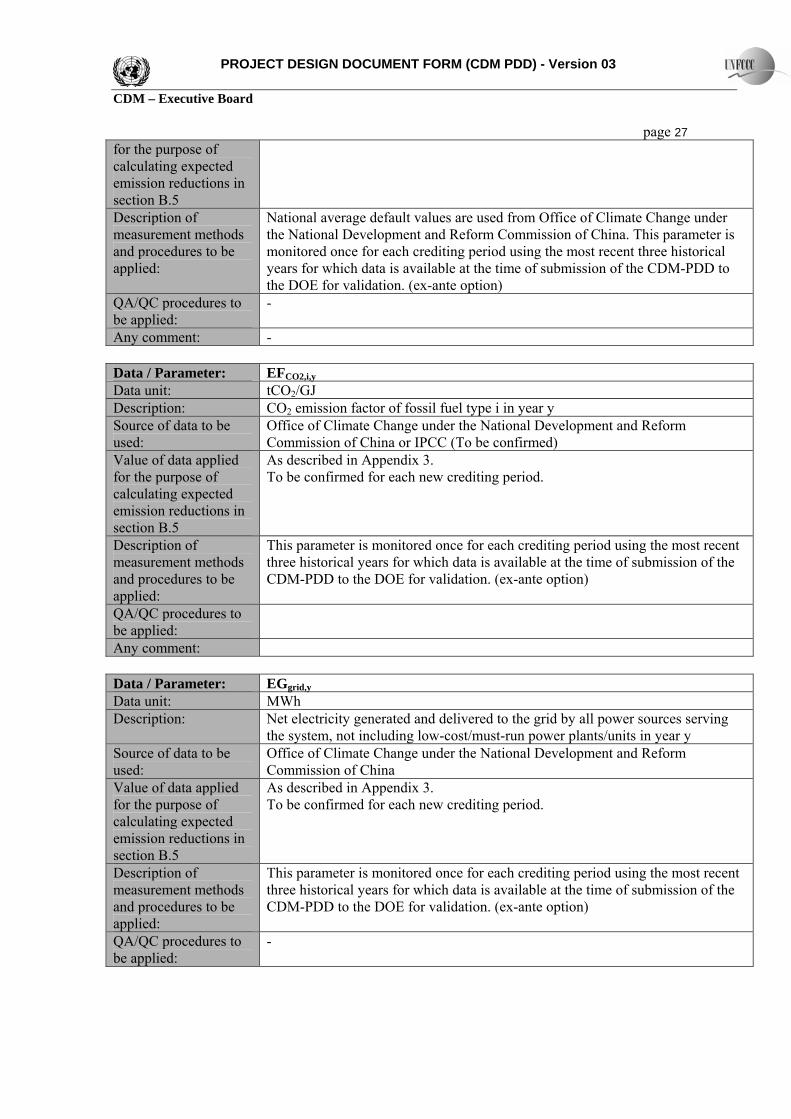
PROJECT DESIGN DOCUMENT FORM (CDM PDD) - Version 03 CDM – Executive Board page 27 for the purpose of calculating expected emission reductions in section B.5 Description of measurement methods and procedures to be applied:
National average default values are used from Office of Climate Change under the National Development and Reform Commission of China. This parameter is monitored once for each crediting period using the most recent three historical years for which data is available at the time of submission of the CDM-PDD to the DOE for validation. (ex-ante option)
QA/QC procedures to be applied:
-
Any comment: - Data / Parameter: EFCO2,i,y
Data unit: tCO2/GJ Description: CO2 emission factor of fossil fuel type i in year y Source of data to be used:
Office of Climate Change under the National Development and Reform Commission of China or IPCC (To be confirmed)
Value of data applied for the purpose of calculating expected emission reductions in section B.5
As described in Appendix 3. To be confirmed for each new crediting period.
Description of measurement methods and procedures to be applied:
This parameter is monitored once for each crediting period using the most recent three historical years for which data is available at the time of submission of the CDM-PDD to the DOE for validation. (ex-ante option)
QA/QC procedures to be applied:
Any comment: Data / Parameter: EGgrid,y
Data unit: MWh Description: Net electricity generated and delivered to the grid by all power sources serving
the system, not including low-cost/must-run power plants/units in year y Source of data to be used:
Office of Climate Change under the National Development and Reform Commission of China
Value of data applied for the purpose of calculating expected emission reductions in section B.5
As described in Appendix 3. To be confirmed for each new crediting period.
Description of measurement methods and procedures to be applied:
This parameter is monitored once for each crediting period using the most recent three historical years for which data is available at the time of submission of the CDM-PDD to the DOE for validation. (ex-ante option)
QA/QC procedures to be applied:
-

PROJECT DESIGN DOCUMENT FORM (CDM PDD) - Version 03 CDM – Executive Board page 28 Any comment: -
Data / Parameter: QWG,y
Data unit: Nm3/hour Description: Quantity of waste heat (flue gas) used per hour for energy generation during year
y Source of data to be used:
Actual measurements. This PDD assumes it to be the same as the baseline value.
Value of data applied for the purpose of calculating expected emission reductions in section B.5
540,000 (per production line)
Description of measurement methods and procedures to be applied:
Monitored continuously using a flow meter.
QA/QC procedures to be applied:
Measuring equipment should be calibrated on a regular basis. During calibration and maintenance, alternative equipment should be used for monitoring.
Any comment: Monitored as part of baseline emissions capping. Assumed to be equal to QWG,y in this PDD.
B.7.2 Description of the monitoring plan:
Purpose The monitoring methodology clearly describes how to identify and collect the necessary data. The following is a summary list of the main items to be monitored: Monitoring framework
The figure below outlines the operational and management structure that Tapai Group will implement to monitor emission reductions and any leakage effects generated by the Project Activity. The existing environmental management team at the plant will be responsible for the monitoring of all the aforementioned parameters. This team is composed of a general manager and a group of operators. The group of operators, under the supervision of the general manager, will be assigned for monitoring of different parameters on a timely basis and will perform the recording and archiving of data in an orderly manner. Monitoring reports will be forwarded to an reviewed by the general manager on a monthly basis in order to ensure the Project follows the requirements of the monitoring plan. The performance of the Project will be reviewed and analyzed by consultants on a regular basis.

PROJECT DESIGN DOCUMENT FORM (CDM PDD) - Version 03 CDM – Executive Board page 29
G e n e r a l M a n a g e r
O p e r a to r s
D O E V e r if ic a t io n
P e r fo r m a n c e R e v ie w b y
C o n s u lt a n tD a t a A r c h iv in g
G e n e r a l M a n a g e r
O p e r a to r s
D O E V e r if ic a t io n
P e r fo r m a n c e R e v ie w b y
C o n s u lt a n tD a t a A r c h iv in g
Figure: Operational and management structure for monitoring the Project activity. Monitoring equipment and installation The Project Activity requires the monitoring of the following items:
• Electricity demand of the cement works and other local loads within the cement works prior to start of the project, and throughout the project.
• Waste heat use within the cement works and normal uses of waste heat in cement production commonly practiced in the region or host country.
• Regulations and/or policy that could influence the use of waste heat and generation of power in the region.
• Project electricity generation, including: - The plant’s electricity imports and exports. - Electricity demand and generation of the proposed project activity. - Confirmation to meet applicability conditions.
No Project emissions are considered to occur under Project Activity.
Calibration
Regular calibration will be necessary for the monitoring equipment. The necessary calibration
will be performed according to the manufacturer’s guidelines, or according to the applicable regulations, by a suitably skilled technician at the required frequency (at least once a year). A certificate of calibration will be provided for each piece of equipment after completion.
Data management All data collected as part of monitoring plan should be archived electronically and be kept at least
2 years after the end of the last crediting period.

PROJECT DESIGN DOCUMENT FORM (CDM PDD) - Version 03 CDM – Executive Board page 30
Monitoring report
A monitoring report in line with CDM regulations and the requirements of this monitoring
methodology will be issued annually by the general manager. The monitoring report will contain a summary of the whole monitoring plan, and will describe
the implementation of the monitoring plan in that particular year, present the relevant results and data, and calculate emission reductions for the period. The report will include:
• Quality assurance reports for the monitoring equipment; • Calibration reports for the monitoring equipment (including relevant standards and
regulations); • Any maintenance and repair of monitoring equipment; • The qualifications of the persons responsible for the monitoring and calculations; • The tests performed and data obtained; • Emission reduction calculations; • A summary of the monitoring plan in that particular year; • Any other information relevant to the monitoring plan.
B.8 Date of completion of the application of the baseline study and monitoring methodology and the name of the responsible person(s)/entity(ies) The baseline study was completed on 12/02/2008 by: Joseph Cairnes/Matthew Setterfield Clean Energy Finance Committee
Mitsubishi UFJ Securities (MUS) 8th Floor, Mitsubishi Building, 2-5-2 Marunouchi, Chiyoda-ku
Tokyo, 100-0005, Japan
Tel: +81-3-6213-6302 Fax: +81-3-6213-6175
E-mail: [email protected] SECTION C. Duration of the project activity / crediting period C.1 Duration of the project activity: C.1.1. Starting date of the project activity: 01/04/2007 C.1.2. Expected operational lifetime of the project activity:

PROJECT DESIGN DOCUMENT FORM (CDM PDD) - Version 03 CDM – Executive Board page 31 25 years C.2 Choice of the crediting period and related information: C.2.1. Renewable crediting period
C.2.1.1. Starting date of the first crediting period: 01/10/2008 C.2.1.2. Length of the first crediting period:
Seven (7) years
C.2.2. Fixed crediting period: C.2.2.1. Starting date: Not applicable. C.2.2.2. Length: Not applicable. SECTION D. Environmental impacts D.1. Documentation on the analysis of the environmental impacts, including transboundary impacts:
The feasibility study for the Project looked in depth at the environmental effects of the Project activity. The EIA for the Project was approved by the Environmental Protection Bureau of Guangdong Province on December 24, 2006. D.2. If environmental impacts are considered significant by the project participants or the host Party, please provide conclusions and all references to support documentation of an environmental impact assessment undertaken in accordance with the procedures as required by the host Party:
The Project Activity will involve the capture and utilization of a waste stream that was released directly into the atmosphere. That waste stream contains a significant amount of energy in the form of heat, and a large amount of dust. After implementation, the waste stream will be significantly reduced.
The following four factors were considered significant in the environmental review: Treatment of exhaust gas: The stack gas emission points and stack gas cleaning facilities will be the same as in the baseline scenario. However, after having been used to generate electricity, the waste stream will be significantly cooler significantly improving the efficacy of the dust removal facilities, and therefore the quality of the stack gas upon release. Noise treatment: The steam turbine and water pumps to be installed in the Project are the main producers of noise; however, they produce significantly less noise than other existing facilities at the cement plant. To reduce the noise pollution from these sources, the turbine engine room will be constructed in a shell shape. The water pumps will be installed in an enclosed environment

PROJECT DESIGN DOCUMENT FORM (CDM PDD) - Version 03 CDM – Executive Board page 32
which will allow little noise to be released. The noise pollution, when measured at the plant boundary, is very low. Wastewater treatment: The water used to cool the equipment will be recycled. The recycling rate is very close to 100%, with the loss resulting from evaporation, and a small emission of water with a low pH from the water purification system. The Project activity will use a Neutral Pool, an acid-base neutralization device, to ensure the wastewater from the purifier meets discharge standards at the point of release. Landscaping: Landscaping is an integral part of reducing the whole plant’s environmental impact. In the redevelopment the Project entails, arbores, shrubs and grasses will be planted in the area surrounding the plant and along the nearby roads. Whilst making the area a more pleasant environment, this will also improve the local environment by adjusting temperature and humidity, whilst purifying air and mitigating noise. As the Project significantly reduces the overall environmental impact of the site, the management
of the environmental issues associated with the Project can be performed by the plant’s existing environmental management team. SECTION E. Stakeholders’ comments
A consultation was organized by Tapai Group to confirm the impacts of the waste heat recovery
project on stakeholders. The consultation period lasted for one month, from the 20th of August to the 20th of September 2007, and consisted of the following elements:
• Announcement on the website • A stakeholders’ meeting • A questionnaire survey
Announcement on the website On its website, www.tapai.com, Tapai Group included information on the Project, CDM and the
stakeholder consultation process, and provided a telephone number and an opportunity to post comments by e-mail.
Stakeholders’ meeting To ensure wide participation in the meeting, announcements were made on the Tapai Group
website and by placing notices in the local communities. In addition to the above, further invitations were made by mail and by telephone to key stakeholders.
In addition to the three members of Project’s working team, a total of twenty-two people attended
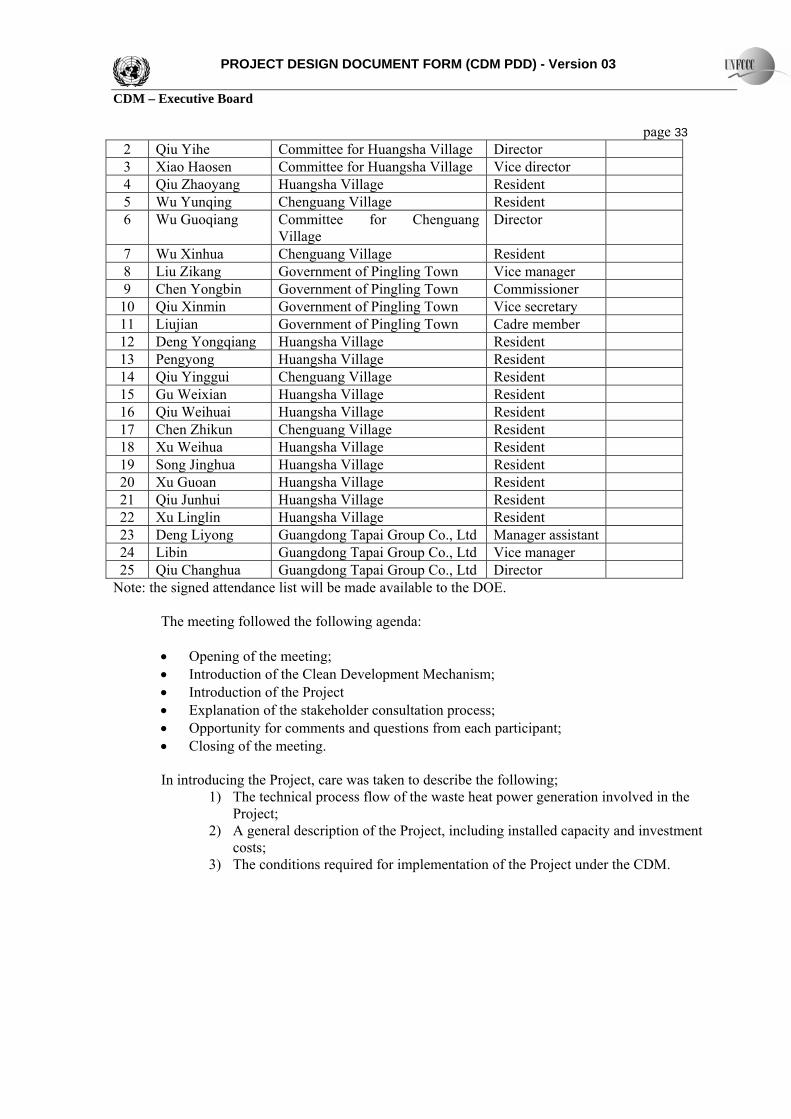
the stakeholders’ meeting, which was held from 14:30 to 16:30 on the 1st of September 2007 in the general meeting room of Guangdong Tapai Cement Co., Ltd. Those present included representatives from the local towns and villages, including local government representatives, members of residents’ associations and interested local parties. The attendees were as follows:
Name list for participant people representatives No. Name Affiliation Position Remark 1 Zhong Huantang Committee for Chenguang
Village Vice director
PROJECT DESIGN DOCUMENT FORM (CDM PDD) - Version 03 CDM – Executive Board page 33
2 Qiu Yihe Committee for Huangsha Village Director 3 Xiao Haosen Committee for Huangsha Village Vice director 4 Qiu Zhaoyang Huangsha Village Resident 5 Wu Yunqing Chenguang Village Resident 6 Wu Guoqiang Committee for Chenguang
Village Director
7 Wu Xinhua Chenguang Village Resident 8 Liu Zikang Government of Pingling Town Vice manager 9 Chen Yongbin Government of Pingling Town Commissioner
10 Qiu Xinmin Government of Pingling Town Vice secretary 11 Liujian Government of Pingling Town Cadre member 12 Deng Yongqiang Huangsha Village Resident 13 Pengyong Huangsha Village Resident 14 Qiu Yinggui Chenguang Village Resident 15 Gu Weixian Huangsha Village Resident 16 Qiu Weihuai Huangsha Village Resident 17 Chen Zhikun Chenguang Village Resident 18 Xu Weihua Huangsha Village Resident 19 Song Jinghua Huangsha Village Resident 20 Xu Guoan Huangsha Village Resident 21 Qiu Junhui Huangsha Village Resident 22 Xu Linglin Huangsha Village Resident 23 Deng Liyong Guangdong Tapai Group Co., Ltd Manager assistant 24 Libin Guangdong Tapai Group Co., Ltd Vice manager 25 Qiu Changhua Guangdong Tapai Group Co., Ltd Director
Note: the signed attendance list will be made available to the DOE.
The meeting followed the following agenda: • Opening of the meeting; • Introduction of the Clean Development Mechanism; • Introduction of the Project • Explanation of the stakeholder consultation process; • Opportunity for comments and questions from each participant; • Closing of the meeting. In introducing the Project, care was taken to describe the following;
1) The technical process flow of the waste heat power generation involved in the Project;
2) A general description of the Project, including installed capacity and investment costs;
3) The conditions required for implementation of the Project under the CDM.
PROJECT DESIGN DOCUMENT FORM (CDM PDD) - Version 03 CDM – Executive Board page 34
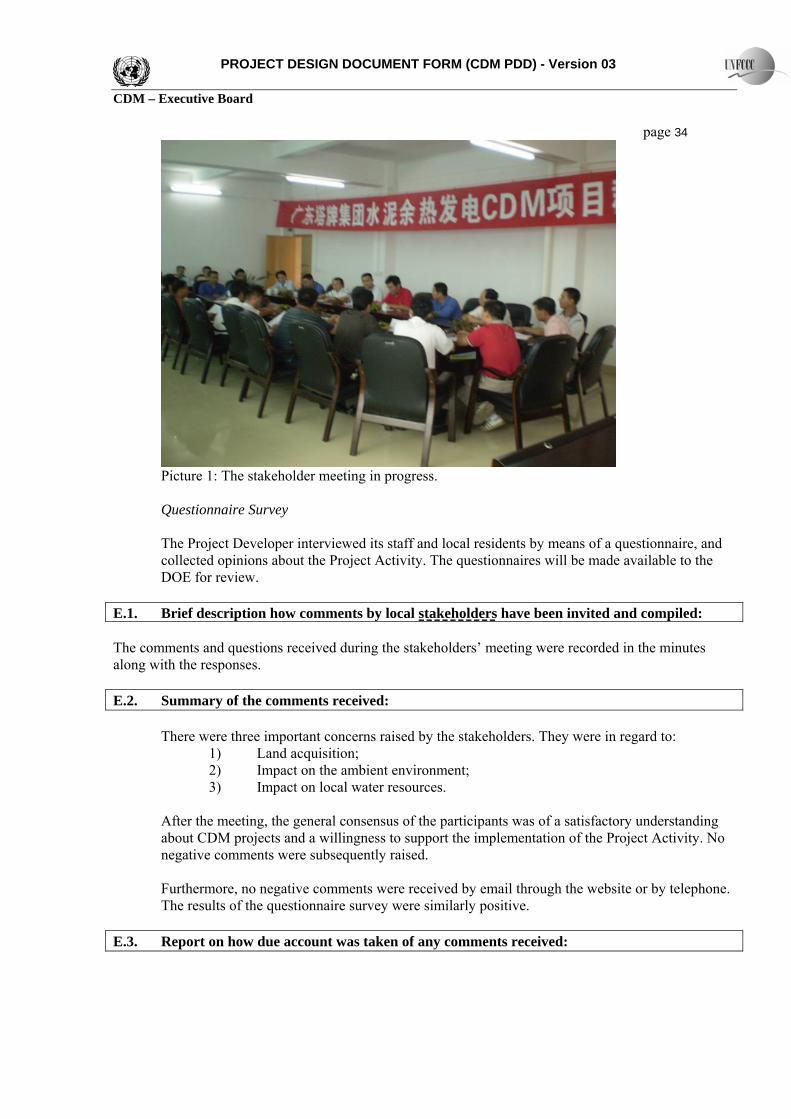
Picture 1: The stakeholder meeting in progress. Questionnaire Survey The Project Developer interviewed its staff and local residents by means of a questionnaire, and collected opinions about the Project Activity. The questionnaires will be made available to the DOE for review.
E.1. Brief description how comments by local stakeholders have been invited and compiled:
The comments and questions received during the stakeholders’ meeting were recorded in the minutes along with the responses.
E.2. Summary of the comments received: There were three important concerns raised by the stakeholders. They were in regard to:
1) Land acquisition; 2) Impact on the ambient environment; 3) Impact on local water resources.
After the meeting, the general consensus of the participants was of a satisfactory understanding about CDM projects and a willingness to support the implementation of the Project Activity. No negative comments were subsequently raised. Furthermore, no negative comments were received by email through the website or by telephone. The results of the questionnaire survey were similarly positive.
E.3. Report on how due account was taken of any comments received:

PROJECT DESIGN DOCUMENT FORM (CDM PDD) - Version 03 CDM – Executive Board page 35
The concerns were all answered during the stakeholder meeting, as follows: 1) Land acquisition: All of the new facilities will be installed inside the existing
boundary of the cement plant. No land acquisition will be necessary. 2) Impact on the ambient environment: Since the Project Activity involves the
utilisation of waste heat from the cement production process to generate electricity, there will be no additional pollution. Furthermore, the Project Activity will lead to a reduction in the dust emissions from the plant, improving the quality of the local environment. The Project will also reduce dependence of fossil fuel-derived electricity, which will lead to a reduction in associated pollutants such as NOx and SO2.
3) Impact on local water resources: The water cooling system to be used recycles close to 100% of the water it uses. There will be no significant discharge of wastewater, and, therefore, no impacts on the surrounding water resources.

PROJECT DESIGN DOCUMENT FORM (CDM PDD) - Version 03 CDM – Executive Board page 36
Annex 1
CONTACT INFORMATION ON PARTICIPANTS IN THE PROJECT ACTIVITY Organization: Guangdong Tapai Group Co., Ltd. Street/P.O.Box: Miaoxia Road Building: Tapai Building City: JiaoCheng Town,Jiaoling County State/Region: Meizhou City, Guangdong Province Postfix/ZIP: 514100 Country: P.R. China Telephone: 0753-7886315 FAX: 0753-7883229 E-Mail: [email protected] URL: http://tapai.com Represented by: Title: Manager Assistant Salutation: Mr. Last Name: Deng Middle Name: First Name: Liyong Department: Chief Engineer’s Room Mobile: +86 13928363839 Direct FAX: +86 752-7309220 Direct tel: +86 752-7309003 Personal E-Mail: [email protected] Organization: Mitsubishi Heavy Industries, Ltd Street/P.O.Box: 16-5 Konan 2-Chome, Minato-ku, Building: City: Tokyo State/Region: Postfix/ZIP: 108-8215 Country: Japan Telephone: +81 3-6716-3111 FAX: +81 3-6716-5800 E-Mail: URL: http://www.mhi.co.jp/index.html Represented by: Mayuko Tanaka Title: Salutation: Ms. Last Name: Tanaka Middle Name: First Name: Mayuko Department: Overseas Administration Department Mobile: Direct FAX: +81 3-2085-5801

PROJECT DESIGN DOCUMENT FORM (CDM PDD) - Version 03 CDM – Executive Board page 37 Direct tel: +81 3-6716-2085 Personal E-Mail: [email protected]

PROJECT DESIGN DOCUMENT FORM (CDM PDD) - Version 03 CDM – Executive Board page 38
Annex 2
INFORMATION REGARDING PUBLIC FUNDING The financial plans for the Project do not involve any public funding from Annex 1 countries.

PROJECT DESIGN DOCUMENT FORM (CDM PDD) - Version 03 CDM – Executive Board page 39
Annex 3
BASELINE INFORMATION
Baseline data and information can be found in B.6. TABLES OF OPERATING MARGING AND BUILD MARGIN CALCULATIONS
(i) Build Margin Added capacity in the South China Grid (2003-2005):
Installed capacity in the South China Grid, 2005Type Unit Guangdong Guangxi Guizhou Yunnan Total
Thermal power MW 35182.6 4931.2 4758.4 9634.8 54507Hydro power MW 9035.7 6085.3 7993.1 7233 30347.1Nuclear power MW 3780 0 0 0 3780Wind farm and others MW 83.4 0 0 0 83.4
Total MW 48081.7 11016.5 12751.5 16867.8 88717.5Data source: China Electricity Yearbook 2006
Installed capacity in the South China Grid, 2004Type Unit Guangdong Guangxi Guizhou Yunnan Total
Thermal power MW 30172.9 4378.1 4306.9 7801.8 46659.7Hydro power MW 8584.6 5040.4 7058.6 6896.5 27580.1Nuclear power MW 3780 0 0 0 3780Wind farm and others MW 83.4 0 0 0 83.4
Total MW 42620.9 9418.5 11365.5 14698.3 78103.2Data source: China Electricity Yearbook 2004
Installed capacity in the South China Grid, 2003Type Unit Guangdong Guangxi Guizhou Yunnan ian-Shen-Qia Total
Thermal power MW 27231.4 3190.1 3556.8 6465.8 0 40444.1Hydro power MW 8107.2 4525.2 6543.2 3713.7 2520 25409.3Nuclear power MW 3780 0 0 0 0 3780Wind farm and others MW 83.4 0 0 0 0 83.4
Total MW 39202 7715.3 10100 10179.5 2520 69716.8Data source: China Electricity Yearbook 2004

PROJECT DESIGN DOCUMENT FORM (CDM PDD) - Version 03 CDM – Executive Board page 40 Capacity 2003 2004 2005 Added between 2003-2005Thermal 40444.1 46659.7 54507 14062.9 74.01%Hydro 25409.3 27580.1 30347.1 4937.8 25.99%Nuclear 3780 3780 3780 0 0.00%Wind 83.4 83.4 83.4 0 0.00%Total 69716.8 78103.2 88717.5 19000.7 100.00%% of 2005 capacity 78.58% 88.04% 100.00%Capacity addition 21.42%
Thermal power generation in 2005
Fuel Type
tCO2 %
Raw coal 249240094 88.98%Clean coal 3537 0.00%Other washed coal 331356 0.12%Coke 327500 0.12%Crude oil 324367 0.12%Gasoline 19769 0.01%Diesel 1108250 0.40%Fuel oil 28010178 10.00%Other petroleum products 47094 0.02%Natural gas 196598 0.07%Coke oven gas 49287 0.02%Other coal gas 347626 0.12%Refinery gas 109217 0.04%
280114871 100.00%
CO2 Emission
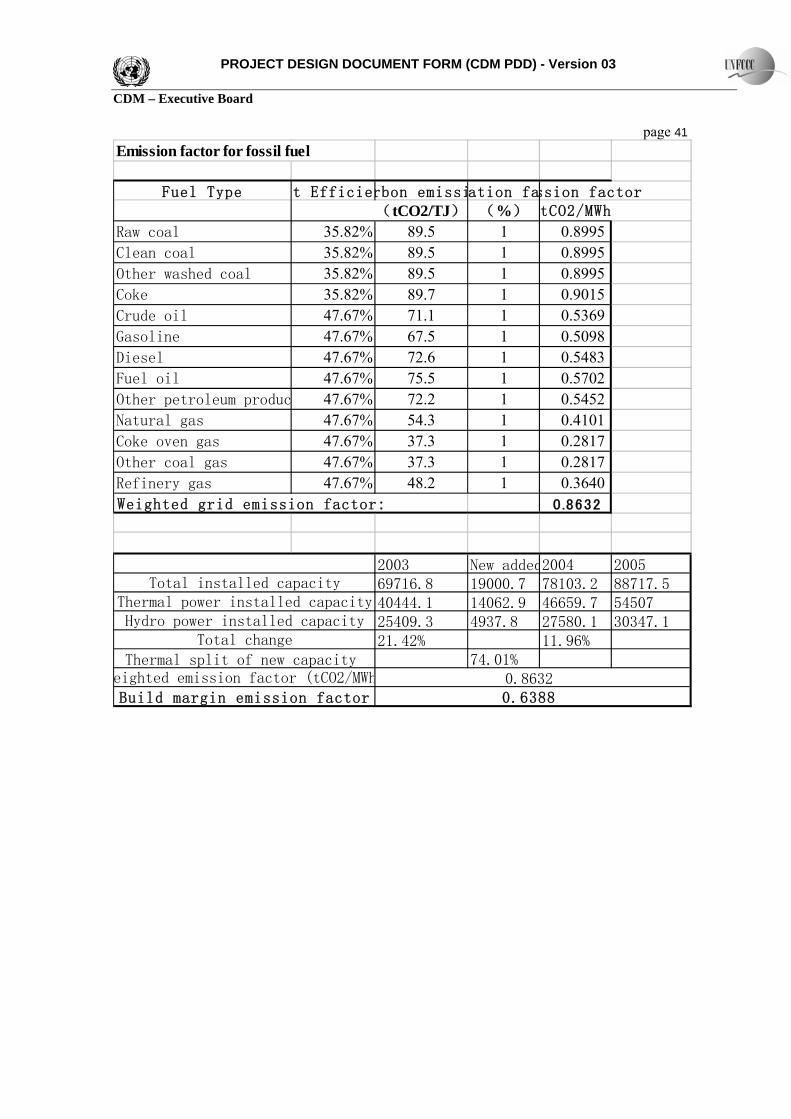
PROJECT DESIGN DOCUMENT FORM (CDM PDD) - Version 03 CDM – Executive Board page 41 Emission factor for fossil fuel
Fuel Type t Efficienrbon emissiation fassion factor(tCO2/TJ) (%) tCO2/MWh
Raw coal 35.82% 89.5 1 0.8995Clean coal 35.82% 89.5 1 0.8995Other washed coal 35.82% 89.5 1 0.8995Coke 35.82% 89.7 1 0.9015Crude oil 47.67% 71.1 1 0.5369Gasoline 47.67% 67.5 1 0.5098Diesel 47.67% 72.6 1 0.5483Fuel oil 47.67% 75.5 1 0.5702Other petroleum produc 47.67% 72.2 1 0.5452Natural gas 47.67% 54.3 1 0.4101Coke oven gas 47.67% 37.3 1 0.2817Other coal gas 47.67% 37.3 1 0.2817Refinery gas 47.67% 48.2 1 0.3640Weighted grid emission factor: 0.8632
2003 New added2004 200569716.8 19000.7 78103.2 88717.540444.1 14062.9 46659.7 5450725409.3 4937.8 27580.1 30347.121.42% 11.96%
74.01%
0.63880.8632
Build margin emission factor
Hydro power installed capacityTotal change
Thermal split of new capacity eighted emission factor (tCO2/MWh
Total installed capacityThermal power installed capacity

PROJECT DESIGN DOCUMENT FORM (CDM PDD) - Version 03 CDM – Executive Board page 42 (ii) Operating Margin CO2 emissions (tCO2e) for the South China Power Grid (2003):
Fuel Type Unit 广东省 广西 贵州省 云南省 Subtotal EF EF dation fac NCV CO2 EmissionGuangdong Guangxi Guizhou Yunnan (tc/TJ) (tCO2/TJ) (%) (MJ/t,km3) *I*J*44/12/10000(mass unit)
A B C D =A+B+C+D+E IPCC default H I J
K=G*H*I*J*44/12/1000 (volume unit)
Raw coal 10,000t 4491.79 831.84 2169.11 1405.27 8898.01 25.8 89.5 100 20908 166505435.81Clean coal 10,000t 0.05 0.05 25.8 89.5 100 26344 1178.89Other washed coal 10,000t 36.38 20.37 56.75 25.8 89.5 100 8363 424767.22Coke 10,000t 0.5 0.5 25.8 89.7 100 28435 12753.10Coke oven gas 10E8 m3 0.04 0.04 12.1 37.3 100 16726 2495.52Other coal gas 10E8 m3 3.21 11.27 14.48 12.1 37.3 100 5227 282312.36Crude oil 10,000t 6.85 6.85 20 71.1 100 41816 203658.56Gasoline 10,000t 0.02 0.02 18.9 67.5 100 43070 581.45Diesel 10,000t 31.9 0.76 32.66 20.2 72.6 100 42652 1011328.40Fuel oil 10,000t 627.22 0.3 627.52 21.1 75.5 100 41816 19811484.12LPG 10,000t 0 17.2 61.6 100 50179 0.00Refinery gas 10,000t 2.85 2.85 18.2 48.2 100 46055 63265.75Natural gas 10E8 m3 0 15.3 54.3 100 38931 0.00Other petroleum produc 10,000t 11.35 11.35 20 72.2 100 38369 314422.44Other coking products 10,000t 0 25.8 87.3 100 28435 0.00Other energy 10000t ce 93.21 22.35 115.56 0 0 100 0 0.00
Subtotal 188633683.6《China Energy Statistics Yearbook 2004》
MWh 2003年
Province Electricity Gene On-site use Power output
(KWh) (MWh) (%) (MWh) Average CO2 EF of the Central China Power Grid (2003)Guangdong 1433.51 143351000 5.5 135466695 Total power output
Guangxi 170.79 17079000 8.43 15639240.3 Average CO2 EF
Guizhou 432.95 43295000 7.4 40091170Yunnan 190.55 19055000 8.01 17528694.5 Net Power Imports from the Central China Power Grid (2003)
Total 208725799.8 Total Power Output [MWh]
《China Electric Power Yearbook 2004》 Total emission, tCO2 188642056.6EF (tCO2/TJ) 0.903731
Basic data for the South China Power Grid for 2003
Electricity Generation from the Thermal Power Plants of South China Power Grd (2003)
111000.754318941
208736900

PROJECT DESIGN DOCUMENT FORM (CDM PDD) - Version 03 CDM – Executive Board page 43 CO2 emissions (tCO2e) for the South China Power Grid (2004):for the South China Power Grid for 2004
Fuel Type Unit 广东省 广西 贵州省 云南省 Subtotal EF EF dation fac NCV CO2 EmissionGuangdong Guangxi Guizhou Yunnan (tc/TJ) (tCO2/TJ) (%) (MJ/t,km3) *I*J*44/12/10000(mas
A B C D =A+B+C+D+E IPCC default H I J
K=G*H*I*J*44/12/1000 (volume unit)
Raw coal 10,000t 6017.7 1305 2643.9 1751.28 11717.88 25.8 89.5 100 20908 219272704.36Clean coal 10,000t 0.21 0.21 25.8 89.5 100 26344 4951.35Other washed coal 10,000t 0 25.8 89.5 100 8363 0.00Coke 10,000t 0 25.8 89.7 100 28435 0.00Coke oven gas 10E8 m3 0 12.1 37.3 100 16726 0.00Other coal gas 10E8 m3 2.58 2.58 12.1 37.3 100 5227 50301.51Crude oil 10,000t 16.89 16.89 20 71.1 100 41816 502159.56Gasoline 10,000t 0 18.9 67.5 100 43070 0.00Diesel 10,000t 48.88 1.83 50.71 20.2 72.6 100 42652 1570253.00Fuel oil 10,000t 957.71 957.71 21.1 75.5 100 41816 30235939.03LPG 10,000t 0 17.2 61.6 100 50179 0.00Refinery gas 10,000t 2.86 2.86 18.2 48.2 100 46055 63487.74Natural gas 10E8 m3 0.48 0.48 15.3 54.3 100 38931 101469.76Other petroleum produc 10,000t 1.66 1.66 20 72.2 100 38369 45986.01Other coking products 10,000t 0 25.8 87.3 100 28435 0.00Other energy 10000t ce 79.42 79.42 0 0 100 0 0.00
Subtotal 251847252.3《China Energy Statistics Yearbook 2005》MWh 2004年
Average CO2 EF of the Central China Power Grid (2004)Province 发电量 icity Gene On-site use Power output Total power output
(亿kWh) (MWh) (%) (MWh) Average CO2 EF 0.781842986Guangdong 1693.89 169389000 5.42 160,208,116Guangxi 201.43 20143000 8.33 18,465,088 Net Power Imports from the Central China Power Grid (2004)Guizhou 497.2 49720000 7.06 46,209,768 Total Power Output [MWh]
Yunnan 243.22 24322000 7.56 22,483,257 Total emission, tCO2
Total 247,366,229 EF (tCO2/TJ) 1.008098304
《China Electric Power Yearbook 2005》
Electricity Generation from the Thermal Power Plants of South China Power Grd (2004)
258,317,469260409402.5
10951240

PROJECT DESIGN DOCUMENT FORM (CDM PDD) - Version 03 CDM – Executive Board page 44 CO2 emissions (tCO2e) for the South China Power Grid (2005):for the South China Power Grid for 2005
Fuel Type Unit 广东省 广西 贵州省 云南省 Subtotal EF EF dation fac NCV CO2 Emission tCO2eGuangdong Guangxi Guizhou Yunnan (tC/TJ) (tCO2/TJ) (%) (MJ/t,km3) H*I*J*44/12/100(mass
A B C D =A+B+C+D+E IPCC default H I J
K=G*H*I*J*44/12/1000 (volume unit)
Raw coal 10,000t 6696.47 1435 3212.31 1975.55 13319.33 25.8 89.5 100 20908 249240093.72Clean coal 10,000t 0.15 0.15 25.8 89.5 100 26344 3536.68Other washed coal 10,000t 10.39 33.88 44.27 25.8 89.5 100 8363 331355.86Coke 10,000t 4.79 8.05 12.84 25.8 89.7 100 28435 327499.54Coke oven gas 10E8 m3 0.79 0.79 12.1 37.3 100 16726 49286.50Other coal gas 10E8 m3 1.87 15.96 17.83 12.1 37.3 100 5227 347626.34Crude oil 10,000t 10.91 10.91 20 71.1 100 41816 324367.13Gasoline 10,000t 0.68 0.68 18.9 67.5 100 43070 19769.13Diesel 10,000t 31.96 2.02 1.81 35.79 20.2 72.6 100 42652 1108249.95Fuel oil 10,000t 887.21 887.21 21.1 75.5 100 41816 28010177.89LPG 10,000t 0 17.2 61.6 100 50179 0.00Refinery gas 10,000t 4.92 4.92 18.2 48.2 100 46055 109216.67Natural gas 10E8 m3 0.93 0.93 15.3 54.3 100 38931 196597.66Other petroleum produc 10,000t 1.7 1.7 20 72.2 100 38369 47094.11Other coking products 10,000t 0 25.8 87.3 100 28435 0.00Other energy 10000t ce 104.66 133.15 59.72 297.53 0 0 100 0 0.00
Subtotal 280,114,871《China Energy Statistics Yearbook 2006》MWh 2005年
Average CO2 EF of the Central China Power Grid (2005)Total power output 96363000
Province 发电量 icity Gene On-site use Power output Average CO2 EF 0.729540711
(亿kWh) (MWh) (%) (MWh)Guangdong 1764.53 176453000 5.58 166,606,923Guangxi 250.23 25023000 7.95 23,033,672 Net Power Imports from the Central China Power Grid (2005)Guizhou 584.3 58430000 7.34 54,141,238 Total Power Output [MWh] 365,532,531
Yunnan 272.81 27281000 6.94 25,387,699 Total emission, tCO2 350415602.7
Total 269,169,531 EF (tCO2/TJ) 0.958644097
《China Electric Power Yearbook 2006》
Electricity Generation from the Thermal Power Plants of South China Power Grd (2005)
OM = Total emissions 2002, 2003 2004/Total power output 2002, 2003, 2004 0.9602

PROJECT DESIGN DOCUMENT FORM (CDM PDD) - Version 03 CDM – Executive Board page 45
Annex 4
MONITORING INFORMATION No further information is provided in this annex.
- - - - -