clean development mechanism project design document … pdd_guangan_cmm_ver2… · cdm –...
TRANSCRIPT

PROJECT DESIGN DOCUMENT FORM (CDM PDD) - Version 03 CDM – Executive Board page 1
CLEAN DEVELOPMENT MECHANISM PROJECT DESIGN DOCUMENT FORM (CDM-PDD)
Version 03 - in effect as of: 28 July 2006
CONTENTS A. General description of project activity B. Application of a baseline and monitoring methodology C. Duration of the project activity / crediting period D. Environmental impacts E. Stakeholders’ comments
Annexes Annex 1: Contact information on participants in the project activity Annex 2: Information regarding public funding Annex 3: Baseline information Annex 4: Monitoring plan

PROJECT DESIGN DOCUMENT FORM (CDM PDD) - Version 03 CDM – Executive Board page 2 SECTION A. General description of project activity A.1. Title of the project activity: >> Sichuan Guang’an Caishandong Coal Mine CMM Power Generation Project - Version: 02 - Date: 30/03/2009
Version Date Reason Version: 01 17/02/2009 The first edition Version: 02 30/03/2009 Methodology updated to ACM0008 Version 06
A.2. Description of the project activity: >> To replace power from the Central China Power Grid (CCPG), and at the same time, reduce greenhouse gas emissions by destroying methane, CMM power plant comprising CMM generation units of a total 15 MW capacity will be constructed at Caishandong Coal Mine (Caishandong) of Guang’an Yimin Coal & Power Co., Ltd., Guang’an City, Sichuan Province. The designed production capacity of Caishandong is 210,000 t/y. It is characterized that Caishandong have a huge amount of gas emissions despite of relatively small coal production capacity and the methane concentration of CMM is very high, typically 60 to 80 %. The pure methane gas emission volume per produced raw coal is approximately 200 m3/ton. The employing only ventilation is not enough to dilute the methane concentration of the airflow in the working area to levels below 1% as stipulated in the National Coal Mine Safety Regulation. Therefore, methane is also extracted from the underground by gas drainage system. Most of high methane concentration CMM have been came from a borehole in a sealed roadway through disturbed zone of coal seam. It accounts approximately 40 % of total emissions from Caishandong including VAM. If the drainage from this borehole would stop, methane concentration in the mine air will increase more than 1 %, due to methane emission from other roadways. All methane gas through VAM and CMM extracted from the underground had been emitted in the atmosphere before the project has occurred. VAM and CMM made up approximately 35 % and 65 % of gas emissions respectively (See Figure-1). The base line scenario is as same as the existing scenario in which all gas from the underground would be released in to the atmosphere. The project has installed thirty 0.5 MW CMM power generation units at Caishandong since July 2008 and will start to commercial operation in March 2009. Four waste heat recovery units will be also attached with four CMM generators. When the project would be fully operated, as presented in Figure-1, almost of all CMM makes up approximately 65 % of total gas emissions will be used for power generation and only the remainder including VAM will be released into the atmosphere. Thus 53.3 m3/min of CMM, equal to 28,000,000 m3/y of pure methane, will be destroyed in CMM power plant. The CMM power plant will generate 78,400 MWh/y of electricity and supply 76,048 MWh/y to CCPG. This project will reduce greenhouse gas emission by destroying methane, 21 times more potent a greenhouse gas than CO2, by CMM power generation units and replacement of electric power from the CCPG. 207,345 tCO2e of emission reductions are projected for fiscal year 2009, and 414,691 tCO2e, for
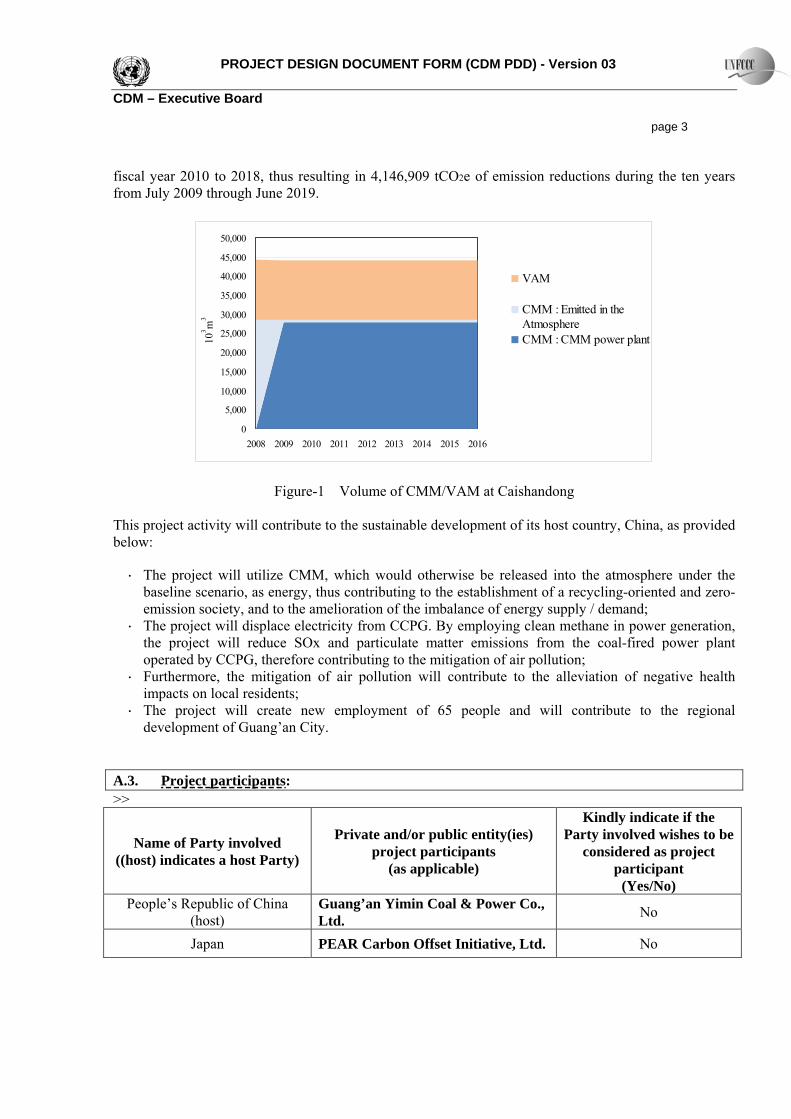
PROJECT DESIGN DOCUMENT FORM (CDM PDD) - Version 03 CDM – Executive Board page 3 fiscal year 2010 to 2018, thus resulting in 4,146,909 tCO2e of emission reductions during the ten years from July 2009 through June 2019.
0
5,000
10,000
15,000
20,000
25,000
30,000
35,000
40,000
45,000
50,000
2008 2009 2010 2011 2012 2013 2014 2015 2016
103 m
3
VAM
CMM : Emitted in theAtmosphereCMM : CMM power plant
Figure-1 Volume of CMM/VAM at Caishandong This project activity will contribute to the sustainable development of its host country, China, as provided below:
・ The project will utilize CMM, which would otherwise be released into the atmosphere under the baseline scenario, as energy, thus contributing to the establishment of a recycling-oriented and zero-emission society, and to the amelioration of the imbalance of energy supply / demand;
・ The project will displace electricity from CCPG. By employing clean methane in power generation, the project will reduce SOx and particulate matter emissions from the coal-fired power plant operated by CCPG, therefore contributing to the mitigation of air pollution;
・ Furthermore, the mitigation of air pollution will contribute to the alleviation of negative health impacts on local residents;
・ The project will create new employment of 65 people and will contribute to the regional development of Guang’an City.
A.3. Project participants: >>
Name of Party involved ((host) indicates a host Party)
Private and/or public entity(ies) project participants
(as applicable)
Kindly indicate if the Party involved wishes to be
considered as project participant
(Yes/No) People’s Republic of China
(host) Guang’an Yimin Coal & Power Co., Ltd. No
Japan PEAR Carbon Offset Initiative, Ltd. No

PROJECT DESIGN DOCUMENT FORM (CDM PDD) - Version 03 CDM – Executive Board page 4 A.4. Technical description of the project activity: A.4.1. Location of the project activity: >> A.4.1.1. Host Party(ies): >> People’s Republic of China A.4.1.2. Region/State/Province etc.: >> Sichuan Province A.4.1.3. City/Town/Community etc.: >> Guang’an City

PROJECT DESIGN DOCUMENT FORM (CDM PDD) - Version 03 CDM – Executive Board page 5 A.4.1.4. Details of physical location, including information allowing the unique identification of this project activity (maximum one page): >> Guang'an is a prefecture-level city in eastern part of Sichuan Province, and shares a border with Chongqing in South, Suining City and Nanchong in the West, Nanchong in the North, and Dazhou in the East. Guang'an is located on a gradually rising section along the edge of the Sichuan Basin. The area is 6344 km². The eastern part of Guang'an is mountainous, the central part hilly, and the western part is relatively flat. The elevation ranges from only 185 to 1,704 meters above sea-level. The main rivers are the Qu through the center of the area and the Jialing through the west. Caishandong mine is located in the mountainside, Dadian Village, Guixing Town, Guang’an District of Guangan City. The elevation of the mining area is from +960 m in the east side to +430 in the west side. It is 15 km away from Guixing Town and 46 km from the city center of Guang’an City. The power plant is located at the land property of Caishandong at latitude 30°28′09″north and longitude 106°54′31″east.
Figure-2 Location of the Project Site
A.4.2. Category(ies) of project activity: >> Project Type: Coal Mine Methane + Power Generation Connected to Grid

PROJECT DESIGN DOCUMENT FORM (CDM PDD) - Version 03 CDM – Executive Board page 6 Related sectoral scopes for accreditation of OEs: Scope 8: Mining / Mineral Production Scope 10: Fugitive Emission from Fuels (solid, oil and gas) A.4.3. Technology to be employed by the project activity: >> Table-3 and Figure-3 shows the scenario existing prior to the start of the implementation of the project activity (BAU, as same as the base line scenario) and the project activity, including energy and mass flows and balances of the systems and equipments. The monitoring equipments and their location in the systems are also presented in Figure-3. In the scenario existing prior to the start of the implementation of the project activity (BAU), methane had been diluted by mine ventilation air (VAM) and extracted from the underground gas drainage system (CMM) for mine safety. All of methane recovered had been emitted in the atmosphere unused. Following equipments had been installed and used for recovering methane: · Ventilation fans for ventilating mine air; · Blowers for CMM gas extraction through the underground gas drainage system;
The project activity will generate power by employing CMM power generation units of a total capacity of 15 MW. The power plant will be supplied by almost all of the CMM drained in the underground boreholes for the safety operation of the Caishandong mine. The power produced, except for a part used as electricity within the power station, will be sold to CCPG, in replacement of power from the CCPG.
Table-1 Energy and mass balances in the project activity and the base line scenario
Project activity Baseline scenario(Business as Usual)
Total of four mines (Project)
CMM (CH4 100%) 103m3/yr 31,104 31,104
CMM power plant 103m3/yr 28,000 0
Emitted in the atmosphere 103m3/yr 3,104 31,104
Eletricity Generation MWh/yr 78,400 0
Power for plant operation MWh/yr 2,352 0
Electricity Transmission MWh/yr 76,048 0
Heat Energy TJ/yr 934.3 0
Eletricity Generation TJ/yr 282.2 0
Heat recovered (hot water) TJ/yr 33.6 0
Heat released TJ/yr 618.4 0
unitAfter second stage

PROJECT DESIGN DOCUMENT FORM (CDM PDD) - Version 03 CDM – Executive Board page 7
Figure-3 Energy and mass flows and balances of the system and equipments included in the project
activity and the base line scenario Schematic view of the CMM power plant is presented in Figure-4. Only four power generators are equipped with waste heat exchanger. Recovered heat energy will be utilized for only mine use such as worker’s bathing, cooking, and heating office and working area on the surface in winter.

PROJECT DESIGN DOCUMENT FORM (CDM PDD) - Version 03 CDM – Executive Board page 8
Figure-4 Schematic View of CMM Power Plant Technology to be employed by the project activity at Caishandong mine includes following equipments:
CMM Gas Engine A CMM gas engine (1512CW, Shandong Jinan Green Energy Power Equipment Co., Ltd.) produces rotation energy to a power generator. The engine is four-stroke, spark plug ignition,water cooling and pre-mixing before compression type with 12 cylinders. The rated power of the engine is 550 KW with 9,200 KJ/KWh of Heat consumption rate. Minimum methane concentration to be supplied is 30 %. Major technical parameters of the CMM gas engine are presented in Table-2.
Table-2 Technical Parameters of CMM Gas engine
Item Unit Parameter Model of Gas Engine 1512CW Gas engine type G12V190ZLDW-2 Cylinder number 12 Cylinder diameter and stroke mm 190 x 210 Total air displacement delivery L 71.5 Rotation speed r.p.m. 1,000

PROJECT DESIGN DOCUMENT FORM (CDM PDD) - Version 03 CDM – Executive Board page 9
Rated output power KW 550 Minimum methane concentration % 30 Heat consumption rate KJ/KWh ≤ 9,200 Exhaust gas temperature °C ≤ 650 Discharged water temperature °C ≤ 85 Overhaul cycle hours Over 30,000 Renewal period years 10 Total weight kg 5,300 Length × width × height mm 2,670 x 1,588 x 2,366
Power Generator A power generator (500GF-WK, Shandong Jinan Green Energy Power Equipment Co., Ltd.) output 500KW rated power with 400V and 902A. Major technical parameters of the power generator are presented in Table-3.
Table-3 Technical Parameters of Power Generator
Item Unit Parameter Model of Generator 500GF-WK Generator Type 1FC6 455-6LA42 Rated power KW 500 Heat consumption rate KJ/KWh ≤ 11,000 Rated voltage V 400 Rated current A 902 Rated frequency Hz 50
Phase number and connection mode Three-phase four-wire power cable and star connection
Overhaul cycle hours Over 30,000 Renewal period yeas 10 Total weight (kg) kg 12,000 Length × width × height (mm) mm 5,120 x 2,040 x 2,776
Desulphurization equipment As CMM from the underground of Caishandong contains relatively high content of sulphur, it is indispensable that CMM would be desulphurized before supplying to CMM power generators. In this project, dry type desulphurization equipment with normal temperature filters will be installed, from which
PROJECT DESIGN DOCUMENT FORM (CDM PDD) - Version 03 CDM – Executive Board page 10 the out flow gas would contained less than 20 mg/Nm3. The processing capacity of the desulphurization equipment is 6,000 Nm3/hr, which is enough to treat all of the CMM used in the power plant.
CMM supply and safety equipments Out put gas pressure of gas drainage station is enough to supply CMM to gas engines directly. The CMM is supplied from gas drainage station through a main pipeline and divided into eight sub pipeline in the power plant which connects each gas engine. Water seal type flame arresters, dry-type flame arresters, dehydrators, screen filters and motor-driven buttery valve are installed for safety transportation of CMM.
Technology transfer Technology is transferred through the following activities: · Because the maintenance of the CMM power generation unit requires a high level of technology,
Guang’an Yimin Coal & Power Co., Ltd. will commission such operations to the Shandong Jinan Green Energy Power Equipment Co., Ltd., whose staff will be stationed at Caishandong to directly conduct sophisticated maintenance operations requiring advanced technologies and to guide plant staff in conducting regular maintenance operations.
· Upon operation of the CMM power generation units, staff from the Shandong Jinan Green Energy Power Equipment Co., Ltd. will train the power plant staff during the test operation period on the maintenance of equipment. Furthermore, once operations have commenced, the stationed staff from the Shandong Jinan Green Energy Power Equipment Co., Ltd. will conduct on-the-job training.
· Upon operation of the power plant, Guang’an Yimin Coal & Power Co., Ltd. staff will conduct safety training, including safety management and crisis management in case of disaster.
· Upon operation of the power plant, Guang’an Yimin Coal & Power Co., Ltd. staff will educate power plant staff on occupational health and safety, including the installation of a sound protector as a soundproof insulation measure.
· Upon operation of the power plant, Guang’an Yimin Coal & Power Co., Ltd. staff will educate power plant staff on ecosystems and environmental conservation.
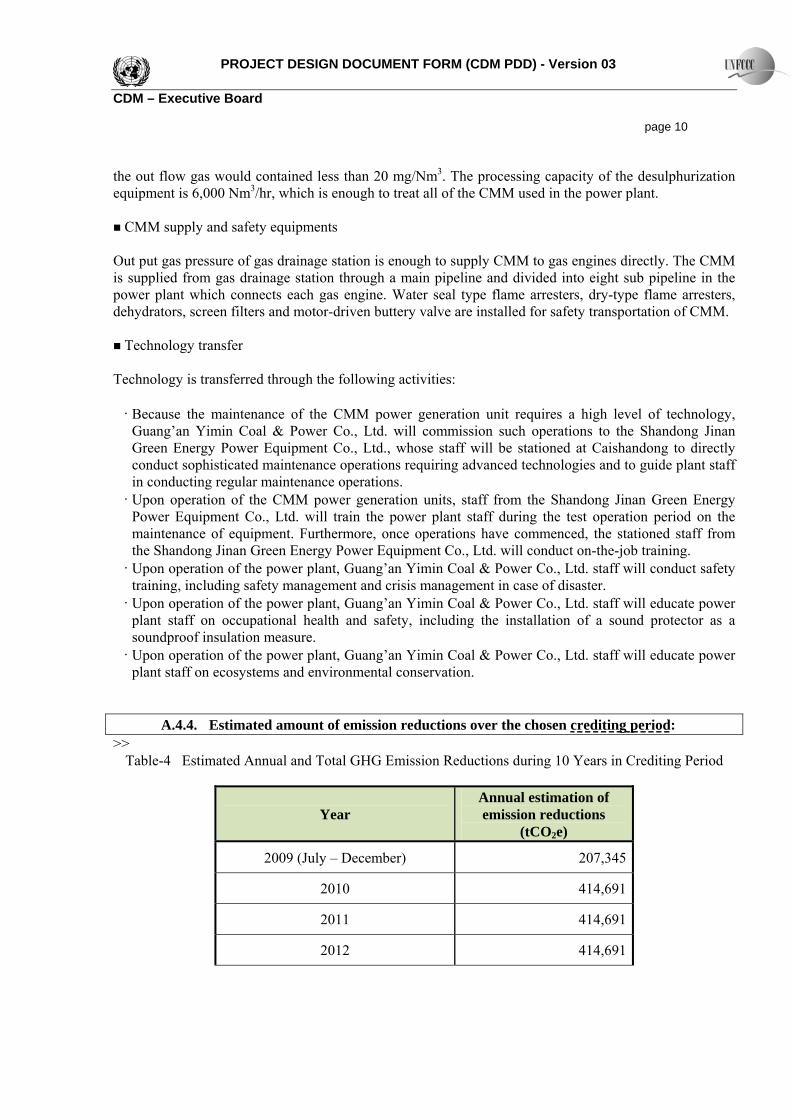
A.4.4. Estimated amount of emission reductions over the chosen crediting period: >>
Table-4 Estimated Annual and Total GHG Emission Reductions during 10 Years in Crediting Period
Year Annual estimation of emission reductions
(tCO2e)
2009 (July – December) 207,345
2010 414,691
2011 414,691
2012 414,691

PROJECT DESIGN DOCUMENT FORM (CDM PDD) - Version 03 CDM – Executive Board page 11
2013 414,691
2014 414,691
2015 414,691
2016 414,691
2017 414,691
2018 414,691
2019 January - June 207,345
Total emission reductions (tCO2e) 4,146,909
Total number of crediting years 10
Annual average over the crediting years of estimated reductions
(tCO2e) 414,691
A.4.5. Public funding of the project activity: >> No public funding from Parties included in Annex I is involved.

PROJECT DESIGN DOCUMENT FORM (CDM PDD) - Version 03 CDM – Executive Board page 12 SECTION B. Application of a baseline and monitoring methodology B.1. Title and reference of the approved baseline and monitoring methodology applied to the project activity: >>
(a) Version 06 of approved consolidated methodology ACM0008; “Consolidated methodology for coal bed methane, coal mine methane and ventilation air methane capture and use for power (electrical or motive) and heat and/or destruction through flaring or flameless oxidation”;
(b) Version 05.2 of the tool for the demonstration and assessment of additionality; Version 01.1of the tool to calculate the emission factor for an electricity system.
B.2. Justification of the choice of the methodology and why it is applicable to the project activity: >> ACM0008 defines the applicability of this methodology. The following Tables-5 and Table-6 explain the reason why the methodology applies to this project:
Table-5 Comparison of project extraction activities with applicability of ACM0008
ACM0008 Applicability Project Extraction Activities Underground boreholes in the mine to capture pre mining CMM
Included
Surface goaf wells, underground boreholes, gas drainage galleries or other goaf gas capture techniques, including gas from sealed areas, to capture post mining CMM
Underground boreholes, gas drainage galleries and some other goaf gas capture techniques are adopted to capture the pre and post mining CMM.
Ventilation air methane that would normally be vented
Included
Table-6 Comparison of the project utilization activities with applicability of ACM0008
ACM0008 Applicability Project Utilization Activities
The methane is captured and destroyed through flameless oxidation with or without utilization of the thermal energy
No VAM will be used in the project.
The methane is captured and destroyed through utilization to produce electricity, motive power and/or thermal energy; emission reductions may or may not be claimed for displacing or avoiding energy from other sources
Included. The CMM is captured through utilization to produce electricity; emission reduction may be claimed for displacing energy from other sources
The remaining share of the methane, to be diluted for safety reason, may still be vented
Part of CMM is still vented in the project.
All the CBM or CMM captured by the project should either be used or destroyed, and cannot be vented
All of the CMM captured by the project should either be used or destroyed, and cannot be vented.

PROJECT DESIGN DOCUMENT FORM (CDM PDD) - Version 03 CDM – Executive Board page 13 ACM0008 also define the types of activities that could not be applied to this methodology. The proposed project does not apply to any of those activities (Table-7):
Table-7 Comparison of the project activity with incompatibility of ACM0008
ACM0008 Inapplicability Project Activity Operation in open cast mines The project is implemented in an underground coal
mine Capture methane from abandoned/decommissioned coal mines
The project is implemented in a working underground coal mine
Capture/use of virgin coal-bed methane, e.g. methane of high quality extracted from coal seams independently of any mining activities
All of methane captured/used in the project is dependent with mining activity
Use CO2 or any other fluid/gas to enhance CBM drainage before mining takes place
No CBM extraction is involved in the project
Project participants can not supply the necessary data for ex-ante projection of methane demand as described in sections Baseline Emissions and Leakage to use ACM0008
All necessary data can be monitored
It can be concluded from the above analysis that the proposed project complies with both the baseline and the monitoring methodologies of ACM0008. B.3. Description of the sources and gases included in the project boundary: >> Based on ACM0008, the project boundary for this project activity is determined as follows: For the purpose of determining project activity emissions, project participants shall include:
◆ CO2 emissions from the combustion of methane in a flare, engine, power plant or heat generation plant;
・ CO2 is generated from methane combustion in the 15MW CMM power station.
◆ CO2 emissions from the oxidation of methane in a flameless oxidation unit; ・ This project will not employ flameless oxidation unit. ◆ CO2 emissions from the combustion of non methane hydrocarbons (NMHCs), if they represent more
than 1% by volume of the extracted coal mine gas; ・ NMHCs presents less than 0.2 % by volume of extracted CMM (See Table A2, Annex 3).
◆ CO2 emissions from on-site fuel consumption due to the project activity, including transport of the
fuel; · Gas engine generators to be used in this project activity are for CMM combustion only, and do not
use auxiliary fuels. ・ CMM extracted at the drainage station is directly transferred to CMM gas engine generators. As there
are no facilities additionally introduced, no additional CO2 emission occurs.

PROJECT DESIGN DOCUMENT FORM (CDM PDD) - Version 03 CDM – Executive Board page 14
◆ Fugitive emissions from unburned methane ・ The combustion rate for CH4 is determined as 99.5 % according to the methodology ACM0008.
For the purpose of determining baseline emissions, project participants shall include the following emission sources:
◆ CH4 emissions as a result of venting gas that would be captured in the project scenario; ・ In the baseline scenario, the CMM that would be captured in the project scenario is released into the
atmosphere from the drainage station ◆ CO2 emissions from the destruction of methane in the baseline scenario; ・ In the baseline scenario, all of the CMM is released into the atmosphere, and thus, no methane is
combusted or destructed.
◆ CO2 emissions from the production of power (motive and electrical) that is replaced by the project activity.
・ The power generation using CMM in the project activity replaces the electricity from CCPG. The spatial extent of the project boundary comprises: ◆ All equipment installed and used as part of the project activity for the extraction, compression, and
storage of CMM and CBM at the project site, and transport to an off-site user; ・ All equipment used as part of the project activity for the extraction of CMM at Extraction Station,
such as Blower, have been installed before the project would start, and no equipment for compression, storage and transportation to an off-site user would be installed.
・ CMM transport System installed between Extraction Station and CMM Power Station will be included in the project boundary.
◆ Flaring, flameless oxidation, captive power and heat generation facilities installed and used as part
of the project activity; ・ This project will not introduce flaring, flameless oxidation and captive power. Only four power
generators are equipped with waste heat exchanger. Recovered heat energy will be utilized for only mine use such as worker’s bathing, cooking, and heating office and working area on the surface in winter.
◆ Power plants connected to the electricity grid, where the project activity exports power to the grid, as
per the definition of project electricity system and connected electricity system given in “Tool for calculation of the emission factor for an electricity system”.
· CCPG is the relevant electricity grid of the Project. Based on the conditions required in the methodology, the project boundary for this project activity is presented in Figures-5, and the overview on emissions sources including in or excluded from the project boundary is presented in Table-8.

PROJECT DESIGN DOCUMENT FORM (CDM PDD) - Version 03 CDM – Executive Board page 15
Figure-5 Project Boundary
Table-8 Overview on Emissions Sources included in or excluded from the Project Boundary
Source Gas Included? Justification / Explanation
Emissions of methane as a result of venting CH4 Included
All of captured methane in the base line scenario is vented. This is the main emission source.
CO2 Excluded None of methane is destroyed in the baseline.
CH4 Excluded None of methane is destroyed in the baseline.
Emissions from destruction of methane in the baseline
N2O Excluded None of methane is destroyed in the baseline.
CO2 Included Only emissions from CCPG equivalent to electricity generated by the project activity.
CH4 Excluded According to ACM008.
Grid electricity generation
(electricity provided to the grid)
N2O Excluded According to ACM0008.
CO2 Excluded
Baseline scenario does not involve captive power and/or heat that would be displaced by power and/or steam produced by CMM oxidizers.
Bas
elin
e E
mis
sion
s
Captive power and/or heat, and vehicle fuel use
CH4 Excluded According to ACM0008.

PROJECT DESIGN DOCUMENT FORM (CDM PDD) - Version 03 CDM – Executive Board page 16
N2O Excluded According to ACM0008.
Emissions of methane as a result of continued venting
CH4 Excluded Only the change in CMM emissions release will be taken into account, by monitoring the methane destroyed by the project activity.
CO2 Excluded There is no fuel consumption for the project activity.
CH4 Excluded According to ACM0008.
On-site fuel consumption due to the project activity, including transport of the gas. N2O Excluded According to ACM0008.
Emission from methane destruction CO2 Included Methane consumed by CMM power
generation units(30×0.5MW)
Emissions from NMHC destruction CO2 Included
If NMHC accounts for more than 1 % by volume of extracted CMM, emissions from the combustion of NMHC in power generation units would be included.
Fugitive Emissions of unburned methane CH4 Included Small amounts of methane will remain in the
exhaust of CMM gas engine.
Fugitive methane emissions from on-site equipments
CH4 Excluded According to ACM0008
Fugitive methane emissions from gas supply pipeline or in relation to use in vehicles
CH4 Excluded
According to ACM0008
Proj
ect
Em
issi
ons
Accidental methane release CH4 Excluded According to ACM0008
B.4. Description of how the baseline scenario is identified and description of the identified baseline scenario: >> The baseline scenario of the project will be identified according to ACM 0008 / version 06. Step 1. Identify technically feasible options for capturing and/or using CBM or CMM or VAM Step 1a. Options for CBM and CMM or VAM extraction As CBM extraction is not considered at all for the option of methane extraction at Caishandong due to geological and technical issue. Therefore, CBM shall not be considered. Following options could be included:

PROJECT DESIGN DOCUMENT FORM (CDM PDD) - Version 03 CDM – Executive Board page 17
A. Ventilation air methane; B. Pre-mining CMM extraction; C. Post-mining CMM extraction; D. Possible combination of A, B and C.
Option D is the proposed project activity not implemented as a CDM project. Caishandong carries out a combination of VAM, and pre-mining and post-mining CMM by underground boreholes. However, pre-mining and post-mining CMM are both brought to the drainage station on the surface through the same drainage lines, and it is therefore impossible to specify the share of CMM captured by each method. Current and prospective share of CMM and VAM, including volume of CMM utilization, is shown in Figure-1 (A2). Step 1b. Options for extracted CBM and CMM or VAM treatment The project does not recover CBM, thus CBM are not considered as a candidate for treatment. The possible options that are technically feasible to use CMM/VAM are as follows:
i. Venting; ii. Using/destroying ventilation air methane rather than venting it; iii. Flaring of CMM; iv. Use for additional grid power generation; v. Use for additional captive power generation; vi. Use for additional heat generation; vii. Feed into gas pipeline (to be used as fuel for vehicles or heat/power generation); viii. Possible combinations i to vii with the relative shares of gas treated under each option specified.
Option iv is the proposed project activity not implemented as a CDM project. Step 1c. Options for energy production The possible options for energy production are as follows:
1. Electricity from CCPG; 2. Power generation from captive coal fired power plants; 3. Power generation using captured methane; 4. Continuation of existing heat supply by coal-fired boilers; 5. Heat supply by gas boilers; 6. Waste heat recovery from CMM-fueled engine; 7. Fuel vehicles;
The combination of option 1, 3 and 6 is the proposed project activity not implemented as a CDM project. Step 2. Eliminate baseline options that do not comply with legal or regulatory requirements It is required for coal mines that methane concentrations in the mine air to be below 1% to avoid the risk of explosion (National Coalmine Safety Regulation (2005), Section Two item 100 –1501). The absolute

PROJECT DESIGN DOCUMENT FORM (CDM PDD) - Version 03 CDM – Executive Board page 18 gas emission rate at Caishandong is projected to be over 80 m3/min of methane, as indicated in Table A1 of Annex 3. At present, solely adopting ventilation in Caishandong could not satisfy the 1% requirement. Item 145 of the National Coalmine Safety Regulation requires methane to be extracted at gas drainage station built above ground when the flow rate is the equivalent of or exceeds 40m3/min. Therefore, in this project activity, gas must be extracted employing underground boreholes. It will be also difficult to specify the share of gas of pre-mining CMM and post-mining CMM, because they will be brought to the surface through the same extraction system. Based on the above considerations, options A, B and C in step 1a do not comply with regulatory requirements solely. Thus, option A, B and C in step 1a could be eliminated. For CMM utilization, Chinese regulation requires that CMM used should have a minimum methane concentration of 30 % (National Coalmine Safety Regulation (2005) item 148.1). This was also emphasized in the Coalmine Methane Treatment and Utilization Macro Plan published by National Development and Reform Committee (NDRC) in June 2005. Chinese government issued “Emission standard of Coalbed Methane/Coal Mine Gas (on trial), GB21522-2008” on April 2, 2008. This standard has come into effective since July 1, 2008. The standard will prohibit release the extracted CMM over 30 % methane concentration into the atmosphere by existing coal mines, on the first January 2010 or later. As NDRC already announced the Coalmine Methane Treatment and Utilization Macro Plan to encourage the CMM drainage and utilization in June 2005, the posture to promote practical use of CMM and greenhouse gas emissions reduction vigorously has appeared. Therefore, it could be regarded as an E- national policy according to EB 22 Annex 3. Although the standard is considered to make CMM utilization mandatory at coal mines, as it have been implemented since the adoption by the COP of the CDM M&P (decision 17/CP.7, 11 November 2001), thus it is considered that all of the options in step 1b are comply with regulatory requirements as a baseline scenario. According to the Chinese power regulation (Notice on Strictly Prohibiting the Installation of Fuel-fired Generators with Capacity of 135 MW or below issued by the General Office of the State Council, decree no. 2002-6), the construction of coal-fired power plant with a capacity of 135MW or below is prohibited in the national grid coverage area. Thus, option 2 in step 1c does not comply with regulatory requirements. Step 3. Formulate baseline scenario alternatives: Based on the consideration of the baseline options that are technically feasible and comply with regulatory requirements, the following baseline options are identified. Options in step 1a:
D. Possible combination of A, B and C. Options in step 1b;
i. Venting; ii. Using/destroying ventilation air methane rather than venting it; iii. Flaring of CMM; iv. Use for additional grid power generation;

PROJECT DESIGN DOCUMENT FORM (CDM PDD) - Version 03 CDM – Executive Board page 19
v. Use for additional captive power generation; vi. Use for additional heat generation; vii. Feed into gas pipeline (to be used as fuel for vehicles or heat/power generation); viii. Possible combinations i to vii with the relative shares of gas treated under each option specified.
Options in step 1c: 1. Electricity from CCPG; 3. Power generation using captured methane; 4. Continuation of existing heat supply by existing coal-fired boilers; 5. Heat supply by gas boilers; 6. Waste heat recovery from CMM-fueled engine; 7. Fuel vehicles.
Combining the above baseline options, the projected baseline scenario alternative is as follows: Scenario I (combination of D, i, and 1 and 4, Business as usual scenario): Gas extraction is a combination of CMM and VAM. All extracted VAM and CMM are vented into the atmosphere without utilization. All Caishandong’s electricity demand is met through CCPG. Heat for mine use is supplied by existing coal-fired boiler. Scenario II (combination of D, i and ii, and 1, 3, and 4, Using/destroying VAM): Gas extraction is a combination of CMM and VAM. Using/destroying VAM (methane concentration is normally below 1.0 %) rather than venting is performed by flameless oxidizers. Remaining VAM and CMM will be vented into the atmosphere. All Caishandong’s electricity demand is met through CCPG, and generated power in the VAM power station is sold to CCPG. Heat for mine use is supplied by existing coal-fired boiler. Scenario III (combination of D, i and iii, and 1 and 4, Flaring of CMM): Gas extraction is a combination of CMM and VAM. CMM extracted are destroyed by flaring. VAM is vented into the atmosphere. All Caishandong’s electricity demand is met through CCPG. Heat for mine use is supplied by existing coal-fired boiler. Scenario IV (combination of D, i and iv, and 1, 3 and 6, CMM power generation for the grid power): This is the proposed project activity not implemented as a CDM project. Gas extraction is a combination of CMM and VAM. Extracted CMM is utilized for additional grid power generation. VAM is vented into the atmosphere. All Caishandong’s electricity demand is met through CCPG, and generated power in the CMM power station is sold to CCPG. Heat is recovered from CMM waste heat energy and supplied for mine use. Scenario V (combination of D, i and v, and 1, 3 and 6, CMM power generation for the captive power): Gas extraction is a combination of CMM and VAM. Extracted CMM is utilized for additional captive power generation. VAM is vented into the atmosphere. Generated power in the CMM power station is used directly in Caishandong. Heat is recovered from CMM waste heat energy and supplied for mine use. Scenario VI (combination of D, i and vi, and 1 and 5, Heat production): Gas extraction is a combination of CMM and VAM. Extracted CMM is combusted in gas boilers to produce thermal energy or heat at

PROJECT DESIGN DOCUMENT FORM (CDM PDD) - Version 03 CDM – Executive Board page 20 Caishandong. VAM is vented into the atmosphere. All Caishandong’s electricity demand is met through CCPG. Scenario VII (combination of D, i and vii, and 1, 4 and 7, Feed into gas pipe line): Gas extraction is a combination of CMM and VAM. Extracted CMM is fed into gas pipe line for residential use or industrial feedstock, or utilized as fuel for vehicles.VAM is vented into the atmosphere. All Caishandong’s electricity demand is met through CCPG. Heat for mine use is supplied by existing coal-fired boiler. Step 4. Eliminate baseline scenario alternatives that face prohibitive barriers Scenario I (combination of D, i, and 1 and 4, business as usual scenario): This is the BAU scenario and faces no barriers. Scenario II (combination of D, i and ii, and 1, 3, and 4, Using/destroying VAM): Using/destroying VAM rather than venting is performed in a tentative way in UK, USA and Australia using VAM oxidizer such as Vocsidizer developed by MEGTEC System AD, Sweden, for the purpose of generating electricity and producing heat energy 1 . Though in China, Sheng Dong Group Shengli Oilfield Shengli Engine Machinery Co., Ltd. has developed similar VAM oxidizer, there have been never introduced in operating coal mine2. Though the installation of the VAM oxidizers developed by Chinese manufacture is proposed as a CDM project for power generation in Dafosi coal mine, Bin County of Shaanxi Province, it would be the first case in China. As a result, the risks to install the units are considered to be significant. Moreover, it would be also difficult to obtain support of a fund without CER revenues for such a challenging project. These considerations exclude this scenario from being as an alternative scenario. Scenario III (combination of D, i and iii, and 1 and 4, Flaring of CMM): Flaring of CMM does not product any energy, but requires great investment without any revenues3. Therefore, this scenario would face significant investment barriers and could be eliminated. Scenario IV (combination of D, i and iv, and 1, 3 and 6, CMM power generation for the grid power): This is the proposed project activity not implemented as a CDM project. This scenario is technically feasible because of many CMM power generation project has been carried out in China. However, as described in B.5, the scenario has investment barriers. That is, FIRR of the proposed project is as low as only 7.80 %, compared with 12 % of the FIRR benchmark of CMM power generation project. This scenario could be eliminated. Scenario V (combination of D, i and v, and 1, 3 and 6, CMM power generation for the captive power): This scenario has same investment barriers as Scenario IV mentioned above, because same CMM power generation units would be installed and operated at the CMM power plant. The total amount of electricity
1 World Bank Formal Report 326/07; A Strategy for CBM and CMM Development and Utilization in China, 19P, 2007. 2 Company's Brochure, Sheng Dong Group Shengli Oilfield Shengli Engine Machinery Co., Ltd. 3 World Bank Formal Report 326/07; A Strategy for CBM and CMM Development and Utilization in China, 67P, 2007.

PROJECT DESIGN DOCUMENT FORM (CDM PDD) - Version 03 CDM – Executive Board page 21 consumed by the mine annually is estimated about 7,000 MWh 4, which is only 10 % of the total electricity generated by the CMM power plant. Thus almost of electricity generated should be supplied to the Grid. Furthermore, if the gas drainage, gas supplying or gas generating system would have some troubles, the electricity to the mine would be stopped. This will result in serious problem for mine safety such as shut down of fans for ventilation. Therefore, this scenario could be eliminated. Scenario VI (combination of D, i and vi, and 1 and 5, Heat production): Currently, the coal-fired boilers are operating in Caishandong to supply heat or hot water to dining room and bath room for the miner. As there are only 420 workers in Caishandong, the small capacity of the boilers is enough. The fuel for the boilers is waste coal that could not be sold to the market. Therefore, there is no reason for the project owner to put additional investment to install gas-fuelled boilers. So this alternative scenario could be infeasible. Scenario VII (combination of D, i and vii, and 1, 4 and 7, Feed into gas pipe line): In order to supply the methane as city gas for residence or industrial use, it is necessary to construct a gas pipeline more than 50 km to Guang’an city with comparatively large population. However, the project sites are in the mountain area, the complicated geography makes it really difficult to construct the pipelines, and the large investment in the pipelines is a big financial burden for the owner of the project and the users. Therefore, this alternative scenario could be infeasible technically and financially. As a result of above consideration, Scenario I (business as usual scenario) is the only scenario that does not face prohibitive barriers. Therefore, it is considered to be the baseline scenario. B.5. Description of how the anthropogenic emissions of GHG by sources are reduced below those that would have occurred in the absence of the registered CDM project activity (assessment and demonstration of additionality): >> As required by methodology ACM0008, the latest version of the “Tool for the demonstration and assessment of additionality (Version 05.2)” is applied to verify that the project activity is distinct from the baseline scenario. The time schedule of the project activity is as provided in Table-9
Table-9 Time schedule of the project Activity Date Evidence
Feasibility study by Nanjing Design and Research Institute, Sinocoal International Engineering Design & Research Institute and Sichuan Province Meihua Coal Technology Development Co., Ltd.
January 2008
Project Application Report (PAR)
Investment decision February 182008 Board meeting minute
Purchase of CMM power generation units (The starting date of the project)
Mar 20 2008
Purchase Agreement with Shandong Jinan Green Energy
4 From the questionnaire to Guang’an Yimin Coal & Power Co., Ltd.

PROJECT DESIGN DOCUMENT FORM (CDM PDD) - Version 03 CDM – Executive Board page 22
Power Equipment Co., Ltd. Environment Impact Assessment report made by Sichuan Research Academy of Environmental Sciences
April 2008 Project EIA Report
EIA approval by Sichuan Province Environmental Protection Bureau
May 23 2008
Sichuan Province Environmental Protection Bureau document [2008] No.419
Contract of construction signed Jun 24 2008 Construction contract
Project approval by Sichuan Province Economy Commission
June 25 2008
Sichuan Province Economy Commission document [2008] No.567
Groundbreaking of the CMM power plant July 2008
Report on the start of the construction
Emission Reduction Purchase Agreement signed
Nov 26 2008
ERPA with PEAR Carbon Offset Initiative, Ltd.
Anticipated commercial generation started March 2009 Monitoring report
The starting date of the project (Purchase Agreement of CMM power generation units signed) was March 20, 2008, which was before the start of project validation. The following fact is mentioned as evidence that the CDM was considered prior to the start of the project activity. Namely, the project owner held a board meeting about PAR of the project on February 18, 2008. It was concluded by the board members that carrying out this project as a CDM project is very meaningful and decreases the economic risk. The Emissions Reduction Purchase Agreement was signed in November 2008. Step 1. Identification of alternatives to the project activity consistent with current laws and regulations: As per the paragraph “Additionality” of the approved methodology ACM0008, this step can be ignored. Step 2. Investment analysis: Sub-step 2a. Determine appropriate analysis method Because the proposed project has the financial profit by selling electricity to CCPG other than CER revenue, a simple cost analysis (Option I) is not applicable. An investment comparison (Option II) is also not suitable, because the baseline is not a new construction project activity. As a result, the benchmark analysis (Option III) is adopted. Sub-step 2b – Option III. Apply investment benchmark analysis The FIRR (Financial Internal Rate of Return) shall be employed as the appropriate financial indicator for the benchmark analysis. Guang’an Co. is the owner of the project, which control both affiliated Caishandong Coal Mine and CMM Power Plant. The major purpose of the project is to utilize the CMM recovered from their mine for the safety purpose and to reduce CH4 and CO2 emissions, not selling electricity. However, the hurdle rate based on the NDRC’s investment approval criteria for power
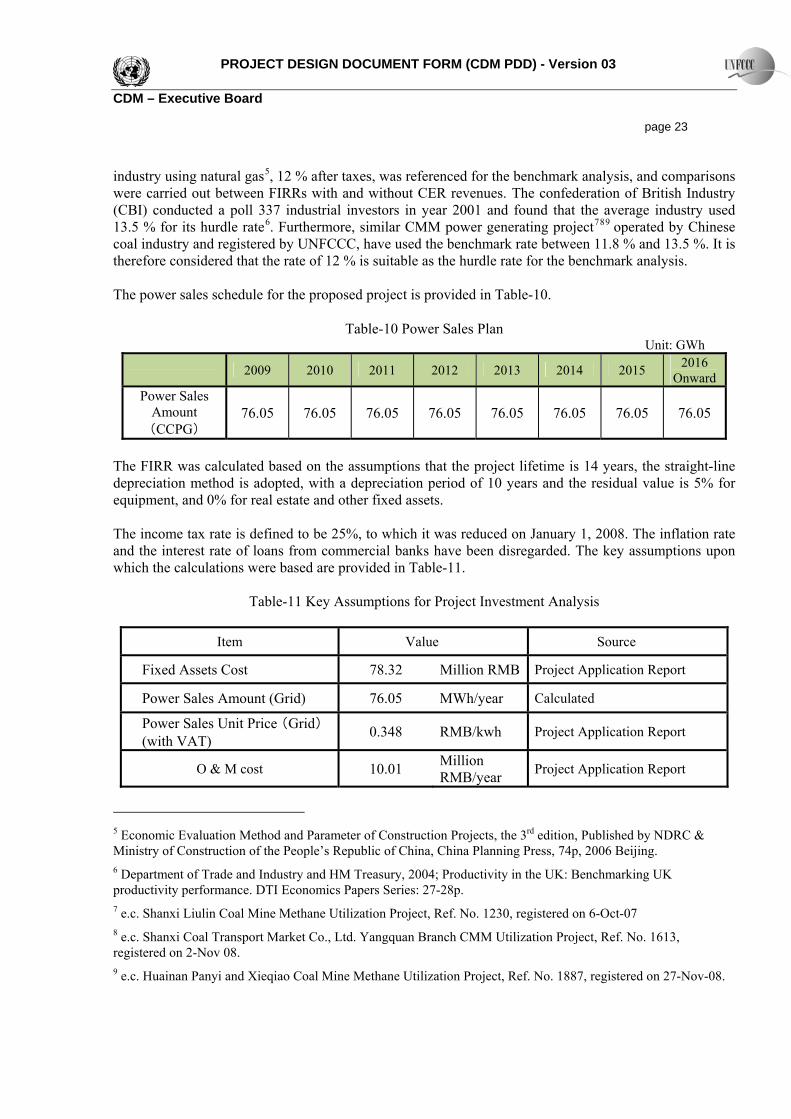
PROJECT DESIGN DOCUMENT FORM (CDM PDD) - Version 03 CDM – Executive Board page 23 industry using natural gas5, 12 % after taxes, was referenced for the benchmark analysis, and comparisons were carried out between FIRRs with and without CER revenues. The confederation of British Industry (CBI) conducted a poll 337 industrial investors in year 2001 and found that the average industry used 13.5 % for its hurdle rate6. Furthermore, similar CMM power generating project789 operated by Chinese coal industry and registered by UNFCCC, have used the benchmark rate between 11.8 % and 13.5 %. It is therefore considered that the rate of 12 % is suitable as the hurdle rate for the benchmark analysis. The power sales schedule for the proposed project is provided in Table-10.
Table-10 Power Sales Plan Unit: GWh
2009 2010 2011 2012 2013 2014 2015 2016 Onward
Power Sales Amount (CCPG)
76.05 76.05 76.05 76.05 76.05 76.05 76.05 76.05
The FIRR was calculated based on the assumptions that the project lifetime is 14 years, the straight-line depreciation method is adopted, with a depreciation period of 10 years and the residual value is 5% for equipment, and 0% for real estate and other fixed assets. The income tax rate is defined to be 25%, to which it was reduced on January 1, 2008. The inflation rate and the interest rate of loans from commercial banks have been disregarded. The key assumptions upon which the calculations were based are provided in Table-11.
Table-11 Key Assumptions for Project Investment Analysis
Item Value Source
Fixed Assets Cost 78.32 Million RMB Project Application Report
Power Sales Amount (Grid) 76.05 MWh/year Calculated
Power Sales Unit Price (Grid) (with VAT) 0.348 RMB/kwh Project Application Report
O & M cost 10.01 Million RMB/year Project Application Report
5 Economic Evaluation Method and Parameter of Construction Projects, the 3rd edition, Published by NDRC & Ministry of Construction of the People’s Republic of China, China Planning Press, 74p, 2006 Beijing. 6 Department of Trade and Industry and HM Treasury, 2004; Productivity in the UK: Benchmarking UK productivity performance. DTI Economics Papers Series: 27-28p. 7 e.c. Shanxi Liulin Coal Mine Methane Utilization Project, Ref. No. 1230, registered on 6-Oct-07 8 e.c. Shanxi Coal Transport Market Co., Ltd. Yangquan Branch CMM Utilization Project, Ref. No. 1613, registered on 2-Nov 08. 9 e.c. Huainan Panyi and Xieqiao Coal Mine Methane Utilization Project, Ref. No. 1887, registered on 27-Nov-08.

PROJECT DESIGN DOCUMENT FORM (CDM PDD) - Version 03 CDM – Executive Board page 24
Overhaul Cost (Carried out 6th and 11th year) 5.1 Million
RMB/year Manufacture’s Report
Remaining Value in Asset (Declared only in 11th year) 5 %
No.70 (2003) of the State Administration of Taxation June 18.2003
Project Lifetime 14 years Project Application Report and Mining Plan
Income Tax Rate 25 % Project Application Report
VAT 17 % Project Application Report
City Maintenance and construction tax rate 5 % Project Application Report
Education additive charge rate 3 % Project Application Report
FIRR (benchmark, after TAX) 12 % Economic Evaluation Method and Parameter of Construction Projects
Sub-step 2c – Calculation and comparison of financial indicators The result of the investment analysis is presented in Table-12. Detail data of FIRR analysis will be disclosed to the DOE during the validation process.
Table-12 Results of Investment Analysis
Project FIRR without CER revenues 7.80 %
Project FIRR with CER revenues 25.87 % The FIRR (after tax) without CER revenues is 7.80 %, falling short of the 12 % (after tax) requirement under NDRC’s investment approval criteria for power industry using natural gas. The result shows that the project is not profitable in the absence of the CDM, thus no investments will be made in this project. On the other hand, the FIRR (after tax) with CER revenues is raised to 25.87 %, satisfying the 12 % (after tax) requirement under NDRC’s investment approval criteria for power industry using natural gas. Sub-step 2d – Sensitivity analysis Sensitive analysis was carried out for the impact of the parameters, such as capital expenditure, operating & management cost (O&M Cost), power sales price and power sales amount, on the FIRR (without CER revenues). Fluctuation of the parameter’s value were ranged between -10% to +10%. The results are given in Table-13. The sensitivity analysis reveals that the capital expenditure and power sales revenue have the largest impact on the FIRR, but even with 10 % decrease in capital expenditure will only boost the FIRR to 10.87 %. It can therefore be concluded that the proposed project activity is not financially attractive in the absence of the CDM.

PROJECT DESIGN DOCUMENT FORM (CDM PDD) - Version 03 CDM – Executive Board page 25
Table-13 Sensitivity Analysis (FIRR (without CER revenues))
Parameters -10% -5% 0 5% 10%
Capital Expenditure 10.87% 9.26% 7.80% 6.46% 5.23%
O&M Cost 9.29% 8.55% 7.80% 7.03% 6.25%
Power Sales Price 4.49% 6.18% 7.80% 9.34% 10.83%
Power Sales Amount 4.49% 6.18% 7.80% 9.34% 10.83%
Sensitivity Analysis (FIRR (without CER revenues))
0.00%
2.00%
4.00%
6.00%
8.00%
10.00%
12.00%
-10% -5% 0 5% 10%
Capital Expenditure O&M Cost Power Sales Price & Amount
Figure-6 Sensitivity Analysis Step 3. Barrier analysis: Barrier analysis was not chosen for this additionality assessment. Step 4. Common practice analysis: Sub-step 4a. Analyze other activities similar to the proposed project activity:

PROJECT DESIGN DOCUMENT FORM (CDM PDD) - Version 03 CDM – Executive Board page 26 It is estimated that coal mines in China emitted up to 13 billion m3 of methane to the atmosphere annually in 2004 10. With the increasing underground mining depth and steady growth of coal output, CMM emission has been in the upward tendency in the country. Although in China, “drainage efficiency”, defined as the quantity of methane drained from active underground mines as a percentage of the total methane liberated through drainage and ventilation systems, has been increased from 15% in 1998 to 26% in 20047, amount of CMM utilized in 2004 was only 603 million m3. It means that only less than 5% of the total methane emitted by China is being used at coal mines. The Chinese government promotes the utilization of CMM, especially in June 2005, NDRC announced the Coalmine Methane Treatment and Utilization Macro Plan to encourage the CMM drainage and utilization. And the Chinese government issued “Emission standard of Coalbed Methane/Coal Mine Gas (on trial), GB21522-2008” on April 2, 2008. This standard will prohibit release the extracted CMM over 30 % methane concentrations into the atmosphere by existing coal mines, on the first January 2010 or later. Although there are favorable policies to promote CMM projects in China, development of the resource is slow. Lack of funds in Chinese enterprises hinders local investment, and bureaucratic processes, safety issues and market concerns deter foreign investors11. Furthermore, there are considerable barriers for the small scale coal mine like Guang’an mine to keep stable gas sources in volume and concentration, due to the complicated geological condition in the coal mine area. It would impose higher risks on the project return. Currently, several CMM power generation projects with installed capacity larger than 10MW are under development in china, while all of them are applying for CDM support, both technical and financial support. Actually, similar projects such as Yangquan and Jincheng CMM utilization project in Shanxi province and Huainan, Huaibei, Fuxin, Songzao, though in some large scale coal fields, is implementing CMM power generation only with CDM incentives. Sub-step 4b. Discuss any similar options that are occurring: Based on the above analysis, it can be concluded that no other project activities using the same technology, CMM engines for power generation, are occurring without CDM assistance. B.6. Emission reductions:
B.6.1. Explanation of methodological choices: >> 1) Project Emissions Project emissions are defined by the following equation: 10 China Coalbed Methane Clearinghouse, Coal Mine Methane Project Opportunities in China, Methane to Markets Partnership, May 16, 2006. http://www.methanetomarkets.org/events/2006/coal/docs/china.pdf 11 The World Bank Group, Formal Report 326/07, A Strategy for Coal Bed Methane (CBM) and Coal Mine Methane (CMM) Development and Utilization in China, June 2007. http://vle.worldbank.org/bnpp/en/publications/energy-water/a-strategy-coal-bed-methane-cbm-and-coal-mine-methane-cmm-development-and-

PROJECT DESIGN DOCUMENT FORM (CDM PDD) - Version 03 CDM – Executive Board page 27 PEy = PEME + PEMD + PEUM (B-1) where: PEy Project emissions in year y (tCO2e) PEME Project emissions from energy use to capture and use methane (tCO2e) PEMD Project emissions from methane destroyed (tCO2e) PEUM Project emissions from un-combusted methane (tCO2e) Combustion emissions from additional energy required for CBM/CMM capture and use All equipments to capture CMM are operated under BAU for the safety operation of the mine. There is no additional installation or fuel consumption to capture methane from the underground. CMM power generation units to be used in the project activity are for CMM use only, and use no additional fuels. Furthermore, as all electricity for water pumps and other equipments used in the CMM power plant will be supplied by the plant itself, there no combustion emissions for additional energy required. Hence, PEME = 0 Combustion emissions from use of captured methane In this Project, the CMM is used for power generation; the methane is combusted in the generating unit and destroyed.When the captured methane is burned in a power plant, combustion emissions are released. In addition, if NMHC accounts for more than 1% by volume of the extracted CMM, combustion emission from these gases should also be included. As shown in Table A2 of Annex 3, data collected and analyzed on February 24, 2008 revealed the NMHC concentration to be 0.12%. Thus PEMD as defined in this PDD does not include emissions from the combustion of NMHC. Under this project, the NMHC concentration of VAM will be monitored annually at the power plant. When the concentration would exceed 1 %, combustion emissions of NMHC shall be included in PEMD. PEMD = MDELEC x (CEFCH4 + r x CEFNMHC ) (B-2) with: r = PCNMHC / PCCH4 (B-3) where: PEMD Project emissions from CMM destroyed (tCO2e) MDELEC Methane destroyed through power generation (tCH4) CEFCH4 Carbon emission factor for combusted methane (2.75 tCO2e/tCH4) CEFNMHC Carbon emission factor for combusted non methane hydrocarbons (the concentration
varies and, therefore, to be obtained through periodical analysis of captured methane) (tCO2eq/tNMHC)
r Relative proportion of NMHC compared to methane PCCH4 Concentration (in mass) of methane in extracted gas (%), measured on wet basis PCNMHC NMHC concentration (in mass) in extracted gas (%)

PROJECT DESIGN DOCUMENT FORM (CDM PDD) - Version 03 CDM – Executive Board page 28 The unit for MDELEC and MMELEC is stipulated as tCH4. Under standard conditions, 1 mol of CH4 (=16 g) is 22.4L. Hence the mass of 1Nm3 of CH4 is 0.714286kg under 1 atm 0 degrees centigrade. Under the condition of 1 atm and 20 degrees centigrade (IPCC Guideline), the mass of 1 m3 of CH4 is 0.67kg. MDELEC = MMELEC x EffELEC (B-4) where: MMELEC Methane measured sent to CMM power plant (tCH4) EffELEC Efficiency of methane destruction/oxidation in power plant (Taken as 99.5 % from ACM0008) Un-combusted methane from end uses The equation of un-combusted methane from the CMM for power generation is as follows: PEUM = GWPCH4 x MMELEC x ( 1- EffELEC ) (B-5) where: PEUM Project emissions from un-combusted methane (tCO2e) GWPCH4 Global warming potential of methane (21tCO2e/tCH4) MMELEC Methane measured sent to CMM power plant (tCH4) EffELEC Efficiency of methane destruction/oxidation in power plant (Taken as 99.5 % from ACM0008) 2) Baseline Emissions Baseline emissions are given by the following equation: BEy = BEMD,y + BEMR,y + BEUse,y (B-6) where: BEy Baseline emissions in year y (tCO2e) BEMD,y Baseline emissions from destruction of methane in the baseline scenario in year y
(tCO2e) BEMR,y Baseline emissions from release of methane into the atmosphere in year y that is avoided
by the project activity (tCO2e) BEUse,y Baseline emissions from the production of power replaced by the project activity in year
y (tCO2e) Methane destruction in the baseline In this project activity, CMM is extracted from underground boreholes using the blower at the Drainage station for the purpose of mine safety. This activity is also conducted under BAU, meaning it is also done under the baseline scenario; thus, the volume of captured methane in the project activity is equal to that of the baseline scenario. However, the captured CMM is released into the atmosphere unused under the baseline scenario.
PROJECT DESIGN DOCUMENT FORM (CDM PDD) - Version 03 CDM – Executive Board page 29 Hence, BEMDy = 0 Calculation of the mean annual demand (Thy) for each year of the crediting period In this project activity, CMM is not employed as city gas or as fuel for heat supply centers. Therefore, analysis of thermal demand is unnecessary. Methane released into the atmosphere Baseline emissions from release of methane into the atmosphere are given by the following equation:
BEMRy = GWPCH4 x [(CMMPJ,i,y – CMMBL,i,y) + (PMMPJ,i,y – PMMBL,i,y)] (B-7) where: BEMR,y Baseline emissions from release of methane into the atmosphere in year y that is avoided
by the project activity (tCO2e) CMMPJ,i,y Pre-mining CMM captured, sent to and destroyed by use i in the project activity in year y
(expressed in tCH4) CMMBL,i,y Pre-mining CMM that would have been captured, sent to and destroyed by use i in the
baseline scenario in year y (expressed in tCH4) PMMPJ,i,y Post-mining CMM captured, sent to and destroyed by use i in the project activity in year y
(expressed in tCH4) PMMBL,i,y Post-mining CMM that would have been captured, sent to and destroyed by use i in the
baseline scenario in year y (expressed in tCH4) GWPCH4 Global warming potential of methane (21tCO2e/tCH4) In the base line scenario, the CMM is not used and destroyed. Therefore, CMMBLi,y and PMMBLi,y = 0. Hence, BEMRy = GWPCH4 x (CMMPJ,i,y + PMMPJ,i,y) (B-8) The volume of methane released into the atmosphere under the baseline scenario is as much as the volume of CMM used under the project activity to generate power. The total amount of CMMPJi,y and PMMPJi,y represents the amount used in the project activity to generate power. Emissions from power/heat generation replaced by project This project activity involves only CMM. Therefore, the values for EDCBMw,y and EDCBMz,y are 0. Emissions from the production of power replaced by the project activity are given by the following equation: BEUse,y = EDCPMM,y (B-9) where: BEUse,y Total baseline emissions from the production of power replaced by the project activity in
year y (tCO2)

PROJECT DESIGN DOCUMENT FORM (CDM PDD) - Version 03 CDM – Executive Board page 30 EDCPMM,y Emissions from displacement of end uses by use of CMM (tCO2e) The total methane captured during year y can be descried as follows; CMMtot,y = CMMPJ,i,y + PMMPJ,i,y (B-10) Where; CMMtot,y Total CMM captured and utilized by the project activity (tCH4) CMMPJ,i,y Pre-mining CMM captured by use i in the project activity in year y (tCH4) PMMPJ,i,y Post-mining CMM captured by use i in the project activity in year y (tCH4) Waste heat is recovered from the power generation process and utilized for domestic purposes; however, to be conservative, CERs will not be claimed for this component. So the total potential emissions reduction from displacement of power generation is given by following equation: PBEUse,y = GEN,y x EFELEC (B-11) where: PBEUse,y Potential total baseline emissions from the production of power replaced by the project
activity in year y (tCO2e) GEN, y Electricity generated by project activity in year y (MWh) EFELEC Emission factor of electricity (grid) replaced by the project (tCO2/MWh) The electricity produced in the project activity is supplied to the CCPG. Therefore, the emission factor for CCPG is adopted as the value for EFELEC. According to the above equations, emissions from the production of power replaced by the project activity are summarized as the following equation: BEUse,y = EDCPMM,y = (CMMPJi,y + PMMPJi,y) / CMMtot,y x PBEUse,y= PBEUse,y
= GEN,y x EFELEC (B-12) 3) Leakage The formula for leakage is given as follows LEy = LEd,y + LEo,y (B-13) where: LEy Leakage emissions in year y (tCO2e) LEd,y Leakage emissions due to displacement of other baseline thermal energy uses of methane
in year y (tCO2e) LEo,y Leakage emissions due to other uncertainties in year y (tCO2e) The leakage of CDM project activities could result from the following:
a) Displacement of baseline thermal energy uses;
b) CBM drainage from outside the de-stressed zone;

PROJECT DESIGN DOCUMENT FORM (CDM PDD) - Version 03 CDM – Executive Board page 31
c) Impact of CDM project activity on coal production; d) Impact of CDM project activity on coal prices and market dynamics.
Methane is not employed for other baseline thermal energy uses, thus LEd,y is 0. CBM is not used in the project activity and the CDM project activity has no influence upon coal production and prices and market dynamics; thus, LEo,y is 0. Therefore, leakage emissions can be excluded from the project. 4) Estimation of emission reductions:
The emission reduction ERy by the project activity during a given year y is the difference between the baseline emissions (BEy) and project emissions (PEy), as follows:
ERy = BEy − PEy − LEy (B-14) Where: ERy Emissions reductions of the project activity during the year y (tCO2e) BEy Baseline emissions during the year y (tCO2e) PEy Project emissions during the year y (tCO2e) Ley Leakage emissions in year y (tCO2e)
B.6.2. Data and parameters that are available at validation: Data / Parameter: Density of methane Data unit: Kg/m3 Description: Density of methane Source of data used: 2006 IPCC Guidelines for National Greenhouse Gas Inventories Value applied: 0.67 Justification of the choice of data or description of measurement methods and procedures actually applied :
2006 IPCC Guidelines for National Greenhouse Gas Inventories (Under the condition of 1atm and 20 degrees centigrade)
Any comment: -
Data / Parameter: CEFCH4 Data unit: tCO2e/tCH4 Description: Carbon emission factor for combusted methane Source of data used: ACM0008 default value Value applied: 2.75 Justification of the choice of data or description of
ACM0008 / Version 06

PROJECT DESIGN DOCUMENT FORM (CDM PDD) - Version 03 CDM – Executive Board page 32 measurement methods and procedures actually applied : Any comment: - Data / Parameter: GWPCH4
Data unit: tCO2e/tCH4 Description: Global warming potential of methane Source of data used: ACM0008 default value Value applied: 21 Justification of the choice of data or description of measurement methods and procedures actually applied :
ACM0008 / Version 06
Any comment: - Data / Parameter: EffELEC Data unit: - Description: Efficiency of methane destruction in power plant Source of data used: The methodology ACM0008 (IPCC) Value applied: 99.5 % Justification of the choice of data or description of measurement methods and procedures actually applied :
IPCC reference
Any comment: - Data / Parameter: CMMBL,I,y Data unit: tCH4 Description: CMM that would have been captured, used and destroyed by use i in the
baseline scenario in year y Source of data used: Data provided by The Guang’an Yimin Coal & Power Co., Ltd. Value applied: 0 Justification of the choice of data or description of measurement methods and procedures actually applied :
The captured CMM is released into the atmosphere unused under the baseline scenario. Hence, CMMBL,I,y is 0.
Any comment: - Data / Parameter: PMMBL,I,y

PROJECT DESIGN DOCUMENT FORM (CDM PDD) - Version 03 CDM – Executive Board page 33 Data unit: tCH4 Description: PMM that would have been captured, used and destroyed by use i in the
baseline scenario in year y Source of data used: Data provided by The Guang’an Yimin Coal & Power Co., Ltd. Value applied: 0 Justification of the choice of data or description of measurement methods and procedures actually applied :
The captured PMM is released into the atmosphere unused under the baseline scenario. Hence, PMMBL,I,y is 0.
Any comment: - Data / Parameter: BEMD,y Data unit: tCO2/yr Description: Baseline emissions from destruction of methane in the baseline scenario in year
y Source of data used: Data provided by The Guang’an Yimin Coal & Power Co., Ltd. Value applied: 0 Justification of the choice of data or description of measurement methods and procedures actually applied :
Captured CMM in baseline scenario is not used but released into atmosphere. Hence, a baseline emission from destruction of methane is 0.
Any comment: - Data / Parameter: EFOM,y Data unit: tCO2e/MWh Description: Operating margin emission factor of the Northwest China Power Grid Source of data used: “The Clarification of Determining Baseline Emission Factor for China Regional
Grid” by NCCC Value applied: 1.2783 Justification of the choice of data or description of measurement methods and procedures actually applied :
China Official Data of National Bureau of Statistics of China and National Development and Reform Commission renewed at Dec 30th 2008
Any comment:
Data / Parameter: EFBM,y Data unit: tCO2e/MWh Description: Build margin emission factor of the Northwest China Power Grid Source of data used: “The Clarification of Determining Baseline Emission Factor for China Regional
Grid” by NCCC Value applied: 0.6687

PROJECT DESIGN DOCUMENT FORM (CDM PDD) - Version 03 CDM – Executive Board page 34 Justification of the choice of data or description of measurement methods and procedures actually applied :
China Official Data of National Bureau of Statistics of China and National Development and Reform Commission renewed at Dec 30th 2008
Any comment: Data / Parameter: EFgrid,CM,y Data unit: tCO2/MWh Description: Combined margin CO2 emission factor for grid connected power generation in
year y Source of data used: The calculation was conducted based on data calculated by the Office of
National Coordination Committee on Climate Change. Value applied: 0.9735 Justification of the choice of data or description of measurement methods and procedures actually applied :
China Official Data of National Bureau of Statistics of China and National Development and Reform Commission renewed at Dec 30th 2008
Any comment: The calculation was conducted based on data calculated by the Office of National Coordination Committee on Climate Change.
Data / Parameter: EF ELEC Data unit: tCO2/MWh Description: CO2 baseline emission factor for the electricity displaced due to the project
activity during the year y. Source of data used: The calculation was conducted based on data calculated by the Office of
National Coordination Committee on Climate Change. Value applied: 0.9735 Justification of the choice of data or description of measurement methods and procedures actually applied :
China Official Data of National Bureau of Statistics of China and National Development and Reform Commission renewed at Dec 30th 2008
Any comment: The calculation was conducted based on data calculated by the Office of National Coordination Committee on Climate Change.
Data / Parameter: EGy Data unit: MWh Description: Net electricity generated and delivered to the grid by all power sources serving
the system, not including low-cost / must-run power plants / units, in year y Source of data used: China Electric Power Yearbook 2005,2006 and 2007 Value applied: Please refer to annex 3.

PROJECT DESIGN DOCUMENT FORM (CDM PDD) - Version 03 CDM – Executive Board page 35 Justification of the choice of data or description of measurement methods and procedures actually applied :
China Official Data of National Bureau of Statistics of China and National Development and Reform Commission
Any comment: - Data / Parameter: EFCO2i,y / COEF i, j, y Data unit: kgC/GJ / tCO2/mass Description: CO2 emission factor of fossil fuel type i in year y Source of data used: 2006 IPCC Guidelines for National Greenhouse Gas Inventories” Volume2
Energy, CHAPTER 1 P1.21 ,Table 1-3 and P1.23 ,Table 1-4 Value applied: Please refer to annex 3. Justification of the choice of data or description of measurement methods and procedures actually applied :
IPCC’s official data.
Any comment: - Data / Parameter: FCi,y / F i, j, y Data unit: mass or volume unit Description: Amount of fossil fuel type i consumed in the project electricity system in year y Source of data used: China Energy Statistical Yearbook 2005,2006 and 2007 Value applied: Please refer to annex 3. Justification of the choice of data or description of measurement methods and procedures actually applied :
China Official Data of National Bureau of Statistics of China and National Development and Reform Commission
Any comment: - Data / Parameter: NCV i,y Data unit: kJ/kg Description: Net calorific value (energy content) of fossil fuel type i in year y Source of data used: China Energy Statistical Yearbook,2007 p287 Value applied: Please refer to annex 3. Justification of the choice of data or description of measurement methods and procedures actually applied :
China Official Data of National Bureau of Statistics of China and National Development and Reform Commission

PROJECT DESIGN DOCUMENT FORM (CDM PDD) - Version 03 CDM – Executive Board page 36 Any comment: -
B.6.3. Ex-ante calculation of emission reductions: >>
The projected electricity generation and supply and CMM consumption caused by the introduction of CMM power generation units in the project are provided in Table-14.
Table-14 CMM Generation Units Introduction Plan
CMM power generation units
Units of Generator
Installed Capacity
Electricity Generation
Electricity Supply
Methane Consumption ( CH4 100% )
Units MW MWh MWh 103m3
2009 30 15 39,200 38,024 14,000
2010 30 15 78,400 76,048 28,000
2011 30 15 78,400 76,048 28,000
2012 30 15 78,400 76,048 28,000
2013 30 15 78,400 76,048 28,000
2014 30 15 78,400 76,048 28,000
2015 30 15 78,400 76,048 28,000
2016 30 15 78,400 76,048 28,000
2017 30 15 78,400 76,048 28,000
2018 30 15 78,400 76,048 28,000
2019 30 15 78,400 76,048 28,000
1) Project Emissions Project emissions are defined by the following equation PEy = PEME + PEMD + PEUM (B-1) where: PEy Project emissions in year y (tCO2e) PEME Project emissions from energy use to capture and use methane (tCO2e)

PROJECT DESIGN DOCUMENT FORM (CDM PDD) - Version 03 CDM – Executive Board page 37 PEMD Project emissions from methane destroyed (tCO2e) PEUM Project emissions from un-combusted methane (tCO2e) The all data and the result of calculation for project emissions (PEy) of each year are presented in Table-15.
Table-15 GHG Emissions Estimates in the Project Activity
PEy PEME PEMD
MDELEC MMELEC PEUM
Years tCO2e tCO2e tCO2e tCH4 tCH4 103m3 tCO2e
2009 Jul.-Dec. 26,651 0 25,666 9,333 9,380 14,000 985
2010 53,302 0 51,332 18,666 18,760 28,000 1,970
2011 53,302 0 51,332 18,666 18,760 28,000 1,970
2012 53,302 0 51,332 18,666 18,760 28,000 1,970
2013 53,302 0 51,332 18,666 18,760 28,000 1,970
2014 53,302 0 51,332 18,666 18,760 28,000 1,970
2015 53,302 0 51,332 18,666 18,760 28,000 1,970
2016 53,302 0 51,332 18,666 18,760 28,000 1,970
2017 53,302 0 51,332 18,666 18,760 28,000 1,970
2018 53,302 0 51,332 18,666 18,760 28,000 1,9702019
Jan.- Jun 26,651 0 25,666 9,333 9,380 14,000 985
Total 533,019 0 513,321 186,662 187,600 280,000 19,698
2) Baseline Emissions Baseline emissions are given by the following equation: BEy = BEMD,y + BEMR,y + BEUse,y (B-6) where: BEy Baseline emissions in year y (tCO2e) BEMD,y Baseline emissions from destruction of methane in the baseline scenario in year y (tCO2e) BEMR,y Baseline emissions from release of methane into the atmosphere in year y that is avoided
by the project activity (tCO2e) BEUse,y Baseline emissions from the production of power replaced by the project activity in year
y (tCO2e)

PROJECT DESIGN DOCUMENT FORM (CDM PDD) - Version 03 CDM – Executive Board page 38 BEMDy = 0 BEMRy = GWPCH4 x (CMMPJ,i,y + PMMPJ,i,y ) (B-8) BEUse,y = GEN,y x EFELEC (B-12) The total amount of CMMPJ,i,y and PMMPJ,i,y is the amount sent to CMM power station and used in the project activity to generate power. GEN,y is as much as the electric power supply to CCPG presented in Table-15. HEATy is as much as waste heat recovery from the power generation process and utilized for domestic purposes; however, to be conservative, CERs will not be claimed for this component. Therefore the all data and the result of calculation for baseline emissions (BEy ) of each year are presented in Table-16.
Table-16 Baseline GHG Emissions Estimate
Years BEy BEMD,y BEMR,y CMMPJ,y + PMMPJ,y
+ VAMPJ,y BEUse,y
GENy
tCO2 tCO2 tCO2 tCH4 103m3 tCO2 MWh 2009
Jul.-Dec. 233,996 0 196,980 9,380 14,000 37,016 38,024
2010 467,993 0 393,960 18,760 28,000 74,033 76,048
2011 467,993 0 393,960 18,760 28,000 74,033 76,048
2012 467,993 0 393,960 18,760 28,000 74,033 76,048
2013 467,993 0 393,960 18,760 28,000 74,033 76,048
2014 467,993 0 393,960 18,760 28,000 74,033 76,048
2015 467,993 0 393,960 18,760 28,000 74,033 76,048
2016 467,993 0 393,960 18,760 28,000 74,033 76,048
2017 467,993 0 393,960 18,760 28,000 74,033 76,048
2018 467,993 0 393,960 18,760 28,000 74,033 76,048 2019
Jan.- Jun 233,996 0 196,980 9,380 14,000 37,016 38,024
Total 4,679,927 0 3,939,600 187,600 280,000 740,327 760,480
The value of EFELEC used in the above calculation is the emission factor for the CCPG. The emission factor for CCPG, EFELEC, is determined by employing the “Tool to calculate emission factor for electricity systems (Version 01.1)”. The calculation was conducted based on data calculated by the Office of National Coordination Committee on Climate Change. This data can be obtained at http://cdm.ccchina.gov.cn/english/main.asp?ColumnId=47. The tool indicates in the chapter of base line methodology procedure as follows:
PROJECT DESIGN DOCUMENT FORM (CDM PDD) - Version 03 CDM – Executive Board page 39 BASELINE METHODOLOGY PRODEDURE of the Tool to calculate emission factor for electricity systems (Version 01.1) Project participants shall apply the following six steps:
STEP 1. Identify the relevant electric power system. STEP 2. Select an operating margin (OM) method. STEP 3. Calculate the operating margin emission factor according to the selected method. STEP 4. Identify the cohort of power units to be included in the build margin (BM). STEP 5. Calculate the build margin emission factor. STEP 6. Calculate the combined margin (CM) emission factor.
Step 1. Identify the relevant electric power system
In the baseline scenario of this Project, CCPG (Henan Province, Hubei Province, Hunan Province, Jiangxi Province, Sichuan Province, Chongqing) is the power supplier. Therefore, the value for CCPG shall be employed as EFELEC in this Project. Step 2. Select an operating margin (OM) method The calculation of the operating margin emission factor (EFgrid,OM,y) is based on one of the following methods: (a) Simple OM, or (b) Simple adjusted OM, or (c) Dispatch data analysis OM, or (d) Average OM. Any of the four methods can be used, however, the simple OM method (option a) can only be used if low-cost/must-run resources constitute less than 50% of total grid generation in: 1) average of the five most recent years, or 2) based on long-term averages for hydroelectricity production. Among the total electricity generations of the Central China Power Grid which the Project is connected into, the amount of low-cost/must run resources accounts for about 35.95% in 2002, 34.42% in 2003, 38.54% in 2004 and 38.18% in 2005, 40.64% in 200612, all less than 50%. Thus, the method (a) Simple OM can be used to calculate the baseline emission factor of operating margin ( yOMEF , ) for the Project. For the simple OM, the emissions factor is selected to be calculated using either of the data vintages between any of: Ex ante option or Ex post. For this PDD Ex ante option is selected, which is a 3-year generation-weighted average, based on the most recent data available at the time of submission of the CDM-PDD to the DOE for validation, without requirement to monitor and recalculate the emissions factor during the crediting period. Step 3. Calculate the operating margin emission factor according to the selected method
12 China Electric Power Yearbook, 2003-2007 editions

PROJECT DESIGN DOCUMENT FORM (CDM PDD) - Version 03 CDM – Executive Board page 40 In accordance with the “Tool to calculate the emission factor for an electricity system” , the simple OM emission factor is calculated as the generation-weighted average CO2 emissions per unit net electricity generation (tCO2/MWh) of all generating power plants serving the system, not including low-cost / must-run power plants / units. It may be calculated:
• Based on data on fuel consumption and net electricity generation of each power plant / unit (Option A), or • Based on data on net electricity generation, the average efficiency of each power unit and the fuel type(s) used in each power unit (Option B), or • Based on data on the total net electricity generation of all power plants serving the system and the fuel types and total fuel consumption of the project electricity system (option C)
According to the “Tool”, Option A should be preferred and must be used if fuel consumption data is available for each power plant / unit. However, due to the necessary data, including the fuel consumption and net electricity generation of each power plant, is not available in China, Option C is adopted and accordingly only nuclear and renewable power generation are considered as low-cost/must-run power sources and data of the quantity of electricity supplied to the grid by these sources should be available. As per Option C, the simple OM emission factor is calculated based on the net electricity supplied to the grid by all power plants serving the system, not including low-cost / must-run power plants / units, and based on the fuel type(s) and total fuel consumption of the project electricity system, as follows: Data on the total net electricity generation of all power plants serving the system and the fuel types and total fuel consumption of the project electricity system can be identified; thus, Option C is employed to calculate OM.
y
yiCOyii
yi
ysimpleOMgrid EG
EFNCVFCEF
,,2,,
,,,
××⋅=∑
(B-15)
Where:
EFgrid,OMsimple,y = Simple operating margin CO2 emission factor in year y (tCO2/MWh) FCi,y = Amount of fossil fuel type i consumed in the project electricity system in
year y (mass or volume unit) NCVi,y = Net calorific value (energy content) of fossil fuel type i in year y (GJ /
mass or volume unit) EFCO2,i,y = CO2 emission factor of fossil fuel type i in year y (tCO2/GJ) EGy = Net electricity generated and delivered to the grid by all power sources
serving the system, not including low-cost / must-run power plants / units, in year y (MWh)
i = All fossil fuel types combusted in power sources in the project electricity system in year y
y = The three most recent years for which data is available at the time of submission of the CDM-PDD to the DOE for validation (ex ante option)
For this approach (simple OM) to calculate the operating margin, the subscript m refers to the power

PROJECT DESIGN DOCUMENT FORM (CDM PDD) - Version 03 CDM – Executive Board page 41 plants / units delivering electricity to the grid, not including low-cost/must-run power plants / units, and including electricity imports to the grid. Electricity imports should be treated as one power plant m.
The simple OM is calculated with reference to the Notification on Determining Baseline Emission Factor of China’s Grid issued by Chinese DNA (http://cdm.ccchina.gov.cn), (see Annex 3 for details).
The calculation results are provided in Table-17. EFgrid,OMsimple,y is 1.2783 tCO2e/MWh.
Table-17 Simple operating margin CO2 emission factor in recent 3 years
2004 2005 2006 Average
(tCO2) 346,035,810 360,323,575 408,776,276 1,115,135,661
EGy (MWh) 249,074,186 286,203,305 337,056,176 872,333,667
EFgrid,OMsimple,y (tCO2/ MWh) 1.389288 1.258978 1.212784 1.2783
Source:”China Power Grid Baseline CO2 Emission Factor Annex 1 China Power Grid Baseline OM Calculation Process,” published by the Office of National Coordination Committee on Climate Change This data can be obtained at: http://cdm.ccchina.gov.cn/english/main.asp?ColumnId=47
Step 4. Identify the cohort of power units to be included in the build margin The sample group of power units m used to calculate the build margin consist of ether:
(a) The set of five power units that have been built most recently, or
(b) The set of power capacity additions in the electricity system that comprise 20% of the system generation (in MWh) and that have been built most recently.
Due to the information of the five power plants built most recently in each regional gird of China is not available. Therefore, the sample group of power units m used to calculate the build margin is chosen (b).
In terms of vintage of data, Option 1 is chosen:
Option1. For the first crediting period, calculate the build margin emission factor ex-ante based on the most recent information available on units already built for sample group m at the time of CDM-PDD submission to the DOE for validation. For the second crediting period, the build margin emission factor should be updated based on the most recent information available on units already built at the time of submission of the request for renewal of the crediting period to the DOE. For the third crediting period, the build margin emission factor calculated for the second crediting period should be used. This option does not require monitoring the emission factor during the crediting period.
Step 5. Calculate the build margin emission factor

PROJECT DESIGN DOCUMENT FORM (CDM PDD) - Version 03 CDM – Executive Board page 42
According to “Tool to calculate the emission factor for an electricity system/Version01.1”, the build margin emissions factor is calculated ex-ante as the generation-weighted average emission factor (tCO2/MWh) of all power units m during the most recent year y for which power generation data is available, as follows:
∑∑ ×
=
mym
mymELym
yBMgrid EG
EFEGEF
,
,,,
,, (B-16)
where:
EFgrid,BM,y = Build margin CO2 emission factor in year y (tCO2/MWh) EGm,y = Net quantity of electricity generated and delivered to the grid by power unit m
in year y (MWh) EFEL,m,y = CO2 emission factor of power unit m in year y (tCO2/MWh) m = Power units included in the build margin y = Most recent historical year for which power generation data is available
The sample group of power units m used to calculate the build margin is chosen (b) in step 4. According to the EB’s guidance on DNV deviation request, “Request for clarification on use of approved methodology AM0005 for several projects in China”, the EB accepted the following deviation13:
- Use of capacity additions during last 1-3 years for estimating the build margin emission factor for grid electricity;
- Use the efficiency level of the best technology commercially available in the provincial/regional or national grid of China, as a conservative proxy, for each fuel type in estimating the fuel consumption to estimate the build margin (BM).
In accordance with the “Tool to calculate the emission factor for an electricity system”, the CO2 emission factor of each power unit m (EFEL,m,y) should be determined as per the guidance of options B1, B2 or B3 to calculate the simple OM, using for y the most recent historical year for which power generation data is available, and using for m the power units included in the build margin.
Due to for a power unit m only data on electricity generation and the fuel types used is available in China, so the emission factor should be determined using Option B2 based on the CO2 emission factor of the fuel type used and the efficiency of the power unit.
Therefore, EFgrid,BM,y should be calculated by the above method, the calculation formula is:
ythermalynytotal
nythermalyBMgrid EF
CAPCAP
EF ,,,
,,, ×=
−
− (B-17)
Where: EFthermal,y : The emission factor of fuel-fired power with best technology commercially available
13Http://cdm.unfccc.int/Projects/Deviations.

PROJECT DESIGN DOCUMENT FORM (CDM PDD) - Version 03 CDM – Executive Board page 43
CAPthermal,y-n : The incremental installed capacity of thermal power (MW) in y year compared to that of y-n year
CAPtotal,y-n,y : The total incremental installed capacity of various power sources in the grid during the years from y to y-n year
where, n is fixed by the following process:
The types of fossil fired power include coal-fired, oil-fired and gas-fired power, so the emission factor for fossil fuel fired power with the efficiency level of the best technology commercially available is calculated as follows:
yAdvGasyGasyAdvOilyOilyAdvCoalyCoalyadvfossilBL EFEFEFEF ,,,,,,,,,,,, ×+×+×= λλλ (B-18)
Where:
λ is the different kinds of fuel emission share of total Emissions in ECPG. Coal, Oil and Gas is the feet for solid fuels, liquid fuels and gas fuels.
It is calculated as follows:
∑∑
×
×= ∈
jiyjiyji
jCOALiyjiyji
COEFF
COEFF
,,,,,
,,,,,
yCoal,λ (B-19)
∑∑
×
×= ∈
jiyjiyji
jOILiyjiyji
COEFF
COEFF
,,,,,
,,,,,
yoil,λ (B-20)
∑∑
×
×= ∈
jiyjiyji
jGASiyjiyji
COEFF
COEFF
,,,,,
,,,,,
ygas,λ (B-21)
Where: Fi,j,y is the amount of fuel i (in a mass or volume unit) consumed by plant m in year y;
COEFi,j,y is the CO2 emission coefficient (tCO2e / a mass or volume unit) of fuel i, taking into account the carbon content of the fuels used by plant j and the percent oxidation of the fuel in year y; Coal, Oil and Gas is the feet for solid fuels, liquid fuels and gas fuels.
EFCoal,Adv,y, EFOil,Adv,y and EFGas,Adv,y in formula (B-18) represent the related Emission Factor of the commercially available most advanced coal, oil and gas fired power technology, which shall be determined using Option B2, as follows:,

PROJECT DESIGN DOCUMENT FORM (CDM PDD) - Version 03 CDM – Executive Board page 44
6.3,,
,,, ×=
yadvcoal
ycoalyadvcoal
COEFEF
η (B-22)
6.3,,
,,, ×=
yadvoil
yoilyadvoil
COEFEF
η (B-23)
6.3,,
,,, ×=
yadvgas
ygasyadvgas
COEFEF
η (B-24)
Where:
ηi,adv,y net energy conversion efficiency of the best thermal power technology commercially. Coal, Oil and Gas is the feet for solid fuels, liquid fuels and gas fuels.
The build margin emissions factor (EFgrid,BM,y) is calculated with reference to the Notification on Determining Baseline Emission Factor of China’s Grid issued by Chinese DNA (http://cdm.ccchina.gov.cn), (see Annex 3 for details).
Following the equations above, EFgrid,BM,y is calculated as follows. Data used in these calculations are provided in Annex 3.
EFgrid,BM,y = 0.9064 × 73.77 %=0.6687 tCO2e/MWh
Step 6. Calculate the combined margin emission factor The combined margin emission factor is calculated as follows:
EFgrid,CM,y = EFgrid,OM,y × wOM + EFgrid,BM,y× wBM (B-25)
where:
EFgrid,BM,y = Build margin CO2 emission factor in year y (tCO2/MWh) EFgrid,OM,y = Operating margin CO2 emission factor in year y (tCO2/MWh) wOM = Weighting of operating margin emission factor (%) wBM = Weighting of build margin emission factor (%)
All other projects, wOM = 0.5 and wBM = 0.5 for the first crediting period. Therefore, EFgrid,CM,y is given by the following equation:
EFgrid,CM,y = 0.5 ×EFgrid,OM,y + 0.5 ×EFgrid,BM,y The result of calculation for EFgrid,CM,y is given in Table-18.
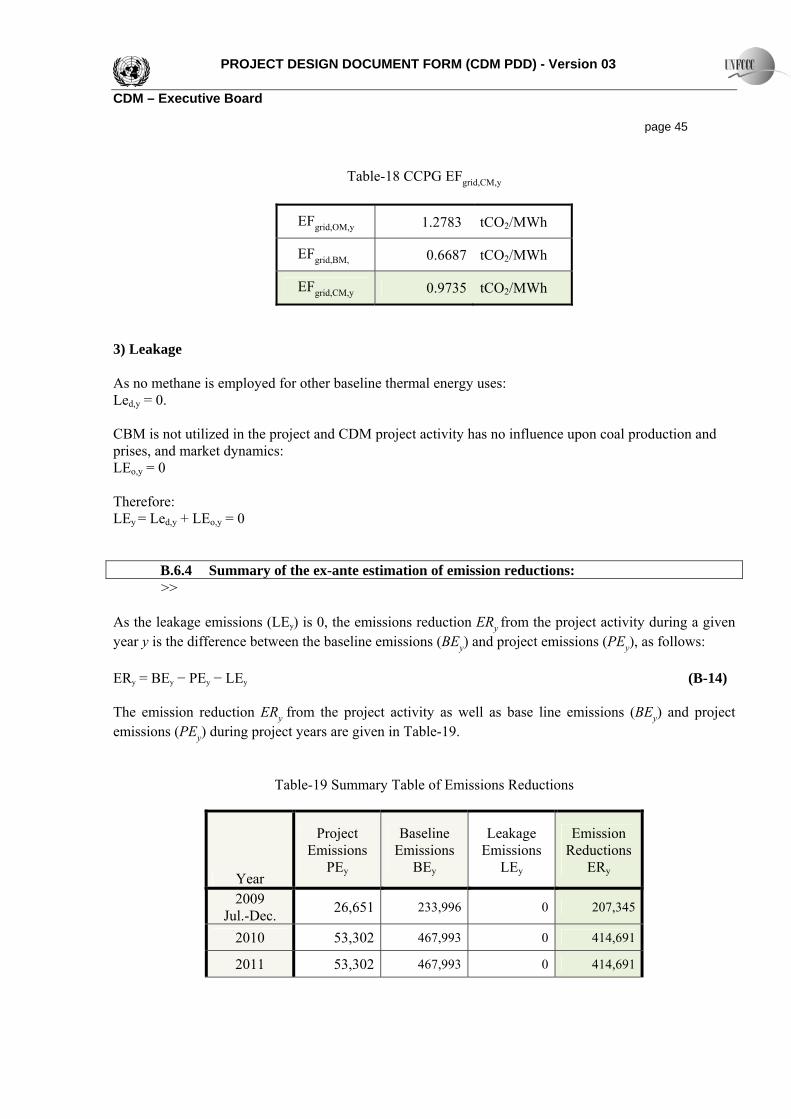
PROJECT DESIGN DOCUMENT FORM (CDM PDD) - Version 03 CDM – Executive Board page 45
Table-18 CCPG EFgrid,CM,y
EFgrid,OM,y 1.2783 tCO2/MWh
EFgrid,BM, 0.6687 tCO2/MWh
EFgrid,CM,y 0.9735 tCO2/MWh
3) Leakage As no methane is employed for other baseline thermal energy uses: Led,y = 0. CBM is not utilized in the project and CDM project activity has no influence upon coal production and prises, and market dynamics: LEo,y = 0 Therefore: LEy = Led,y + LEo,y = 0
B.6.4 Summary of the ex-ante estimation of emission reductions: >>
As the leakage emissions (LEy) is 0, the emissions reduction ERy from the project activity during a given year y is the difference between the baseline emissions (BEy) and project emissions (PEy), as follows: ERy = BEy − PEy − LEy (B-14) The emission reduction ERy from the project activity as well as base line emissions (BEy) and project emissions (PEy) during project years are given in Table-19.
Table-19 Summary Table of Emissions Reductions
Year
Project Emissions
PEy
Baseline Emissions
BEy
Leakage Emissions
LEy
Emission Reductions
ERy
2009 Jul.-Dec. 26,651 233,996 0 207,345
2010 53,302 467,993 0 414,691
2011 53,302 467,993 0 414,691

PROJECT DESIGN DOCUMENT FORM (CDM PDD) - Version 03 CDM – Executive Board page 46
2012 53,302 467,993 0 414,691
2013 53,302 467,993 0 414,691
2014 53,302 467,993 0 414,691
2015 53,302 467,993 0 414,691
2016 53,302 467,993 0 414,691
2017 53,302 467,993 0 414,691
2018 53,302 467,993 0 414,691 2017
Jan.- Jun 26,651 233,996 0 207,345
Total 533,019 4,679,927 0 4,146,909
B.7. Application of the monitoring methodology and description of the monitoring plan:
B.7.1 Data and parameters monitored:
Data / Parameter: GEN, y Data unit: MWh Description: Electricity supplied by the project activity in year y. Source of data to be used: Monitoring data provided by the the Guang’an Yimin Coal & Power
Co., Ltd..
Value of data applied for the purpose of calculating expected emission reductions in section B.5
See Electric Supply in Table-15.
Description of measurement methods and procedures to be applied:
The power supplied from at the CMM power station will be transferred to transformer station, and will be measured and reported once an hour by the operators at the transformer station. Monitoring points are presented in Annex 4.
QA/QC procedures to be applied: Wattmeter will be periodically checked and maintained. Backup data will be continuously monitored and archived at the Main Distribution Station respectively.
Any comment:
Data / Parameter: PCCH4 Data unit: % Description: Concentration (in mass) of methane in extracted gas (CMM). Source of data to be used: Analyzed by Xian Branch, China Coal Research Institute. Value of data applied for the purpose of calculating expected emission reductions in section B.5
CH4 in CMM: 79.4 % See Annex 3 Table A2

PROJECT DESIGN DOCUMENT FORM (CDM PDD) - Version 03 CDM – Executive Board page 47
Description of measurement methods and procedures to be applied:
Methane concentration will be monitored continuously at the CMM power plant. Monitoring points are presented in Annex 4. The confidential level of the measuring system, based on the supplier’s quote, is over 95 %. Furthermore, samples taken annually from CMM will be sent to and analyzed by Xian Branch, China Coal Research Institute.
QA/QC procedures to be applied: Concentration meters will be periodically checked and maintained. Data backup will be monitored at the gas drainage station.
Any comment: To be measured on wet basis.
Data / Parameter: CEFNMHC Data unit: tCO2e/tNMHC Description: Carbon emission factor for combusted non methane hydrocarbons Source of data to be used: Monitoring data provided by the Guang’an Yimin Coal & Power Co.,
Ltd., to be obtained through annual analysis of the fractional composition of captured gas. If the NHMC concentration is less than 1%, emissions can be ignored.
Value of data applied for the purpose of calculating expected emission reductions in section B.5
Description of measurement methods and procedures to be applied:
Samples will be taken annually at CMM power station, and sent to and analyzed by the Xian Branch, China Coal Research Institute. If concentration is above 1%, the carbon emission factor for different components will be determined.
QA/QC procedures to be applied: The fractional composition analysis instruments will be subject to a regular maintenance regime before analysing gas components to ensure accuracy.
Any comment: -
Data / Parameter: PCNMHC Data unit: % Description: NMHC concentration (in mass) contained in extracted CMM power
plant. Source of data to be used: Analyzed by the Xian Branch, China Coal Research Institute.
Value of data applied for the purpose of calculating expected emission reductions in section B.5
NMHC =0.12 % See Annex 3 Table A2
Description of measurement methods and procedures to be applied:
Samples will be taken once a year at CMM power station, and sent to and analyzed by the Xian Branch, China Coal Research Institute.
QA/QC procedures to be applied: Analysis of gas samples will be executed by using gas chromatography subjected to a regular maintenance regime before analysing gas components to ensure accuracy.
Any comment: -
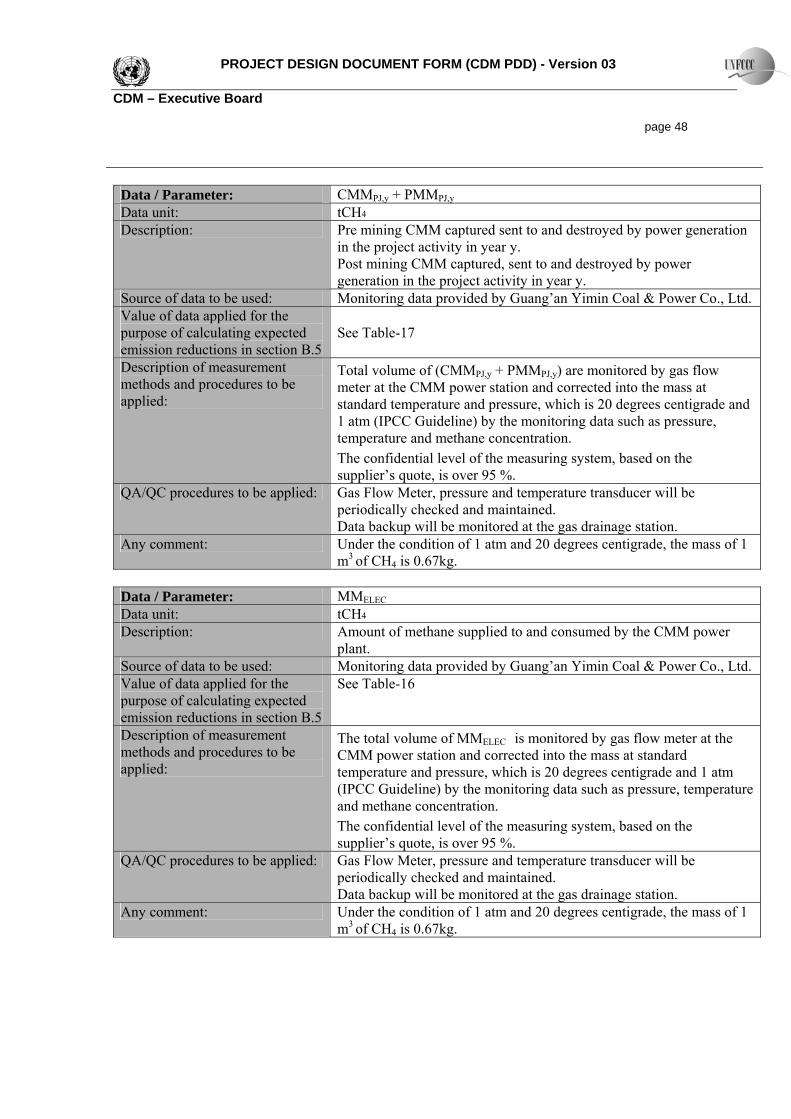
PROJECT DESIGN DOCUMENT FORM (CDM PDD) - Version 03 CDM – Executive Board page 48
Data / Parameter: CMMPJ,y + PMMPJ,y Data unit: tCH4 Description: Pre mining CMM captured sent to and destroyed by power generation
in the project activity in year y. Post mining CMM captured, sent to and destroyed by power generation in the project activity in year y.
Source of data to be used: Monitoring data provided by Guang’an Yimin Coal & Power Co., Ltd.Value of data applied for the purpose of calculating expected emission reductions in section B.5
See Table-17
Description of measurement methods and procedures to be applied:
Total volume of (CMMPJ,y + PMMPJ,y) are monitored by gas flow meter at the CMM power station and corrected into the mass at standard temperature and pressure, which is 20 degrees centigrade and 1 atm (IPCC Guideline) by the monitoring data such as pressure, temperature and methane concentration. The confidential level of the measuring system, based on the supplier’s quote, is over 95 %.
QA/QC procedures to be applied: Gas Flow Meter, pressure and temperature transducer will be periodically checked and maintained. Data backup will be monitored at the gas drainage station.
Any comment: Under the condition of 1 atm and 20 degrees centigrade, the mass of 1 m3 of CH4 is 0.67kg.
Data / Parameter: MMELEC Data unit: tCH4 Description: Amount of methane supplied to and consumed by the CMM power
plant. Source of data to be used: Monitoring data provided by Guang’an Yimin Coal & Power Co., Ltd.Value of data applied for the purpose of calculating expected emission reductions in section B.5
See Table-16
Description of measurement methods and procedures to be applied:
The total volume of MMELEC is monitored by gas flow meter at the CMM power station and corrected into the mass at standard temperature and pressure, which is 20 degrees centigrade and 1 atm (IPCC Guideline) by the monitoring data such as pressure, temperature and methane concentration. The confidential level of the measuring system, based on the supplier’s quote, is over 95 %.
QA/QC procedures to be applied: Gas Flow Meter, pressure and temperature transducer will be periodically checked and maintained. Data backup will be monitored at the gas drainage station.
Any comment: Under the condition of 1 atm and 20 degrees centigrade, the mass of 1 m3 of CH4 is 0.67kg.

PROJECT DESIGN DOCUMENT FORM (CDM PDD) - Version 03 CDM – Executive Board page 49
B.7.2. Description of the monitoring plan:
>> Organization and Monitoring manual The project will involve the development of a monitoring manual, based on which accurate monitoring shall be conducted. The monitoring manual will clearly state the monitoring method employed at each monitoring point and will make sure that the monitoring is accurately conducted. The contents of the monitoring manual are presented in Annex 4. The manual will clarify the management structure of this Project. CDM monitoring structure is shown below in Figure-7.A monitoring team will be formed under the CDM Director, who oversees the entire project, for the management of the monitoring of the project. Monitoring will be mainly conducted at the CMM power plant and gas drainage station. Other monitoring will be carried out at the transformer station. Other functions such as maintenance and periodical check-up, safety control and accident management, and environment management are also carried out at each section (See Figure-8).
Figure-7 Management Structure of the Project

PROJECT DESIGN DOCUMENT FORM (CDM PDD) - Version 03 CDM – Executive Board page 50
Project management (including QC/QA)Support in data accumulation and calculationData archiveReporting and verification
CDM Project Monitoring Team
Project management (including QC/QA)Support in data accumulation and calculationData archiveReporting and verification
CDM Project Monitoring Team
Monitoring- CMM consumption of CMM Power Plant
[MMELEC, PCCH4]- Generating electricity [GEN (backup)]
Maintenance / Periodical check-upCMM P.P., Gas pipeline, Monitoring equipments
Safety control / accident management Gas leakage, etc.
Environmental managementOccupational health and safety, Noise, etc.
CMM Power PlantMonitoring
- CMM consumption of CMM Power Plant[MMELEC, PCCH4]
- Generating electricity [GEN (backup)]Maintenance / Periodical check-up
CMM P.P., Gas pipeline, Monitoring equipmentsSafety control / accident management
Gas leakage, etc.Environmental management
Occupational health and safety, Noise, etc.
CMM Power Plant
Monitoring- CMM consumption
[MMELEC, PCCH4 (backup)]Maintenance / Periodical check-up
Blower, Monitoring equipmentsSafety control / accident management
Gas leakage, etc.Environmental management
Occupational health and safety, Noise, etc.
Gas Drainage StationMonitoring
- CMM consumption[MMELEC, PCCH4 (backup)]
Maintenance / Periodical check-upBlower, Monitoring equipments
Safety control / accident management Gas leakage, etc.
Environmental managementOccupational health and safety, Noise, etc.
Gas Drainage Station
Monitoring- Receiving electricity [GEN]
Maintenance / Periodical check-upTransformer, Power line, Monitoring equipment
Safety control / accident management Power outage / leakage, etc.
Environmental managementOccupational health and safety, Noise, etc.
Transformer Station
Monitoring- Receiving electricity [GEN]
Maintenance / Periodical check-upTransformer, Power line, Monitoring equipment
Safety control / accident management Power outage / leakage, etc.
Environmental managementOccupational health and safety, Noise, etc.
Transformer Station
Figure-8 Monitoring & other function of each section Monitoring points and data to be monitored The data that will be monitored are shown in the table of Section B7.1. Figure-A1 of Annex-4 indicates the detailed instruments installation for monitoring. All equipments installed will correspond to Chinese national standards. Upon monitoring, data backup must also be monitored. Methane concentration and flow volume of CMM will be monitored by employing sensors installed at CMM drainage station. The Gas flow measured will be corrected by pressure and temperature into the STP. STP is defined as 20oC at one atmospheric pressure based on the IPCC guideline. Because CMM within the pipe is released into the atmosphere during maintenance, a gas flow meter will be installed in the discharge pipe to record the volume released into the atmosphere, to be subtracted from the CMM consumption. Received electricity will be monitored employing a sensor installed at transformer station. The data backup will be monitored utilizing a sensor for electricity generated at CMM power plant.The net power supply to the CCPG will be cross-checked with the invoices and /or sales receipts as a control mechanism. Monitoring, recording and management of data

PROJECT DESIGN DOCUMENT FORM (CDM PDD) - Version 03 CDM – Executive Board page 51 All data continuously measured will be transmitted to the monitoring computer via transmitters. The records of the time and date will be added to each measurement data stored in the computer. The electronic records and paper copies will be kept for two years after the end of the crediting period as required by ACM0008. The data will be measured continuously and electronically archived as descried already. At the same time, they must be checked manually once every hour and recorded in measurement tables (hard copy). The chief of each section will check the data in the measurement tables, sign the datasheets, and report the data of the previous day to the Monitoring Team everyday over the telephone. Furthermore, on the first day of every month, the chief will send the measurement table of the previous month to the monitoring team for storage and management. The monitoring team will compile the collected data to calculate emission reductions. The team will also be responsible for data storage and for preparing the data for verification. Quality control and training The following procedures will be followed to install, maintain and calibrate the equipment used in this project: 1) CDM monitoring team and their staff will have training on every day maintenance check during the
test operation by the instrument supplier. 2) The measuring instruments such as for flow volume, methane concentration, pressure and temperature
will be calibrated in accordance with relevant national/sectoral and manufacturers’ requirements; 3) The electricity meters will be calibrated by authorized entities and tested by the local grid company. B.8. Date of completion of the application of the baseline study and monitoring methodology and the name of the responsible person(s)/entity(ies): >> The completion date of this baseline is 30/03/2009 The baseline is determined by:
Name/origination Project participant: Yes/No Dr. Naoki Matsuo / Mr. Kazuo Sasaki / Dr. Gota Deguchi PEAR Carbon Offset Initiative, Ltd. RATIO 1002,Tukiji 1-10-11, Chuo-ku, Tokyo 104-0045, Japan [email protected], [email protected] [email protected]
No
Mr Allen Zhang / Ms Xi Tang / Ms Connie Kang / Mr Wei ZhangKOE Environment Consultancy, Inc.(Japan) Room 1906, C Tower, Chengming Building, No.2 ,Xizhimen Southern Street, Xicheng District, Beijing, 100035, China [email protected] / [email protected] / [email protected] / [email protected]
No

PROJECT DESIGN DOCUMENT FORM (CDM PDD) - Version 03 CDM – Executive Board page 52 SECTION C. Duration of the project activity / crediting period C.1. Duration of the project activity: C.1.1. Starting date of the project activity: >> The start date of the Project activity: 20/03/2008 C.1.2. Expected operational lifetime of the project activity: >> 14 years: C.2. Choice of the crediting period and related information: C.2.1. Renewable crediting period: C.2.1.1. Starting date of the first crediting period: >> Not applicable. C.2.1.2. Length of the first crediting period: >> Not applicable. C.2.2. Fixed crediting period: C.2.2.1. Starting date: >> 01/07/2009 C.2.2.2. Length: >> 10 years
PROJECT DESIGN DOCUMENT FORM (CDM PDD) - Version 03 CDM – Executive Board page 53 SECTION D. Environmental impacts >> D.1. Documentation on the analysis of the environmental impacts, including transboundary impacts: >> The construction of the CMM power station has been initiated in June 2008. Before construction, in April 2008, the Sichuan Research Academy of Environmental Sciences prepared an Environmental Impact Assessment report, which was approved by the Environmental Protection Bureau of Sichuan Province in May 23, 2008. The Environmental Impact Assessment indicates the following: ・This project complies with the requirements of national industrial policy and the cleaner production
policy and the pollutant emission levels satisfy national standards; thus, the project pursues social, economic and environmental public interests.
・ This project complies with national environmental regulations and will operate under national standards.
The Environmental Protection Bureau of Sichuan Province provided the following instructions for the operation of the CMM power plant in its approval letter: 1. During the construction activity, the environmental protection measures should be taken, including
noise level, waste materials and ecosystem. 2. Cooling water for equipments should be circulated after adequate treatment. Household wastewater
should be utilized completely after adequate treatment for sprinkling plant trees and road so that it would not be discharged.
3. Prevention measures for atmosphere pollution should be taken for exhaust gas of CMM generating units and CMM emitted, to keep contamination level below the third class standard limit of “Emission Standard for atmospheric contamination from thermal electric power plants”(GB13223-2003) and “Comprehensive Emission Standard for Air Pollutant” (GB16297-96).
4. Low noise equipment should be chosen preferentially in order to keep the noise level in a factory below at the second standard limit of “Noise Standard for Industrial Area” (GB12348-90).
5. Solid garbage should be collected by the given segregation so that no secondary pollution should be occurred.
6. Prepare in-house environmental control regulation and environmental protection institution to carry out environmental measures certainly.
In response, this project will implement the under mentioned measures: 1. Environmental protection measures carried out during the construction and operation of the CMM
power plant will be based on the following national standard for each subject. · The second class standard limit of “Environment Standard for Air Quantity” (GB3095-1996); · The third class standard limit of “Environment Quantity Standard for Ground Water” (GB3838-
88); · The second class standard limit of “Noise Standard for Industrial Area” (GB12348-90) and “Noise
Standard for Construction area” (GB12523-90).

PROJECT DESIGN DOCUMENT FORM (CDM PDD) - Version 03 CDM – Executive Board page 54
· The first class standard limit of "Comprehensive Emission Standard for Sewage" (GB8978-1996) and "Comprehensive Emission Standard for Sewage into Weihe River System" (GB61/224-2006).
· The third class standard limit of “Emission Standard for atmospheric contamination from thermal electric power plants”(GB13223-2003)
· The third class standard limit of "Comprehensive Emission Standard for Air Pollutant" (GB16297-96).
2. Power generators will be installed in a soundproof building to satisfy noise standards. 3. Cooling water for equipments will be circulated after adequate treatment and waste water, sewage
water and household wastewater will be treated to be used for the greening of power plant premises. 4. Solid garbage will be appropriately treated. 5. Construction activities will not impose environmental damage, including deforestation. 6. In-house environmental control regulation and environmental protection institution will be prepared. D.2. If environmental impacts are considered significant by the project participants or the host Party, please provide conclusions and all references to support documentation of an environmental impact assessment undertaken in accordance with the procedures as required by the host Party: >> The project will contribute to environmental improvement by reducing emissions of air pollutants, including SOX, from CCPG’s coal-fired power plant by replacing power from the CCPG. There are no significant impacts upon the environment or ecosystem to be inflicted by the project activity.

PROJECT DESIGN DOCUMENT FORM (CDM PDD) - Version 03 CDM – Executive Board page 55 SECTION E. Stakeholders’ comments >> E.1. Brief description how comments by local stakeholders have been invited and compiled: >> On Oct. 30th, 2008, the Stakeholders Consultation Meeting of Sichuan Guang’an Caishandong Coal Mine CMM Power Generation Project was held at the meeting room of Guang’an Yimin Coal & Power Co., Ltd., Guang’an City, Sichuan Province of China. The holding of the meeting was announced by sending the opening notice through visits made to local farmers and local governments, and a posting on bulletin board at Guang’an Yimin Coal & Power Co., Ltd. This meeting was held with the intention to reveal all stakeholders’ comments and suggestions on the proposed project and for the purposes of having the project’s aims and details fully understood by its participants, namely, a farmers’ representative from Dadian Village, Guixing Town, the construction site of the project and located along the road connecting the mine and the CMM power station, and representatives from local authorities and of hearing their opinions on the construction and operation of the CMM power station. The meeting engaged two representatives of Dadian Village, three representatives of the local government, six people from Guang’an Yimin Coal & Power Co., Ltd., including three people from Caishandong mine, and three people of CDM Consultancy. E.2. Summary of the comments received: >> The outline of the meeting and summary are as follows:
1. Opening oration from Pu, Silin, the office director of Guang’an Yimin Coal & Power Co., Ltd. 2. Introductions of CMM power generation project—from Pu, Silin, the office director of Guang’an
Yimin Coal & Power Co., Ltd. 3. Statement of the project from Pu, Tiejun, the principal of the CMM project 4. Introductions of CMM power generation project CDM application—KOE 5. Comments declaration on coal mine methane power generation project of Yimin Coal & Power Co.,
Ltd., the environmental assessment, and CDM application, etc. (in a random order) 6. Get to a final comment and sign 7. Meeting conclusion— the session chair 8. Closing
All local government departments and village delegates realize the significance and necessity of the proposed project, which will contribute to local sustainable development and environmental protection. The ardent and active talks on proposed project were exchanged during the meeting. Major contents of statements were as follows: Tang, Wenjiu; Guang’an District Economy Bureau: Guang’an District Economy Bureau will actively support this project because the use of CMM reduces coal mine safety accidents and saves resources efficiently, and it is also encouraged by the national industrial policy. This project has been approved in June, 2008. We hope it can do more contributions to our country and the society.

PROJECT DESIGN DOCUMENT FORM (CDM PDD) - Version 03 CDM – Executive Board page 56 Yang, Guangzhi ; Guang’an District Environmental Protection Bureau: This project has the EIA report, and it implements the “Three- Simultaneous Policy” during the construction period. Waste coal gas is used efficiently by this project, and the energy resources can be conserved at the same time. Although the project is set up in the mountainous area, lots of measures are used to reduce the noise, and the noise has been controlled well. The extracted methane goes through the sulphur removal equipment before it is burnt. That makes the project bringing no impact to the local air quality. My suggestion is that they should pay attention to the engine oil and lubricant, preventing the leakage of these liquids. Ding, Jie; The Coal Administrator Bureau of Guang’an: This project reduces pollution, industrial accidents, and workers’ labour intensity. Also, it provides power guarantees to local economy growth, while creating profit for the enterprise itself. The government of Guang’an District has done a special research on this CMM project; meanwhile, the “Caishandong Coal Mine CMM Power Generation Construction Coordination Leading Group” has been founded to support this project. Dong, Yikuan; The Secretary of Dadian Village: The coal mine is famous for its good economic benefit and safety production in our town. The only deficiency of it is that the extracted CMM is pollution for the village air. The construction of the CMM power generation plant could solve this problem, and it provides new job opportunities to our villagers, too. We agree to the construction of this project. Zhang, Yan; Dadian Villagers: Is there any environmental impact from the project to our villagers? Pu, Tiejun; The Principal of the CMM Project: (As answers the question above) No. The project is safe, efficient, and environmentally friendly. Li, Juzhen; Workers’ representatives: We support this project. We will do our best to accelerate the construction speed and make the project generating earlier. E.3. Report on how due account was taken of any comments received: >> The CDM project (CMM power generation) environmental stakeholders negotiate meeting was progressed by Guang’an Yimin Coal & Power Co., Ltd. on Oct. 30th, 2008, the decisions were formed as follows: Through the understanding of significance and necessity of CDM project (15 MW CMM power generation) of Guang’an Yimin Coal & Power Co., Ltd., the attitude of government department and villager delegates to the project, and the realization of contribution from the project to local sustainable development and environment protection, it is considered that the construction of the project is necessary and feasible. The CMM resource can be utilized maximally by the project. Using CMM for power generation, one hand, it promotes the development of environment protection, on the other hand, it also brings the tremendous environmental benefits and creates more job opportunities.

PROJECT DESIGN DOCUMENT FORM (CDM PDD) - Version 03 CDM – Executive Board page 57 As a result , the construction of the project can make a contribution towards local sustainable development, bring preferable environmental benefit to Guang’an Yimin Coal & Power Co., Ltd. Economy benefit, social benefit and environmental benefit are notable. All the attendants of this conference agree and support the construction of this project.

PROJECT DESIGN DOCUMENT FORM (CDM PDD) - Version 03 CDM – Executive Board page 58
Annex 1
CONTACT INFORMATION ON PARTICIPANTS IN THE PROJECT ACTIVITY Organization: Guang’an Yimin Coal & Power Co., Ltd. Street/P.O.Box: Group 7 Guixing Town Dadian Village Building: City: Guang’an State/Region: Sichuan Province Postcode/ZIP: 638018 Country: P.R. China Telephone: 86-826-2847808 FAX: 86-826-2847868 E-Mail: URL: Represented by: Pu, Silin Title: Salutation: Mr. Last name: Pu Middle name: First name: Silin Department: The office Mobile: 86-13659098444 Direct FAX: 86-826-2966896 Direct tel: 86-826-2966892 Personal e-mail: [email protected]

PROJECT DESIGN DOCUMENT FORM (CDM PDD) - Version 03 CDM – Executive Board page 59
Organization: PEAR Carbon Offset Initiative, Ltd. Street/P.O.Box: Tukiji 1-10-11, Chuo-ku Building: RATIO 1002 City: Tokyo State/Region: ---- Postcode/ZIP: 104-0045 Country: Japan Telephone: ---- FAX: +81-3-3248-0557 E-Mail: ---- URL: ---- Represented by: Mr. Kazuo Sasaki Title: ---- Salutation: Mr. Last name: Sasaki Middle name: ---- First name: Kazuo Department: ---- Mobile: ---- Direct FAX: ---- Direct tel: ---- Personal e-mail: [email protected]

PROJECT DESIGN DOCUMENT FORM (CDM PDD) - Version 03 CDM – Executive Board page 60
Annex 2
INFORMATION REGARDING PUBLIC FUNDING There is no public funding from Annex I countries used in the Project activity.

PROJECT DESIGN DOCUMENT FORM (CDM PDD) - Version 03 CDM – Executive Board page 61
Annex 3
BASELINE INFORMATION
The data required to calculate emission reductions are provided below. More detailed data shall be submitted to the validator upon demand during the validation process.
Table A1 CMM Recovery Plan
CMM powerplant
Emitted in theAtmosphere
103t m3/t m3/min 103m3 103m3 103m3 103m3 103m3
2008 200 221.4 84.2 44,282 28,512 0 28,512 15,770
2009 210 209.8 83.8 44,064 28,512 28,000 512 15,552
2010 210 209.8 83.8 44,064 28,512 28,000 512 15,552
2011 210 209.8 83.8 44,064 28,512 28,000 512 15,552
2012 210 209.8 83.8 44,064 28,512 28,000 512 15,552
2013 210 209.8 83.8 44,064 28,512 28,000 512 15,552
2014 210 209.8 83.8 44,064 28,512 28,000 512 15,552
2015 210 209.8 83.8 44,064 28,512 28,000 512 15,552
2016 210 209.8 83.8 44,064 28,512 28,000 512 15,552
Coal ProductionRelative gasemission rate Gas Emissions VAM
CMMAbsolute gasemission rate
Table A2 Composition of Extracted Gas (Mean value of 8 samples from 4 drainage point)
Composition of Gas(%)
Sampling Points Date of Sampling CH4 C2~5 N2 H2S He CO2 Total
Gas Drainage Point in the Underground
Oct 20, 2007 79.44 0.12 19.6 0.0 0.02 0.82 99.98
Sampling and analyzing were carried out by Xian Branch, China Coal Research Institute.

PROJECT DESIGN DOCUMENT FORM (CDM-SSC-PDD) - Version 03 CDM – Executive Board page 62
Table A3 Fuel consumption and emission of Central China Power Grid in 2004
Fuels Units Jiang xi Henan Hubei Hunan Chong
qing Si
chuan Total Emission factor(tC/TJ)
OXID(%)
NCV(MJ/t, or
MJ/km3)
Emission (tCO2e)
A B C D E F G=A+B
+C+ D+E+F
H I
J
K=G**H*I*J*44/12/ 10000(quality
unit) K=G**H*I*J*44/12/ 1000(volume unit)
Raw coal 104 ton 1863.8 6948.5 2510.5 2197.9 875.5 2747.9 17144.1 25.8 100 20908 339,092,605 Washed coal 104 ton 2.34 2.34 25.8 100 26344 58,316
Other washed coal 104 ton 48.93 104.22 89.72 242.87 25.8 100 8363 1,921,441 Coke 104 ton 109.61 109.61 29.2 100 28435 3,337,011
Coke oven gas 108 M3 1.68 0.34 2.02 12.1 100 16726 149,900 Other gas 108 M3 2.61 2.61 12.1 100 5227 60,527 Crude oil 104 ton 0.86 0.22 1.08 20 100 41816 33,118 Gasoline 104 ton 0.06 0.01 0.07 18.9 100 43070 2,089
Diesel 104 ton 0.02 3.86 1.7 1.72 1.14 8.44 20.2 100 42652 266,627 Fuel oil 104 ton 1.09 0.19 9.55 1.38 0.48 1.68 14.37 21.1 100 41816 464,893
LPG 104 ton 0 17.2 100 50179 0 Refinery gas 104 ton 3.52 2.27 5.79 15.7 100 46055 153,506 Natural gas 108 M3 2.27 2.27 15.3 100 38931 495,775
Other petroleum products 104 ton 0 20 100 38369 0 Other coking products 104 ton 0 25.8 100 28435 0
Other energy 104 ton 16.92 15.2 20.95 53.07 0 100 0 0 Total 346,035,810
Data source: China Energy Statistical Yearbook 2005

PROJECT DESIGN DOCUMENT FORM (CDM-SSC-PDD) - Version 03 CDM – Executive Board page 63
Table A4 The fuel fired electricity generation and calculation of emission factor of Central China Power Grid in 2004
Province The fuel fired electricity generation(MWh)
The rate of electricity self-consumption(%)
The fuel fired electricity connected to the grid(MWh)
Jiangxi 30,127,000 7.04 28,006,059 Henan 109,352,000 8.19 100,396,071 Hubei 43,034,000 6.58 40,202,363 Hunan 37,186,000 7.47 34,408,206 Chongqing 16,520,000 11.06 14,692,888 Sichuan 34,627,000 9.41 31,368,599 The Total 249,074,186 Total Emission (tCO2) 346,035,810 EFOM,y for 2004 1.38929
Data source: China Electric Power Yearbook 2005

PROJECT DESIGN DOCUMENT FORM (CDM-SSC-PDD) - Version 03 CDM – Executive Board page 64
Table A5 Calculation of simple OM emission factor of the Central China Power Grid in 2005
Fuels Units Jiang xi Henan Hubei Hunan Chong
qing Si
chuan Total Emission
factor (tC/TJ)
OXID(%)
NCV(MJ/t, or MJ/km3)
Emission (tCO2e)
A B C D E F G=A+B+C+D+E+F H
I
J
K=G**H*I*J*44/12/ 10000(quality unit) K=G**H*I*J*44/12/ 1000(volume unit)
Raw coal 104 ton 1869.29 7638.87 2732.15 1712.27 875.4 2999.77 17827.75 25.8 100 20908 352,614,497
Washed coal 104 ton 0.02 0.02 25.8 100 26344 498
Other washed coal 104 ton 138.12 89.99 228.11 25.8 100 8363 1,804,669
Coke 104 ton 25.95 105 130.95 29.2 100 28435 3,986,695
Coke oven gas 108 M3 1.15 0.36 1.51 12.1 100 16726 112,054
Other gas 108 M3 10.2 3.12 13.32 12.1 100 5227 308,897
Crude oil 104 ton 0.82 0.36 1.18 20 100 41816 36,185
Gasoline 104 ton 0.02 0.02 0.04 18.9 100 43070 1,194
Diesel 104 ton 1.3 3.03 2.39 1.39 1.38 9.49 20.2 100 42652 299,798
Fuel oil 104 ton 0.64 0.29 3.15 1.68 0.89 2.22 8.87 21.1 100 41816 286,959
LPG 104 ton 0 17.2 100 50179 0
Refinery gas 104 ton 0.71 3.41 1.76 0.78 6.66 15.7 100 46055 176,572
Natural gas 108 M3 3 3 15.3 100 38931 655,209 Other petroleum
products 104 ton 0 20 100 38369 0
Other coking products 104 ton 1.5 1.5 25.8 100 28435 40,349
Other energy 104 ton 2.88 1.74 32.8 37.42 0 100 0 0 Total 360,323,575
Data source: China Energy Statistical Yearbook 2006

PROJECT DESIGN DOCUMENT FORM (CDM-SSC-PDD) - Version 03 CDM – Executive Board page 65
Table A6 The fuel fired electricity generation and calculation of emission factor of Central China Power Grid in 2005
Province The fuel fired electricity generation(MWh)
The rate of electricity self-consumption(%)
The fuel fired electricity connected to the grid(MWh)
Jiangxi 30,000,000 6.48 28,056,000 Henan 131,590,000 7.32 121,957,612 Hubei 47,700,000 2.51 46,502,730 Hunan 39,900,000 5 37,905,000 Chongqing 17,584,000 8.05 16,168,488 Sichuan 37,202,000 4.27 35,613,475 The Total 286,203,305 Total Emission (tCO2) 360,323,575 EFOM,y for 2005 1.25898
Data source: China Electric Power Yearbook 2006

PROJECT DESIGN DOCUMENT FORM (CDM-SSC-PDD) - Version 03 CDM – Executive Board page 66
Table A7 Calculation of simple OM emission factor of the Central China Power Grid in 2006
Fuels Units Jiang xi Henan Hubei Hunan Chong
qing Si
chuan Total Emission
factor (tC/TJ)
OXID(%)
NCV(MJ/t, or MJ/km3)
Emission (tCO2e)
A B C D E F G=A+B+C+ D+E+F H I J
K=G**H*I*J*44/12/ 10000(quality unit) K=G**H*I*J*44/12/ 1000(volume unit)
Raw coal 104 ton 1926.0 8098.01 3179.79 2454.48 1184.3 3285.22 20127.82 25.8 100 20908 398,107,508
Washed coal 104 ton 5.79 5.79 25.8 100 26344 144,295 Other washed coal 104 ton 4.51 104.12 8.59 79.21 196.43 25.8 100 8363 1,554,036
moulded coal 104 ton 0.01 0.01 26.6 100 20908 204 Coke 104 ton 17.23 0.32 17.55 29.2 100 28435 534,299
Coke oven gas 108 M3 0.52 1.07 4.24 0.38 0.01 6.22 12.1 100 16726 461,572 Other gas 108 M3 12.69 3.95 1.7 4.36 0.01 22.71 12.1 100 5227 526,655 Crude oil 104 ton 0.49 0.49 20 100 41816 15,026 Gasoline 104 ton 0.01 0.01 18.9 100 43070 298
Diesel 104 ton 0.91 2.23 1.41 1.78 0.96 7.29 20.2 100 42652 230,298 Fuel oil 104 ton 0.51 1.26 1.31 0.8 0.57 3.49 7.94 21.1 100 41816 256,872
LPG 104 ton 0 17.2 100 50179 0 Refinery gas 104 ton 0.86 8.1 1 0.97 10.93 15.7 100 46055 289,780 Natural gas 108 M3 0.28 0.16 18.63 19.07 15.3 100 38931 4,164,943
Other petroleum products 104 ton 0 20 100 38369 0 Other coking products 104 ton 0.01 0.01 25.8 100 28435 269
Other energy 104 ton 17.45 37.36 31.55 18.29 29.35 134 0 100 0 0 Total 406,286,055
Data source: China Energy Statistical Yearbook 2007

PROJECT DESIGN DOCUMENT FORM (CDM-SSC-PDD) - Version 03 CDM – Executive Board page 67
Table A8 The fuel fired electricity generation and calculation of emission factor of Central China Power Grid in 2006
Province The fuel fired electricity generation(MWh)
The rate of electricity self-consumption(%)
The fuel fired electricity connected to the grid(MWh)
Jiangxi 34,449,000 6.17 32,323,497 Henan 151,235,000 7.06 140,557,809 Hubei 54,841,000 2.75 53,332,873 Hunan 46,408,000 4.95 44,110,804 Chongqing 23,487,000 8.45 21,502,349 Sichuan 44,193,000 4.51 42,199,896 The Total 334,027,226 Total Emission (tCO2) 408,776,270 EFOM,y for 2006 1.212784 Net Power Purchase From the North West Power Grid 3,028,950 EFOM,y for the North West Power Grid in 2006 0.82214
Data source: China Electric Power Yearbook 2007 & China Energy Statistical Yearbook 2007
TableA9 The three years generation weighted average emission factor of Central China Power Grid
Years 2004 2005 2006 three years average emission factor
(tCO2e/MWh)
Total CO2 emission(tCO2e) 346,035,810 360,323,575 408,776,270
The total fuel fired electricity connected to the grid(MWh) 249,074,186 286,203,305 337,056,176
1.27834
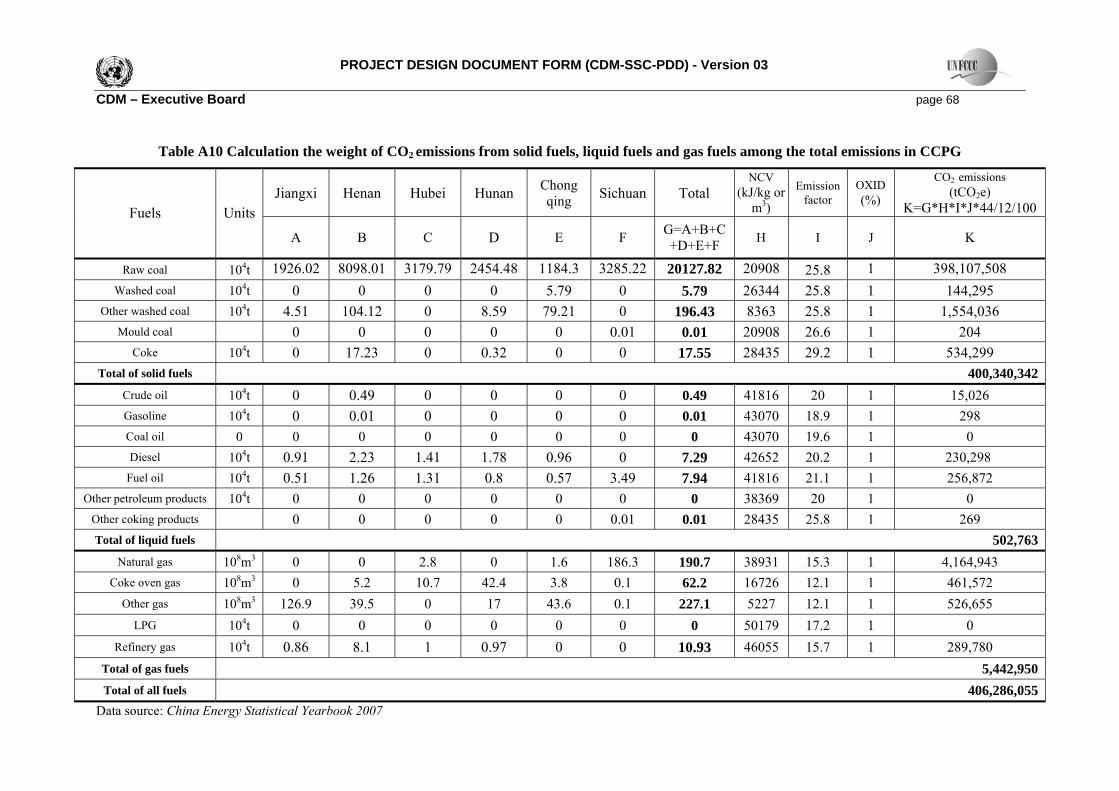
PROJECT DESIGN DOCUMENT FORM (CDM-SSC-PDD) - Version 03 CDM – Executive Board page 68
Table A10 Calculation the weight of CO2 emissions from solid fuels, liquid fuels and gas fuels among the total emissions in CCPG
Jiangxi Henan Hubei Hunan Chong qing Sichuan Total
NCV (kJ/kg or
m3)
Emission factor
OXID(%)
CO2 emissions (tCO2e)
K=G*H*I*J*44/12/100 Fuels Units
A B C D E F G=A+B+C+D+E+F H I J K
Raw coal 104t 1926.02 8098.01 3179.79 2454.48 1184.3 3285.22 20127.82 20908 25.8 1 398,107,508 Washed coal 104t 0 0 0 0 5.79 0 5.79 26344 25.8 1 144,295
Other washed coal 104t 4.51 104.12 0 8.59 79.21 0 196.43 8363 25.8 1 1,554,036 Mould coal 0 0 0 0 0 0.01 0.01 20908 26.6 1 204
Coke 104t 0 17.23 0 0.32 0 0 17.55 28435 29.2 1 534,299 Total of solid fuels 400,340,342
Crude oil 104t 0 0.49 0 0 0 0 0.49 41816 20 1 15,026 Gasoline 104t 0 0.01 0 0 0 0 0.01 43070 18.9 1 298 Coal oil 0 0 0 0 0 0 0 0 43070 19.6 1 0 Diesel 104t 0.91 2.23 1.41 1.78 0.96 0 7.29 42652 20.2 1 230,298
Fuel oil 104t 0.51 1.26 1.31 0.8 0.57 3.49 7.94 41816 21.1 1 256,872 Other petroleum products 104t 0 0 0 0 0 0 0 38369 20 1 0
Other coking products 0 0 0 0 0 0.01 0.01 28435 25.8 1 269 Total of liquid fuels 502,763
Natural gas 108m3 0 0 2.8 0 1.6 186.3 190.7 38931 15.3 1 4,164,943 Coke oven gas 108m3 0 5.2 10.7 42.4 3.8 0.1 62.2 16726 12.1 1 461,572
Other gas 108m3 126.9 39.5 0 17 43.6 0.1 227.1 5227 12.1 1 526,655 LPG 104t 0 0 0 0 0 0 0 50179 17.2 1 0
Refinery gas 104t 0.86 8.1 1 0.97 0 0 10.93 46055 15.7 1 289,780 Total of gas fuels 5,442,950 Total of all fuels 406,286,055
Data source: China Energy Statistical Yearbook 2007

PROJECT DESIGN DOCUMENT FORM (CDM-SSC-PDD) - Version 03 CDM – Executive Board page 69
Table A11 The emission factor of the most efficient commercial coal-fueled, oil-fueled and gas-fueled power plant
Variable Efficiency of electricity supply Emission factor of the fuels(tC/TJ) OXID Emission factor (tCO2e/MWh) A B C D=3.6/A/1000*B*C*44/12
Coal-fueled power plant EFCoal,Adv 37.28% 25.8 1 0.9135 Gas-fueled power plant EFGas,Adv 48.81% 15.3 1 0.4138 Oil-fueled power plant EFOil,Adv 48.81% 21.1 1 0.5706
TableA12 the weight of CO2 emission from solid, liquid and gas fuels among the total emissions and the thermal emission factor of CCPG
λCoal,y λOil,y λGas,y EFEL,fossil,Adv,y(tCO2e/MWh) (λCoal,y* EFCoal,Adv+λOil,y* EFOil,Adv+λGas,y* EFGas,Adv)
98.54% 0.12% 1.34% 0.9064
Table A13 Calculation of BM emission factor of Central China Power Grid
2004 installed capacity
2005 installed capacity
2006 installed capacity
Newly added installed capacity between 2004 and 2005
Weight in newly added installed capacity
A B C D=C-A Fossil fueled(MW) 53825.7 60167.2 76658 22832.3 73.77%
Hydro power(MW) 34642 38405.2 42719 8077 26.10%
Nuclear power(MW) 0 0 0 0 0.00%
Wind power(MW) 0 24 41 41 0.13%
Total(MW) 88467.7 98596.4 119418 30950.3 100.00%
Share in 2006 installed capacity 74.08% 82.56% 100%
BM=0.9064*73.77%=0.6687 tCO2e/MWh
Data source: China Electric Power Yearbook 2005-2007

PROJECT DESIGN DOCUMENT FORM (CDM-SSC-PDD) - Version 03 CDM – Executive Board page 70
Table A14 Calculation of CM emission factor of Central China Power Grid and emission reductions of the proposed project
OM (tCO2e/MWh)
BM (tCO2e/MWh)
CM (tCO2e/MWh)
A B C=0.5×A+0.5×B
1.2783 0.6687 0.9735

PROJECT DESIGN DOCUMENT FORM (CDM-SSC-PDD) - Version 03 CDM – Executive Board
page 71
Annex 4
MONITORING INFORMATION
Monitoring Points
CMM
Gas DrainageStation
W
C
CF
F
CMM Power Plant
0.5MW
Hot Water for Mine Use
Waste Heat
C C PG
CMM Monitoring Point ( backup )
T rans formerS tation
CMM Transport System
Electricity
E lectricity Monitoring Point
0.5MW
0.5MW
F
W
E lectricity Monitoring Point
(backup)
Main S ubs tation
GFM-1
GFM-B1
CM-1
CM-B1
GFM-B2
WM-S1WM-R1
Wattmeter
Gas Flow Meter (flow, pressure
and temperature)
Concentration Meter
WW
FF
CC
Wattmeter
Gas Flow Meter (flow, pressure
and temperature)
Concentration Meter
WW
FF
CC
Figure-A1 Monitoring Points and data to be monitored in each Section
Contents of Monitoring Manual The monitoring manual named “The Operations Monitoring Plan for the Sichuan Guang’an Caishandong Coal Mine CMM Power Project” includes the following contents:
1. Introduction
1.1 Purpose of the Operations Monitoring Plan 1.2 Use of the Operations Monitoring Plan
2. Project Information 2.1 The Monitoring Methodology 2.2 Description of the project activity 2.3 Estimated amount of emission reductions over the chosen crediting period 2.4 Duration of the project activity

PROJECT DESIGN DOCUMENT FORM (CDM-SSC-PDD) - Version 03 CDM – Executive Board
page 72
2.5 The baseline scenario 2.6 Description of the sources and gases included in the project boundary
3. Management 3.1 Allocation of Responsibilities 3.2 Monitoring Organization 3.3 Operational Obligations 3.4 Job Responsibility 3.5 Performance Reports
4. Calculation of emission reductions
4.1 Project Emissions 4.2 Baseline Emissions 4.3 Leakage 4.4 Estimation of emission reductions:
5. Monitoring System
5.1 Data and parameters monitored: 5.2 Recording and Archiving of Monitoring Data 5.3 Monitoring Point 5.4 Monitoring 5.5 The Project Workbook - How to use the Workbook 5.6 Quality Assurance 5.7 Training
6. Auditing and Verification
6.1 Project Commissioning 6.2 Verification Procedures