unfccc clean development mechanism simplified · pdf fileproject design document form...
TRANSCRIPT
PROJECT DESIGN DOCUMENT FORM (CDM-SSC-PDD) - Version 03 CDM – Executive Board
1
MY08-WWP-26, METHANE RECOVERY IN WASTEWATER TREATMENT
PAHANG, MALAYSIA
UNFCCC Clean Development Mechanism Simplified Project Design Document
for Small Scale Projects
DOCUMENT ID: MY08-WWP-26 VER 1, 23 SEPT 2008

PROJECT DESIGN DOCUMENT FORM (CDM-SSC-PDD) - Version 03 CDM – Executive Board
2
CLEAN DEVELOPMENT MECHANISM PROJECT DESIGN DOCUMENT FORM (CDM-SSC-PDD)
Version 03 - in effect as of: 22 December 2006
CONTENTS A. General description of the small scale project activity B. Application of a baseline and monitoring methodology C. Duration of the project activity / crediting period D. Environmental impacts E. Stakeholders’ comments
Annexes Annex 1: Contact information on participants in the proposed small scale project activity Annex 2: Information regarding public funding Annex 3: Baseline information
Annex 4: Monitoring Information

PROJECT DESIGN DOCUMENT FORM (CDM-SSC-PDD) - Version 03 CDM – Executive Board
3
Revision history of this document Version Number
Date Description and reason of revision
01 21 January 2003
Initial adoption
02 8 July 2005 • The Board agreed to revise the CDM SSC PDD to reflect guidance and clarifications provided by the Board since version 01 of this document.
• As a consequence, the guidelines for completing CDM SSC PDD have been revised accordingly to version 2. The latest version can be found at <http://cdm.unfccc.int/Reference/Documents>.
03 22 December 2006
• The Board agreed to revise the CDM project design document for small-scale activities (CDM-SSC-PDD), taking into account CDM-PDD and CDM-NM.

PROJECT DESIGN DOCUMENT FORM (CDM-SSC-PDD) - Version 03 CDM – Executive Board
4
SECTION A. General description of small-scale project activity A.1 Title of the small-scale project activity: MY08-WWP-26, Methane Recovery in Wastewater Treatment, Pahang, Malaysia, Version 1, 23/09/2008. A.2. Description of the small-scale project activity: Purpose: This project will recover methane caused by the decay of biogenic matter in the effluent stream of an existing palm oil processing mill by introducing methane recovery and combustion to the existing anaerobic effluent treatment system (lagoons). Explanation of GHG emission reductions: The proposed project activities will reduce GHG emissions in an economically sustainable manner, and will result in other environmental benefits, such as improved water quality and reduced odour. In simple terms, the project proposes to move from a high-GHG-emitting open air lagoon, to a lower-GHG-emitting anaerobic digester with capture and combustion of the resulting biogas. Contribution to sustainable development: Worldwide, agricultural operations are becoming progressively more intensive to realize the economies of production and scale. The pressure to become more efficient drives significant operational similarities between facilities of a “type,” as inputs, outputs, practices, and technology have become similar around the world. This is especially true in palm oil operations. Untreated, or raw, palm oil mill effluent (POME) is 100 times more polluting than domestic sewage. The Biological Oxygen Demand (BOD) of raw POME averages approximately 25,000 mg/liter.1 In other words, the entire Malaysian palm oil industry produced POME with a BOD equivalent to the domestic sewage of 38 million people in 1998.2 Because POME is quite concentrated, its handling and disposal can create profound environmental consequences, such as greenhouse gas emissions, odour, and water/land contamination (including seepage, runoff, and over application). The project will have positive effects on the local environment by improving air quality through the reduction of odor and cleaner emissions. The project will be installed with an extensive monitoring system, and is designed to comply with all the local environmental regulations. The 9th Malaysian Plan discusses the increased focus on renewable energy and the use of the Clean Development Mechanism (CDM) to foster the implementation of renewable energy projects. In accordance with the intent of the Plan, the project participants will use a portion (at least 10%) of the biogas output for renewable energy. Biogas utilization will occur within the first year of project implementation in order to allow the project participants to better understand biogas production characteristics specific to this site. This utilization of biogas for renewable energy is not part of the current project activity; therefore, credits for renewable energy generation are not requested in this PDD.
1 Maheswaran and Singam (1977) as cited in African Journal of Agricultural Research Vol. 2 (12), p.657, http://www.academicjournals.org/AJAR/PDF/Pdf2007/Dec/Ojonoma%20and%20Nnennaya.pdf 2 Bek-Nielsen et al. (1999) cited in African Journal of Agricultural Research Vol. 2 (12), p.657, http://www.academicjournals.org/AJAR/PDF/Pdf2007/Dec/Ojonoma%20and%20Nnennaya.pdf

PROJECT DESIGN DOCUMENT FORM (CDM-SSC-PDD) - Version 03 CDM – Executive Board
5
A.3. Project participants:
Name of Party involved (*) (host) indicates a host
Party
Private and/or public entity(ies) project participants (*) (as
applicable)
Kindly indicate if the party involved wishes to be considered as project
participant (Yes/No)
Malaysia (host) AES AgriVerde Services (Malaysia) Sdn Bhd No
Netherlands AES AgriVerde Ltd. No
A.4. Technical description of the small-scale project activity: A.4.1. Location of the small-scale project activity: A.4.1.1. Host Party(ies): The Host Party for this project is Malaysia. A.4.1.2. Region/State/Province etc.: The project is located within the Pahang, Malaysia. A.4.1.3. City/Town/Community etc: The project site is shown in Figure 1 with specifics detailed in Table 1. A.4.1.4. Details of physical location, including information allowing the unique identification of this small-scale project activity : The project location is shown in Figure 1 and details are provided in Table 1. A short description of the site is provided below:
Prosper Group Sdn Bhd has the following site in Pahang, Malaysia:
• Endau POM Sdn Bhd (MY-0122WWP) is a palm oil mill with a processing capacity of 60 tonnes per hour. This facility processes approximately 229,088 tonnes of Fresh Fruit Bunches (FFBs) per year. The mill, which is in regulatory compliance, operates approximately an average of 15 hours per day, 26 days per month, and 312 days per year. A system of open lagoons is used to process POME effluent: 2 acidification lagoons, 4 anaerobic lagoons, 1 facultative lagoon, and 1 aerobic lagoon.
The anaerobic lagoons measure approximately 142m x 30m x 4m, 142m x 30m x 3, and 142m x 30m x 3.5m, respectively. The facultative lagoon measures approximately 142m x 42m x 3.5m, and the aerobic lagoon measures 96.5m x 40m x 2m. Lagoon depth averages 2-4 meters but occasionally may vary due to sludge build-up. As a result, these lagoons are subject to sludge removal as needed. Upon removal, the sludge is land applied.
The facility currently has the capacity to produce 900 tonnes of FFB per day. The producer plans to increase production for the next 7 years at a rate of approximately 4% per year. Within the next 7 years, production is planned to reach 260,000 tonnes per year.

PROJECT DESIGN DOCUMENT FORM (CDM-SSC-PDD) - Version 03 CDM – Executive Board
6
Figure 1 –– Project Activity Site in Pahang, Malaysia

PROJECT DESIGN DOCUMENT FORM (CDM-SSC-PDD) - Version 03 CDM – Executive Board
7
Table 1 – Detailed physical location / identification of project site
Site Name (Site ID) Address Town/State Contact Phone GPS
Endau POM Sdn Bhd (MY-0122WWP)
HS (D) 1446 PT. 1112, Mukim Endau, Daerah Rompin
Pahang, Malaysia Mr. Ramasami A/L Sengkodan +609-4141379/+6019- 911 5195
N2 40.852 E103 30.248

PROJECT DESIGN DOCUMENT FORM (CDM-SSC-PDD) - Version 03 CDM – Executive Board
8
A.4.2. Type and category(ies) and technology/measure of the small-scale project activity: The project activity described in this document is classified as a Type III, Other Project Activities, Category III.H., Ver. 9, option iv, Methane recovery in wastewater treatment.3 This project activity will capture and combust methane gas produced from the anaerobic portion of an existing wastewater treatment system.
The project activity utilizes a simple, effective and reliable technology to capture lagoon-produced biogas: installing sealed covers over existing anaerobic POME lagoons to create an anaerobic digester system. Each cover will consist of a synthetic high-density polyethylene (HDPE) geo-membrane which is sealed by means of strip-to-strip welding and a peripheral anchor trench dug around the perimeter of the existing lagoon. The welded seams will be tested to ensure air-tight coupling between all HDPE pieces. In addition, lagoon berms will be upgraded, if necessary, to ensure secure anchoring. HDPE is an excellent product for large applications requiring UV, ozone, and chemical resistance and because of these attributes is one of the most commonly used geo-membranes worldwide. This covering approach effectively enables capture/combustion of 100% of the biogas produced in these lagoons. The digesters incorporate other features to enhance long-term reliability and efficiency including a sludge handling system that enables sludge removal without breaking the digester’s air-tight seal. Other features that will be installed depending on site specific conditions is an effluent recirculation and/or multiple agitators to gently turn over the POME, simulating the natural atmospheric and solar turbulence which will be blocked by the HDPE covers. Since the project developer considers digester design elements as proprietary information, specific design information will be made available to the validating and verifying DOEs. POME will continue to flow from the anaerobic treatment section to facultative lagoons so that the effluents discharge requirements can be met. The captured biogas will be routed to one or more high temperature, enclosed flares to destroy methane gas as it is produced. The 9th Malaysian Plan discusses the increased focus on renewable energy and the use of the Clean Development Mechanism (CDM) to foster the implementation of renewable energy projects. In accordance with the intent of the Plan, the project participants will use a portion (at least 10%) of the biogas output for renewable energy. Biogas utilization will occur within the first year of project implementation in order to allow the project participants to better understand biogas production characteristics specific to this site. This utilization of biogas for renewable energy is not part of the current project activity; therefore, credits for renewable energy generation are not requested in this PDD. Biogas will be accurately metered using a thermal mass flow meter that has two sensing elements: a velocity sensor and a temperature sensor that automatically corrects for changes in gas temperature. The transducer electronics heat the velocity sensor to a constant temperature differential above the gas temperature and measures the cooling effect of the gas flow. The meter runs on DC power and includes a UPS back-up system to provide for the possibility of power outages. This meter type offers distinct advantages over standard flow meters including direct mass flow sensing for temperature and pressure compensation, high accuracy and repeatability for low-pressure gas flow measurement applications, outstanding rangeability, lower flow blockage and pressure drop than conventional meters, and no moving parts. The meter measures the mass flow and automatically converts to normalized volumetric output (NCMA). The biogas flow meter is normalized to 0 degrees Celsius at 1 ATM and calibrated in NCMH units by the manufacturer. Standard density conversion factors are established by the manufacturer. The flaring combustion system is automated to ensure that all biogas that exits the digester and passes through a meter and flare is combusted. A continuous flare ignition system with redundant electrodes ensures methane is combusted whenever biogas is present at the flare. This continuous ignition system is
3 http://cdm.unfccc.int/UserManagement/FileStorage/CDMWF_AM_743QMM1YKHH15AK2AZAVAIJHRGD5R7
PROJECT DESIGN DOCUMENT FORM (CDM-SSC-PDD) - Version 03 CDM – Executive Board
9
powered by a solar module (solar-charged battery system) that does not require external power. With a fully charged battery, the module will provide power to the igniter for up to two weeks without sunlight. The flare includes thermocouples to monitor flare exhaust gas temperature, which is measured and recorded more often than hourly. The component parts are verified functional on a periodic basis in accordance with manufacturer and other technical specifications. Maintenance procedures have been developed to ensure proper handling and disposition of the digester sludge. The disposal of digester sludge will not vary from the baseline scenario. Technology and know-how transfer: The materials and labour used in this project are sourced from the host country whenever possible. When unavailable in the host country, resources may be acquired from other countries. A multi-faceted approach will be implemented to ensure that technology transfer proceeds smoothly, including a methodical process for identifying and qualifying appropriate technology/services providers, transferring the manufacture and maintenance of certain subassemblies to local manufacturers, supervision of the complete installation, staff training, ongoing monitoring (by both site and project developer personnel) and development / implementation of a Monitoring Plan (by the project developer). By working closely with the project on a day-to-day basis, the project developer will ensure that all installed equipment is properly operated and maintained, and will carefully monitor the data collection and recording process. Moreover, by working with the facility’s staff over many years, the project developer will ensure that site personnel acquire appropriate expertise and resources to operate the system on an ongoing / continuous basis.
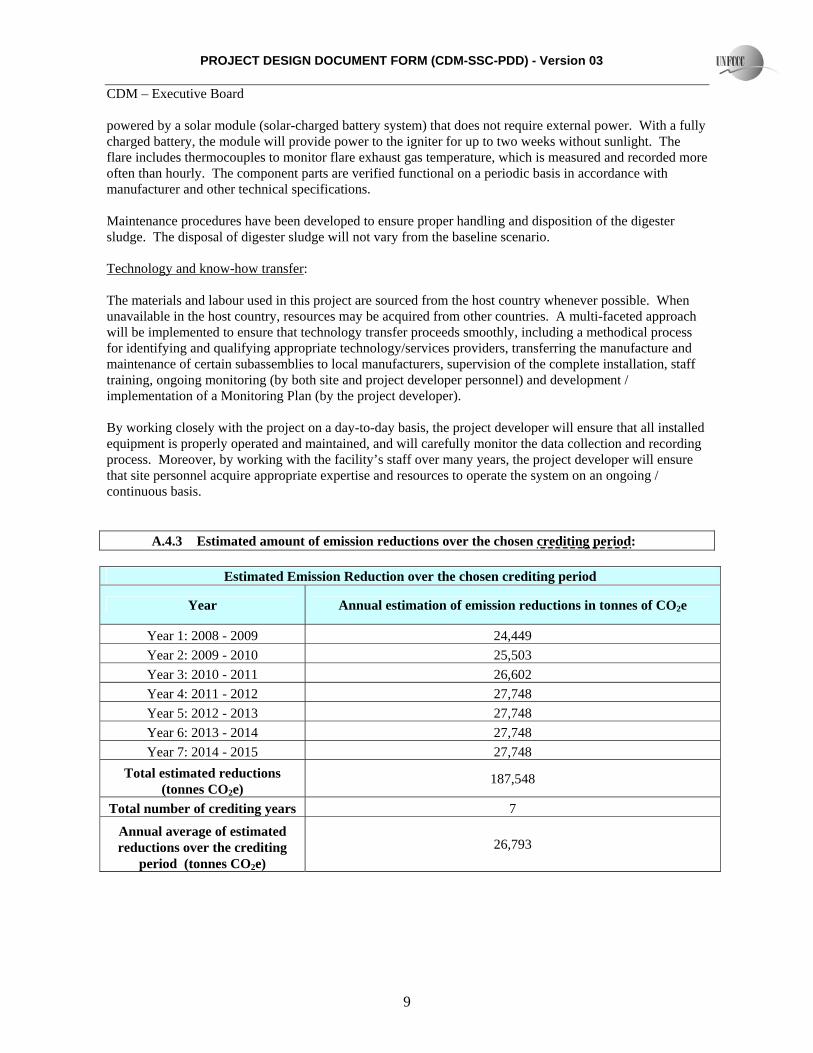
A.4.3 Estimated amount of emission reductions over the chosen crediting period:
Estimated Emission Reduction over the chosen crediting period
Year Annual estimation of emission reductions in tonnes of CO2e
Year 1: 2008 - 2009 24,449 Year 2: 2009 - 2010 25,503 Year 3: 2010 - 2011 26,602 Year 4: 2011 - 2012 27,748 Year 5: 2012 - 2013 27,748 Year 6: 2013 - 2014 27,748 Year 7: 2014 - 2015 27,748
Total estimated reductions (tonnes CO2e)
187,548
Total number of crediting years 7
Annual average of estimated reductions over the crediting
period (tonnes CO2e) 26,793

PROJECT DESIGN DOCUMENT FORM (CDM-SSC-PDD) - Version 03 CDM – Executive Board
10
A.4.4. Public funding of the small-scale project activity: No public funding is being provided for this project. A.4.5. Confirmation that the small-scale project activity is not a debundled component of a large scale project activity: Based on the Compendium of guidance on the debundling for SSC project activities(EB36, Annex 27)4 this project is not debundled according to the following definition: “A proposed small-scale project activity shall be deemed to be a debundled component of a large project activity if there is a registered small-scale CDM project activity or an application to register another small-scale CDM project activity:
(a) With the same project participants; (b) In the same project category and technology/measure; and (c) Registered within the previous 2 years; and (d) Whose project boundary is within 1 km of the project boundary of the proposed small-scale activity
at the closest point.” SECTION B. Application of a baseline and monitoring methodology B.1. Title and reference of the approved baseline and monitoring methodology applied to the small-scale project activity: The project activity applies the UNFCCC-approved small scale methodology AMS III.H., Ver. 9, Methane recovery in wastewater treatment.5 The project is a small scale project because it comprises methane recovery from agro-industries and aggregate emission reductions will not exceed 60 kt CO2eq from all type III components of the project activity annually. B.2 Justification of the choice of the project category: The simplified methodologies are appropriate because the project activity site is considered an agro-industry and GHG emissions calculations can be estimated using internationally accepted IPCC guidance.
The proposed project activity will recover methane from biogenic organic matter in wastewaters according to option (iv) of the methodology:
Introduction of methane recovery and combustion to an existing anaerobic wastewater treatment system such as anaerobic reactor, lagoon, septic tank or an on site industrial plant 6.
This project introduces methane recovery and combustion to an existing wastewater treatment system (a system of acidification, aerobic, anaerobic and facultative lagoons. This simplified baseline methodology is applicable to this project activity because without the proposed project activity, methane from the existing
4http://cdm.unfccc.int/Reference/Guidclarif/ssc/methSSC_guid17_v01.pdf 5 http://cdm.unfccc.int/UserManagement/FileStorage/CDMWF_AM_743QMM1YKHH15AK2AZAVAIJHRGD5R7 6 http://cdm.unfccc.int/UserManagement/FileStorage/CDMWF_AM_743QMM1YKHH15AK2AZAVAIJHRGD5R7

PROJECT DESIGN DOCUMENT FORM (CDM-SSC-PDD) - Version 03 CDM – Executive Board
11
anaerobic treatment system would continue to be emitted into the atmosphere. Based on historical FFB processing rates and baseline estimates, the estimated emission reductions of the project activity will not exceed 60 kt CO2e in any year of the crediting period as shown in Section A.4.3. B.3. Description of the project boundary: As stated in the AMS III-H methodology, the project boundary “is the physical, geographical site where the wastewater and sludge treatment takes place”. Sources influenced by the project are included in the project boundary while sources not influenced by the project are excluded. For this project, the boundary is the physical, geographical site of the waste treatment system, which includes all lagoons described in Section A.4.1.4. (two of which are covered using HDPE to enable the (project’s) capture and combustion of lagoon generated methane)). Sludge treatment is not affected by the implementation of the project activity, therefore, sludge will be disposed of in the same manner as it was prior to the project activity. Biogas utilization for renewable energy will occur during the life of the project but it is not part of the current project activity.
Figure 2– Project Boundary

PROJECT DESIGN DOCUMENT FORM (CDM-SSC-PDD) - Version 03 CDM – Executive Board
12
B.4. Description of baseline and its development: The amount of methane that would be emitted to the atmosphere in the absence of the project activity can be estimated by referring to UNFCCC-approved methodology AMS III.H, version 9, Methane recovery in wastewater treatment. The baseline scenario applicable to this project is in accordance with paragraph 23, option iv of the methodology:
iv. The existing anaerobic wastewater treatment system without methane recovery and combustion;
As assessment of the palm oil facility determined that a system of open lagoons are used to treat POME. This is the most common practice in Malaysian palm oil mills7. In fact, over 85% of the palm oil mills use ponding systems or open lagoons8. Subsequent to treatment in the system of lagoons, the treated POME can be either:
• Applied to land (with a BOD limit of 500 mg/l), or • Directed to waterways (with a BOD limit of 100 mg/l)9
At this site, treated POME is applied to land. The facility was also found to comply with current effluent discharge standards. B.5. Description of how the anthropogenic emissions of GHG by sources are reduced below those that would have occurred in the absence of the registered small-scale CDM project activity: Anthropogenic GHGs, including methane, are released into the atmosphere via decomposition of POME. Currently, this biogas is not collected or destroyed. The proposed project activity intends to improve current wastewater management practices. These changes will result in the mitigation of anthropogenic GHG emissions, specifically the recovery of methane, by controlling the lagoon’s decomposition processes and collecting and combusting the biogas.
There are no existing, pending, or planned national regulatory requirements that govern GHG emissions from agro-industry operations (specifically, palm oil mill processing activities) as outlined in this PDD. The project participants have solicited information regarding this issue during numerous conversations with local and state government officials and through legal representation and have determined there is no regulatory impetus for producers to upgrade current wastewater treatment systems beyond the recommended open air anaerobic lagoon(s).
According to the Non-binding best practice examples to demonstrate additionality for SSC project activities (EB35, Annex 34),10 “project participants shall provide an explanation to show that the project activity would not have occurred anyway due to at least one of the following barriers”:
• Investment barrier: a financially more viable alternative to the project activity would have led to higher emissions;
• Access-to-finance barrier: the project activity could not access appropriate capital without consideration of the CDM revenues;
7 http://www.setatwork.eu/downloads/cp_malaysia.pdf 8 http://www.cogen3.net/doc/countryinfo/malaysia/TechnicalEconomicAnalysisCHPPalmEffluent_BG.pdf 9 http://www.doe.gov.my/dmdocuments/legislation/pua0342y1977.pdf 10 http://cdm.unfccc.int/Reference/Guidclarif/methSSC_guid15_v01.pdf

PROJECT DESIGN DOCUMENT FORM (CDM-SSC-PDD) - Version 03 CDM – Executive Board
13
• Technological barrier: a less technologically advanced alternative to the project activity involves lower risks due to the performance uncertainty or low market share of the new technology adopted for the project activity and so would have led to higher emissions;
• Barrier due to prevailing practice: prevailing practice or existing regulatory or policy requirements would have led to implementation of a technology with higher emissions;
• Other barriers such as institutional barriers or limited information, managerial resources, organizational capacity, or capacity to absorb new technologies.
The most relevant barrier(s) which have prevented this project activity from being implemented without the assistance of CDM are as follows:
• Investment barriers (most significant barrier): This wastewater treatment approach is considered one of the more advanced systems in the world. Producers in few countries have implemented this type of technology on a widespread basis because of the high costs of associated materials and ongoing maintenance. Though costs vary according to required lagoon size and other factors, initial costs to install an HDPE anaerobic digester system can run in the tens of thousands of US dollars11. The Malaysian palm oil industry views the installation of waste treatment systems as a means to satisfy statutory effluent discharge requirements, not a potential revenue source. Although “anaerobic digestion is a versatile biological treatment technology yielding methane as a useful bioenergy”, the majority of mills continue to use pond or lagoon systems. These existing waste treatment systems adhere to Malaysian government requirements and are significantly lower in capital and operating costs than anaerobic digestion technology.12 Implementing this project without the assistance of CDM does not the positive economic returns to justify or even partially offset the expenses. Even the use of biogas produced as a source of renewable energy does not provide a sufficient savings to justify this project implementation. AES AgriVerde (AES AgriVerde Services (Malaysia) Sdn Bhd, AES AgriVerde Ltd.) is the only project participant and the owner of the project equipment. The future CERs generated by this project are the only potential revenues for the investor in this project. Any revenues or cost savings for electricity or heat generation will remain with the mill operator. Therefore, without CDM, the project would be absolutely unattractive and would not be a business option for AES AgriVerde.
• Technological barriers: Operations and maintenance requirements involved with this technology,
including the means to maintain pond circulation (once they are covered), maintaining biochemical equilibrium within the digester(s) and a detailed monitoring (including equipment and material maintenance) program to maintain system performance levels must also be considered13. There is a need for skilled and experienced operators and the availability of such personnel locally is limited as such biogas systems are still relatively rare.14
• Barriers due to prevailing practice: The current lagoon-based treatment system is considered the standard operating practice in palm oil mills in Malaysia15. Despite numerous changes to maximum discharge standards over the years, the combination of anaerobic lagoons and aerobic/facultative lagoons remains able to meet the current permitted discharge levels for land application or waterway discharge. The primary wastewater management priority for most palm oil mills is to simply maintain compliance with local effluent discharge regulations.
11 http://www.mrec.org/pubs/25145.pdf 12 http://www.cogen3.net/doc/countryinfo/malaysia/TechnicalEconomicAnalysisCHPPalmEffluent_BG.pdf 13 http://www.mrec.org/biogas/adgpg.pdf p.39-42. 14 http://www.cogen3.net/doc/countryinfo/malaysia/TechnicalEconomicAnalysisCHPPalmEffluent_BG.pdf 15http://www.setatwork.eu/downloads/cp_malaysia.pdf

PROJECT DESIGN DOCUMENT FORM (CDM-SSC-PDD) - Version 03 CDM – Executive Board
14
While past practices cannot predict future events, it is worth noting that the site included in this project activity has been in existence for a number of years, during which time the prevailing wastewater management practice has been a system of open lagoons. As a result, there is no regulatory requirement for facilities to alter their current practices.
B.6. Emission reductions:
B.6.1. Explanation of methodological choices: Baseline Emissions The amount of methane that would be emitted to the atmosphere in the absence of the project activity can be estimated by referring to UNFCCC-approved methodology AMS III.H, version 9, Methane recovery in wastewater treatment. The baseline scenario applicable to this project is in accordance with paragraph 23, option iv of the methodology:
iv) The existing anaerobic wastewater treatment system without methane recovery and combustion;
For option iv, the methodology requires baseline emissions be calculated as per the formulas below, with MCF lower values from Table III.H.1 to be used.
Equation 1: Total baseline emissions16
BEy = MEPy,ww,bl * GWP_CH4 + MEPy,s,treatment * GWP_CH4 Where:
BEy Baseline emissions in the year y, tonnes CO2e
MEPy,ww,bl Methane emission potential of the anaerobic wastewater treatment plant in the baseline situation in the year y, tonnes
MEPy,s,treatment Methane emission potential of the sludge treatment system in the year y, tonnes
GWP_CH4 Global warming potential of methane
The following equations (Equations 2 and 3) are used to determine the values applied in Equation 1: Equation 2: Baseline emission potential of the wastewater treatment plant17
MEPy,ww,bl = Qy,ww *∑(CODy,removed,i * Bo,ww * MCFww,treatment,i)
Where:
MEPy,ww,bl Methane emission potential of the anaerobic wastewater treatment plant in the baseline situation in the year y, tonnes
16 Adapted from UNFCCC methodology AMS-III.H (Methane recovery in wastewater treatment), V.9, http://cdm.unfccc.int/UserManagement/FileStorage/CDMWF_AM_743QMM1YKHH15AK2AZAVAIJHRGD5R7 17 Adapted from UNFCCC methodology AMS-III.H (Methane recovery in wastewater treatment), V.9, http://cdm.unfccc.int/UserManagement/FileStorage/CDMWF_AM_743QMM1YKHH15AK2AZAVAIJHRGD5R7

PROJECT DESIGN DOCUMENT FORM (CDM-SSC-PDD) - Version 03 CDM – Executive Board
15
Qy,ww Volume of wastewater treated in the year “y” (m3)
CODy,removed,i Chemical oxygen demand removed by the anaerobic wastewater treatment system “i” in the baseline situation in the year “y” (tonnes/ m3)
Bo,ww Methane producing capacity of the wastewater
MCFww, treatment,i Methane correction factor for the existing anaerobic wastewater treatment system “i” (MCF lower value in Table III.H.1)
Equation 3: Baseline emission potential of the sludge treatment system18
MEPy,s,treatment = Sy, untreated * DOCy,s,untreated * DOCF * F * 16/12 * MCFs,treatment
Where:
MEPy,s,treatment Methane emission potential of the sludge treatment system in the year “y” (tonnes)
Sy,untreated Amount of untreated sludge generated in the year “y” (tones)
DOCy,s, untreated Degradable organic content of untreated sludge generated in the year y (fraction). It shall be measured by sampling and analysis of the sludge produced, and estimated ex-ante using the IPCC default values of 0.05 for domestic sludge (wet basis, considering a default dry matter content of 10 percent) or 0.09 for industrial sludge (wet basis, assuming dry matter content of 35 percent).
DOCF Fraction of DOC dissimilated to biogas
F Fraction of CH4 in landfill gas
MCFs,treatment Methane correction factor for the sludge treatment system that will be equipped with methane recovery and combustion/utilization/flare equipment (MCF lower value in Table III.H.1)
18 Adapted from UNFCCC methodology AMS-III.H (Methane recovery in wastewater treatment), V.9, http://cdm.unfccc.int/UserManagement/FileStorage/CDMWF_AM_743QMM1YKHH15AK2AZAVAIJHRGD5R7

PROJECT DESIGN DOCUMENT FORM (CDM-SSC-PDD) - Version 03 CDM – Executive Board
16
Project Activity Emissions
As defined by the methodology, project activity emissions consist of: (i) CO2 emissions on account of power used by the project activity facilities. Emission factors for grid
electricity or diesel fuel use as the case may be shall be calculated as described in category AMS I.D.;
(ii) Methane emissions on account of inefficiency of the wastewater treatment and presence of degradable organic carbon in treated wastewater;
(iii) Methane emissions from the decay of the final sludge generated by the treatment systems; (iv) Methane fugitive emissions on account of inefficiencies in capture and flare systems; (v) Methane emissions resulting from dissolved methane in the treated wastewater effluent. (vi) Where relevant, emissions due to the upgrading and compression of biogas (cases covered under
paragraph 2 (b) and 2 (c)). (vii) Where relevant, emissions due to physical leakage from the dedicated piped network for transport of
upgraded biogas to the end users (cases covered under paragraph 2 (c ii)). In this case, items (iii), (v), (vi), and (vii) are not applicable to the project activity emissions for the following reasons:
• Item (iii) may be neglected since the methodology states in paragraph 12 where PEy,s,final, “If the sludge is controlled combusted, disposed in a landfill with methane recovery, or used for soil application, this term can be neglected, and the final disposal of the sludge shall be monitored during the crediting period.” Therefore, PEy,s,final can be neglected since sludge disposition in this project is soil application.
• Item (v) is “only considered for project activities involving measures described in cases (i), (v), and (vi) of paragraph 1”. Since this project recovers methane by technology option (iv), PEy,dissolved does not need to be calculated.
• Item (vi) may be neglected since this only applies to “(cases covered under paragraph 2 (b) and 2 (c))”. Since those cases are not applicable to this project, PEy,upgrading can be neglected.
• Item (vii) may be neglected since this only applies to “(cases covered under paragraph 2 (c ii))”.
Since that case is not applicable to this project, PEy,leakage, pipeline can be neglected. For this project activity (an anaerobic digester), estimated project emissions are determined as follows: Equation 4: Total project activity emissions19
PEy =PEy,power + PEy,ww,treated + PEy,fugitive Where:
PEy Project activity emissions in the year “y” (tCO2e)
PEy,power Emissions from electricity or diesel consumption in the year “y”
PEy,ww,treated Emissions from degradable organic carbon in treated wastewater in the year “y”
PEy,fugitive Emissions from methane release in capture and utilization/combustion/flare systems in the year “y”
19 Adapted from UNFCCC methodology AMS-III.H (Methane recovery in wastewater treatment), V.9, http://cdm.unfccc.int/UserManagement/FileStorage/CDMWF_AM_743QMM1YKHH15AK2AZAVAIJHRGD5R7

PROJECT DESIGN DOCUMENT FORM (CDM-SSC-PDD) - Version 03 CDM – Executive Board
17
The following equations (Equations 5 through 7) are used to determine the values applied in Equation 4.
Emissions from electricity consumption
According to the methodology, paragraph 13 states: “Project activity emissions from electricity consumption are determined as per the procedures described in AMS I.D. The energy consumption of all equipment/devices installed by the project activity, inter alia facilities for upgrade and compression, filling of bottles, distribution and the final end use of biogas shall be included. For project activity emissions from fossil fuel consumption the emission factor for the fossil fuel shall be used (tCO2/tonne). Local values are to be used, if local values are difficult to obtain, IPCC default values may be used. If recovered methane is used to power auxiliary equipment of the project it should be taken into account accordingly, using zero as its emission factor.” PEy, power details are provided in Annex 3.
Equation 5: Emissions from degradable organic carbon in treated wastewater20
PEy,ww,treated = Qy,ww * GWP_CH4 * Bo,ww * CODy,ww,treated * MCFww,final Where:
PEy,ww,treated Emissions from degradable organic carbon in treated wastewater in the year “y”
Qy,ww Volume of wastewater treated in the year “y” (m3)
GWP_CH4 Global warming potential of methane
Bo,ww Methane producing capacity of the wastewater
CODy, ww, treated Chemical oxygen demand of the final treated wastewater discharged into sea, river or lake in the year “y” (tonnes/m3)
MCFww, final Methane correction factor based on type of treatment and discharge pathway of the wastewater (fraction) (MCF higher value in Table III.H.1)
Emissions from methane release in capture and utilization/combustion/flare systems
In the project activity, fugitive emissions through capture and utilization/combustion/flare inefficiencies in the anaerobic sludge treatment (PEy,fugitive,s) are not calculated since sludge is not subject to any methane capture and flare system.
Therefore, total fugitive emissions (PEy,fugitive) consists solely of fugitive emissions through capture and utilization/combustion/flare inefficiencies in the anaerobic wastewater treatment (PEy,fugitive,ww).
20 Adapted from UNFCCC methodology AMS-III.H (Methane recovery in wastewater treatment), V.9, http://cdm.unfccc.int/UserManagement/FileStorage/CDMWF_AM_743QMM1YKHH15AK2AZAVAIJHRGD5R7

PROJECT DESIGN DOCUMENT FORM (CDM-SSC-PDD) - Version 03 CDM – Executive Board
18
Equation 6: Fugitive emissions through capture and utilization/combustion/flare inefficiencies in the anaerobic wastewater treatment21
PEy,fugitive,ww = (1-CFEww) *MEPy,ww,treatment *GWP_CH4
Where:
PEy,fugitive,ww Fugitive emissions through capture and utilization/combustion/flare inefficiencies in the anaerobic wastewater treatment in the year “y” (tCO2e)
CFEww Capture and utilization/combustion/flare efficiency of the methane recovery and combustion/utilization equipment in the wastewater treatment
MEPy,ww,treatment Methane emission potential of the wastewater treatment plant in the year “y” (tonnes)
GWP_CH4 Global warming potential of methane
Equation 7: Methane emission potential of the wastewater treatment plant22
MEPy,ww,treatment = Qy,ww * Bo,ww * ∑j CODy,removed,j * MCFww,j Where:
MEPy,ww,treatment Methane emission potential of the wastewater treatment plant in the year y, tonnes
Qy,ww Volume of wastewater treated in the year “y” (m3)
Bo,ww Methane producing capacity of the wastewater
CODy,removed,j Chemical oxygen demand removed by the treatment system “j” of the project activity equipped with methane recovery in the year “y” (tonnes/ m3)
MCFww,j Methane correction factor for the wastewater treatment system “j” equipped with methane recovery and combustion/flare/utilization equipment (MCF higher value in Table III.H.1)
Leakage
In accordance with the methodology, leakage calculations are not required since the technology being employed in this project is not transferred from or to another activity.
21 Adapted from UNFCCC methodology AMS-III.H (Methane recovery in wastewater treatment), V.9, http://cdm.unfccc.int/UserManagement/FileStorage/CDMWF_AM_743QMM1YKHH15AK2AZAVAIJHRGD5R7 22 Adapted from UNFCCC methodology AMS-III.H (Methane recovery in wastewater treatment), V.9, http://cdm.unfccc.int/UserManagement/FileStorage/CDMWF_AM_743QMM1YKHH15AK2AZAVAIJHRGD5R7

PROJECT DESIGN DOCUMENT FORM (CDM-SSC-PDD) - Version 03 CDM – Executive Board
19
Equation 8: Estimated emission reductions23
For the purposes of estimation, emission reductions are calculated as the difference between the baseline emission and the sum of the project activity emissions and leakage. In accordance with the methodology, actual calculation of emission reductions during the crediting period will be “based on the amount of methane recovered and fuelled or flared, that is monitored ex-post”.
ERy =BEy –(PEy + Leakagey) Where:
ERy Emission reductions (tCO2e/year)
BEy Baseline emissions (tCO2e/year)
PEy Project activity emissions (tCO2e/year)
Leakagey Leakage emissions (tCO2e/year)
B.6.2. Data and parameters that are available at validation: Accurate data collection is essential. The palm oil processing facility maintains extensive FFB production and processing records to manage operations and to maximize productivity and profitability. AES AgriVerde uses some data collected from this system. AES AgriVerde has a rigorous QA/QC system that ensures data security and data integrity. Spot audits of data collection activities will be conducted on a regular basis. Project activity data related uncertainties will be reduced by applying sound data collection quality assurance and quality control procedures. Data / Parameter: GWP_CH4 Data unit: Description: Global Warming Potential of Methane Source of data used: Refer to AMS III-H, V.9 methodology Value applied: 21 Justification of the choice of data or description of measurement methods and procedures actually applied:
Comments: Data / Parameter: Qy,ww
Data unit: m3
Description: Volume of wastewater treated in the year y Source of data used: Calculated based on facility records Value applied: See Annex 3 Justification of the choice of data or description of measurement methods and procedures actually applied:
Determined by multiplying the FFB production by the conversion factor for FFB to POME.
Comments:
23 Adapted from UNFCCC methodology AMS-III.H (Methane recovery in wastewater treatment), V.9, http://cdm.unfccc.int/UserManagement/FileStorage/CDMWF_AM_743QMM1YKHH15AK2AZAVAIJHRGD5R7

PROJECT DESIGN DOCUMENT FORM (CDM-SSC-PDD) - Version 03 CDM – Executive Board
20
Data / Parameter: Bo,ww Data unit: kg CH4 / kg COD Description: Methane producing capacity of the wastewater Source of data used: IPCC default value for domestic wastewater as cited in AMS III H, V.9
methodology Value applied: 0.21 Justification of the choice of data or description of measurement methods and procedures actually applied:
Comments: Data / Parameter: DOCF Data unit: Fraction Description: Fraction of DOC dissimilated to biogas Source of data used: IPCC default value as cited in AMS III H, V.9 methodology Value applied: 0.5 Justification of the choice of data or description of measurement methods and procedures actually applied:
Comments: Data / Parameter: F Data unit: Fraction Description: Fraction of CH4 in landfill gas Source of data used: IPCC default value as cited in AMS III H, V.9 methodology Value applied: 0.5 Justification of the choice of data or description of measurement methods and procedures actually applied:
Comments:

PROJECT DESIGN DOCUMENT FORM (CDM-SSC-PDD) - Version 03 CDM – Executive Board
21
Data / Parameter: MCFww,treatment,i Data unit: Fraction Description: Methane correction factor for the existing anaerobic wastewater treatment
system “i” Source of data used: IPCC default (lower) value from Table III.H.1 in AMS III H, V.9
methodology Value applied: 0.8 Justification of the choice of data or description of measurement methods and procedures actually applied:
The current type of wastewater treatment and discharge pathway or system to which this project will be applied from Table III.H.1 is Anaerobic deep lagoon (depth more than 2 metres).
Comments: Data / Parameter: MCFww,j
Data unit: Fraction Description: Methane correction factor for the wastewater treatment system equipped
with methane recovery and combustion/flare/utilization equipment Source of data used: IPCC default (higher) value from Table III.H.1 in AMS III H, V.9
methodology Value applied: 1.0 Justification of the choice of data or description of measurement methods and procedures actually applied:
The current type of wastewater treatment and discharge pathway or system to which this project will be applied from Table III.H.1 is Anaerobic deep lagoon (depth more than 2 metres)
Comments: Data / Parameter: MCFww,final Data unit: Fraction Description: Methane correction factor based on type of treatment and discharge
pathway of the wastewater Source of data used: IPCC default (higher) value from Table III.H.1 in AMS III H, V.9
methodology Value applied: 0.1 Justification of the choice of data or description of measurement methods and procedures actually applied:
The type of treatment and discharge pathway of the treated wastewater from Table III.H.1 is aerobic treatment, well managed.
Comments:

PROJECT DESIGN DOCUMENT FORM (CDM-SSC-PDD) - Version 03 CDM – Executive Board
22
Data / Parameter: MCFs,treatment Data unit: Fraction Description: Methane correction factor for the sludge treatment system that will be
equipped with methane recovery and combustion/utilization/flare equipment
Source of data used: Refer to AMS III H, V.9 methodology Value applied: 1.0 Justification of the choice of data or description of measurement methods and procedures actually applied:
This value is applied to both baseline and project equations since the baseline practice of disposing of the sludge via land application will not change and will continue to be practiced during the project activity. Paragraph 41 of the methodology permits methane emissions from anaerobic decay of the final sludge to be neglected “because the sludge is controlled combusted, disposed in a landfill with methane recovery, or used for soil application, then the end-use of the final sludge will be monitored during the crediting period.”
Comments: Data / Parameter: CFEww Data unit: Fraction Description: Capture and utilization/combustion/flare efficiency of the methane
recovery and combustion/utilization equipment in the wastewater treatment
Source of data used: Default value specified in AMS III H., V.9 methodology Value applied: 0.9 Justification of the choice of data or description of measurement methods and procedures actually applied:
Comments: Data / Parameter: CODy,ww,treated
Data unit: Tonnes/m3
Description: Chemical oxygen demand of the final treated wastewater discharged into sea, river or lake in the year “y”
Source of data used: Site Data Value applied: See Annex 3 Justification of the choice of data or description of measurement methods and procedures actually applied:
Comments:

PROJECT DESIGN DOCUMENT FORM (CDM-SSC-PDD) - Version 03 CDM – Executive Board
23
Data / Parameter: CODy,removed,i
Data unit: Tonnes/m3
Description: Chemical oxygen demand removed by the anaerobic wastewater treatment system “i” in the baseline situation in the year “y”
Source of data used: Site Data Value applied: See Annex 3 Justification of the choice of data or description of measurement methods and procedures actually applied:
Comments: Data / Parameter: CODy,removed,j
Data unit: Tonnes/m3
Description: Chemical oxygen demand removed by the treatment system “j” of the project activity equipped with methane recovery in the year “y”
Source of data used: Site Data Value applied: See Annex 3 Justification of the choice of data or description of measurement methods and procedures actually applied:
Comments:
Data / Parameter: PEy,power
Data unit: tCO2e
Description: Emissions from electricity or diesel consumption in the year y Source of data used: Site Data Value applied: See Annex 3 Justification of the choice of data or description of measurement methods and procedures actually applied:
Comments:
Data / Parameter: DCH4,y
Data unit: kg/m3
Description: Density factor of methane Source of data used: Manufacturer specified value for continuous flow meter Value applied: 0.7168 Justification of the choice of data or description of measurement methods and procedures actually applied:
The biogas flow meter is normalized to 0 degrees Celsius at 1 ATM and calibrated in NCMH units by the manufacturer. Standard density conversion factors are established by the manufacturer
Comments:

PROJECT DESIGN DOCUMENT FORM (CDM-SSC-PDD) - Version 03 CDM – Executive Board
24
B.6.3 Ex-ante calculation of emission reductions:
Baseline emissions are calculated using Equations 1 through 3 in Section B.6.1.
Endau (MY-0122WWP) Year 2008-2009 2009-2010 2010-2011 2011-2015
Expected Growth% 0% 4% 4% 4% 0% 0% 0% Total
MEPy,ww,bl 1,335 1,393 1,453 1,515 1,515 1,515 1,515 10,242 MEPy,s,treatment 0 0 0 0 0 0 0 0
GWP_CH4 21 21 21 21 21 21 21 Total Baseline
Emissions, (tCO2e) 28,038 29,247 30,507 31,822 31,822 31,822 31,822 215,079
Project emissions are calculated using Equations 4 through 7 in Section B.6.1.
Endau (MY-0122WWP) Year 2008-2009 2009-2010 2010-2011 2011-2015
Expected Growth % 0% 4% 4% 4% 0% 0% 0% Total
PEy,power 0 0 0 0 0 0 0 0 PEy,ww,treated 84 88 92 96 96 96 96 647
PEy,s,final 0 0 0 0 0 0 0 0 PEy,fugitive 3,505 3,656 3,813 3,978 3,978 3,978 3,978 26,885
Project Emissions (tCO2e)
3,589 3,744 3,905 4,073 4,073 4,073 4,073 27,532
Since the technology used does not consist of equipment from another activity nor is the existing equipment transferred to another activity, leakage does not need to be considered as per the methodology.

PROJECT DESIGN DOCUMENT FORM (CDM-SSC-PDD) - Version 03 CDM – Executive Board
25
B.6.4 Summary of the ex-ante estimation of emission reductions:
Total Emission Reductions (tonnes CO2e)
Year Estimation of
project activity emissions (tCO2e)
Estimation of baseline emissions
(tCO2e)
Estimation of leakage (tCO2e)
Estimation of overall emission reductions
(tCO2e)
Year 1: 2008 - 2009 3,589 28,038 0 24,449 Year 2: 2009 - 2010 3,744 29,247 0 25,503 Year 3: 2010 - 2011 3,905 30,507 0 26,602 Year 4: 2011 - 2012 4,073 31,822 0 27,748 Year 5: 2012 - 2013 4,073 31,822 0 27,748 Year 6: 2013 - 2014 4,073 31,822 0 27,748 Year 7: 2014 - 2015 4,073 31,822 0 27,748 Total (tonnes CO2e) 27,532 215,079 0 187,548
B.7 Application of a monitoring methodology and description of the monitoring plan:
B.7.1 Data and parameters monitored: AES AgriVerde has developed a unique set of data management tools to efficiently capture and report data throughout the project lifecycle. On-site assessment, supplier production data exchange, task tracking, and post-implementation auditing tools have been developed to ensure accurate, consistent, and complete data gathering and project implementation. Tools have also been created to monitor the creation of high quality, permanent ERs using IPCC formulae. By implementing all of these tools, AES AgriVerde enables transparent data collection and verification. All equipment selected for this project meets international industry certification standards. The equipment (i.e. biogas flow meters, gas, flare/combustion equipment) will be calibrated and maintained in accordance with manufacturer specifications to ensure operation continues at design efficiency and accuracy. Equipment specifications have been provided to the DOE Data / Parameter: Qy,ww
Data unit: m3
Description: Volume of the wastewater treated in the year “y” Source of data to be used: Derived from Mill records. Value of data Description of measurement methods and procedures to be applied:
Determined by multiplying the FFB production by the conversion factor for FFB to POME. (Conversion factor to be field verified by a third party on an annual basis.)
QA/QC procedures to be applied:
Data used to calculate this parameter will be verified with facility production records and periodic on-site monitoring.
Any comment: Data will be archived electronically and kept for the duration of the project + 2 years.

PROJECT DESIGN DOCUMENT FORM (CDM-SSC-PDD) - Version 03 CDM – Executive Board
26
Data / Parameter: CODy,ww,untreated
Data unit: Tonnes/m3
Description: Chemical oxygen demand of the wastewater entering the anaerobic treatment/reactor system in the year “y”
Source of data to be used: Sampling analysis. Value of data Description of measurement methods and procedures to be applied:
Measured and recorded semi-annually via third party sampling and analysis.
QA/QC procedures to be applied:
COD analysis of wastewater samples will be conducted by a third party in accordance with equipment manufacturer’s specifications and will include blank and calibration standards.
Any comment: Data will be archived electronically and kept for the duration of the project + 2 years.
Data / Parameter: CODy,ww,treated
Data unit: Tonnes/m3 Description: Chemical oxygen demand of the final treated wastewater discharged in the
year “y” Source of data to be used: Sampling analysis. Value of data Description of measurement methods and procedures to be applied:
Measured and recorded semi-annually via third party sampling and analysis.
QA/QC procedures to be applied:
COD analysis of wastewater samples will be conducted by a third party in accordance with equipment manufacturer’s specifications and will include blank and calibration standards.
Any comment: Data will be archived electronically and kept for the duration of the project + 2 years.
Data / Parameter: CODy,removed
Data unit: Tonnes/m3 Description: Chemical oxygen demand that is the difference between the inflow COD and
the outflow COD in the year “y” Source of data to be used: Sampling analysis. Value of data Description of measurement methods and procedures to be applied:
Determined by subtracting CODy,ww,treated from CODy,ww,untreated. Recorded semi-annually.
QA/QC procedures to be applied:
COD analysis of wastewater samples will be conducted by a third party in accordance with equipment manufacturer’s specifications and will include blank and calibration standards.
Any comment: Data will be archived electronically and kept for the duration of the project + 2 years.

PROJECT DESIGN DOCUMENT FORM (CDM-SSC-PDD) - Version 03 CDM – Executive Board
27
Data / Parameter: BGPFlare
Data unit: NCM
Description: Amount of biogas recovered and directed to flare for combustion Source of data to be used: Continuous flow meter (refer to Section A.4.2 for equipment description). Value of data Description of measurement methods and procedures to be applied:
Measured and recorded more often than hourly
QA/QC procedures to be applied:
AES AgriVerde employs an internal QA audit process that ensures monitoring activities are conducted in accordance with the monitoring plan and verifies the accuracy of data reported.
Any comment: Data will be archived electronically or on paper and kept for the duration of the project + 2 years.
Data / Parameter: MCbiogas
Data unit: Percentage (volume) Description: Methane content of biogas Source of data to be used: Gas analyzer Value of data Description of measurement methods and procedures to be applied:
Measured and recorded periodically. The measuring equipment is calibrated in accordance with the manufacturer specifications. Sufficient measurements will be made to meet a 95% confidence level.
QA/QC procedures to be applied:
Use and calibration of the methane analyzer will be conducted in accordance with manufacturer’s standards. A calibration/service log will be maintained for each methane analyzer.
Any comment: Data will be archived electronically or on paper and kept for the duration of the project + 2 years.
Data / Parameter: DCH4,y
Unit: kg/m3 Description: Density factor of methane Source of data to be used: Manufacturer specified value for continuous flow meter Value of data: 0.7168 Description of measurement methods and procedures to be applied:
The biogas flow meter is normalized to 0 degrees Celsius at 1 ATM and calibrated in NCMH units by the manufacturer. Standard density conversion factors are established by the manufacturer. Proper equipment calibration will be monitored to ensure normalization.
QA/QC procedures to be applied:
The flow meter will be operated and calibrated according to manufacturer’s specifications.
Any comment: Data will be archived electronically or on paper and kept for the duration of the project + 2 years.
Data / Parameter: CFEww
Data unit: Percentage Description: Efficiency of flaring process Source of data to be used: Refer to AMS III H, V.9 methodology (paragraph 38, option a) Value of data 0.90* Description of measurement methods
Flares shall be operated in accordance with manufacturer specifications. Flare combustion temperature and biogas flow rate data will be recorded more
PROJECT DESIGN DOCUMENT FORM (CDM-SSC-PDD) - Version 03 CDM – Executive Board
28
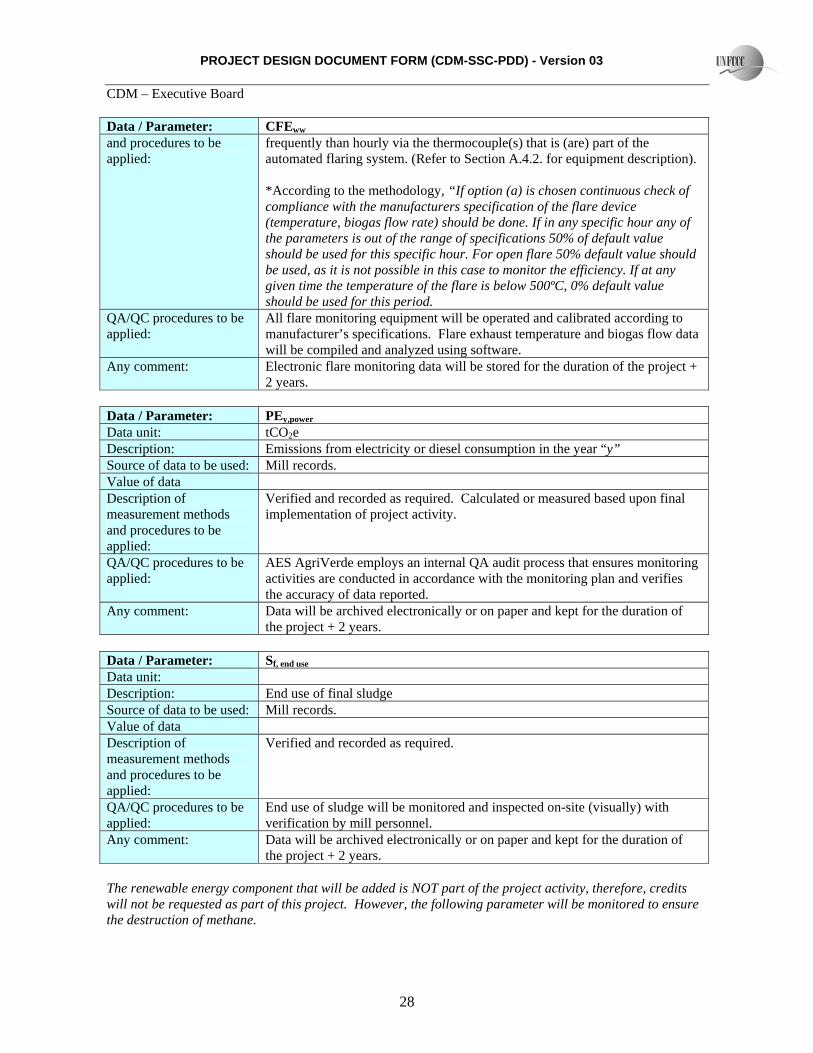
Data / Parameter: CFEww
and procedures to be applied:
frequently than hourly via the thermocouple(s) that is (are) part of the automated flaring system. (Refer to Section A.4.2. for equipment description). *According to the methodology, “If option (a) is chosen continuous check of compliance with the manufacturers specification of the flare device (temperature, biogas flow rate) should be done. If in any specific hour any of the parameters is out of the range of specifications 50% of default value should be used for this specific hour. For open flare 50% default value should be used, as it is not possible in this case to monitor the efficiency. If at any given time the temperature of the flare is below 500ºC, 0% default value should be used for this period.
QA/QC procedures to be applied:
All flare monitoring equipment will be operated and calibrated according to manufacturer’s specifications. Flare exhaust temperature and biogas flow data will be compiled and analyzed using software.
Any comment: Electronic flare monitoring data will be stored for the duration of the project + 2 years.
Data / Parameter: PEy,power
Data unit: tCO2e
Description: Emissions from electricity or diesel consumption in the year “y” Source of data to be used: Mill records. Value of data Description of measurement methods and procedures to be applied:
Verified and recorded as required. Calculated or measured based upon final implementation of project activity.
QA/QC procedures to be applied:
AES AgriVerde employs an internal QA audit process that ensures monitoring activities are conducted in accordance with the monitoring plan and verifies the accuracy of data reported.
Any comment: Data will be archived electronically or on paper and kept for the duration of the project + 2 years.
Data / Parameter: Sf, end use
Data unit:
Description: End use of final sludge Source of data to be used: Mill records. Value of data Description of measurement methods and procedures to be applied:
Verified and recorded as required.
QA/QC procedures to be applied:
End use of sludge will be monitored and inspected on-site (visually) with verification by mill personnel.
Any comment: Data will be archived electronically or on paper and kept for the duration of the project + 2 years.
The renewable energy component that will be added is NOT part of the project activity, therefore, credits will not be requested as part of this project. However, the following parameter will be monitored to ensure the destruction of methane.

PROJECT DESIGN DOCUMENT FORM (CDM-SSC-PDD) - Version 03 CDM – Executive Board
29
Data / Parameter: BGPboiler
Data unit: m3 /year Description: Net quantity of biogas combusted in boiler or generator system Source of data to be used: Continuous flow meter (refer to Section A.4.2 for equipment description). Value of data Description of measurement methods and procedures to be applied:
Measured and recorded more often than hourly
QA/QC procedures to be applied:
AES AgriVerde employs an internal QA audit process that ensures monitoring activities are conducted in accordance with the monitoring plan and verifies the accuracy of data reported. The flow meter will be operated and calibrated according to manufacturer’s specifications. A calibration/service log will be maintained for the flow meter.
Any comment: Data will be archived electronically or on paper and kept for the duration of the project + 2 years.
Data / Parameter: REON
Unit: ºC
Description: Signal to prove the Renewable Energy Unit is combusting the biogas Source of data to be used: Renewable Energy Unit mounted thermocouple Value of data: Description of measurement methods and procedures to be applied:
Measured more often than hourly and recorded quarterly
QA/QC procedures to be applied:
AES AgriVerde employs an internal QA audit process that ensures monitoring activities are conducted in accordance with the monitoring plan and verifies the accuracy of data reported.
Any comment: Data will be archived electronically or on paper and kept for the duration of the project + 2 years.
Calculation of emission reductions during the crediting period In accordance with the methodology, this type of project (technology option (iv)) requires that “the calculation of emission reductions shall be based on the amount of methane recovered and fuelled or flared, that is monitored ex-post. Also for these cases, the project emissions and leakage will be deducted from the emission reductions calculated from the methane recovered and combusted, except where it can be demonstrated that the technology implemented does not increase the amount of methane produced per unit of COD removed (COD removed is the difference between the inflow COD (CODy,ww,untreated) and outflow COD (CODy,ww,treated)), compared with the technology used in the baseline.24” Inflow and outflow COD is monitored to demonstrate there is no increase in the amount of methane produced per unit of COD removed. Accordingly, emission reductions (ER) during the crediting period will simply be based upon the methane recovered and fueled or flared (My). In addition, as stated in section B.6.1, leakage calculations are not required since the technology being employed in this project is not transferred from or to another activity. The amount of methane recovered or fuelled/flared will be calculated and converted into tonnes of CO2e as follows: 24 UNFCCC methodology AMS-III.H (Methane recovery in wastewater treatment), V.9, http://cdm.unfccc.int/UserManagement/FileStorage/CDMWF_AM_743QMM1YKHH15AK2AZAVAIJHRGD5R7

PROJECT DESIGN DOCUMENT FORM (CDM-SSC-PDD) - Version 03 CDM – Executive Board
30
Equation 9. Methane recovered and fuelled or flared ex-post
My =BGPFlare *MCbiogas * DCH4,y *CFEww * GWP_CH4 – PEy,power
Where:
My methane recovered and fueled or flared (tCO2e)
BGPFlare amount of biogas recovered and directed to flare for combustion (Nm3)
MCbiogas methane content of biogas (fraction)
DCH4,y density factor25 of methane (kg/m3)
CFEww efficiency of the flaring process (percentage)
GWP_CH4 global warming potential of methane
PEy,power emissions from electricity or diesel consumption due to the project activity
Based upon final implementation of project activity, this will be measured or conservatively calculated in accordance with AMS III.H, v.9 paragraph 13. If applicable, project emissions from electricity consumption are conservatively calculated based upon the total horsepower (HP) consumed by project activity equipment (converted to kWh). To remain conservative, equipment is assumed to be in operation 24 hours per day, 365 days per year. The following formula is used to convert the data to tCO2e: 26
PEy,power = (HP * 0.745727 * Hd * Dy * EF) / 1000
Where: PEy,power Project emissions due to electricity consumption of equipment (tCO2e/yr) HP Horsepower of equipment Hd Hours per day equipment is in use Dy Days per year equipment is in use EF Country specific electricity emission factor Note: If applicable, project emissions due to consumption of fossil fuel are determined using the appropriate emission factor for the fuel type(s).
25 Normalized to 0 degrees Celsius at 1 ATM and calibrated in NCMH units by the manufacturer. Standard density conversion factors are established by the manufacturer. 26 http://www.energy-toolbox.vic.gov.au/understanding_your_energy_bill/emission_estimation_methodologies/electricity_emission_estimation_methodologies.html 27 .7457 is the standard scientific conversion factor from horsepower (HP) to Kilowatt Hours (kWh) based on Ohm’s Law

PROJECT DESIGN DOCUMENT FORM (CDM-SSC-PDD) - Version 03 CDM – Executive Board
31
B.7.2 Description of the monitoring plan: A monitoring plan has been developed to ensure that accurate and relevant measurements and observations are made to document palm oil mill production metrics, project biogas production and equipment operation, including possible sources of sludge, emissions and leakage. This plan reflects good monitoring practice appropriate to this type of project activity and meets the requirements of the Simplified modalities and procedures for small-scale clean development mechanism project activities.28 Local or in-country personnel are responsible for the collection of all monitoring data. This data is quality checked and then transmitted to AES AgriVerde for secure electronic storage. All data is maintained for a minimum of 2 years beyond the duration of the project.
AES AgriVerde has established a dedicated regional O&M staff to perform activities including, but not limited to, monitoring and collection of parameters, quality audits, personnel training, palm oil mill staff training, and equipment inspections. Separate operations and maintenance manuals have been developed to ensure equipment functions in accordance with required specifications and calibrations. These manuals provide specific guidance to individuals that collect and/or process data. AES AgriVerde staff will perform audits of operations personnel on a regular basis to ensure integrity in the data collection and archiving. An on-site training program will include hands-on proficiency training, question and answer sessions, and an evaluation. Training will be conducted prior to operational start-up. Training topics will include, but are not limited to, CDM project overview, system overview, subsystem specific modules, data collection and quality control, instrument function, malfunction diagnostics, fault reporting and escalation, and facility personnel orientation. Safety and security are elements that will be emphasized in each functional area. Follow-up training will be provided on an as-needed basis. B.8 Date of completion of the application of the baseline and monitoring methodology and the name of the responsible person(s)/entity(ies) The final draft of the application of the methodology was completed on 23/09/2008.
The entity determining the baseline is AES AgriVerde who is the project developer as well as a project participant. Contact information is listed in Annex 1.
SECTION C. Duration of the project activity / crediting period C.1 Duration of the project activity: C.1.1. Starting date of the project activity: The starting date for this activity is 30/06/2008, the construction date. C.1.2. Expected operational lifetime of the project activity: The expected life of this project is 21 years.
C.2 Choice of the crediting period and related information: The project activity will use a renewable crediting period
28 http://cdm.unfccc.int/Reference/COPMOP/08a01.pdf#page=43

PROJECT DESIGN DOCUMENT FORM (CDM-SSC-PDD) - Version 03 CDM – Executive Board
32
C.2.1. Renewable crediting period C.2.1.1. Starting date of the first crediting period: The starting date of the first crediting period is 01/07/2009 or the project registration date (if it occurs after the planned credit period start date). C.2.1.2. Length of the first crediting period: The length of the first crediting period is 7y-0m. C.2.2. Fixed crediting period: C.2.2.1. Starting date: C.2.2.2. Length:

PROJECT DESIGN DOCUMENT FORM (CDM-SSC-PDD) - Version 03 CDM – Executive Board
33
SECTION D. Environmental impacts D.1. If required by the host Party, documentation on the analysis of the environmental impacts of the project activity: According to the Malaysian Environmental Quality (Prescribed Premises) (Crude Palm Oil) Order of 197729, “All premises occupied or used for the processing of oil-palm fruit or oil-palm fresh-fruit bunches into crude palm-oil, whether as an intermediate or final product” are required to be licensed to ensure the discharge effluent will not exceed the regulatory limits on BOD concentration. The regulations, however, do not dictate specific treatment technologies be implemented to meet these requirements. While an environmental impact analysis is not required for this type of GHG project activity, state-level approval of the project by the Department of the Environment is required. This is accomplished via periodic renewal of the mill’s business license. Additionally, the Department of Safety and Health must be notified of any gas handling system equipment installed on site. Environment: There are no negative environmental impacts resulting from the proposed project activity. Beyond the principal benefit of mitigating GHG emissions (the primary focus of the proposed project); the proposed activity will also result in positive environmental co-benefits. They include a reduction in atmospheric emissions of Volatile Organics Compounds (VOCs) that cause odour and acid rain, and promotion of an improved, modernized image of the palm oil production industry. The combination of these factors will make the proposed project site more “neighbour friendly” and environmentally responsible. D.2. If environmental impacts are considered significant by the project participants or the host Party, please provide conclusions and all references to support documentation of an environmental impact assessment undertaken in accordance with the procedures as required by the host Party: No action required.
29 http://www.doe.gov.my/dmdocuments/legislation/pua0199y1977.pdf

PROJECT DESIGN DOCUMENT FORM (CDM-SSC-PDD) - Version 03 CDM – Executive Board
34
SECTION E. Stakeholders’ comments E.1. Brief description how comments by local stakeholders have been invited and compiled: AES AgriVerde invited stakeholders to a meeting to explain both the UNFCCC CDM process and the proposed project activity. This meeting was held on 11/03/2008 at the Endau POM office in Rompin, Pahang, Malaysia. Invitations were issued to government officials at the federal, state, and local levels. Public announcements of the meetings appeared in the following publications:
• Star, South East, 08/03/2008, N9, Melaka, Johor, Sabah, Sarawak, Pahang, Kuantan, Terengganu, Malaysia
All invitations were in the English language. The meeting was attended by project participants, various members from the local community, and producer representatives. A full list of attendees and the meeting minutes are available on request. AES AgriVerde Mr. Chan Sow Keong gave a presentation addressing the following topics:
• the purpose of the meeting • an overview of global warming and the Kyoto Protocol • UNFCCC CDM processes • project participants, processes and responsibilities • equipment used for evaluation and audits • the information management system • a project example • benefits of the project (environmental and economic) • where to obtain further information • the company’s business role in Malaysia for reducing carbon emissions
E.2. Summary of the comments received:
After the presentations, attendees were afforded the opportunity to ask questions regarding the proposed project activities.
Overall, the comments from the attendees at the stakeholders’ meeting were positive and supportive of the project.
E.3. Report on how due account was taken of any comments received: No action required.

PROJECT DESIGN DOCUMENT FORM (CDM-SSC-PDD) - Version 03 CDM – Executive Board
35
Annex 1
CONTACT INFORMATION ON PARTICIPANTS IN THE PROJECT ACTIVITY
Project Participant Organization: AES AgriVerde Ltd. Street/P.O.Box: 10 Queen Street, Suite 105 Building: Gibbons Building City: Hamilton State/Region: Postfix/ZIP: HM11 Country: Bermuda Telephone: +1 (321) 409-7800 FAX: +1 (321) 722-9008 E-Mail: [email protected] URL: www.aesagriverde.com Represented by: Title: Director, Regulatory Affairs and Quality Salutation: Mr. Last Name: Perkowski Middle Name: S. First Name: Leo Department: Regulatory Mobile: Direct FAX: +1 (321) 722-9008 Direct tel: +1 (321) 409-7841 Personal E-Mail: [email protected]
PROJECT DESIGN DOCUMENT FORM (CDM-SSC-PDD) - Version 03 CDM – Executive Board
36
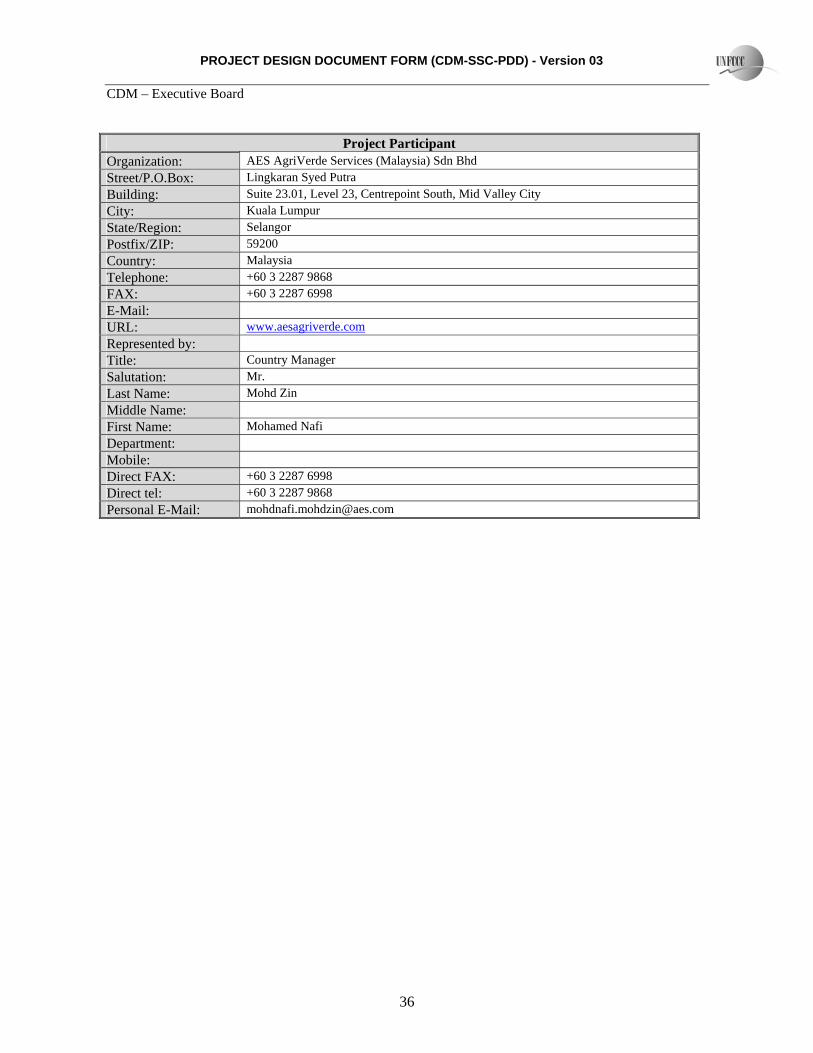
Project Participant
Organization: AES AgriVerde Services (Malaysia) Sdn Bhd Street/P.O.Box: Lingkaran Syed Putra Building: Suite 23.01, Level 23, Centrepoint South, Mid Valley City City: Kuala Lumpur State/Region: Selangor Postfix/ZIP: 59200 Country: Malaysia Telephone: +60 3 2287 9868 FAX: +60 3 2287 6998 E-Mail: URL: www.aesagriverde.com Represented by: Title: Country Manager Salutation: Mr. Last Name: Mohd Zin Middle Name: First Name: Mohamed Nafi Department: Mobile: Direct FAX: +60 3 2287 6998 Direct tel: +60 3 2287 9868 Personal E-Mail: [email protected]

PROJECT DESIGN DOCUMENT FORM (CDM-SSC-PDD) - Version 03 CDM – Executive Board
37
Annex 2
INFORMATION REGARDING PUBLIC FUNDING No public funding is being provided for this project.

PROJECT DESIGN DOCUMENT FORM (CDM-SSC-PDD) - Version 03 CDM – Executive Board
38
Annex 3
BASELINE INFORMATION
Data available at validation (not presented in Section B.6.2) Description Variable Value Unit Source
Annual FFB production
2008-2009: 229,088 2009-2010: 238,960 2010-2011: 249,258 2011-2015: 260,000
Tonnes Average based on the most recent years facility records.
Conversion factor of FFB to POME 0.7 Malaysia Department of
Environment30
Volume of wastewater treated in the year “y” Qy,ww
2008-2009: 160,362 2009-2010: 167,272 2010-2011: 174,481 2011-2015: 182,000
m3
Average calculated based on facility records - Determined
by multiplying the FFB production by the conversion
factor for FFB to POME. Chemical oxygen demand
of the final treated wastewater discharged in
the year “y”
CODy,ww, treated 0.001192 Tonnes/m 3*
Average of successive monthly readings –
independent laboratory test results
Chemical oxygen demand removed by the treatment system “j” of the project activity equipped with
methane recovery in the year “y”
CODy,removed,j 0.049559 Tonnes/m 3*
Average of successive monthly readings –
independent laboratory test results
Chemical oxygen demand removed by the anaerobic
wastewater treatment system “i” in the baseline situation in the year “y”
CODy,removed,i 0.049559 Tonnes/m 3*
Average of successive monthly readings –
independent laboratory test results
Emissions from electricity or diesel consumption in
the year “y” PEy, power 0 tCO2e
In continuity with the baseline scenario, the project will not utilize grid-based electricity.
Since the majority of the electricity used by the facility is produced by the biomass-based boiler(s) for electricity
generation and only a negligible amount of
emissions are from the diesel consumption of the other
generator set(s), it is acceptable to assume that
these project emissions are negligible.
End use of final sludge Sf, enduse Sludge is land applied
Facility records. If sludge is land applied,
PEy,s,final = 0 & MEPy,s,treatment = 0
30 Malaysia Department of Environment publication Industrial Processes & the Environment (Handbook #3) Crude Palm Oil Industry, pp. 23 & 27; http://www.doe.gov.my/index.php?option=com_content&task=view&id=1493&Itemid=761&lang=en

PROJECT DESIGN DOCUMENT FORM (CDM-SSC-PDD) - Version 03 CDM – Executive Board
39
*COD values were measured and recorded in mg/l. The values were converted to tonnes/m3 as follows:
mg/L / 1,000,000 = tonnes/m3

PROJECT DESIGN DOCUMENT FORM (CDM-SSC-PDD) - Version 03 CDM – Executive Board
40
Annex 4
MONITORING INFORMATION
Monitoring: Monitoring activities will be conducted as specified by AMS III.H, Version 9: Methane recovery in wastewater treatment.31
In accordance with the methodology, this type of project (technology option (iv)) requires that “the calculation of emission reductions shall be based on the amount of methane recovered and fuelled or flared, that is monitored ex-post. Also for these cases, the project emissions and leakage will be deducted from the emission reductions calculated from the methane recovered and combusted, except where it can be demonstrated that the technology implemented does not increase the amount of methane produced per unit of COD removed (COD removed is the difference between the inflow COD (CODy,ww,untreated) and outflow COD (CODy,ww,treated)), compared with the technology used in the baseline.32”. The monitoring methodology involves monitoring of the following parameters after project implementation. All sampling and analysis equipment will be operated and calibrated to applicable standards in accordance with manufacturers’ specifications and recommendations. Training will be provided to operations personnel and documented to ensure proper use of monitoring equipment.
For determination of project emissions reductions:
• Total amount of biogas recovered, fuelled or flared will be monitored using in-line flow meters that automatically compensate for temperature and pressure. Readings from the flow meter will be continuously recorded on a data acquisition system and stored electronically in a database.
• The fraction of methane in the gas will be measured periodically at a 95% confidence level using a CH4 gas analyzer. Measurements from the gas analyser will be electronically recorded into a database.
• Chemical oxygen demand (COD) will be measured periodically by collecting samples from the digester influent and effluent (at the digester entrance and exit ports). Samples will be collected and analysed by an independent laboratory and results will be entered into a database.
• The end-use of final sludge exiting the biodigester will be monitored and documented to ensure proper disposition (i.e. soil application).
• The volume of the wastewater treated is determined by multiplying the FFB production by the conversion factor for FFB to POME. The data used to calculate this parameter will be verified with facility production records and periodic on-site monitoring. The conversion factor will be verified by a third party on an annual basis.
• Emissions from the consumption of electricity from the grid and/or fossil fuels will be monitored or calculated based on equipment specifications and / or actual fuel consumed based on fuel purchase records.
• Flare parameters are monitored as specified in the methodology.
For determination of flare efficiency:
31 UNFCCC methodology AMS-III.H (Methane recovery in wastewater treatment), V.9, http://cdm.unfccc.int/UserManagement/FileStorage/CDMWF_AM_743QMM1YKHH15AK2AZAVAIJHRGD5R7 32 UNFCCC methodology AMS-III.H (Methane recovery in wastewater treatment), V.9, http://cdm.unfccc.int/UserManagement/FileStorage/CDMWF_AM_743QMM1YKHH15AK2AZAVAIJHRGD5R7

PROJECT DESIGN DOCUMENT FORM (CDM-SSC-PDD) - Version 03 CDM – Executive Board
41
• Since a 90% default value (Paragraph 38, option (a) of AMS-III.H) will be used, continuous monitoring of compliance with the manufacturer’s specification of the flare device (temperature, biogas flow rate) will be performed. To accomplish this, a thermocouple will be installed on the flare. Measurements from the thermocouple will be electronically recorded into a database.
o If at any time the parameters are out of range of manufacturer specifications, a 50% default value will be used for that time period.
o If at any time the flare is not operational, a flare efficiency default value of 0% will be used for that time period. Not operational is defined as any one of the following:
The flare is not burning.
There is no record of the temperature of the exhaust gas of the flare.
The recorded temperature of the exhaust gas of the flare is less than 500oC.