clean development mechanism project design document form (cdm-pdd
TRANSCRIPT

PROJECT DESIGN DOCUMENT FORM (CDM PDD) - Version 03 CDM – Executive Board page 1
CLEAN DEVELOPMENT MECHANISM PROJECT DESIGN DOCUMENT FORM (CDM-PDD)
Version 03 - in effect as of: 28 July 2006
CONTENTS A. General description of project activity B. Application of a baseline and monitoring methodology C. Duration of the project activity / crediting period D. Environmental impacts E. Stakeholders’ comments
Annexes Annex 1: Contact information on participants in the project activity Annex 2: Information regarding public funding Annex 3: Baseline information
Annex 4: Monitoring plan

PROJECT DESIGN DOCUMENT FORM (CDM PDD) - Version 03 CDM – Executive Board page 2
SECTION A. General description of project activity A.1. Title of the project activity: Samancor Chrome Witbank Electricity from Waste Gas Version 02 Date: 20 July 2012
Version History Document version History PDD version 01, submitted 12 December 2011
Version submitted for Global Stakeholder Process
PDD version 02, submitted 20 July 2012
Revised version during validation
A.2. Description of the project activity: Definitions as provided in ACM0012 and how they apply to the project activity
Recipient facility. The facility that receives useful energy generated using waste energy under the project activity from the waste energy generation facility. It may be the same as the waste energy generation facility (Page 2/60, ACM0012, Version 04.0.0).
• The recipient facility is Samancor Witbank Ferrometals (FMT) which will receive electricity.
Waste Energy. Energy contained in a residual stream from industrial processes in the form of heat, chemical energy or pressure, for which it can be demonstrated that it would have been wasted in the absence of the project activity. Examples of waste energy include the energy contained in gases flared or released into the atmosphere, the heat or pressure from a residual stream not recovered (i.e. wasted) (Page 3/60, ACM0012, Version 04.0.0).
• The waste energy is in the form of waste gas flared in the baseline scenario, which is also the current scenario.
Waste Energy Carrying Medium (WECM). The medium carrying the waste energy in form of heat, chemical energy or pressure. Examples of WECM include gas, air or steam carrying waste energy (Page 3/60, ACM0012, Version 04.0.0).
• The WECM is waste gas produced in two closed furnaces at Samancor Witbank Ferrometals (FMT).
Waste energy generation facility (‘the project facility’). The facility where the waste energy, which is to be utilized by the CDM project activity, is available. The project activity can be implemented by the owner of the facility or by a third party (e.g. ESCO). If the waste energy is recovered by a third party in a separate facility, the ‘project facility’ will encompass both the waste energy generation facility and the waste energy recovery facility (Page 3/60, ACM0012, Version 04.0.0).
• The project activity is implemented by a third party, an independent power producer (IPP), Exxaro On-Site, in a separate power generation facility. Therefore, the ‘project facility’ includes

PROJECT DESIGN DOCUMENT FORM (CDM PDD) - Version 03 CDM – Executive Board page 3
(1)Samancor furnaces where the waste energy is produced and (2)the waste energy recovery plant and power generation plant owned and operated by Exxaro On-Site.
FMT is situated in Emalahleni (formerly called Witbank), Mpumalanga, and incorporates six charge chrome furnaces, (4 open furnaces, of which 3 are not in operation currently, and 2 closed furnaces), one metal recovery plant and an Intermediate Carbon Ferrochrome (IC3) converter. In addition, a Pelletizing and Sintering Plant (PSP) converts fine ore and UG2 (Upper Group 2 layer of the Rustenburg Layered Suite) into sintered pellets for use in furnaces F4, F5 and F6.
The plant was established in 1959. Fifty percent of Furnace 4, commissioned in 1973, is subject to a joint venture agreement between Samancor (50%), Posco (25%), and Samsun (25%), and Furnace 5, commissioned in 1975, is subject to a joint venture agreement between Samancor (51.%) and NSA Metals (49%).
Only the two closed furnaces, F4 and F5 have a combustible, CO-rich off-gas as by-product. This gas is treated in gas cleaning plants before being flared. The off-gas quality and quantity varies with production rate as well as with reductant types and feed ratios, and contains on average between 70% and 80% CO and 5% and 15% H2.
Because of the combustible and potentially explosive nature of the off-gas and high temperatures involved in the smelting process, strict safety precautions is followed during operations which include monitoring of oxygen levels in the gas and pressure and temperature fluctuations. When any of these parameters fall outside the control limits the furnace electrical input is immediately lowered or removed which reduce or stop the production of the off-gas1.
No process gas from the Witbank Ferro Metals plant is currently used for any (thermal or electrical) energy recovery operations, although a maximum of 6,800 Normal cubic meter per hour waste gas is used for heating five ladles and raw material (ore that goes into the furnace) preheating (Source: Appendix 22, Waste Gas Assessment Report).
1. Purpose of the project activity
Witbank Ferrometals (FMT)
The proposed project activity is an initiative to recover waste energy in the form of flared waste gas from two existing closed ferrochrome furnaces at FMT. The envisaged project will use the waste gas in 14 gas engines with a guaranteed maximum continuous rating (MCR) of 1.698 MW2 each. The project will generate an expected total of 23.77 MW (14 engines x 1.698, not accounting for parasitic load) of electricity if all fourteen engines are operating simultaneously at full load. The electricity will be used by FMT to replace electricity purchased from the national grid, which is managed by the national utility, Eskom.
The implementation of the project will have no impact on the existing production operations at the smelter.
The crediting period selected is a fixed 10 years and the amount of emission reductions that will be generated during the crediting period is estimated at 157,166 tons per annum.
1 Appendix 8 Technology Supplier information and specification document, page 3 and operational procedures 2 Appendix 6 Jenbacher Specification Sheet_620_F57, page 1

PROJECT DESIGN DOCUMENT FORM (CDM PDD) - Version 03 CDM – Executive Board page 4
No construction has started at the time that the validation was initiated of the project.
Expected start date of the project activity: 15 December 2012
Expected handover date after commissioning: 31 January 2014
Expected date that the crediting period will start (end of commissioning period): 15 February 2014
2. Scenario existing prior to the implementation of the project activity and Baseline scenario
The scenario existing prior to the implementation of the project activity and the baseline scenario is the same.
Current scenario and baseline for electricity
FMT currently purchases all the electricity needed for its production activities directly from Eskom, the national power utility. The electricity is delivered via the South Africa power grid.
Current scenario and baseline for waste gas
FMT: At present, the waste gas produced from the closed furnaces F4 and F5 is cleaned and conditioned in the gas cleaning plant before it is flared to atmosphere. Each furnace has its own dedicated gas cleaning plant and two dedicated flares, a clean gas stack and a raw gas stack. (Refer Figure 2)
When the gas cleaning plant is down for planned or unplanned maintenance, the gas is flared in the raw gas stack. No fossil fuel is used in the raw gas stack to support continuous flaring. There is a continuous pilot flame on the clean gas stack (not the raw gas stack) to ensure the off-gas is ignited.
Currently the following conditions apply for the FMT site:
− No waste gas is currently recovered for the generation of electricity3 at the site.
− No electricity generation equipment is installed on site that converts waste gas to electricity.
− By design, approximately 23% of the waste gas4 is diverted to five ladle heaters and two furnace feed pre-heaters where it is used for heating purposes. After the ladle heaters and the pre-heaters, the flue gas (exhaust gas) is vented to atmosphere (Note this is after combustion).
− By design, the balance of the waste gas produced in F4 and F5 is flared to atmosphere5.
National grid information for South Africa
The national utility, Eskom, is a government-owned entity and generates more than 95 per cent of the South Africa’s electricity6. Private generators produce approximately 3% of national electricity
3 Appendix 22, Waste gas Assessment Report 4 Appendix 11 Technical Feasibility Report for Witbank and Appendix 22 Waste Gas Assessment Report 5 The Atmospheric Pollution Prevention Act No 45 of 1965 requires that the waste gas be flared. The regulatory permit requires that FMT reports abnormal or emergency situations in which venting occurs. (Refer to Appendix 83A for Furnace 4 and 3B for Furnace 5). 6Appendix 33: Electricity Supply Industry of South Africa Report, page 6

PROJECT DESIGN DOCUMENT FORM (CDM PDD) - Version 03 CDM – Executive Board page 5
requirements and municipalities produce less than 1%. Approximately 90% of electricity in South Africa is derived from coal-fired power stations7.
FMT
Chromite ore consists of iron oxide and chromium oxide. In the production of ferrochrome, chromite ore is reduced in the presence of reductants in submerged arc furnaces according to the following reactions:
Cr2O3 + 3 C 2Cr +3CO(g)
FeO + C Fe + CO(g)
The metallic iron and chromium formed leaves the furnace as ferrochrome.
These reactions are endothermic, and the energy to drive them is supplied by the electricity to the furnace. Commonly used sources of reductants include coal, char, coke and anthracite. Coke gives rise to the formation of almost pure carbon monoxide (CO), while volatile hydrocarbons introduced through the addition of coal and anthracite gives rise to the formation of hydrogen.
In an open top furnace the combustible carbon monoxide and hydrogen gasses are oxidized, and no energy can be recovered. In closed top furnaces the waste gas is not oxidized and can therefore be recovered and utilised. Gas leaving the furnace is treated in a wet scrubber to cool the gas and remove particulates before it is flared.
FMT operates two closed top furnaces. Off-gas from the current furnaces is 15,359 normal cubic meters per hour per furnace8.
b) Project scenario
Project scenario for the electricity
Electricity generated from the project activity will be replacing electricity imported by FMT from the national utility (Eskom) via the national grid. Greenhouse gas emissions associated with the electricity generation in the national grid will be reduced as a result.
Project scenario for the waste gas
The waste gas currently flared at the site will be recovered, conditioned and diverted to internal combustion gas engines. Gas engines will generate electricity from the waste gas.
The primary new equipment components of the project activity include the following main equipment:
i. Internal combustion Gas Engines
The technology selected for the electricity generation is internal combustion gas engines supplied by GE Jenbacher – an Austrian-based subsidiary of General Electric.
ii. Fuel used in the gas Engines The engines are designed only to use waste gas and no other gas (for example natural gas) can be used as a backup without rebuilding the engines and applying major modifications to them. Therefore, no fuel except waste gas will be utilised in the engines.
7 Appendix 34: Electricity Generation Statistics in South Africa, http://www.geni.org/globalenergy/library/energy-issues/south africa/index_chart.html 8 Appendix 23 Technical Feasibility Report for Witbank, page 7 of 18

PROJECT DESIGN DOCUMENT FORM (CDM PDD) - Version 03 CDM – Executive Board page 6
iii. Gas Conditioning Equipment
The gas cleaning equipment will include a booster fan, drop separator, mixing tank, heat exchanges and a filter.
iv. Flare
One new flare will be installed near the proposed power plant to absorb waste gas flow fluctuations.
A comprehensive list of all the new equipment is provided in Appendix 10_FMT Equipment list.
v. v. Backup equipment
No backup electricity generation equipment will be installed as part of the project in the case that the proposed power plant experiences outages or abnormal conditions. Also, the engines are not designed to run on fuels other than the waste gas (refer to Appendix 50_Jenbacher confirmation letter regarding fuel type). Therefore, no fossil fuel will be used for backup purposes of any kind in the power plant to generate electricity.
3. Sustainable Development
The project will contribute to sustainable development in South Africa in the following ways:
Environment Benefits
The project will displace some coal-dominated power generation in South Africa with power generated from waste gas, thereby reducing the carbon footprint of South Africa.
Social Benefits at Witbank
The proposed development also represents an investment in waste energy to power generation, which, given the challenges created by climate change, represents positive social benefit for society as a whole.
The key social issues associated with the construction phase include the creation of employment and the opportunity for skills development and training. The construction phase will employ approximately 100 people over the construction period. The proposed power plant will employ approximately 15 full time employees and, as such, will create potential employment opportunities in the province9. However, given that the industry is relatively new it may be necessary to initially import the required operational and maintenance skills from overseas. However, it will be possible to increase the number of local employment opportunities through the implementation of a skills development programme linked to the operational phase.
Economic Benefits
Given the highly technical nature of the power plant, the opportunity for South African production and local content is likely to increase over time, however will be lower for the first number of waste energy to power projects. Local economies in the Witbank area are likely to benefit where already established industries can be utilised by the project, such as civil engineering skills, construction skills and low
9 Appendix 35 Report Number 408836, Draft Scoping Report for the proposed development of an Energy Recovery Plant at the Samancor Chrome Ferrometals Plant, Ferrobank, December 2011, page 35

PROJECT DESIGN DOCUMENT FORM (CDM PDD) - Version 03 CDM – Executive Board page 7
skilled labour, however for the equipment manufacture industry, this is likely to be introduced and increased over time.
Technology Transfer There will be a transfer of technology from a developed country to a developing country. The internal combustion engines that are used to generate the electricity will be sourced from GE Jenbacher in Austria (Annex-1 country) and will be imported to South Africa. The proposed project activity will contribute to technology transfer to the host country South Africa, since it utilises Jenbacher technology. Jenbacher is a well established Austrian company and the technology has been implemented in a number of developed countries. A.3. Project participants:
Name of Party involved (*) ((host) indicates a host Party)
Private and/or public entity(ies) project participants (*) (as applicable)
Kindly indicate if the Party involved
wishes to be considered as
project participant (Yes/No)
Host Party
South Africa
Exxaro on-Site No
Samancor Ferrometals (FMT)
FMT is situated in Emalahleni (formerly called Witbank), Mpumalanga, and operates six charge chrome furnaces, (4 open, of which 3 is shut down, and 2 closed). The plant was established in 1959 and is currently the largest charge chrome producing site in the world with an expected life in excess of 25 years10. Exxaro On-Site Exxaro On-Site is a joint venture between Exxaro Resources Ltd and Prana Energy (Pty) Ltd with the purpose of developing and operating on-site power generation facilities. The JV company is called “Exxaro On-Site” and Exxaro controls the JV with 51% of the shareholding. Exxaro On-Site’s business model is to primarily Build, Own and Operate the power generation facilities. A.4. Technical description of the project activity: A.4.1. Location of the project activity: A.4.1.1. Host Party(ies): 10Appendix 12_Samancor Website downloaded on 19 December 2011: http://www.samancorcr.com/content.asp?subID=8

PROJECT DESIGN DOCUMENT FORM (CDM PDD) - Version 03 CDM – Executive Board page 8
South Africa A.4.1.2. Region/State/Province etc.: The project is located in the Mpumalanga province. A.4.1.3. City/Town/Community etc.: The project is located near the town of Emalahleni (formerly known as Witbank). A.4.1.4. Details of physical location, including information allowing the unique identification of this project activity (maximum one page): The Ferrometals plant site is located within the Ferrobank industrial area of Emalahleni, to the east of Moses Kotane Drive, north of the N4 highway. The current developed portion of the plant site covers about 165 ha. The two main roads in the vicinity of the site are the R544 (to the north) and the R104 (to the south).
GPS coordinates for the site (the point between Furnace 4 and Furnace 5):
25°51'26.32"S 29°10'16.87"E

PROJECT DESIGN DOCUMENT FORM (CDM PDD) - Version 03 CDM – Executive Board page 9
Figure 1: Location of FMT
A.4.2. Category(ies) of project activity: Sectoral scope 01: Energy industries (renewable-/non-renewable sources) Sectoral scope 04: Manufacturing industries A.4.3. Technology to be employed by the project activity: A.4.3.1 Description of the environmentally safe and sound technology and knowledge that is transferred to South Africa.
There will be a transfer of technology from a developed country (Austria) to a developing country (South Africa). The internal combustion engines that are used to generate the electricity will be sourced from GE

PROJECT DESIGN DOCUMENT FORM (CDM PDD) - Version 03 CDM – Executive Board page 10
Jenbacher in Austria (Annex-1 country) and will be imported to South Africa. The technology is mature technology that is applied extensively internationally, although not in the ferrochrome industry. A.4.3.2 Purpose of the project activity
Exxaro on-Site (Pty) Ltd is to develop an electricity generation project with a maximum capacity of 20.4 MWe utilizing furnace waste gas generated at FMT in two closed submerged arc alternating current (AC) furnaces (F4 and F5).
The electricity generated on site will displace a maximum 23.77 MWe (i.e. 14engines x 1.698 MWe11) of the electricity imported from the South African national grid.
In the case of this project activity, the existing scenario and the baseline scenario is the same. A.4.3.3 The scenario existing prior to the start of the implementation of the project activity, with a list of the equipment and systems in operation FMT
The two closed furnaces F4 and F5 generate waste gas that is designed12 to be flare to atmosphere as part of the business-as-usual production process since 1973 for F4 and 1975 for F5. By design, approximately 77% of the waste gas produced by F4 and F5 is designed to be flared and the remainder 23% is designed for heating purposes in the raw material pre-heaters and ladle heaters13. This gas typically contains 70 to 80% CO and 5 to 15% H2 by volume, which is to be utilised as a gas fuel source for the project activity.
Waste off-gas from F4 and F5 is flared after passing through a gas cleaning system for each furnace. At no time is furnace gas vented to the atmosphere unburnt. The air pollution permit requires that all venting incidents be recorded and reported to the Department of Environment.
The existing equipment that is relevant to the project activity includes the following:
1. Two closed alternating current arc furnaces (F4 and F5) – where the waste gas is produced 2. Gas cleaning equipment for each furnace – where the waste gas is cooled and cleaned before
being flared and released to atmosphere 3. Two flares for each furnace
a. One flare (main flare) is used during normal operations b. Raw gas flare (emergency flare) is used only when the gas cleaning plant is not in
operation 4. The preheaters and ladle heaters where waste gas is used for heating purposes (Refer to the figure
below). The Figure 2 below provides a layout of the gas reticulation system.
11 Appendix 6 Jenbacher Specification Sheet_620_F57.pdf 12 Appendix 36 for the design P&IDs for the furnaces 13 Appendix 8, page 5 gives the design figures and Appendix 22 gives the energy balance and results based on one year historic data..

PROJECT DESIGN DOCUMENT FORM (CDM PDD) - Version 03 CDM – Executive Board page 11
Figure 2: Existing waste gas reticulation system for F4 and F5 furnaces at FMT
Existing Closed submerged arc AC furnaces F4 and F5 at FMT
F450 MW
Closed Furnace Venturiscrubber
Slag, FeCr
Reductant, Flux, Ore
Methane rich gas ignitor
Preheater
Emergencyflare
CO off‐gas during abnormalconditions
F550 MW
Closed Furnace Venturiscrubber
Electricity
Slag, FeCr
Methane Rich gas ignitorPreheater
Ladle heaters
Ladle heatersEmergencyflare
Reductant, Flux, Ore
Ladle heater
Main flare
Main flare
Methane Rich gas
Electricity
CO off‐gas
CO off‐gas
CO off‐gas during abnormalconditions
Furnaces F4 and F5 Design Information Table 1: Equipment information for the current scenario at FMT
Parameter Description i. Age and average
lifetime of the furnaces based on manufacturer’s specifications
-F4 was commissioned in 1973 -F5 was commissioned in 1975 - Report provided by furnace expert company GLPS to confirm that the lifetime of the furnaces F4 and F5 and the gas cleaning equipment is in excess of 20 years. 14
ii. Existing and forecast installed capacities for
The design specifications for F4 and F5 are exactly the same: Furnace design specifications15 are provided by the technology supplier
14Appendix 9 Lifetime of equipment – GLPS report 15 Detailed Specifications for the furnaces are confidential and will be submitted to the validator only

PROJECT DESIGN DOCUMENT FORM (CDM PDD) - Version 03 CDM – Executive Board page 12
Parameter Description the existing two furnaces
(GLPS)16. Capacity: 50 MW Production Output: 120,000 tons/year Electricity consumption: 3.5 MWh/ton Design Availability: 98% Design Utilisation: 97 % Gas Cleaning equipment: Venturi Scrubber (Refer to Appendix 83A_FMT_Furnace 4 - Air Pollution Prevention Act Licence Conditions, page 4 and Appendix 83B_FMT_Furnace 5 - Air Pollution Prevention Act Licence Conditions, page 4).
iii. The monitoring equipment and their location in the system
Existing meters and analysers that are installed on the existing furnace and off-gas system:
- Gas composition of the off-gas (CO and H2) is measured with two analysers17.
iv. The types and levels of services (normally in terms of mass or energy flows) provided by the systems and equipment that are being installed under the project activity and their relation, if any, to other manufacturing/production equipment and systems outside the project boundary.
- The type of service delivered by the project activity is electricity.
The level of service (Actual Power dispatched i.e. power generated minus parasitic losses) is 159,075
- MWh (refer to the financial model, Sheet: Inputs_Production, Cell F169).
- Equipment required in the waste gas recovery plant will include: internal combustion engines (14 General Electric Jenbachers gas engines (GEJs)) with closed circuit radiators and exhaust silencers, CO fans, a flare, flame arrestors, gas filters, gas coolers, instrumentation and control equipment, piping to route the off-gas to the engines, a control room, ablution facilities and offices
- There is no relation between the type and level of service or the equipment installed with other manufacturing or production processes outside the project boundary.
v. Explain how the same types and levels of services provided by the project activity would have been provided in the baseline scenario.
The 159,075 MWh electricity will be provided by Eskom via the national grid in the baseline scenario.
A.4.3.4 The scope of measures that are being implemented within the project activity, with a list of the
16 Appendix 8 Technology Supplier information and specification document 17 Appendix 45 P&ID showing the analysers installed on the waste gas system

PROJECT DESIGN DOCUMENT FORM (CDM PDD) - Version 03 CDM – Executive Board page 13
equipment and systems that will be installed Figure 3 provides a layout of the proposed power generation system. Figure 3: Proposed new waste gas power plant at FMT
Description of the new power plant at FMT Waste gas from F4 and F5 furnaces will be directed into the proposed new waste gas recovery plant to generate electricity. Equipment required in the waste gas recovery plant will include: internal combustion engines with closed circuit radiators and exhaust silencers, CO fans, a flare, flame arrestors, gas filters, gas coolers, instrumentation and control equipment, piping to route the off-gas to the engines, a control room, ablution facilities and offices. Refer to Appendix 10_FMT Equipment list for a comprehensive list of new equipment that will be implemented in the project activity. The main equipment is the following:
1. Internal combustion engines
The electricity will be generated using between 14 new GE Jenbacher internal combustion gas engines. The internal combustion gas engines are spark ignition engines operating on the same principles as
!"#
$%#&'#
()*+,-#
.,/0123#
+42155,2#6*7,2#
8)9:;#!,(2#
<,-1409/0;#!)1=;#>2,#
&<#:9+#3:/30*2#
62,?,90,2#
@A,2:,/4B#
C92,#
(>#*DE:9+#
!"#$%&'$()*%+,%&'-+.'/!'0(+1-.%$'
234'5-$6%'71%+,8'9#:%+';%1%+-<#1'9"-16'
!"#
$%#&'#
()*+,-#.,/0123#
+42155,2#6*7,2#
8)9:;##!,(2#
&<#:9+#3:/30*2#
62,?,90,2#
(>#*DE:9+#
F9-),#?02+#
F9-),#?02+#
@A,2:,/4B#
C92,#
<,-1409/0;#!)1=;#>2,#
!G# F9-),#?,90,2#
&93/#C92,#
&93/#C92,#
&<#:9+#
&3=3/:#09/H#
I9+#
(*/-3J*/3/:#
K)9/0#
L"#M,/594?,2##:9+#,/:3/,+#NOPQ#&'#
809/-E5B#C92,#
=%:'>#:%+'>"-16'
R?,3+,/#S3+3/0,:290*2#
LL#H.#+15E#
+09J*/#
LLH.T"%%.# LL#H.#
!&R#OO#
H.#+15#
+09J*/#
OO#H.#
LL#H.#6929+3J4##K*7,2#
#0*#K)9/0#
"%%#.#
LLH.TOOH.#029/+U*2A,2#
V3E-32,4J*/9)#K*7,2#A,9+12,A,/0#
PROJECT DESIGN DOCUMENT FORM (CDM PDD) - Version 03 CDM – Executive Board page 14
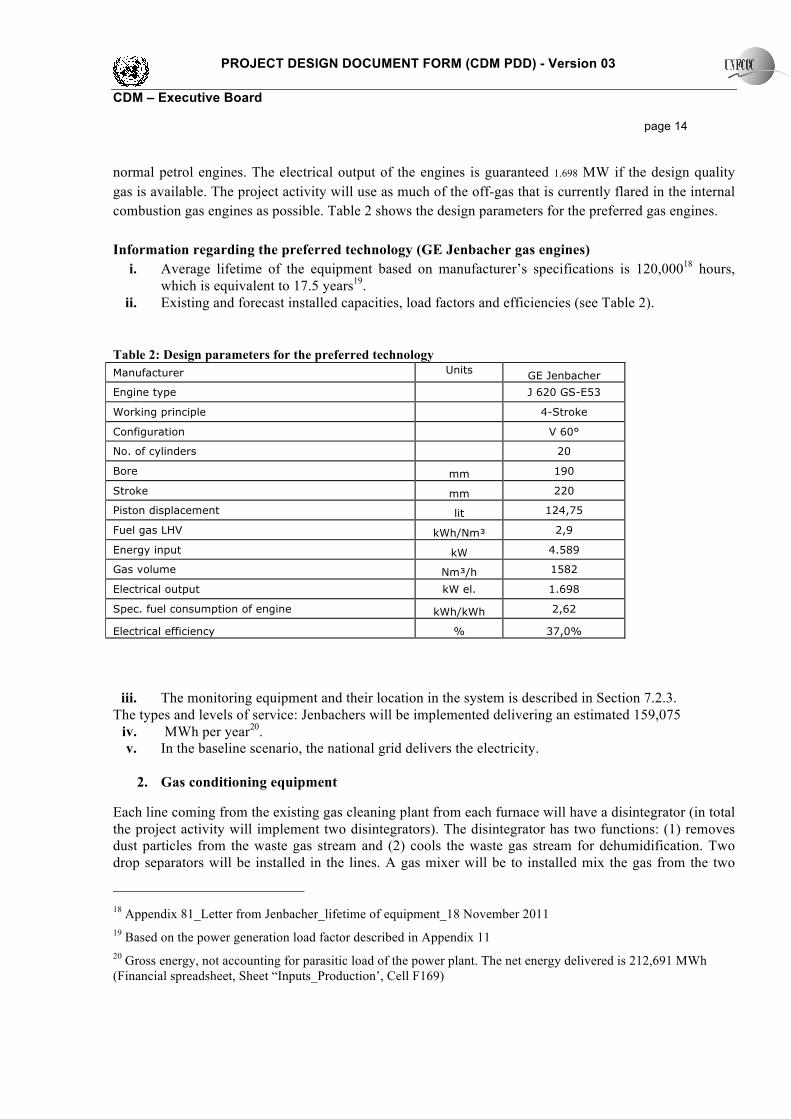
normal petrol engines. The electrical output of the engines is guaranteed 1.698 MW if the design quality gas is available. The project activity will use as much of the off-gas that is currently flared in the internal combustion gas engines as possible. Table 2 shows the design parameters for the preferred gas engines. Information regarding the preferred technology (GE Jenbacher gas engines)
i. Average lifetime of the equipment based on manufacturer’s specifications is 120,00018 hours, which is equivalent to 17.5 years19.
ii. Existing and forecast installed capacities, load factors and efficiencies (see Table 2). Table 2: Design parameters for the preferred technology Manufacturer Units GE Jenbacher Engine type J 620 GS-E53
Working principle 4-Stroke
Configuration V 60°
No. of cylinders 20
Bore mm 190
Stroke mm 220
Piston displacement lit 124,75
Fuel gas LHV kWh/Nm³ 2,9
Energy input kW 4.589
Gas volume Nm³/h 1582
Electrical output kW el. 1.698
Spec. fuel consumption of engine kWh/kWh 2,62
Electrical efficiency % 37,0%
iii. The monitoring equipment and their location in the system is described in Section 7.2.3. The types and levels of service: Jenbachers will be implemented delivering an estimated 159,075
iv. MWh per year20. v. In the baseline scenario, the national grid delivers the electricity.
2. Gas conditioning equipment
Each line coming from the existing gas cleaning plant from each furnace will have a disintegrator (in total the project activity will implement two disintegrators). The disintegrator has two functions: (1) removes dust particles from the waste gas stream and (2) cools the waste gas stream for dehumidification. Two drop separators will be installed in the lines. A gas mixer will be to installed mix the gas from the two
18 Appendix 81_Letter from Jenbacher_lifetime of equipment_18 November 2011 19 Based on the power generation load factor described in Appendix 11 20 Gross energy, not accounting for parasitic load of the power plant. The net energy delivered is 212,691 MWh (Financial spreadsheet, Sheet “Inputs_Production’, Cell F169)

PROJECT DESIGN DOCUMENT FORM (CDM PDD) - Version 03 CDM – Executive Board page 15
furnaces and to act as a pressure buffer before the Jenbacher engines. Refer to Appendix 10_FMT Equipment list for a list of gas cleaning plant equipment.
3. The estimated load factor for the power generation system
The load factor (also called the capacity factor) for the power generation system is determined by multiplying the following figures: gas availability (%) x scheduled engine downtime (%) x furnace utilization. Per definition, furnace utilization is the design continuous furnace operating load over the design maximum load. Furnace availability is the design uptime of the furnaces including planned shuts. The power system design load factor is described in Appendix 11, pages 7,8 and 10. The determination of the parasitic load for the power plant is shown in Appendix 7_Parasitic load - Project Electrical Load List. A.4.3.5 The baseline scenario with an indicative list of the equipment and systems that would have been in place in the absence of the project activity. In the case of this project activity, the existing scenario and the baseline scenario is the same, so the information for the baseline scenario is provided under A.4.3.3.
A.4.4. Estimated amount of emission reductions over the chosen crediting period:
Year Annual estimation of emission reductions in tonnes of CO2e
1 157,166
2 157,166
3 157,166
4 157,166
5 157,166
6 157,166
7 157,166
8 157,166
9 157,166
10 157,166
Total estimated reductions (tonnes of CO2e) 1,571,660
Total number of crediting years 10
Annual average over the crediting period of estimated reductions (tonnes of CO2e)
157,166

PROJECT DESIGN DOCUMENT FORM (CDM PDD) - Version 03 CDM – Executive Board page 16
A.4.5. Public funding of the project activity: No public funding has been used in the development of this project and no public funding will be used in its implementation. Official Development Assistance (ODA) has not and will not be used in the development and implementation of this project. SECTION B. Application of a baseline and monitoring methodology B.1. Title and reference of the approved baseline and monitoring methodology applied to the project activity: 1. Approved consolidated baseline and monitoring methodology ACM0012 “Consolidated baseline
methodology for GHG emission reductions from waste energy recovery projects”, Version 4.0.0.
This methodology also refers to the latest approved versions of the following tools:
2. “Tool to calculate the emission factor for an electricity system”, Version 02.2.1;
3. “Tool for the demonstration and assessment of additionality”, Version 06;
4. “Tool to determine the remaining lifetime of equipment”, Version 01; B.2. Justification of the choice of the methodology and why it is applicable to the project activity: The following table summarises the applicability criteria for projects using ACM0012. Applicability criteria from the various Tools that are applied in the project activity are also provided. This project activity meets all of the criteria – this is justified in the table below. The consolidated methodology is applicable to project activities implemented in an existing facility converting waste energy carried in identified WECM stream(s) into useful energy. In this project activity, the WECM is waste gas produced in existing ferrochrome furnaces.

PROJECT DESIGN DOCUMENT FORM (CDM PDD) - Version 03 CDM – Executive Board page 17
Table 3: Discussion and demonstration that the proposed project activity complies with Applicability Criteria defined in ACM0012
Applicability Condition from ACM0012 Comment on whether the Applicability Criteria applies
to the project activity. If it applies, a discussion is provided to demonstrate how the project activity
complies with the criteria.
Summary of Applicability of
the project activity to the
criteria
The WECM stream may be an energy source for:
• Generation of electricity; • Cogeneration; • Direct use as process heat source; • Generation of heat in element process; • Generation of mechanical energy; or • Supply of heat of reaction with or without process heating.
The waste gas will be utilised for the generation of electricity only. Reference documentation: The Technical Feasibility study and the Environmental Impact Assessment confirms that the scope of the project activity is the generation of electricity only and this is again supported by the cost analysis of the project activity, equipment list etc. (Refer to the following Appendixes as supporting documents:
• Appendix 10_FMT Equipment list that demonstrates that only electricity generation equipment is included in the project activity
• Appendix 11_Technical Feasibility Study Report_TWP for FMT_June 2012, describing the scope of the project activity as being the generation of electricity only from the waste gas available from Furnaces 4 and 5.
• Appendix 35_Draft Scoping report Samancor FMT Plant_December 2011.
Project activity complies with the criteria.
In the absence of the project activity, the WECM stream:
a) Would not be recovered and therefore would be flared, released to atmosphere, or remain unutilized in the absence of the project activity at the existing or Greenfield project facility; or
b) Would be partially recovered, and the unrecovered portion of
In the case of this project activity, condition (a) applies, it is in the absence of the project activity, the waste gas would not be recovered and would be flared and remain unutilized. The waste gas is currently flared.
Project activity complies with the criteria.

PROJECT DESIGN DOCUMENT FORM (CDM PDD) - Version 03 CDM – Executive Board page 18
Applicability Condition from ACM0012 Comment on whether the Applicability Criteria applies
to the project activity. If it applies, a discussion is provided to demonstrate how the project activity
complies with the criteria.
Summary of Applicability of
the project activity to the
criteria WECM stream would be flared, vented or remained unutilised at the existing or Greenfield project facility.
Reference material: 1. Technical Safety Design of the existing ferrochrome facility:
• The waste gas has to be flared and cannot be vented to atmosphere without combustion due to safety reasons. Carbon monoxide is a very poisonous gas, colourless, odourless and tasteless. CO creates an explosive gas mixture with air at a content of 12-75 %. Ignition takes place even with a very small energy spark, < 1 mJ, like the static electricity felt by man (refer to Appendix 221, page 75, last paragraph). Because of this explosive nature of the gas, it has to be combusted before it goes into atmosphere.
• To comply with safety regulations, the working environment in the industrial facility is equipped with a CO-alarm system to detect any possible CO leakages. Two different alarm limits are normally used, which give an alarm both locally and to the control rooms. In addition, personal portable meters are used by all employees, in which the normal alarm limit is 50 ppm.
21 Appendix 82: FORMATION, CHARACTERISTICS AND UTILISATION OF COGAS FORMED IN FERROCHROMIUM SMELTING, Proceedings: Tenth International Ferroalloys Congress; 1 ñ 4 February 2004, INFACON X: “Transformation through Technology” Cape Town, South Africa, ISBN: 0-9584663-5-1, P. Niemelä, H. Krogerus and P. Oikarinen

PROJECT DESIGN DOCUMENT FORM (CDM PDD) - Version 03 CDM – Executive Board page 19
Applicability Condition from ACM0012 Comment on whether the Applicability Criteria applies
to the project activity. If it applies, a discussion is provided to demonstrate how the project activity
complies with the criteria.
Summary of Applicability of
the project activity to the
criteria 2. The Atmospheric Pollution Prevention Act No 45 of 1965 requires that the waste gas be flared. The regulatory permit requires that FMT reports abnormal or emergency situations in which venting of un-combusted waste gas occurs. Refer to: • Appendix 83A_Furnace 4, Air Pollution Prevention Act
Licence Conditions 2010, page 4, Section 4.5 and 4.5; and
• Appendix 83B_Furnace 5, Air Pollution Prevention Act Licence Conditions 2010, page 4, Section 4.5 and 4, page 4; and
• Appendix 84_Air Quality Annual Report 2011_Ferrometals, page 17 of 19 shows where FMT reported venting incidents to the Department of Environment as abnormal incidents page 17.
3. An independent expert assessment was conducted by furnace and gas cleaning equipment expert, GLPS (Refer to Appendix 22_Waste gas assessment report_FMT_GLPS). The report confirms that the waste gas that will be used to generate electricity in the project activity is currently flared and that it is not used for any other purpose in the industrial facility.

PROJECT DESIGN DOCUMENT FORM (CDM PDD) - Version 03 CDM – Executive Board page 20
Applicability Condition from ACM0012 Comment on whether the Applicability Criteria applies
to the project activity. If it applies, a discussion is provided to demonstrate how the project activity
complies with the criteria.
Summary of Applicability of
the project activity to the
criteria The expert report contains to, inter alia, (1) an assessment of energy bills and financial statements to demonstrate that all the energy required for the process has been procured commercially and (2) P&IDs (Technical design drawings of the plant) confirms that the waste gas was designed for flaring. 4.The supplementary validator site visit confirmed that no waste gas recovery equipment is installed on the site and that the waste gas is flared. 5. A declaration by the Samancor Ltd Financial manager that the waste energy is not exported. (Refer to Appendix 55_Confirmation letter from Financial Manager_FMT)
Project activities improving the WECM recovery may:
(i) capture and utilise a larger quantity of WECM stream as compared to the historical situation in existing facility, or capture and utilise a larger quantity of WECM stream as compared to a “reference waste energy generating facility”; and/or
(ii) apply more energy efficient equipment to replace/modify/expand waste energy recovery equipment, or implement a more energy efficient equipment than the “reference waste energy generating facility”.
(i) Currently, no waste gas is recovered for the purpose of
generating electricity. The proposed project activity will improve the waste gas recovery, i.e. the project activity captures and utilises a larger quantity of waste gas stream as compared to the historical situation in existing facility.
(ii)The project activity does not replace, modify or expand any waste energy recovery equipment and it does not implement more energy efficient equipment, therefore condition (ii) does not apply to the proposed project activity. Refer to the following documentation:
Project activity complies with the criteria.

PROJECT DESIGN DOCUMENT FORM (CDM PDD) - Version 03 CDM – Executive Board page 21
Applicability Condition from ACM0012 Comment on whether the Applicability Criteria applies
to the project activity. If it applies, a discussion is provided to demonstrate how the project activity
complies with the criteria.
Summary of Applicability of
the project activity to the
criteria • Appendix 10_FMT Equipment list that provides the
equipment that will be installed in the project activity. All equipment is new and part of the new power plant.
• Appendix 11_Technical Feasibility Study Report_TWP for FMT_June 2012 confirms the scope of the project activity as being the utilization of waste gas (currently flared) for the generation of electricity.
• Appendix 35_Draft Scoping report Samancor FMT Plant_December 2011 confirms the scope of the project activity as being the utilization of waste gas (currently flared) for the generation of electricity.
The methodology is applicable under the following conditions:
• For project activities which recover waste pressure, the methodology is applicable where waste pressure is used to generate electricity only and the electricity generated from waste pressure is measurable;
This applicability condition does not apply as the project activity is not recovering waste pressure.
Not applicable to the project activity
• Regulations do not require the project facility to recover and/or utilize the waste energy prior to the implementation of the project activity;
There are no regulations in South Africa that require FMT to recover and/or utilize the waste gas prior to the implementation of the project activity.
Please see National Environment Management: Appendix 38: National Environment Management: Air Quality Act 39 of
Project activity complies with the criteria.

PROJECT DESIGN DOCUMENT FORM (CDM PDD) - Version 03 CDM – Executive Board page 22
Applicability Condition from ACM0012 Comment on whether the Applicability Criteria applies
to the project activity. If it applies, a discussion is provided to demonstrate how the project activity
complies with the criteria.
Summary of Applicability of
the project activity to the
criteria 200422.
The methodology is applicable to both Greenfield and existing waste energy generation facilities. If the production capacity of the project facility is expanded as a result of the project activity, the added production capacity must be treated as a Greenfield facility;
• The proposed project activity will be implemented at an existing industrial facility.
• The production capacity of the furnaces that produce ferrochrome is NOT expanded as a result of the project activity.
− The scope of the project activity does not include any
modification to the existing furnaces (refer to the Technical Feasibility Study in Appendix 22 to confirm the scope of the project activity). The scope of the project is to utilise the waste gas produced in the furnaces after it has gone through the gas handling plant and therefore the project activity has no direct or indirect impact on the furnace operation or capacity.
− The EIA confirms that the scope of the project activity is only to utilise the waste gas from the furnaces in a new waste gas to electricity power plant. The scope does not include any modification to Furnaces F4 and F5. Refer to Appendix 35 (Draft Scoping report_EIA, page iv).
Project activity complies with the criteria.
Waste energy that is released under abnormal operation (for example, emergencies, shut down) of the project facility shall not be included in
Abnormal and upset conditions at the power plant will be as a result of fluctuations in off gas quality (composition and
Project activity complies with the
22 http://www.environment.gov.za/PolLeg/Legislation/2006Jan10/NEM_Air_Quality_Management_Act_(Act39_0f_2004).pdf

PROJECT DESIGN DOCUMENT FORM (CDM PDD) - Version 03 CDM – Executive Board page 23
Applicability Condition from ACM0012 Comment on whether the Applicability Criteria applies
to the project activity. If it applies, a discussion is provided to demonstrate how the project activity
complies with the criteria.
Summary of Applicability of
the project activity to the
criteria the emission reduction calculations. temperature) or quantity (pressure). Fluctuations in these
parameters always involve the de-loading or stopping of engines due to the automated engine protection systems that are part of the plant design and will thus result in a reduction or stoppage of electricity generation. Other protection systems that will also stop or de-load the engines are engine room temperature control, cooling water temperature control and the fire detection system. During abnormal conditions the waste gas is flared through the stack as is done in the current scenario. The waste gas will not be routed to the engines during these conditions as the engines will be de-loaded or stopped and therefore electricity will not be produced during abnormal conditions and emissions reductions will not be claimed.
criteria.
If multiple waste gas streams are available in the project facility and can be used interchangeably for various applications as part of the energy sources in the facility, the recovery of any waste gas stream, which would be totally or partially recovered in the absence of the project activity, shall not be reduced due to the implementation of CDM project activity. For such situations, the guidance provided in Annex 3 shall be followed.
FMT: There are only two waste gas streams available for recovery in the FMT process, i.e. waste gas from F4 and F5. By design, about 23% of this waste gas energy23 is used for preheating of raw material and heating of product ladles. The guidance in Annex 3 of ACM0012 is applied to provide evidence that the recovery of the waste gas for heat purposes does not reduce as a result of the implementation of the project activity. This is provided for in the Monitoring Plan in Annex 4.
Project activity complies with the criteria.
23 Appendix 8 Technology Supplier information and specification document
PROJECT DESIGN DOCUMENT FORM (CDM PDD) - Version 03 CDM – Executive Board page 24
Applicability Condition from ACM0012 Comment on whether the Applicability Criteria applies
to the project activity. If it applies, a discussion is provided to demonstrate how the project activity
complies with the criteria.
Summary of Applicability of
the project activity to the
criteria
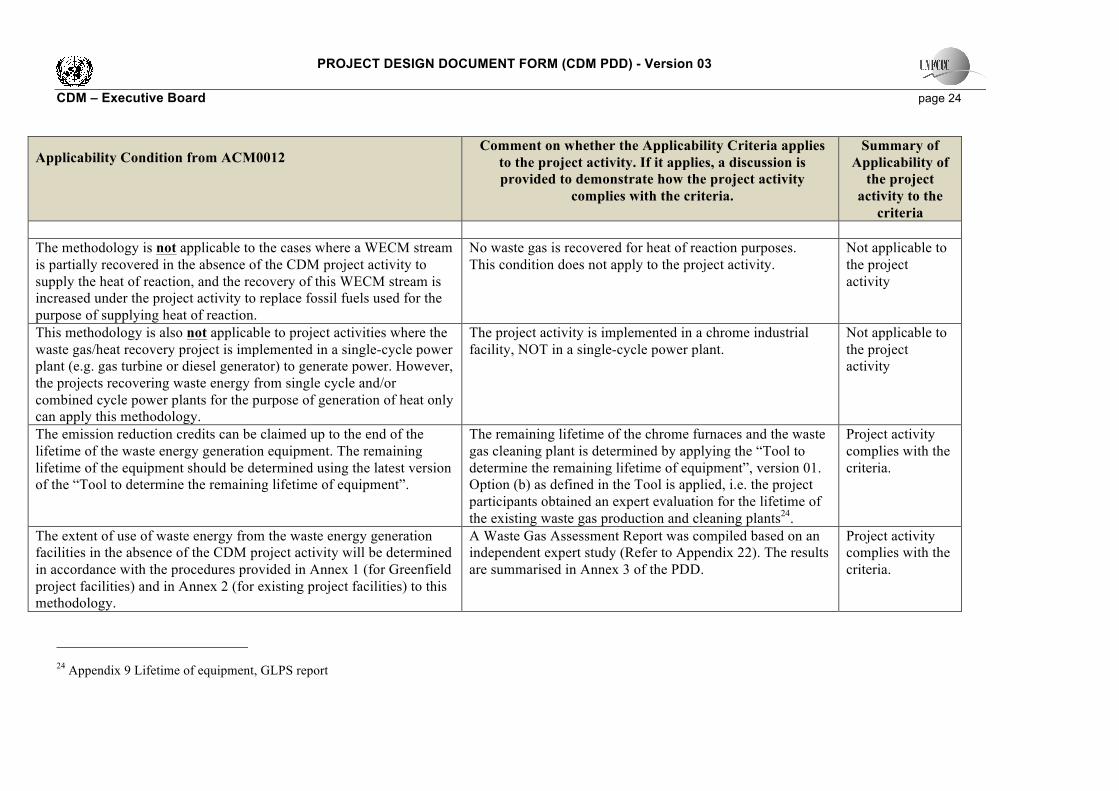
The methodology is not applicable to the cases where a WECM stream is partially recovered in the absence of the CDM project activity to supply the heat of reaction, and the recovery of this WECM stream is increased under the project activity to replace fossil fuels used for the purpose of supplying heat of reaction.
No waste gas is recovered for heat of reaction purposes. This condition does not apply to the project activity.
Not applicable to the project activity
This methodology is also not applicable to project activities where the waste gas/heat recovery project is implemented in a single-cycle power plant (e.g. gas turbine or diesel generator) to generate power. However, the projects recovering waste energy from single cycle and/or combined cycle power plants for the purpose of generation of heat only can apply this methodology.
The project activity is implemented in a chrome industrial facility, NOT in a single-cycle power plant.
Not applicable to the project activity
The emission reduction credits can be claimed up to the end of the lifetime of the waste energy generation equipment. The remaining lifetime of the equipment should be determined using the latest version of the “Tool to determine the remaining lifetime of equipment”.
The remaining lifetime of the chrome furnaces and the waste gas cleaning plant is determined by applying the “Tool to determine the remaining lifetime of equipment”, version 01. Option (b) as defined in the Tool is applied, i.e. the project participants obtained an expert evaluation for the lifetime of the existing waste gas production and cleaning plants24.
Project activity complies with the criteria.
The extent of use of waste energy from the waste energy generation facilities in the absence of the CDM project activity will be determined in accordance with the procedures provided in Annex 1 (for Greenfield project facilities) and in Annex 2 (for existing project facilities) to this methodology.
A Waste Gas Assessment Report was compiled based on an independent expert study (Refer to Appendix 22). The results are summarised in Annex 3 of the PDD.
Project activity complies with the criteria.
24 Appendix 9 Lifetime of equipment, GLPS report

PROJECT DESIGN DOCUMENT FORM (CDM PDD) - Version 03 CDM – Executive Board page 25
Table 4: Applicability conditions defined by the Tools applied in the PDD
Applicability Condition from the Tools that are applied in the PDD Discussion of how the criteria applies to the project activity and how the project activity complies with the requirement
Applicability
“Tool to calculate the emission factor for an electricity system”, Version 02.2.1
- This tool may be applied to estimate the OM, BM and/or CM when calculating baseline emissions for a project activity that substitutes grid electricity, i.e. where a project activity supplies electricity to a grid or a project activity that results in savings of electricity that would have been provided by the grid (e.g. demand-side energy efficiency projects). (Refer to page 2 of the Tool under “Scope and applicability”)
The project activity substitutes grid electricity. Project activity complies with the criteria.
In case of CDM projects the tool is not applicable if the project electricity system is located partially or totally in an Annex I country. (Refer to page 2 of the Tool under “Scope and applicability”)
The project electricity system is located in South Africa, which is not an Annex I country. Also, none of the neighboring countries around South Africa are Annex I countries.
Project activity complies with the criteria.
“Tool to determine the remaining lifetime of equipment”, Version 01
Methodologies referring to this tool should clearly specify for which equipment the remaining lifetime should be determined. The remaining lifetime of relevant equipment shall be determined prior to the implementation of the project activity. Project participants using this tool shall document transparently in the CDM-PDD how the remaining lifetime of applicable equipment has been determined, including (references to) all documentation used. (Source: Page 1 of the Tool)
- This criteria applies to methodologies and not to PDDs. - The remaining lifetime of the existing furnaces and waste gas cleaning equipment have been confirmed by an independent expert GLPS, prior to implementation of the project activity. The evaluation report was received in July 2012 (Appendix 9) and the handover after commissioning of the project activity is expected to be in 2014 only.
Does not apply to the project activity Project activity complies with the criteria.

PROJECT DESIGN DOCUMENT FORM (CDM PDD) - Version 03 CDM – Executive Board page 26
Applicability Condition from the Tools that are applied in the PDD Discussion of how the criteria applies to the project activity and how the project activity complies with the requirement
Applicability
Under this tool, impacts on the lifetime of the equipment due to policies and regulations (e.g. environmental regulations) or changes in the services needed (e.g. increased energy demand) are not considered. Methodologies referring to this tool shall, where applicable, provide specific guidance on how regulations that warrant the replacement of the equipment before it has reached the end of its technical lifetime should be addressed. (Source: Page 1 of the Tool)
There are no regulations or policies in South Africa that impact the lifetime of ferrochrome furnaces. Also, any increase or decrease in the ferrochrome demand impacts on the production from the furnaces, but has no impact on the remaining lifetime of the furnaces. The lifetime of furnaces depends only on the quality of maintenance that is conducted.
Project activity complies with the criteria.

PROJECT DESIGN DOCUMENT FORM (CDM PDD) - Version 03 CDM – Executive Board page 27
B.3. Description of the sources and gases included in the project : As per methodology ACM0012, the geographical extent of the project boundary shall include the relevant waste energy stream(s), equipment and energy distribution system in the following facilities: (1) The project facility (Exxaro On-Site energy recovery plant); (2) The recipient facility receiving the electricity (FMT). The spatial extent of the grid is as defined in the “Tool to calculate the emission factor for an electricity system”. As defined in ACM0012, the relevant equipment and energy distribution system covers: • In the project facility where the electricity generation occurs (Exxaro On-Site), the waste gas streams from the gas cleaning plants for furnaces F4 & F5, waste gas condition plant and the power generation plant. • In the recipient facility (FMT), the transformers or busbars where the electricity is fed into. In particular, the following are included:
• The furnaces generating the furnace off-gas; • The proposed electricity generation plant, which will generate electricity from the furnace off-
gas; • Other equipment using furnace off-gas (preheaters and ladle heaters) and purchased (imported)
methane rich gas for heating purposes, for the purpose of demonstrating that the same amount of furnace off-gas that was used by the equipment prior to the project activity will continue to be used by the equipment during the project activity;
• The facility using the electricity (FMT), which in this case is the same as the facility generating the furnace off-gas; and
• The national electricity grid, to the extent of determining the grid emission factor. The project boundary is illustrated in Figure 5 below:

PROJECT DESIGN DOCUMENT FORM (CDM PDD) - Version 03 CDM – Executive Board page 28
Table 5: Summary of gases and sources included in the project boundary and justification explanation where gases and sources are not included
Source Gas Included? Justification / Explanation
Baseline
Electricity generation, grid or captive source
CO2 Included Main emission source.
CH4 Excluded Excluded for simplification. This is conservative.
N2O Excluded Excluded for simplification. This is conservative.
Fossil fuel consumption in element process for thermal energy
CO2 Excluded Not applicable. The project activity does not involve the generation of thermal energy from waste gas.
CH4 Excluded Not applicable. The project activity does not involve the generation of thermal energy from waste gas.
N2O Excluded Not applicable. The project activity does not involve the generation of thermal energy from waste gas.
Fossil fuel consumption in CO2 Excluded Not applicable. The project activity does not
involve cogeneration.
!"#
$%#&'#
()*+,-#
.,/0123#
+42155,2#6*7,2#
8)9:;#!,(2#
<,-1409/0;#!)1=;#>2,#
&<#:9+#3:/30*2#
62,?,90,2#
@A,2:,/4B#
C92,#
(>#*DE:9+#
!"#$%&'$()*%+,%&'-+.'/!'0(+1-.%$'
234'5-$6%'71%+,8'9#:%+';%1%+-<#1'9"-16'
!"#
$%#&'#
()*+,-#.,/0123#
+42155,2#6*7,2#
8)9:;##!,(2#
&<#:9+#3:/30*2#
62,?,90,2#
(>#*DE:9+#
F9-),#?02+#
F9-),#?02+#
@A,2:,/4B#
C92,#
<,-1409/0;#!)1=;#>2,#
!G#F9-),#?,90,2#
&93/#C92,#
&93/#C92,#
&<#:9+#
&3=3/:#09/H#
I9+#
(*/-3J*/3/:#
K)9/0#
L"#M,/594?,2##:9+#,/:3/,+#NOPQ#&'#
809/-E5B#C92,#
=%:'>#:%+'>"-16'
R?,3+,/#S3+3/0,:290*2#
LL#H.#+15E#
+09J*/#
LLH.T"%%.# LL#H.#
!&R#OO#
H.#+15#
+09J*/#
OO#H.#
LL#H.#6929+3J4##K*7,2#
#0*#K)9/0#
"%%#.#
LLH.TOOH.#029/+U*2A,2#
V3E-32,4J*/9)#K*7,2#A,9+12,A,/0#
62*W,40#X4JY30B#V*1/-92B#
Schematic Diagram 1: Boundary for proposed waste gas recovery project activity at FMT Figure 4: Project activity boundary

PROJECT DESIGN DOCUMENT FORM (CDM PDD) - Version 03 CDM – Executive Board page 29
Source Gas Included? Justification / Explanation cogeneration plant CH4 Excluded Not applicable. The project activity does not
involve cogeneration.
N2O Excluded Not applicable. The project activity does not involve cogeneration.
Baseline emissions from generation of steam used in the flaring process, if any
CO2 Excluded Not applicable. Steam is not used in the flaring process.
CH4 Excluded Not applicable. Steam is not used in the flaring process.
N2O Excluded Not applicable. Steam is not used in the flaring process.
Project Activity
Fossil fuel consumption for supply of process heat and/or reaction heat
CO2 Excluded Not applicable to the project activity.
CH4 Excluded Not applicable to the project activity.
N2O Excluded Not applicable to the project activity.
Supplemental fossil fuel consumption at the project plant
CO2 Excluded No supplemental fossil fuel is used at the project plant.
CH4 Excluded No supplemental fossil fuel is used at the project plant.
N2O Excluded No supplemental fossil fuel is used at the project plant.
Supplemental electricity consumption
CO2 Included
Main emission source. Supplemental electricity consumption from the national grid (provided through fmt) during start-up of the engines if all engines are down.
CH4 Excluded Excluded for simplification as per the methodology.
N2O Excluded Excluded for simplification as per the methodology.
Electricity import to replace captive electricity, which was generated using waste energy in absence of project activity.
CO2 Excluded
Not applicable. The baseline does not involve captive electricity and no electricity is generated from waste gas in the absence of the project activity.
CH4 Excluded
Not applicable. The baseline does not involve captive electricity and no electricity is generated from waste gas in the absence of the project activity.
N2O Excluded
Not applicable. The baseline does not involve captive electricity and no electricity is generated from waste gas in the absence of the project activity.
Energy consumption for gas cleaning
CO2 Excluded Not applicable
CH4 Excluded Not applicable
N2O Excluded Not applicable

PROJECT DESIGN DOCUMENT FORM (CDM PDD) - Version 03 CDM – Executive Board page 30
B.4. Description of how the baseline scenario is identified and description of the identified baseline scenario:
Identification of the baseline scenario
The baseline scenario is identified as the most plausible baseline scenario among all realistic and credible alternative(s), (page 6/60, ACM0012)..
Realistic and credible alternatives are determined for:
• Waste gas use in the absence of the project activity;
• Power generation in the absence of the project activity for FMT;
There is only one recipient facility in the project activity, i.e. FMT. The information on the utilization of electricity in the absence of the CDM project activity is sourced from FMT and the information on the utilization of the waste gas in the absence of the CDM project activity will be sourced from the project facility, which is implemented by the project proponent, Exxaro On-Site, and from the recipient facility FMT. Hence, the CDM project proponent (Exxaro On-Site) determines the baseline options, identifies the most appropriate baseline scenario, determines the baseline fuel and demonstrates and assesses additionality in consultation with the recipient facility (FMT) and the project facility (Exxaro On-Site). Identification of the project facility: Exxaro On-Site will own and operate the project facility, i.e. the facility where the waste gas conditioning and power generation equipment will be implemented. Identification of the recipient facility: FMT is the recipient facility because the electricity will be supplied to the FMT plant, thereby reducing their electricity consumption from the national grid managed by the national utility Eskom. The amount of electricity displaced by the project activity is 159,075 MWh, therefore the power alternatives identified will be based on 159,075 MWh. By design, the average amount of waste gas flared for the three years prior validation is 2,128,68025 GJ per year, therefore the alternative uses of the waste gas will be based on 2,128,680 GJ waste gas produced per year.
The following baseline options are excluded as per the methodology instructions:
• Options that do not comply with legal and regulatory requirements; and
• Options that involve fuels used for the generation of power that are not produced or imported in South Africa.
25 Note that this is gas flared, so per definition this gas is available for electricity generation, although the total amount is not usable waste energy, because of quality/intermittent supply of the waste gas etc. It is calculated by multiplying the average gas available (243 GJ/h from Appendix 11_Technical Feasibility Study Report_TWP for FMT_June 2012, page 7 of 19) by the hours in the year, so (243 x 365 x 24).

PROJECT DESIGN DOCUMENT FORM (CDM PDD) - Version 03 CDM – Executive Board page 31
Step 1: Define the most plausible baseline scenario for the generation of electricity using the following baseline options and combinations
The baseline candidates that are considered are:
• For the waste energy generation FMT where the waste energy is generated; and
• For the recipient facility FMT where the energy is consumed.
The project activity will be implemented on waste gas generated in an existing ferrochrome production facility therefore the following combinations are relevant combinations to be investigated as they represent possible baseline scenarios of an existing facility.
For the use of waste energy the realistic and credible alternative(s) include:
W1: Waste gas is directly vented to the atmosphere without incineration.
The waste gas cannot be vented directly to atmosphere for two reasons: (1) Safety reasons as the gas is poisonous and combustible; and (2) it is a regulatory requirement that the gas must be combusted before emitted to atmosphere due to safety reasons. (1)The waste gas has to be flared and cannot be vented to atmosphere without combustion due to safety reasons. Carbon monoxide is a very poisonous gas, colourless, odourless and tasteless. CO creates an explosive gas mixture with air at a content of 12-75 %. Ignition takes place even with a very small energy spark, < 1 mJ, like the static electricity felt by man (refer to Appendix 82, page 75, last paragraph). The working environment is equipped with an alarm system for possible CO leakages. Gas probes control the CO content in selected points. Two different alarm limits are normally used, which give an alarm both locally and to the control rooms. In addition, personal portable meters are used, in which the normal alarm limit is 50 ppm. In alarm cases the working safety instructions are to be complied with.
(2)The Atmospheric Pollution Prevention Act No 45 of 1965 requires that the waste gas be flared. The regulatory air quality permit/license requires that the gas cleaning equipment (including the flare) remain in operation for a minimum of 98% of the time that the furnace is in operation (Refer to Appendix 83A and 3B, pages 4). The licence requires that FMT reports abnormal or emergency situations in which venting occurs. Venting is the release of waste gas to atmosphere un-combusted and occurs prior to the gas cleaning equipment.
W1 is therefore not a feasible alternative due to safety and regulatory requirements in South Africa.
W2: Waste gas is released to the atmosphere after incineration.
Flaring has been the historic practise since the commissioning of the furnaces (1973 for F4 and 1975 for F5). There are no regulations that prohibit that the gas be emitted to atmosphere after incineration.
W2 is feasible and has been the current practise.
W3: Waste energy is sold as an energy source.
No neighboring industries exist where the gas can possibly be used. There is one industry located across FMT is a coking plant and the coking plant use only electricity and coal as energy sources. These cannot be replaced by waste gas.
Thus, Alternative W3 is excluded from further consideration.

PROJECT DESIGN DOCUMENT FORM (CDM PDD) - Version 03 CDM – Executive Board page 32
W4: Waste energy is used for meeting energy demand at FMT
Energy demand:
Heat energy: The waste gas is used in the two (F4 and F5) furnaces’ feed pre-heaters and four ladle heaters by combustion in dedicated burners. For one ladle heater on F6 methane rich gas is used because the transfer of waste gas to the ladle is not reliable due to transfer line blockages26. Waste gas is not used in the pellet sintering plant because the temperature necessary for sintering cannot be effectively maintained due to the low and fluctuating calorific value and pressure of the waste gas coming from furnaces F4 and F5. Methane rich, high CV27 and pressure pipeline gas is available on site and this is used for the sintering process instead. There is no further demand for thermal energy on the site, only electricity is needed (Refer to Appendix 22_Waste gas assessment report_FMT_GLPS).
Electricity – The waste gas has to be recovered and cleaned and converted to electricity before it replaces some of the electricity demand of the site. This is the proposed project activity not undertaken as a CDM project activity.
W4 is therefore not a feasible alternative. P1 describes the waste gas recovery to electricity generation not as a CDM project. So W4 = P1.
W5: A portion of waste gas is recovered for generation of heat and/or electricity and/or mechanical energy, while the rest of the waste energy produced at the project facility is flared/released to atmosphere/ unutilised.
FMT: The portion of waste gas already used for heat generation satisfies all the heat demand on site for which this waste gas can be used as confirmed in Appendix 22_WAste gas assessment report_FMT_GLPS. It is not suitable to replace the other heat requirements as described in W4.
The only mechanical energy requirements on the site are for drives for rotating equipment, i.e. fans, pumps, conveyors and feed screws. Electrical motors are used in all these applications because of ease of installations, small footprint, safe operation, ease and accuracy of control and reliability.
Replacing an electrical drive (motor) with a waste gas fuelled drive (gas engine or turbine) is not feasible at FMT for the following reasons:
a) Installation of a gas engine or turbine also requires the installation of:
• Gas supply pipelines and control stations
• Cooling water system
• Lubrication and combustion oil systems. 26 There is entrained dust and moisture in the waste gas to the extent that the waste gas deposit out in the pipeline feeding gas to F6 ladle heater due to the on/off operation of the ladle heating process. This line then has to be cleaned with hydro-blasting which can only be done during major site-wide maintenance outages. When the transfer of waste gas through the pipeline becomes too restricted for effective ladle heating operations, it is replaced with methane rich pipeline gas. 27 Appendix 15 CV of methane rich gas, accessed 06/02/2012, http://www.sasol.com/sasol_internet/frontend/navigation.jsp?navid=5800002&rootid=600000&productId=4400001&pnav=products%20a-z&cnav=pipeline%20gas

PROJECT DESIGN DOCUMENT FORM (CDM PDD) - Version 03 CDM – Executive Board page 33
• Nitrogen supply system (safety and purging for maintenance)
• Ventilation systems
• Enclosure (for ventilation control)
The subsequent footprint (m2/kW) and cost/unit output (ZAR/kW) is thus orders of magnitude larger than for an electric motor which only requires an electric cable connection.
b) The presence of the highly combustible gas at all the mechanical energy requirement locations on the site has been identified as a high and unacceptable safety risk, because of the high possibility of explosions in locations where employees work.
The mechanical drive applications require sophisticated and accurate control and reliability for steady plant operations. The variability of the gas quality and gas availability will severely impact on steady plant operations.
W6: All the waste energy produced at FMT is captured and used for export electricity generation or steam.
Export of Electricity
To export electricity to the national grid a Power Purchase Agreement has to be negotiated between the facility and Eskom. There is no regulatory or administrative process that can be followed to arrange a long term (10 to 15 year) PPA between Eskom and the ferrochrome facility (Refer to Appendix 48_Eskom and Long term PPAs).
Therefore, producing and exporting electricity to the national grid is not a feasible option as long term PPAs cannot be secured.
Steam export
There are no neighbouring facilities where steam can be exported. Therefore, producing and exporting steam to the neighbouring facility is not a feasible option. Table 6: Summary of alternatives and outcomes
Description of the alternative Summary of the investigation
W1: Waste gas is directly vented to the atmosphere without incineration
Not permitted in South Africa
W2: Waste gas is released to the atmosphere after incineration
Current permit allows for this situation. This is also the prevailing practise and the current scenario.
W3: Waste energy is sold as an energy source Not feasible
W4 Waste energy is used for meeting energy demand at the FMT;
Heat – not feasible to utilise the flared waste gas to meet the heat demand on the site.

PROJECT DESIGN DOCUMENT FORM (CDM PDD) - Version 03 CDM – Executive Board page 34
W5: A portion of the quantity or energy of waste gas is recovered for generation of heat, while the rest of the waste energy produced at the project facility is flared/released to atmosphere/ unutilised;
FMT: Done to maximum extent. Not feasible.
W6: All the waste energy produced at the facility is captured and used for export electricity generation or steam.
Not feasible because there is no neighbouring facility to export steam to.
For power generation the realistic and credible alternative(s) include:
P1: Proposed project activity not undertaken as a CDM project activity;
This alternative is in compliance with all applicable legal and regulatory requirements. Therefore, this scenario is at first sight a credible baseline candidate.
P1 is carried to the Step 2.
P2: On-site or off-site existing fossil fuel fired cogeneration plant;
There is no existing cogeneration plant on-site or off-site at the FMT.
Therefore, P2 is not a realistic and credible alternative.
P3: On-site or off-site Greenfield fossil fuel fired cogeneration plant; There is no demand for steam at the FMT site. The existing thermal demand at the site requires a high temperature (over 800 oC), which cannot be achieved with steam generated in a cogeneration plant. Therefore steam generated in a new cogeneration plant cannot replace the thermal demand at the FMT site.
Therefore, P3 is not a realistic and credible alternative.
P4: On-site or off-site existing renewable energy based cogeneration plant;
There is no existing renewable energy based cogeneration plant on-site or off-site at the FMT.
Therefore, P4 is not a realistic and credible alternative.
P5: On-site or off-site Greenfield renewable energy based cogeneration plant;
The renewable energy sources that can be used for cogeneration are solar (CSP) and biomass (biomass boiler delivering steam and electricity). There is a small steam demand at FMT for some months of the year in the ICE plant. The plant does not operate continuously through the year, but when it is in operation, the demand for steam is continuous. The level of service that a concentrated solar power plant will deliver is not be comparable to the level of service that the power plant running on waste gas would deliver, because the electricity generated by CSP would deliver an interruptable electricity supply. There is insufficient biomass in the area to fuel (for example) a biomass boiler28 in the area. 28 Appendix 17: Biomass Supply around Witbank Report, Forestry Solutions, 29 March 2012

PROJECT DESIGN DOCUMENT FORM (CDM PDD) - Version 03 CDM – Executive Board page 35
Therefore, P5 is not a realistic and credible alternative.
P6: On-site or off-site existing fossil fuel based existing identified captive power plant;
There is no existing fossil fuel based captive power plant on-site or off-site at FMT.
Therefore, P6 is not a realistic and credible alternative.
P7: On-site or off-site existing identified renewable energy or other waste energy based captive power plant;
There is no existing renewable energy or other waste energy based captive power plant on-site or off-site at FMT.
Therefore, P7 is not a realistic and credible alternative.
P8: On-site or off-site Greenfield fossil fuel based captive plant;
The fossil fuel that is available is coal. This alternative is considered further in Step 2.
P9: On-site or off-site Greenfield renewable energy or other waste energy based captive plant; The potential renewable energy sources considered are biomass, hydro, wind and solar. The production of electricity from biomass, wind, solar and hydro would be more expensive than purchasing it from Eskom as is indicated when comparing the levelized cost of electricity production from the renewables. Table 4 in Appendix 1829, a report by the National Energy Regulator of South Africa (NERSA) shows the levelized cost for concentrated solar power trough without storage as R3.14/kWh, solid biomass as R1.18/kWh, wind as R1.25/kWh and small hydro as R0.96/kWh etc. Compared to these costs the megaflex tariff paid for electricity is R0.45/kWh30. Furthermore, in the case of biomass, sufficient amount of biomass to supply fuel to a biomass cogeneration plant is not available in the vicinity of FMT31.
Therefore, P9 is not a realistic and credible alternative.
P10: Sourced from grid-connected power plants;
FMT is contracted and has the capacity to obtain all of its required electricity from South Africa’s national electricity provider, Eskom. This alternative envisages the continuation of the prevailing practice at the site.
P10 is realistic and can be considered as the most likely baseline scenario for the recipient facility.
29 Appendix 18 Table 4, page 10 of 24, National Energy Regulator of South Africa. (2009, October 30). Decision in the matter regarding Renewable Energy Feed-In Tariffs Phase II by the National Energy Regulator of South Africa. 30 As of April 2012, Appendix 59. 31 Appendix 17 Biomass Supply around Middelburg Report, Forestry Solutions, 29 March 2012

PROJECT DESIGN DOCUMENT FORM (CDM PDD) - Version 03 CDM – Executive Board page 36
P11: Existing captive electricity generation using waste energy (if the project activity is captive generation using waste energy, this scenario represents captive generation with lower efficiency or lower recovery than the project activity);
There is no existing captive electricity generation at all on the site.
Alternative P11 is not considered as a realistic baseline scenario.
P12: Existing cogeneration using waste energy, but at a lower efficiency or lower recovery.
The Alternative P12 is not credible since there is no existing cogeneration plant at the project site.
Alternative P12 is excluded from further consideration. Table 7: Summary of alternatives for Power generation
Scenario Description of alternative scenario Comments and reference to support documentation
P1: Proposed project activity not undertaken as a CDM project activity;
This alternative is in compliance with all applicable legal and regulatory requirements. Therefore, this scenario is at first sight a credible baseline candidate. Alternative P1 is carried to the Step 2.
P2: On-site or off-site existing fossil fuel fired cogeneration plant; Not feasible
P3: On-site or off-site Greenfield fossil fuel fired cogeneration plant;
Not feasible
P4: On-site or off-site existing renewable energy based cogeneration plant;
Not feasible
P5: On-site or off-site Greenfield renewable energy based cogeneration plant;
Not feasible
P6: On-site or off-site existing fossil fuel based existing identified captive power plant;
Not feasible
P7: On-site or off-site existing identified renewable energy or other waste energy based captive power plant;
Not feasible
P8: On-site or off-site Greenfield fossil fuel based captive plant;
Carried over for further investigation
P9: On-site or off-site Greenfield renewable energy or other waste energy based captive plant;
Not feasible
P10: Sourced from grid-connected power plants; Current scenario and prevailing practise.
P11: Existing captive electricity generation using waste Not feasible
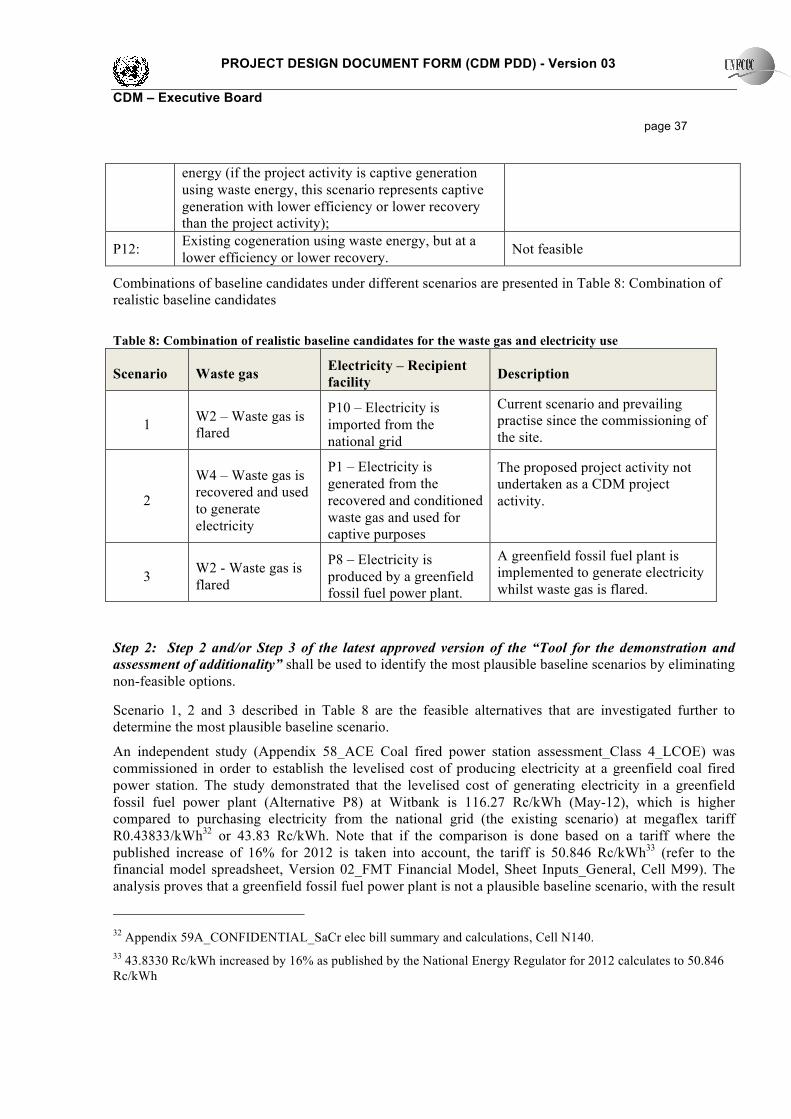
PROJECT DESIGN DOCUMENT FORM (CDM PDD) - Version 03 CDM – Executive Board page 37
energy (if the project activity is captive generation using waste energy, this scenario represents captive generation with lower efficiency or lower recovery than the project activity);
P12: Existing cogeneration using waste energy, but at a lower efficiency or lower recovery. Not feasible
Combinations of baseline candidates under different scenarios are presented in Table 8: Combination of realistic baseline candidates
Table 8: Combination of realistic baseline candidates for the waste gas and electricity use
Scenario Waste gas Electricity – Recipient facility Description
1 W2 – Waste gas is flared
P10 – Electricity is imported from the national grid
Current scenario and prevailing practise since the commissioning of the site.
2
W4 – Waste gas is recovered and used to generate electricity
P1 – Electricity is generated from the recovered and conditioned waste gas and used for captive purposes
The proposed project activity not undertaken as a CDM project activity.
3 W2 - Waste gas is flared
P8 – Electricity is produced by a greenfield fossil fuel power plant.
A greenfield fossil fuel plant is implemented to generate electricity whilst waste gas is flared.
Step 2: Step 2 and/or Step 3 of the latest approved version of the “Tool for the demonstration and assessment of additionality” shall be used to identify the most plausible baseline scenarios by eliminating non-feasible options.
Scenario 1, 2 and 3 described in Table 8 are the feasible alternatives that are investigated further to determine the most plausible baseline scenario.
An independent study (Appendix 58_ACE Coal fired power station assessment_Class 4_LCOE) was commissioned in order to establish the levelised cost of producing electricity at a greenfield coal fired power station. The study demonstrated that the levelised cost of generating electricity in a greenfield fossil fuel power plant (Alternative P8) at Witbank is 116.27 Rc/kWh (May-12), which is higher compared to purchasing electricity from the national grid (the existing scenario) at megaflex tariff R0.43833/kWh32 or 43.83 Rc/kWh. Note that if the comparison is done based on a tariff where the published increase of 16% for 2012 is taken into account, the tariff is 50.846 Rc/kWh33 (refer to the financial model spreadsheet, Version 02_FMT Financial Model, Sheet Inputs_General, Cell M99). The analysis proves that a greenfield fossil fuel power plant is not a plausible baseline scenario, with the result
32 Appendix 59A_CONFIDENTIAL_SaCr elec bill summary and calculations, Cell N140. 33 43.8330 Rc/kWh increased by 16% as published by the National Energy Regulator for 2012 calculates to 50.846 Rc/kWh

PROJECT DESIGN DOCUMENT FORM (CDM PDD) - Version 03 CDM – Executive Board page 38
that P8 is eliminated as a plausible baseline scenario at the end of Step 2.
Summary:
The levelised cost of electricity production in a greenfield coal fired power plant is higher than purchasing electricity from the national grid. Therefore, P8 is eliminated as a plausible baseline scenario.
Step 3: If more than one credible and plausible alternative scenario remain, the alternative with the lowest baseline emissions shall be considered as the baseline scenario This methodology is only applicable if the baseline scenario for all the waste energy generator(s) and the recipient facility(ies) identified, is one of the scenarios described in Table 9 below (copied directly from ACM0012, Version 04.0.0, Table 2). Heat and mechanical power is not relevant in this project activity and these have been excluded from the table. Table 9: Combinations of baseline scenarios applicable under different project situations Baseline Scenario Combination of baseline
scenarios Description of project activity
Waste energy
Power
Project activity: Separate generation of electricity
Baseline scenario-1
1. The total waste gas of WECM(s) recovered in the project is flared
2. The electricity is obtained from the grid.
W2 P10 Current scenario and prevailing practise since the commissioning of the furnaces (38 years for F4 that was commissioned in 1973 and 36 years for M4 that was commissioned in 1975).
Baseline scenario-2
The project activity is undertaken but not as a CDM activity
W4 P1 The project activity is undertaken but not as a CDM activity.
Conclusion
The baseline scenario for the waste gas is continued flaring to atmosphere. The baseline scenario for electricity is the continued import of power from the national grid.
B.5. Description of how the anthropogenic emissions of GHG by sources are reduced below those that would have occurred in the absence of the registered CDM project activity (assessment and demonstration of additionality):
The additionality of the project activity shall be demonstrated and assessed using the latest version of the “Tool for the demonstration and assessment of additionality” agreed by the CDM Executive Board,

PROJECT DESIGN DOCUMENT FORM (CDM PDD) - Version 03 CDM – Executive Board page 39
available at the UNFCCC CDM website. The latest version published at the time of compiling the PDD is Version 06.
The project participants will apply the investment analysis for demonstrating additionality.
Step 1: Identification of alternatives to the project activity consistent with current laws and regulations
Define realistic and credible alternatives to the project activity(s) through the following Sub-steps:
Sub-step 1a: Define alternatives to the project activity:
From B.4, two realistic and credible alternatives remain:
Scenario 1:
• W2 – Waste gas is flared
• P10 – Electricity is imported from the national grid
AND
Scenario 2:
• W4 – Waste gas is recovered
• P1 – Electricity is generated for captive purposes
Sub-step 1b: Consistency with mandatory laws and regulations:
Both scenario 1 and 2 meet all legal and regulatory requirements of the host country, South Africa.
Step 2: Investment analysis
Sub-step 2a: Determine appropriate analysis method
The analysis will be analyzed through Option III of the additionality tool, i.e. benchmark analysis. This method is applicable because:
§ Option I: simple cost analysis, does not apply as the project generates economic returns through the sale of electricity to Samancor. Other than CDM related income, the project produces economic benefit through the sale of electricity generated by the project activity.
§ Option II: Investment comparison analysis is not used, as there is no realistic alternative for the project (provision of power to the grid) involving investments. In other words, the investment comparison analysis is not applicable to the project because the alternative of the project is “Equivalent electricity service provided by the grid”, which is not a single project.
§ Option III, benchmark analysis can be transparently demonstrated using financial/economic information for the proposed project activity and compare financial indicators against a relevant industry benchmark hurdle rate.
According to paragraph 19 of Annex 13, EB 6, the benchmark approach is suited to circumstances where the baseline does not require investment or is outside the direct control of the project developer, i.e. cases where the choice of the developer is to invest or not to invest. In the case of this project activity, the baseline is electricity supplied by the national grid and is outside of the control of the project developer.

PROJECT DESIGN DOCUMENT FORM (CDM PDD) - Version 03 CDM – Executive Board page 40
Conclusion: Option III is applicable to the project activity as transparent data on the project activity and relevant industry benchmark is available. Hence, the benchmark analysis is applied and the Real Equity Internal Rate of Return (IRR) is used to assess the financial viability of the project activity.
Sub-step 2b. Option III. Apply benchmark Analysis
The benchmark analysis as described in the additionality tool prescribes that the project returns should be compared to a benchmark value that is based on “standard returns in the market, considering the specific risk of the project type, but not linked to the subjective profitability expectation or risk profile of a particular project developer”. As previously explained, South Africa does not have an established independent power producer market. In the absence of an established independent power producer market in South Africa, the relevant benchmark would be based on the typical minimum required real rate of return for an equity providing investor in a project of this type in South Africa.
The benchmark in the present instance is derived from bankers' views which were obtained for inter alia a waste gas/heat to energy project without a long term PPA under-written by the government. The impact of this is that the absence of a government-backed PPA implies that the project may deliver what could become a stranded asset: If for reasons pertaining solely to the ferrochrome market the off-taker should get to be in financial distress, the ability of the plant to absorb the electricity and continue to pay the agreed price may be compromised.
In the present case bankers' views were received from: Rand Merchant Bank, a division of FirstRand Bank Limited and Cresco Project Finance (Pty) Ltd. (the documentation has been made available to the validators, Appendix 40.1 and Appendix 40.2).
As appears from the bankers' views received, Cresco put the IRR hurdle rate at 25 (nominal equity after tax) while Rand Merchant Bank put it at 25% (nominal equity IRR). Sub-step 2c. Calculation and comparison of financial indicators
(1) Basic parameters for calculation of financial indicators
According to the relevant project documents, the parameters needed for calculation of the real Equity IRR of the project activity are given in the following table.

PROJECT DESIGN DOCUMENT FORM (CDM PDD) - Version 03 CDM – Executive Board page 41
Table 10: Assumptions made for the financial analysis Parameter Unit Value Source of information to motivate the
assumption
Installed design electrical capacity of the power plant
MW 23.77
Appendix 11_Technical Feasibility Study Report, page 11 of 19, Table 1. Note that the figure in the Technical Report is rounded off to 23.8MW
Hours operation hours 120,000
1. EOS financial model (Spreadsheet, Inputs_General, Cell L17)
2. Appendix 81_Letter from Jenbacher_lifetime of equipment_18 November 2011
Net annual power generation displacing grid electricity (Actual Power dispatched = power generated minus parasitic losses)
MWh 159,075 EOS Financial Model (Spreadsheet, Inputs_Production, Cell F169)
**Plant load factor % 83% Technical Feasibility Report, Appendix
11, page 10 of 19
Project lifetime Years
(equivalent)
16.534 Financial Spreadsheet, Inputs_Production, Cell O19)
Expenditure (CAPEX) plus Mobilisation Cost (Appendix 11 page 15 and 16 of 19 provides a description by TWP of how the CAPEX was put together)
South African Rand
472,729,646
+ 19,719,970
(Appendix 11, page 15 to18) Investment: all capital expenditure including generation equipment, infrastructure, sub-station connection, reciprocating gas engines and all ancillary equipment constituting a complete power station required for reliable long term power generation. Engineering, procurement and construction costs (“EPC”) quoted price.
Annual Operation and Maintenance Cost estimate* (Appendix 11 page 17 and 18 of 19 and Table 4 and Table 5 in the Report provides a description by TWP of how the OPEX was put together)*
South African Rand
20,304,315
Cost Estimate done by Engineering Company TWP (Appendix 11, Table 4 and Table 5) Financial Spreadsheet, Inputs_General, Cell L235
34 Based on the expected lifetime of the gas engines of 120,000 hours and the plant load factor described in Appendix 11

PROJECT DESIGN DOCUMENT FORM (CDM PDD) - Version 03 CDM – Executive Board page 42
Parameter Unit Value Source of information to motivate the assumption
Income tax rate % 28% South Africa Revenue Services (SARS)35
Inflation rate % 5.90% Nedbank Currency Forecast (June 2011), Appendix 52
Residual Value Euro 2.1 million
for 14 engines
Jenbacher confirmation, Appendix 14
Debt:Equity - 70:30 Appendix 57_Debt Term Sheet_Samancor SPV_07-02-201236
*Indexed by inflation over the life of the project.
Notes:
**Plant Load Factor: For design purposes of the plant and for the purpose of estimating the electricity generation for the project, the annual plant load factor is determined by independent expert TWP. Parameters used are the engine planned uptime (97% - Jenbacher Maintenance Schedule), engine unplanned uptime (Jenbacher specification), and furnace operating rate (Appendix 11_Technical Feasibility Study Report_TWP for FMT_June 2012, page 7 and 8). The furnace operating rate is determined from multiplying the furnace availability and furnace utilisation design rates. Please refer to Appendix 11_Technical Feasibility Study Report_TWP for FMT_June 2012, pages 7,8 and 10 for a description of the load factor.
Electricity Price: for the purpose of estimating the electricity price for the project, the average standard price as relevant to FMT is used, indexed by inflation over the life of the project. In April 2012 a price increase of 16% was announced from April 2012 (Appendix 56_Minister Malusi Gigaba on the NERSA Electricity Announcement | 2012-03-09 | News from DPE). After 2012 the increase is set at the forecasted inflation rate.
(2) Comparison of equity IRR for the proposed project and the benchmark equity IRR
In accordance with the benchmark analysis, the proposed project is not considered as financially attractive if its financial indicators are lower than the benchmark requirements. The nominal Internal Rate of Return (IRR) on the equity for the project activity serves as a benchmark to assess the financial attractiveness of the project activity.
Equity IRR is considered by the Project Participant to be the appropriate financial indicator for the project activity because:
(i) The Project Participant will decide whether or not to invest in the project and will assess the financial feasibility of the project on the basis of the internal rate of return to its equity investors (consistent with the equity IRR); and
(ii) Equity IRR assumes that you use debt for the project whereas a project IRR calculation assumes that no debt financing is used for the project; the project activity will be funded
35 Appendix 25.5_Corporate Tax Rate, South Africa Revenue Services website (http://www.sars.gov.za/Tools/Documents/DocumentDownload.asp?FileID=44174) 36 Page 2 of the document under bullet 2 (Projects Cost and Funding) and page 6 under bullet 26 (Shareholder Equity)

PROJECT DESIGN DOCUMENT FORM (CDM PDD) - Version 03 CDM – Executive Board page 43
by both debt and equity.37
Table 11 below shows the nominal Equity IRR of the proposed project, without CDM-related income. Without CDM-related income, the nominal Equity IRR is lower than the benchmark and the proposed project is not financially acceptable.
Table 11: Financial analysis result
Scenario Equity IRR (nominal)
Base Case without CER’s 3.06% Benchmark 25%
Sensitivity Analysis
The purpose of the sensitivity analysis is to examine whether the conclusion regarding the financial viability of the proposed project is sound and tenable with those reasonable variations in the assumptions.
The investment analysis provides a valid argument in favour of additionality only if it consistently supports (for a realistic range of assumptions) the conclusion that the project activity is unlikely to be the most financially attractive or is unlikely to be financially attractive.
For the proposed project, the following financial parameters were identified as the variable factors for sensitivity analysis of financial attractiveness:
- 1. Construction Cost - Construction Cost Sensitivity: Sensitivity analysis was run on 100% of the construction cost.
- 2. Operations and Maintenance Costs - Jenbacher Maintenance Cost: This makes up about half of the operational expenditure of the project.
- 3. MWh delivered - MWh sensitivity as this parameter influences the IRR as much as the electricity price does and it is therefore significant enough to add.
- 4. Electricity Tariff - Electricity Price Sensitivity: The only revenue in the project is electricity revenue, which of course is more than 20% of project renevue.
The parameters vary from -20% to +20% in the financial assessment. The parameters for the sensitivity analysis are selected as they constitute more than 20% of either total project costs or total project revenues or have significant impact on the financial feasibility indicator. When the above four financial indicators fluctuate within the range of –20% to +20% in accordance with “Guidance on the Assessment of Investment Analysis” (version 03), the Equity IRR of the proposed
37 Project IRR takes as its inflows the full amount(s) of money that is needed in the project. The outflows are the cash generated by the project. The project IRR is the internal rate of return of these cash flows. Therefore, the project IRR calculation assumes that no debt is used for the project.
The equity IRR assumes that you use debt for the project, as the inflows are the cash flows required minus any debt that was raised for the project. The outflows are cash flows from the project minus any interest and debt repayments.

PROJECT DESIGN DOCUMENT FORM (CDM PDD) - Version 03 CDM – Executive Board page 44
project varies to different extent. The impact on the Equity IRR of fluctuations in the four financial parameters (not considering CERs income) is shown in Table 12 and Figure 5. Table 12: Sensitivity Analysis Results for FMT
Figure 5: Results of Sensitivity Analysis for FMT
Threshold Analysis
The following table summarizes the results of the threshold analysis.
Table 13: Results of the Threshold analysis
Project cost (Construction Cost) The fluctuation of Capital Expenditure impacts on total project costs and hence on the Equity IRR of the
-20% -15% -10% -5% 0% 5% 10% 15% 20%
Construction Cost 7.35% 6.10% 4.99% 3.98% 3.06% 2.22% 1.45% 0.73% 0.06%
Electricity Price Sensitivity -3.85% -2.06% -0.40% 1.31% 3.06% 4.83% 6.62% 8.42% 10.25%
Electricity MWh Sensitivity -3.85% -2.06% -0.40% 1.31% 3.06% 4.83% 6.62% 8.42% 10.25%
Jenbacher Maintenance 4.45% 4.10% 3.75% 3.40% 3.06% 2.72% 2.38% 2.05% 1.72%
Benchmark 25.00% 25.00% 25.00% 25.00% 25.00% 25.00% 25.00% 25.00% 25.00%
!"#$##%&
!'$##%&
#$##%&
'$##%&
"#$##%&
"'$##%&
(#$##%&
('$##%&
)#$##%&
!(#%& !"'%& !"#%& !'%& #%& '%& "#%& "'%& (#%&
!"##$%&'()*%'+,-'.//'
0'.123'4,*4'5'64234,*4'')7'8,3$,9:4'
;)<$1,:'!"#$%&'.//'='>41*$?@$%&'A1,:&*$*'
&&&&&*+,-./012+,&*+-.&34,-5265.7& 8941./515.7&:/514&34,-5265.7& &&&&;4,<=1>4/&?=5,.4,=,14&*+-.&
@4,1>A=/B& 8941./515.7&?C>&34,-5265.7&
Threshold Analysis to achieve 25% Nominal Equity IRR
Construction Cost Sensitivity -56.20%
Electricity Price Sensitivity 58.53%
Electricity MWh Sensitivity 58.53%
Jenbacher Maintenance -264.11%

PROJECT DESIGN DOCUMENT FORM (CDM PDD) - Version 03 CDM – Executive Board page 45
proposed project. If the total project cost decreased by 20% the project IRR (after tax) will be 7.35% and is still below the benchmark. It is unlikely that the project cost will reduce with 20% or more due to a fact that the price index of capital goods has increased year-on-year over the last 10 years in South Africa (Appendix 20_ Price index of capital goods in South Africa_history, shows that the index of capital goods has never decreases year on year for the last 10 years in South Africa). Therefore, it is unlikely that the project cost will decrease sufficiently, i.e. by 56.2% to reach the IRR benchmark of the project.
Electricity Price
Even if the electricity price increases with 20% compared to the base case, the IRR after tax for the project will reach a nominal return of 10.25%. With a 20% increase the electricity price is significantly higher than the expected Eskom megaflex price and FMT will continue to purchase electricity from the national utility as it is cheaper option. In South Africa, no market exists for electricity sold at prices higher than the national utility prices and therefore it is not possible to increase the price of electricity even by 20%. Therefore it is unrealistic to increase the sale price of the electricity by 58.53% to reach the financial benchmark as there is no market for electricity at this price.
Maintenance Costs
Fluctuations in Annual Operation & Maintenance Costs also have an impact on annual project costs (albeit a smaller impact than Capital Expenditure) and hence on the Equity IRR of the proposed project. Reducing operation and maintenance costs by 20% still provides a return (4.45%) below the benchmark.
The Annual O&M Costs are a function of the negotiated price quoted by the Jenbacher supplier to the Project Participant and the Annual O&M Costs are therefore extremely unlikely to decrease. It is not possible to reduce maintenance costs by the required 264% for the project to reach the benchmark return.
From the sensitivity analysis, it is evident that even if the parameters vary by 20% in order to present a more financial feasible scenario, the project activity returns still remain under the financial benchmark.
Step 3: Barrier Analysis
3.1 Technical Barrier
3.1.1 Nature of company, organization and its ownership
Exxaro On-Site (EOS) is a Joint Venture (JV) between Exxaro Resources (51%) and Prana Energy (49%). Exxaro Resources is a large diversified mining company. Prana Energy is a cleaner energy project developer. The JV was formed in 2007 with the specific purpose of developing, building, owning and operating on-site cleaner energy power plants.
3.1.2 Previous experience with similar projects (that is under consideration for CDM) in other locations
EOS is in the process of developing a number of energy recovery plants and none are yet in operation. EOS has one energy recovery project operating on Ilmenite furnace off-gas that is currently in detailed design with construction due to start in Q3 2012. EOS has not completed the development of any Ferrochrome furnace off-gas power generation projects but is currently developing two of projects, both under CDM.
Skilled and/or properly trained labour to operate and maintain the technology is not available in South Africa yet, which leads to an elevated risk of equipment disrepair and malfunctioning or other underperformance.

PROJECT DESIGN DOCUMENT FORM (CDM PDD) - Version 03 CDM – Executive Board page 46
Risk of technological failure: the technology failure risk in the local circumstances is significantly greater compared to technology failure risk of power stations in the national grid. The power stations in the national grid have been in operation for decades and the most common technology (coal fired power stations), are well known and tested in South Africa. In the case of the national grid, the electricity generation system can continue even if one power station unit is down for maintenance or if one power unit experiences operational problems. In the case of the project activity, there are no backup measures if the technology fails or underperforms as a result of gas (fuel) quality variability.
The existence of a technological barrier for this technology is confirmed by showing evidence that the use of this technology in the ferrochrome sector is marginal, i.e. below 5% (CDM projects included). Refer to Appendix 26, the letter from the Ferrometal alloy industry Association.
The alternative of maintaining the current practice (flaring of waste gas and electricity import from the national grid) does not face any technical barriers. If no barriers existed, both the options of maintaining the current practice and the project activity would be feasible.
3.2 Barriers due to prevailing practice
Electricity tariffs in South Africa are relatively low by international standards.38 Low electricity tariffs render the cost of waste energy recovery technologies relatively uncompetitive in comparison to conventional energy, thereby creating a significant barrier to entry for waste energy recovery projects. Electricity tariffs in many European countries, for example, are significantly higher than in South Africa, which ensures that the cost of electricity from waste energy generation is comparatively cost competitive with conventional energy making waste energy recovery commercially viable.39 Therefore, due to the historically low cost of electricity in South Africa and lack of cost competitiveness of renewable energy and waste energy recovery with conventional power station technology, waste energy recovery has not been exploited on a large scale in South Africa.
The grid electricity historically used in the process at FMT has been so used since startup of the plant in 1959. FMT is currently connected to the national grid for the supply of all its electricity demand.40 The on-going import and use of the electricity presents the least risk technology option to FMT for the sustained production of ferrochrome. Considering the current practice and the pre-project scenario of FMT, import of electricity from the national grid would be the low risk alternative to the proposed project activity. The existence of a prevailing practice barrier is further confirmed by the fact that the use of this technology in the ferrochrome sector in Southern Africa is marginal, i.e. below 5% (CDM projects included). Refer to Appendix 26, the letter from the Ferrometal alloy industry Association. The alternative of maintaining the current practice (flaring of waste gas and electricity import from the national grid) does not face any prevailing practice barriers. If no barriers existed, both the options of maintaining the current practice and the project activity would be feasible.
Sub-step 3 b: Show that the identified barriers would not prevent the implementation of at least one of the alternatives (except the proposed project activity):
38 Appendix 28 Eskom Annual Report 2009, page xii 39 Appendix 28 Eskom Annual Report 2009, page xii 40 Appendix 27 Electricity Supply Agreement with Eskom, Confidential information submitted to DOE.

PROJECT DESIGN DOCUMENT FORM (CDM PDD) - Version 03 CDM – Executive Board page 47
None of the barriers described above apply to the existing scenario where FMT imports electricity from the national grid.
Step 4: Common practice analysis
Sub-step 4a: Analyze other activities similar to the proposed project activity:
Guidelines on Common Practice , (Version 01.0) is applied. Table 14: Common Practice analysis Outcome of the Step applied to the project activity Step 1: Calculate applicable output range as +/-50% of the design output or capacity of the proposed project activity.
The design capacity for the power plant is 23.77 MW. Therefore the applicable output range is 35.7 to 11.9 MW. (-50% and +50% of design capacity)
Step 2: In the applicable geographical area, identify all plants that deliver the same output or capacity, within the applicable output range calculated in Step 1, as the proposed project activity and have started commercial operation before the start date of the project. Note their number Nall. Registered CDM project activities shall not be included in this step.
Applicable Geographical Area:
The common practice analysis is limited to South Africa and the neighbouring country Zimbabwe, because these are the only two countries in Southern Africa that produce ferrochrome (Refer to Appendix 42_Pyrometallurgy in Southern Africa, page 2). As of 15 February 2012, there are fifteen ferrochrome smelters in South Africa and three in Zimbabwe.
(Refer to http://www.pyrometallurgy.co.za/PyroSA/index.htm).
Similar technologies that could be implemented on closed furnaces that produce a high CO content gas is a boiler and steam turbine combination that generates electricity and an integrated combined cycle gas turbine. However, There are no waste gas recovery technologies of any kind in operation at any of the closed furnace ferrochrome operations in South Africa or in Zimbabwe that generates electricity. (Refer to Appendix 26, letter from the FerroMetal Association).
Nall = 0.
Step 3: Within plants identified in Step 2, identify those that apply technologies different that the technology applied in the proposed project activity. Note their number Ndiff.
Ndiff = 0, because Nall is 0
Step 4: Calculate factor F=1-Ndiff/Nall
representing the share of plants using technology similar to the technology used in the proposed project activity in all plants that deliver the same output
F is 0
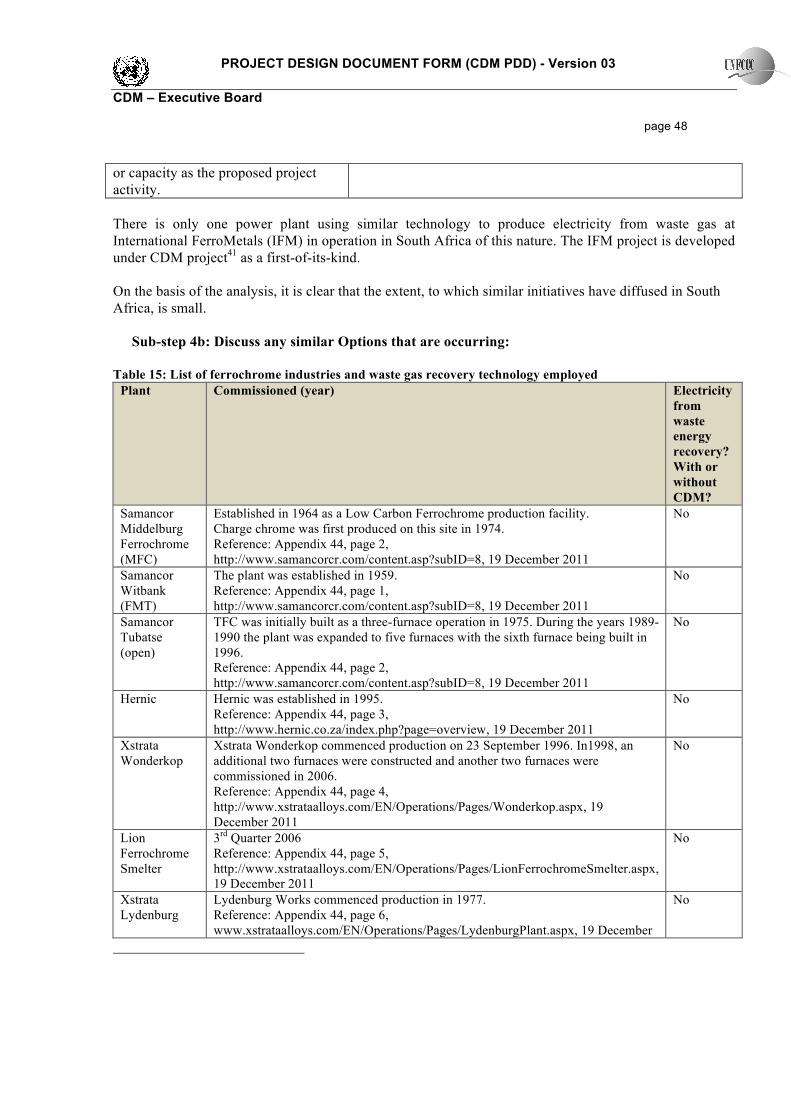
PROJECT DESIGN DOCUMENT FORM (CDM PDD) - Version 03 CDM – Executive Board page 48
or capacity as the proposed project activity. There is only one power plant using similar technology to produce electricity from waste gas at International FerroMetals (IFM) in operation in South Africa of this nature. The IFM project is developed under CDM project41 as a first-of-its-kind. On the basis of the analysis, it is clear that the extent, to which similar initiatives have diffused in South Africa, is small.
Sub-step 4b: Discuss any similar Options that are occurring: Table 15: List of ferrochrome industries and waste gas recovery technology employed
Plant Commissioned (year) Electricity from waste energy recovery? With or without CDM?
Samancor Middelburg Ferrochrome (MFC)
Established in 1964 as a Low Carbon Ferrochrome production facility. Charge chrome was first produced on this site in 1974. Reference: Appendix 44, page 2, http://www.samancorcr.com/content.asp?subID=8, 19 December 2011
No
Samancor Witbank (FMT)
The plant was established in 1959. Reference: Appendix 44, page 1, http://www.samancorcr.com/content.asp?subID=8, 19 December 2011
No
Samancor Tubatse (open)
TFC was initially built as a three-furnace operation in 1975. During the years 1989-1990 the plant was expanded to five furnaces with the sixth furnace being built in 1996. Reference: Appendix 44, page 2, http://www.samancorcr.com/content.asp?subID=8, 19 December 2011
No
Hernic Hernic was established in 1995. Reference: Appendix 44, page 3, http://www.hernic.co.za/index.php?page=overview, 19 December 2011
No
Xstrata Wonderkop
Xstrata Wonderkop commenced production on 23 September 1996. In1998, an additional two furnaces were constructed and another two furnaces were commissioned in 2006. Reference: Appendix 44, page 4, http://www.xstrataalloys.com/EN/Operations/Pages/Wonderkop.aspx, 19 December 2011
No
Lion Ferrochrome Smelter
3rd Quarter 2006 Reference: Appendix 44, page 5, http://www.xstrataalloys.com/EN/Operations/Pages/LionFerrochromeSmelter.aspx, 19 December 2011
No
Xstrata Lydenburg
Lydenburg Works commenced production in 1977. Reference: Appendix 44, page 6, www.xstrataalloys.com/EN/Operations/Pages/LydenburgPlant.aspx, 19 December
No

PROJECT DESIGN DOCUMENT FORM (CDM PDD) - Version 03 CDM – Executive Board page 49
Plant Commissioned (year) Electricity from waste energy recovery? With or without CDM?
2011 Xstrata Boshoek
The Boshoek smelter was constructed by Merafe Resources Limited (Merafe Resources) in 2001 and successfully commissioned in 2002. Reference: Appendix 44, page 7, www.xstrataalloys.com/EN/Operations/Pages/BoshoekSmelter.aspx, 19 December 2011
No
IFM Yes with CDM
Assmang Machadodorp
In 1971 Feralloys Limited a wholly-owned subsidiary of Assmang, expanded and erected a ferrochrome smelter at Machadodorp for the production and export of charge and low-carbon ferrochrome. Reference: Appendix 44, page 10, http://www.assmang.co.za/o/chrome/machadodorp.asp, 19 December 2011
No
Tata Steel August 2008 Reference: Appendix 44, page 12, www.tata.com/company/Articles/inside.aspx?artid=PYkXhCLqLKQ=, 19 December 2011
No
ASA Metals ASA Metals was established in 1997 Reference: Appendix 44, page 14, http://www.asametals.co.za/history.html, 19 December 2011
No
“If Sub-steps 4a and 4b are satisfied, i.e.(i) similar activities cannot be observed or (ii) similar activities are observed, but essential distinctions between the project activity and similar activities can reasonably be explained, then the proposed project activity is additional)”. Alleviation of barriers through CDM Technology barrier The CDM revenue will create a buffer that will enable the project to absorb additional downtime yet continue repaying its debt and honoring its operational obligations. Skilled labour: The additional income from CDM will allow the project proponents to be bolder in appointing more and better skilled personnel to operate and maintain the plant, even if premiums have to be paid to acquire scarce skills from abroad. Prevailing practice Continuing the purchase and utilisation of fossil fuel derived, grid electricity requires no investment and carries no risk while the project activity does require very significant investment and also some risk. The only other project in the ferrochrome sector that has utilised waste gas to generate electricity has done so

PROJECT DESIGN DOCUMENT FORM (CDM PDD) - Version 03 CDM – Executive Board page 50
with the assistance of CDM (IFM). In the present case the CDM income will create extra revenue that can be used to offset the risk posed by a pioneering intervention. Notice of prior consideration The project start date is 15 December 2012. The milestones in the project development are provided in the timeline below:
Date Activity 12 May 2010 Invitation to Stakeholders inviting public comment, Appendix 35 Draft Scoping
report Samancor Chrome Plant_FMT, December 2011, Appendix E3 14 September 2011 Notice of prior consideration submitted to the UNFCCC (Appendix 41) December 2011 Received proposal offer from TWP/Basil Read for the construction of the plant 20 December 2011 PDD completed by CDM Africa Climate Solutions (Pty) Ltd 29 December 2011 PDD published for Global Stakeholder Participation on UNFCCC website. 7 February 2012 Decision to proceed, Appendix 21 8 February 2012 PIN submitted to South African DNA (Appendix
80_Acknowledgement_PIN_DNA_FMT.pdf) 22 March 2012 Notice of prior consideration submitted to the South African DNA 1 March 2012 Letter of no objection received from the South African DNA (Appendix 49) Equipment has not been ordered and the construction of the project activity has not started at the time of validation. B.6. Emission reductions:
B.6.1. Explanation of methodological choices:
The baseline emissions for the year y shall be determined as follows:
yflstyEny BEBEBE ,, += (1)
Where: BEy = The total baseline emissions during the year y in tCO2 BEEn,y = The baseline emissions from energy generated by the project activity during the year y in
tCO2 BEflst,y = Baseline emissions from fossil fuel combustion 1. Baseline emissions from energy generated by the project activity (BEEn,y ) 1.1. No recovery on the waste gas streams in the absence of CDM project activity
1.1.1. Baseline emissions for baseline Scenarios 1 and 2
Baseline scenarios 1 and 2 represent the situation where the waste energy of waste gas streams used in the project is flared and the electricity is obtained from the grid.
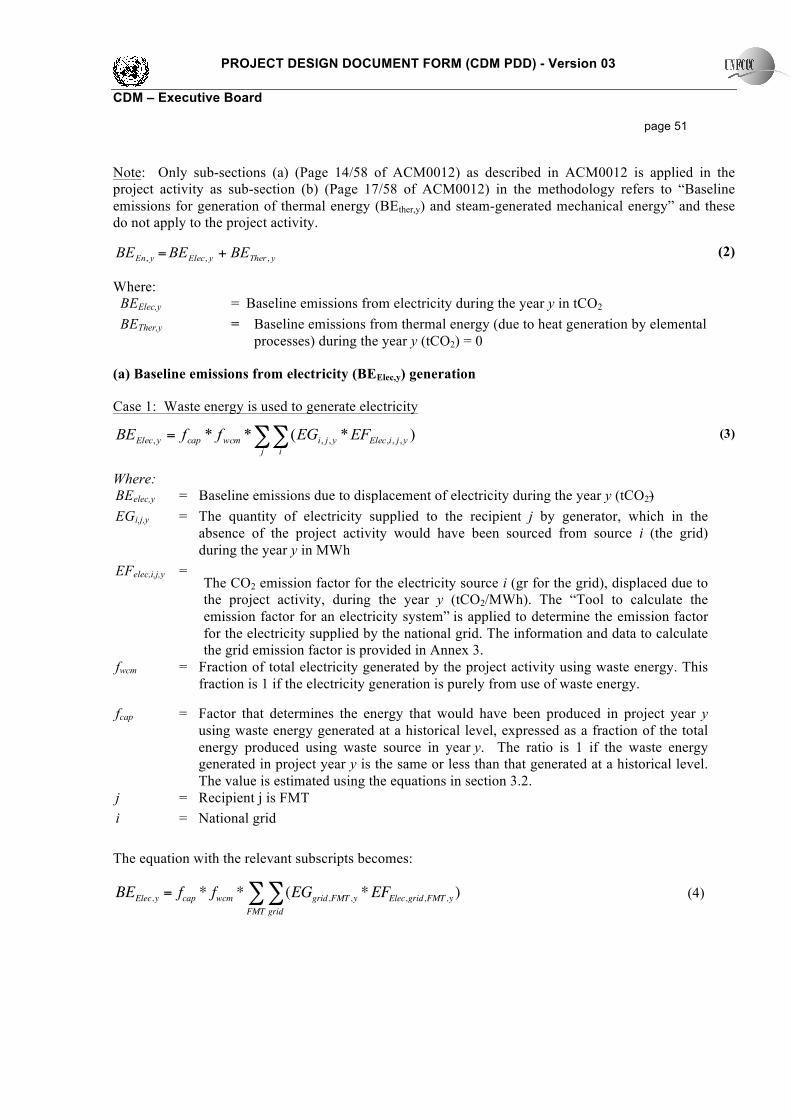
PROJECT DESIGN DOCUMENT FORM (CDM PDD) - Version 03 CDM – Executive Board page 51
Note: Only sub-sections (a) (Page 14/58 of ACM0012) as described in ACM0012 is applied in the project activity as sub-section (b) (Page 17/58 of ACM0012) in the methodology refers to “Baseline emissions for generation of thermal energy (BEther,y) and steam-generated mechanical energy” and these do not apply to the project activity.
yTheryElecyEn BEBEBE ,,, += (2)
Where: BEElec,y = Baseline emissions from electricity during the year y in tCO2 BETher,y = Baseline emissions from thermal energy (due to heat generation by elemental
processes) during the year y (tCO2) = 0
(a) Baseline emissions from electricity (BEElec,y) generation
Case 1: Waste energy is used to generate electricity
∑∑=j i
yjiElecyjiwcmcapyElec EFEGffBE )*(** ,,,,,, (3)
Where: BEelec,y = Baseline emissions due to displacement of electricity during the year y (tCO2) EGi,j,y = The quantity of electricity supplied to the recipient j by generator, which in the
absence of the project activity would have been sourced from source i (the grid) during the year y in MWh
EFelec,i,j,y = The CO2 emission factor for the electricity source i (gr for the grid), displaced due to the project activity, during the year y (tCO2/MWh). The “Tool to calculate the emission factor for an electricity system” is applied to determine the emission factor for the electricity supplied by the national grid. The information and data to calculate the grid emission factor is provided in Annex 3.
fwcm = Fraction of total electricity generated by the project activity using waste energy. This fraction is 1 if the electricity generation is purely from use of waste energy.
fcap = Factor that determines the energy that would have been produced in project year y using waste energy generated at a historical level, expressed as a fraction of the total energy produced using waste source in year y. The ratio is 1 if the waste energy generated in project year y is the same or less than that generated at a historical level. The value is estimated using the equations in section 3.2.
j = Recipient j is FMT i = National grid
The equation with the relevant subscripts becomes:
BEElec,y = fcap * fwcm * (EGgrid,FMT ,y *EFElec,grid,FMT ,y )grid
!FMT
!
(4)

PROJECT DESIGN DOCUMENT FORM (CDM PDD) - Version 03 CDM – Executive Board page 52
2. Baseline emissions from flaring of waste gas (BEflst,y)
A pilot flame fuelled by methane rich gas is used in the baseline scenario to ensure that proper combustion of the waste gas occurs. There is no plant specific historic data available to estimate the emissions from the use of the methane rich gas, therefore the emissions from this source shall be excluded from the baseline emissions (the conservative approach).
0, =yflstBE (5)
3. Estimation of various baseline factors fWCM = 1, since the electricity generation is purely from the use of waste gas.
3.1. Capping factors
ACM0012 requires the baseline emissions to be capped irrespective of planned or unplanned or actual increase in output of plant, change in operational parameters and practices, change in fuel type and quantity resulting in an increase in generation of waste energy. The cap can be estimated using the three methods described below, following this hierarchy:
(i) Method-1 can be used to estimate the capping factor if required data is available
The amount of information to apply Method-1 over a 3 year period is not available for FMT.
(ii) Also, it is not possible to determine the specific amount of waste gas produced historically per unit of production (Method-2 requirement), because of waste gas quality variability (refer to the information provided in the Box 1 below). According to ACM0012, in these cases, fcap is calculated based on indirect information about specific parameters allowing an estimate of the amount of waste energy available (Method-3). This is applied for FMT.
Case 1 in Method-3 as described in ACM0012 describes the project activity scenario for FMT: The energy is recovered from WECM (waste gas) and converted into final output energy (electricity) through a waste heat recovery equipment (Jenbacher engines). The useful energy (in this case waste gas) is produced by a chemical reaction (in this case a ferrochrome furnace). For such cases fcap should be the ratio of maximum energy that could be recovered (MER) by the waste heat recovery equipment implemented under the CDM project activity and the actual energy recovered under the project activity (using direct measurement). The MER is determined by considering the number and the design capacity of the engines. The number of engines that will be implemented by the project activity (20) is selected based on the outcome of the technical feasibility study (Appendix 11_Technical Feasibility Study Report_TWP for FMT_June 2012).

PROJECT DESIGN DOCUMENT FORM (CDM PDD) - Version 03 CDM – Executive Board page 53
fcap is estimated by applying the following equations:
(6)
Where: QOE,BL = Electricity that can be produced (GJ or TJ), to be determined on the basis of
maximum energy that could be recovered from the waste gas, which would have flared in the absence of CDM project activity.
QOE,y = Quantity of actual electricity generated during year y (GJ or TJ)
fcap =QOE,BL
QOE,y
Box 1: Waste gas variability
To demonstrate the variability (Appendix 70_F4&F5 gas trends) and sensitivity of the waste gas quality the following should be noted (Appendix 21, page 72 and 73):
- The volume and composition of the waste gas depends on the feed materials and their pretreatment methods, on the construction of the smelting furnace and on the furnace controls.
- The gas production varies both in time and place. It is affected by e.g. different temperatures, furnace electrical values, material flows, segregation, position of electrodes and the time to tapping.
- The contents of H2O and CO2 increase when using lumpy ore because of carbonates and hydroxides.
- Feed materials affect the gas composition in many ways: o The volatile matter in the raw material decomposes into the gas. The moisture of the
batch evaporates into the gas also, but in the cold batch the moisture and the hydroxides of the feed also react with the carbon and form hydrogen through water gas reaction, H2O + C = H2 + CO. CO2 from carbonates can react with carbon through the Boudouard reaction, CO2 + C = 2CO, which is a highly endothermic reaction.
o The reduction behaviour of the decomposition reactions affects the coke utilisation and the amount and analysis of the gas.
- The pre-treatment methods of the feed materials also have an effect. The feed materials can be pre-dried, pre-heated or as in some solutions, pre-reduced. Every step decreases the amount of gas formed in smelting and affects the analysis by reducing gas components from evaporation, decomposition and reduction reactions. The concentrate can be pelletised and sintered at high temperatures.
The characteristics of sintered pellets due to Fe3+ combined with the preheating of the smelting charge has the effect that reduction starts in the smelting burden in the upper part of the burden by the CO-gas coming from the lower parts. The carbon dioxide in the off-gas increases, decreasing the carbon monoxide correspondingly.

PROJECT DESIGN DOCUMENT FORM (CDM PDD) - Version 03 CDM – Executive Board page 54
Determination of QOE,BL
Electricity that can be produced (GJ or TJ), to be determined on the basis of maximum energy that could be recovered from the waste gas, which would have flared in the absence of CDM project activity. The maximum energy that could be recovered from the waste gas is limited by the installed capacity of the power plant. The amount of electricity that can be produced (MWh) from the maximum amount of waste gas available over a year is determined by multiplying the engine planned uptime (97%) by engine availability (90%) by the plant capacity (1.698 MW x 14 engines) by furnace operating rate (95.06%) over a year. Note that the design of the plant is such that there will always be an excess amount of waste gas that will be flaring. It is an operational requirement that some gas must always be flared because the gas pressure in the lines to the engines has to be controlled within a very narrow pressure range to ensure the engines function well. The only way in which this pressure can be controlled is by flaring excess gas via the main pressure control valve at the flare. So by design every GJ of waste gas produced cannot be used for power generation. QBL = 0.97 x 0.90 x 1.698 x 14 x 0.9506 x 365 x 24 x 3.6 (Refer to CER Calculation spreadsheet, Baseline Emissions, Cell D36 to M37)
= 622,134.6 GJ
References:
Engine planned uptime (97%) - Appendix 43_Calculated uptime based on Jenbacher scheduled maintenance specification, Page 1
Engine availability (90%) - Appendix 29 _Jenbacher Maintenance Offer, Page 2 of 3
Plant capacity (1.698 MW x 14 engines) - Appendix 6_Jenbacher Specification Sheet_620_F57.pdf, Page 1
Furnace operating rate (95.06%) – See financial spreadsheet, Inputs_Production, Cell F25 and Appendix 23_TWP Project Specification Report
3.6 = Conversion factor from MWh to GJ
Project emissions
Project Emissions include emissions due to electricity imported from the grid during start-up of the power plant and during times when none of the engines are in operation. During these times, electricity will be used by air conditioning equipment, lighting the control system and general office consumption. When the engines are in operation, this electricity will be supplied from the engines using waste gas.
yELyAFy PEPEPE ,, += (7)

PROJECT DESIGN DOCUMENT FORM (CDM PDD) - Version 03 CDM – Executive Board page 55
Where: yPE = Project emissions due to the project activity (tCO2)
yAFPE , = Project activity emissions from on-site consumption of fossil fuels by the unit process if they are used as supplementary fuels due to non-availability of waste energy to the project activity or due to any other reason (tCO2)
yELPE , = Project activity emissions from on-site consumption of electricity for gas cleaning equipment or other supplementary electricity consumption (tCO2) (as per Table 1: Summary of gases and sources included in the project boundary)
Note: No auxiliary fossil fuel will be used to supplement the waste energy in the project activity. Therefore, there are no project emissions due to auxiliary fossil fuel combusted to supplement waste energy in the project activity.
PEAF,y = 0. (8)
Project emissions due to electricity consumption of gas cleaning equipment or other supplementary electricity consumption
The electricity that will run the gas conditioning and other equipment will be supplied from the gas engines.
Main electricity meters and check electricity meters will be installed on the 11kV feeders to FMT, which will have reverse metering capability to measure the amount of electricity used by the power plant during plant start up (when electricity from the grid will be used just to start up the plant). Only the net electricity generated to FMT will be used to determine the emission reductions for the project activity (Net electricity generated is equal to the total electricity generated minus the electricity imported from the grid for start up occasions). PEL,y is therefore not determined separately as the electricity imported from the national grid is already accounted for when determining the net electricity generated by the proposed project activity.
No backup equipment will be installed in the case that the power plant experiences outages or abnormal conditions. Also, no fossil fuel will be used for backup purposes of any kind in the power plant to generate electricity.
Therefore:
PEEL,y = 0. (9)
The gas engines will supply power to an 11kV board. There will be a feed from this board to a transformer, which will supply a 400V (or 525V) board. Electricity for all the motors for the new equipment will be fed from the 400V board. The electricity that is sent from the gas engine power plant to the FMT board is therefore the NETT electricity generated by the power plant and not the GROSS electricity.
The exception to the situation described in the paragraph above is during plant start-up. For this, the electricity feed will be reversed from FMT into the 11kV board and then to the 400V board. Electricity consumed from FMT (grid electricity) is therefore automatically deducted from the electricity generated by the meter to provide the net electricity generated by the power plant.
Leakage
No leakage is applicable under this methodology.

PROJECT DESIGN DOCUMENT FORM (CDM PDD) - Version 03 CDM – Executive Board page 56
Emission reductions
Emission reductions due to the project activity during the year y are calculated as follows:
yyy PEBEER −= (10)
Where: yER = Total emissions reductions during the year y in tons of CO2
yPE = Emissions from the project activity during the year y in tons of CO2
yBE = Baseline emissions for the project activity during the year y in tons of CO2
B.6.2. Data and parameters that are available at validation: Data / Parameter: EGm,y Data unit: MWh Description: Net quantity of electricity generated and delivered to the grid by power unit m
in year y Source of data used: Calculated based on the national utility information for the South African
national grid Value applied: Refer to Annex 3, Table 22: Electricity generation information for the power
plants in the grid used in the operating margin Justification of the choice of data or description of measurement methods and procedures actually applied :
Official statistics, publicly available and reliable data source
Any comment: The data for the three most recent reporting years is provided. Data / Parameter: FCi,m,y Data unit: mass or volume unit Description: Amount of fossil fuel type i consumed by power unit m in year y (Mass or
volume unit) Source of data used: Calculated based on the national utility information for the South African
national grid Value applied: Refer to Annex 3, Table 23: Power stations in the Operating Margin Justification of the choice of data or description of measurement methods and procedures actually applied :
Official statistics, publicly available and reliable data source
Any comment: The data for the three most recent reporting years is provided. Data / Parameter: EFGRID,CM,y Data unit: tCO2 / MWh Description: Emission factor of the national electrical grid for the year y

PROJECT DESIGN DOCUMENT FORM (CDM PDD) - Version 03 CDM – Executive Board page 57
Source of data used: Calculated based on the national utility information for the South African national grid and IPCC information where applicable, GEF spreadsheet, Sheet “OM”, Cell I10
Value applied: 0.9880 Justification of the choice of data or description of measurement methods and procedures actually applied :
The EFGRID,CM,y is calculated according to the ‘Tool to calculate the emission factor for an electricity system’. The Simple OM method is used to calculate the Operating margin (using the ex-ante option); with the Build Margin also calculated ex-ante based on the most recent information.
Any comment: None Data / Parameter: EFCO2,i,y Data unit: tCO2/GJ Description: CO2 emission factor of fossil fuel type i in year y Source of data used: IPCC default values at the lower limit of the uncertainty at a 95% confidence
interval as provided in table 1.4 of Chapter1 of Vol. 2 (Energy) of the 2006 IPCC Guidelines on National GHG Inventories. For the sake of a conservative approach the IPCC default value at the lower limit of the uncertainty at a 95% confidence interval is used. For Coal, 0.0895 (t CO2/GJ), GEF spreadsheet, Sheet, ‘DV’, Cell M31 For Other Kerosene: GEF spreadsheet, Sheet, ‘DV’, Cell M14
Value applied: Bituminous Coal: 2008/9 to 2011: 0.0895 (t CO2/GJ), for other bituminous at the lower limit. Other Kerosene 2008/9 to 2011: 70.8tCO2/TJ
Justification of the choice of data or description of measurement methods and procedures actually applied :
Some information is available about the various coal resources in South Africa, all of which is classified as bituminous. However, sufficient information is not available for each coal fired power station and therefore the IPCC default is applied. Refer to Appendix 30: ‘Future_of_South_African_Coal’, Section 2 “Overview of South African coal sector”, page 2 where it is mentioned that: “South Africa’s economically recoverable coal reserves are estimated at between 15 and 55 billion tonnes. 96% of reserves are bituminous coal; metallurgical coal accounts for approximately 2% and anthracite another 2%. Production is mainly steam coal of bituminous quality.”
Any comment: Value applied as a constant. Data / Parameter: NCVi,y Data unit: GJ/mass or volume unit Description: Net calorific value (energy content) of fossil fuel type i in year y Source of data used: • For coal: Eskom published data, Source: Appendix 66_Eskom

PROJECT DESIGN DOCUMENT FORM (CDM PDD) - Version 03 CDM – Executive Board page 58
Integrated Report 2011, page 324. See GEF spreadsheet, Sheet Base_Data, Cells S12, T12 and U12.
• For Other Kerosene: IPCC default values at the lower limit of the uncertainty at a 95% confidence interval as provided in Table 1.2 of Chapter 1 of Vol. 2 (Energy) of the 2006 IPCC Guidelines on National GHG Inventories. See GEF spreadsheet, Sheet ‘DV’, Cell D14
Value applied: Coal (GJ/ton) 2008/9 – 19.1 2009/10 – 19.22 2010/11 – 19.5 Other Kerosene –42.4GJ/ton
Justification of the choice of data or description of measurement methods and procedures actually applied :
As per “Tool to calculate the emission factor for an electricity system”
Any comment: Information is used to calculate the combined margin emission factor Data / Parameter: EFELm,y Data unit: tCO2/MWh Description: CO2 emission factor of power unit m in year y (tCO2/MWh) Source of data used: Calculated from the information published by the national utility in South
Africa. Annex 3, Table 24: Calculation of the Operating Margin emission factor, Refer to GEF spreadsheet, sheet “OM”, Cells D(15:40), F(15:40), H(15:40)
Value applied: Please refer to Annex 3, Table 24: Calculation of the Operating Margin emission factor, Refer to GEF spreadsheet, sheet “OM”, Cells D(15:40), F(15:40), H(15:40) for all the values
Justification of the choice of data or description of measurement methods and procedures actually applied :
The three most recent years prior to the project implementation were used to calculate the factor as required by the Tool to calculate the grid emission factor.
Any comment: As per the Tool to calculate the grid emission factor Data / Parameter: QOE,BL Data unit: GJ Description: Energy (electricity) that can be produced determined on the basis of engine
design and maximum usable energy that could be recovered from the waste gas, which would have flared in the absence of CDM project activity.
Source of data used: Genset supplier information and operational data from FMT Value applied: 622,134.6 GJ Justification of the The types and levels of service: Jenbachers will be implemented delivering an

PROJECT DESIGN DOCUMENT FORM (CDM PDD) - Version 03 CDM – Executive Board page 59
choice of data or description of measurement methods and procedures actually applied :
estimated 172,815 MWh per year (total electricity not accounting for parasitic load). This is calculated taking into account equipment availabilities (furnaces and gensets) and load factors. See financial model spreadsheet, Inputs_Production, Cell F149. The MWh is then multiplied by 3.6 to convert to GJ.
Any comment: Data / Parameter: fwcm Data unit: Unitless Description: Fraction of total electricity generated by the project activity using waste energy. Source of data used: Project design information Value applied: 1 Justification of the choice of data or description of measurement methods and procedures actually applied :
This fraction is 1 because the electricity generation is purely from use of waste gas.
Any comment: -
B.6.3. Ex-ante calculation of emission reductions:
The baseline emissions (BE!) were calculated using equation (1): BE! = BE!",! + BE!"#$,! where BEflst,y = 0 The baseline emissions from the energy generated by the project activity BEEN,y were calculated using equation (2): BE!",! = BE!"#$,! + BE!"#$,! where BETher,y = 0 BEElec,1 to 10 = BEN,y = BEy = 157,166 ton CO2 fcap was calculated using equation (6):
For demonstation purposes, it is assumed that the amount of electricity generated is equal to the amount that is theoretically possible to be produced, based on the maximum energy that could be recovered from the waste gas.
fcap =QOE,BL
QOE,y

PROJECT DESIGN DOCUMENT FORM (CDM PDD) - Version 03 CDM – Executive Board page 60
𝑓!"# = 622,134.6622,134.6
𝑓!"# = 1
∑∑=FMT grid
yFMTgridElecyFMTgridwcmcaptoElec EFEGffBE )*(** ,,,,,101,
BEElec,1to10 = 1 x 1 x 159,075
x 0.9880
BEElec,1 to10
= 157,166 t CO2 per year
BE
Elec,1 to10= BEElec,1 to 10 = BEEN,y = BEy = 157,166 t CO2 per year
Project emissions were calculated using equation (8):
yELyAFy PEPEPE ,, += where PEAF,y = 0 as described previously and PEEL,y is zero because it is already
accounted for in the net generation of electricity to FMT. PEy is therefore zero.
B.6.4 Summary of the ex-ante estimation of emission reductions:
Year
Estimation of project activity
emissions (tonnes of CO2 e)
Estimation of baseline
emissions (tonnes of CO2 e)
Estimation of leakage
(tonnes of CO2 e)
Estimation of overall emission
reductions (tonnes of CO2 e)
1 0 157,166 0 157,166
2 0 157,166 0 157,166
3 0 157,166 0 157,166
4 0 157,166 0 157,166
5 0 157,166 0 157,166
6 0 157,166 0 157,166
7 0 157,166 0 157,166
8 0 157,166 0 157,166
9 0 157,166 0 157,166
10 0 157,166 0 157,166
Total (tonnes of CO2
0 1,571,661 0 1,571,661
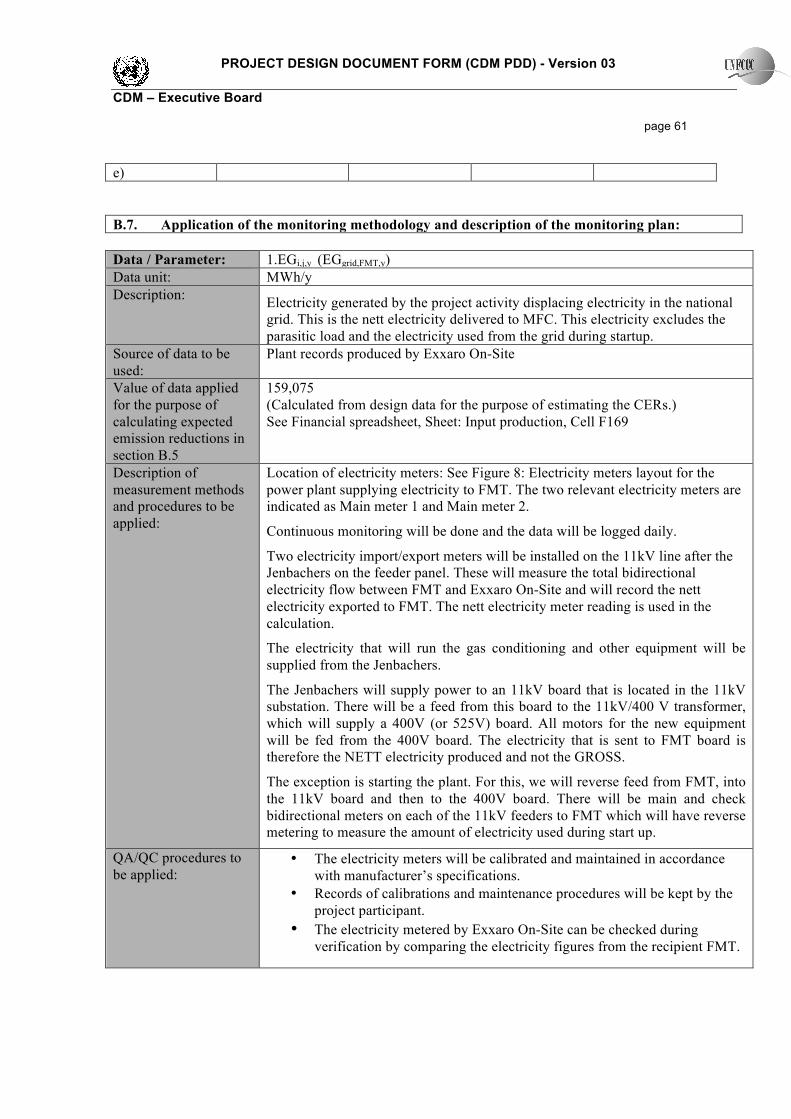
PROJECT DESIGN DOCUMENT FORM (CDM PDD) - Version 03 CDM – Executive Board page 61
e) B.7. Application of the monitoring methodology and description of the monitoring plan: Data / Parameter: 1.EGi,j,y (EGgrid,FMT,y) Data unit: MWh/y Description: Electricity generated by the project activity displacing electricity in the national
grid. This is the nett electricity delivered to MFC. This electricity excludes the parasitic load and the electricity used from the grid during startup.
Source of data to be used:
Plant records produced by Exxaro On-Site
Value of data applied for the purpose of calculating expected emission reductions in section B.5
159,075 (Calculated from design data for the purpose of estimating the CERs.) See Financial spreadsheet, Sheet: Input production, Cell F169
Description of measurement methods and procedures to be applied:
Location of electricity meters: See Figure 8: Electricity meters layout for the power plant supplying electricity to FMT. The two relevant electricity meters are indicated as Main meter 1 and Main meter 2.
Continuous monitoring will be done and the data will be logged daily.
Two electricity import/export meters will be installed on the 11kV line after the Jenbachers on the feeder panel. These will measure the total bidirectional electricity flow between FMT and Exxaro On-Site and will record the nett electricity exported to FMT. The nett electricity meter reading is used in the calculation.
The electricity that will run the gas conditioning and other equipment will be supplied from the Jenbachers.
The Jenbachers will supply power to an 11kV board that is located in the 11kV substation. There will be a feed from this board to the 11kV/400 V transformer, which will supply a 400V (or 525V) board. All motors for the new equipment will be fed from the 400V board. The electricity that is sent to FMT board is therefore the NETT electricity produced and not the GROSS.
The exception is starting the plant. For this, we will reverse feed from FMT, into the 11kV board and then to the 400V board. There will be main and check bidirectional meters on each of the 11kV feeders to FMT which will have reverse metering to measure the amount of electricity used during start up.
QA/QC procedures to be applied:
• The electricity meters will be calibrated and maintained in accordance with manufacturer’s specifications.
• Records of calibrations and maintenance procedures will be kept by the project participant.
• The electricity metered by Exxaro On-Site can be checked during verification by comparing the electricity figures from the recipient FMT.

PROJECT DESIGN DOCUMENT FORM (CDM PDD) - Version 03 CDM – Executive Board page 62
Any comment: The monitoring process and equipment for this procedure is standard. The above data will be kept for a minimum of two years after the end of the crediting period or the last issuance of CERs for this project activity, whichever occurs later.
Data / Parameter: 2. QOE,y Data unit: GJ Description: Quantity of actual energy output generated during year y, i.e. the gross electricity
generated by the Jenbacher engines from waste gas not taking into account the parasitic load of the power plant.
Source of data to be used:
Power plant process data
Value of data applied for the purpose of calculating expected emission reductions in section B.5
622,134.6
Description of measurement methods and procedures to be applied:
Continuous monitoring will be done by the installed electricity meters and the data will be logged daily. Location of electricity meters: See Figure 8. The following meter readings are used: Main meter 1 and Main meter 2, showing total export electricity to the MFC substation plus the electricity metered by the parasitic load meter. The sum of these three readings provides the total electricity generated by the Jenbachers. The meter readings will be in MWh units and will be multiplied by 3.6 to get GJ.
QA/QC procedures to be applied:
• The electricity meters will be calibrated and maintained in accordance with manufacturer’s specifications.
• The electricity metered can be checked during verification by comparing the electricity figures from the recipient power plant.
Any comment: The above data will be kept for a minimum of two years after the end of the crediting period or the last issuance of CERs for this project activity, whichever occurs later.

PROJECT DESIGN DOCUMENT FORM (CDM PDD) - Version 03 CDM – Executive Board page 63
Data / Parameter: 3. ECPJ,y Data unit: MWh Description: Additional electricity consumed in year y for project related equipment (gas
conditioning equipment) during start up that is supplied by the national grid through FMT. Note that the electricity supply to the power plant is provided by the Jenbachers, i.e. the power plant parasitic load will be provided by the Jenbachers running on waste gas.
Source of data to be used:
Exxaro On-Site
Value of data applied for the purpose of calculating expected emission reductions in section B.5
Zero
Description of measurement methods and procedures to be applied:
Continuous monitoring will be done and the data will be logged daily.
Location of electricity meters: See Figure 8 (FMT) for the layout of the electricity meters.
The following meter readings are used: Main meter 1 and Main meter 2.
These two electricity import/export meters will be installed on the 11kV line after the Jenbachers on the feeder panel. These will measure the total bidirectional electricity flow between FMT and Exxaro On-Site and will record the electricity imported to FMT during start up.
The electricity that will run the gas conditioning and other equipment will be supplied from the Jenbachers.
The Jenbachers will supply power to an 11kV board. There will be a feed from this board to a transformer, which will supply a 400V (or 525V) board. All motors for the new equipment will be fed from the 400V board.
During start up we will reverse feed from FMT, into the 11kV board and then to the 400V board. There will be main and check bidirectional meters on the 11kV feeders to FMT which will have reverse metering to measure the amount of electricity used during start up.
QA/QC procedures to be applied:
The electricity meters will be calibrated and maintained in accordance with manufacturer’s specifications. The electricity meter reading will be checked against the individual electricity readings from each engine.
Any comment: The above data will be kept for a minimum of two years after the end of the crediting period or the last issuance of CERs for this project activity, whichever occurs later.

PROJECT DESIGN DOCUMENT FORM (CDM PDD) - Version 03 CDM – Executive Board page 64
Data / Parameter: 4. fcap Data unit: Unitless Description: Energy that would have been produced in project year y using waste heat
generated in base year expressed as a fraction of total energy produced using waste heat in year y.
Source of data to be used:
Calculated
Value of data applied for the purpose of calculating expected emission reductions in section B.5
1.0
Description of measurement methods and procedures to be applied:
The relevant fcap will be determined prior to each verification according to the calculation procedure described by ACM0012.
QA/QC procedures to be applied:
Any comment: The above data will be kept for a minimum of two years after the end of the crediting period or the last issuance of CERs for this project activity, whichever occurs later.
Data / Parameter: 5. Record of abnormal or emergency events in the project facility Data unit: Number and duration Description: Record of abnormal/emergency events that occurs in the project facility Source of data to be used:
Exxaro On-Site
Value of data applied for the purpose of calculating expected emission reductions in section B.5
The project facility process control system will have an archive capability where all process data, including alarms and operator actions (like setpoint changes), will be continuously stored for later retrieval into plant reports. Abnormal and emergency events and corrective actions will also be manually recorded in an operator’s log.
Description of measurement methods and procedures to be applied:
Abnormal events can be cross-checked with electricity generation. Alarm lists will be automatically generated for weekly and monthly analysis and incorporation into the Monthly Operations Report that will be compiled by the Plant Manager. The loss of power generation associated with the abnormal events will also be captured in the Monthly Operations Report.
QA/QC procedures to be applied:
Abnormal events can be cross checked with electricity generation, i.e. the DOE will be able to confirm that no electricity is generated during abnormal events by cross checking the times and duration of abnormal events with electricity generation data.
Any comment: Abnormal and upset conditions at the power plant will be as a result of off gas quality (composition and temperature) or quantity (pressure). Fluctuations in these parameters always involve the de-loading or stopping of engines due to the automated engine protection systems that are part of the plant design and will thus result in a reduction or stoppage of electricity generation. Other protection

PROJECT DESIGN DOCUMENT FORM (CDM PDD) - Version 03 CDM – Executive Board page 65
systems that will also stop or de-load the engines are engine room temperature control, cooling water temperature control and the fire detection system. During abnormal conditions the waste gas is flared through the stack as is done in the current scenario. The waste gas will not be routed to the engines during these conditions as the engines will be de-loaded or stopped and therefore electricity will not be produced during abnormal conditions and emissions reductions will not be claimed.
B.7.2. Description of the monitoring plan: 7.2.1 Management structure for the facility during construction is provided in Figure 6.
The ultimate responsibility for the construction of the waste gas to electricity plant lies with Exxaro On-Site. Exxaro On-Site will have a project manager on site who will oversee the Exxaro On-Site team.
Figure 6: Management structure during construction of the proposed project actvity 7.2.2 Management structure for the facility during operation is provided in Figure 7 below. After commissioning of the waste gas to electricity plant, Exxaro On-Site is responsible for the operation and maintenance of the site.
ProjectManager
Project Services Manager
Construction Manager
Site Supervisor - CivilSite Supervisor - StructuralSite Supervisor - MechSite Supervisor - E&ISite Supervisor - SHERQDocument ControllerSite PlannerSite Secretary
Project Services
Team
Exxaro On-Site
EPC Contractor
Owners Engineer
Commercial Manager
Commercial Team
EngineeringManager
EngineeringTeam
Sub-contractors
Exxaro On-Site Project Manager
Commercial Manager
Project Services
Team

PROJECT DESIGN DOCUMENT FORM (CDM PDD) - Version 03 CDM – Executive Board page 66
Figure 7: Management structure of the proposed project activity after commissioning 7.2.3 Responsibility The responsibility for monitoring lies with Exxaro On-Site (EOS), who will operate the proposed project activity. EOS will be directly responsible for monitoring and reporting the relevant information. EOS will oversee the monitoring in partnership with relevant parties (e.g. MFC, consultants and EPC contractor when necessary). EOS staff will be monitoring, reporting and compiling records of generated electricity, and all other parameters. 7.2.4 Monitoring Equipment Electricity meters will measure the nett quantity of electricity generated by the project activity and supplied to FMT. These meters are 4-quadrant billable class meters that are bi-directional – this means that they subtract any electricity used by the plant during start up, or when the plant is not producing electricity.
(i) Data to be monitored during the crediting period The following data will be monitored by Exxaro On-Site:
• Quantity of electricity supplied to FMT (MWh); • Electricity consumption (import) of additional plant equipment used in the project activity during
start-up (MWh); • Quantity of actual energy output generated during year y (GJ or TJ); • Fcap will be determined for verification purposes; • Abnormal conditions are monitored as described in the monitoring parameters.
O&M STRUCTURE ‐ Plant
Plant Manager
Junior Operators1 per shift
5 shifts
Senior Operators1 per shifts
5 shifts
E&ITechnican
Maintenance Superintendant
Engine Specialist
Admin / Reporting
ClerkCleaner
Exxaro On-Site
External parties
Service Level Agreements
Equipmentproviders
(Maintenance Agreements)
Support Services
ITHRFinanceCDM verificationSecurityTechnical services

PROJECT DESIGN DOCUMENT FORM (CDM PDD) - Version 03 CDM – Executive Board page 67
(ii) Equipment
Electricity meters will measure the quantity of electricity supplied to FMT and the amount of electricity used for parasitic load and the amount of electricity imported from FMT for cold startups. These meters are 4-quadrant billable class meters that are bi-directional – this means that they subtract any electricity used by the plant during start up, or when the plant is not producing electricity. Two electricity meters will be installed on the electrical feeds to FMT – one main meter and one check meter. The metering configuration is illustrated in Figure 8 below. Figure 8: Electricity meters layout for the power plant supplying electricity to FMT
(iii) Capabilities of meters
!"#$%&'()*+(,,(-.($/01$23%4&(
!!"#$"%&'%()*+,"
!-"./,')01/2"3,45,/%"6"!!"#$78-"9:" ;)%"0+,<5*+,5,4"),<"=)>),0/?+@?
A>),("
-BB"$"9CC"
556,,(-.(
273&$8479:7(
;<:=-(9:2:7((
*3#&(9:2:7(
55(-.6>??.(273&$8479:7(
@4A:7(@B3&2(C4/&D37E(
D/22+E/()>%":)%(/"3,/24F"G/0+H/2F"3>/0(250)>"I5)42)E"
@4A:7(FB3&2(
3/"#B#37E(
F4A:7($/FFBE(
@373$#%=(B43D(9:2:7(

PROJECT DESIGN DOCUMENT FORM (CDM PDD) - Version 03 CDM – Executive Board page 68
The Facility Metering Installation and the System Metering Installation shall be capable of measuring and recording the following parameters for various time and frequency blocks:
• Energy Output and Reactive Energy Output; • Instantaneous voltage, current and power factor; • Frequency; • Maximum demand in MVA/MW for each demand period and for the total period since the last
reset; • MWh/MVARh since last reading; • Real time and time of day metering; and • Number of resets.
The Metering Installation shall have the capability to download and transmit such real time data to a Supervisory Control and Data Acquisition ("SCADA") system, in a form and format suitable for SCADA. (iv) Physical inspections and calibration
The maintenance superintendent will is responsible to do physical inspections and calibration of the measurement equipment, its transmitters and the control system on a frequent basis to ensure readings remain within the accuracy levels required. Physical inspections and calibration frequencies will be logged onto the shift inspection report sheets when performed and stored. (v) Monitoring accuracy The electricity meters will be fitted with a data transmitter, and the data will be fed into the plant control system on a daily basis. The main and check meters will be reconciled daily to check if their readings are within a pre-defined accuracy band. If there are discrepancies, then a notification will be sent to the control room to advise the operator to attend to a problem with the meters. (vi) Data collection and storage On a monthly basis, the power plant manager (or other designated employee) and a representative from MFC will read the two main electricity meters to determine the quantity of electricity produced by the plant. This will be done by adding the readings from the two main meters. The electricity readings will be logged electronically for the purposes of calculating emission reductions. The information will be saved onto the power plant Supervisory Control and Data Acquisition (SCADA) system, as well as Exxaro On-site financial systems. Backups will be kept both on- and off-site, and all of the data will be available for CDM verification. All electronic and hard copy records of the metering devices, relevant documentation and the results of calibration will be collected in a central place by the project entity. Data record will be archived for a period of 2 years after the crediting period to which the records pertain. (vii) Readings and inaccuracy

PROJECT DESIGN DOCUMENT FORM (CDM PDD) - Version 03 CDM – Executive Board page 69
EOS shall be responsible for retrieving and analysing data from the Facility Metering Installation. Should any of the meters fail to register or, upon testing, be found to have a level of inaccuracy falling outside the maximum tolerance level, then the meter shall be recalibrated and the Energy Output from (a) the electricity generation units or (b) the Project, shall be measured on the basis of the readings registered by MFC. Should both the EOS and the MFC meters fail to register or, upon testing, be found to have a level of inaccuracy falling outside the maximum tolerance level, then each of the metering systems shall be recalibrated, and the Energy Output from (a) the electricity generation units.
(viii) Quality Assurance /Quality Control Procedures
The following quality assurance/quality control procedure will be applied in order to increase the reliability of the monitored data:
• The operators will be trained on CDM procedures. • The operators will be trained on data recording procedures in the logbook (used for reporting any
abnormal circumstances). • The supervisor will check the recorded data and sign off on the logbook on a daily basis. • The plant manager will ensure that an audit is carried out of the electricity distribution
information at least once during the monitoring period. The audit may verify the data on electricity generation by crosschecking monthly electricity invoices to MFC or spot-checking the electricity reading of electricity meter/s.
• Physical inspections of monitoring equipment and calibration frequencies will be logged onto the shift inspection report sheets when performed and stored.
• Audit o Monthly net electricity supply and consumption data will be approved and signed off by
the EOS Plant Manager before it is accepted and stored. o The Plant manager cross-checks meter readings from the EOS Metering Installation and
sales receipts, and also compares the data with the meter reading from the MFC Metering Installation.
o The Plant Manager also checks the validity of the calibration certificates of the electricity meters. If the data is correct and the meters calibrated, the data is approved, signed off and stored. If any errors are identified, such errors will be described and corrected, prior to approval, sign off and storage of the corrected data and error descriptions. This internal audit will also identify potential improvements to procedures to improve monitoring and reporting in future years.
7.2.5 Record Handling
Appendix 16 describes the record handling procedure. As per methodology ACM0012, all data collected as part of the monitoring plan will be archived electronically, and will be kept for a minimum if two years at the end of the crediting period.
PROJECT DESIGN DOCUMENT FORM (CDM PDD) - Version 03 CDM – Executive Board page 70
B.8. Date of completion of the application of the baseline study and monitoring methodology and the name of the responsible person(s)/entity(ies): Date of completion of the application of the methodology to the project activity study: 20/12/2011 Contact Information: Ciska Terblanche and Johan van den Berg CDM Africa Climate Solutions (Pty) Ltd 407 Juliana Princess Place Parktown South Africa [email protected] +27828985750 CDM Africa is not a project participant listed in Annex 1. SECTION C. Duration of the project activity / crediting period C.1. Duration of the project activity: C.1.1. Starting date of the project activity:
15 December 2012
The starting date for the project activity is when the first deposit is paid or when an conract is signed with the equipment supplier to provide the equipment. C.1.2. Expected operational lifetime of the project activity: 16 Years 6 months C.2. Choice of the crediting period and related information: C.2.1. Renewable crediting period: C.2.1.1. Starting date of the first crediting period: Not applicable C.2.1.2. Length of the first crediting period: Not applicable

PROJECT DESIGN DOCUMENT FORM (CDM PDD) - Version 03 CDM – Executive Board page 71
C.2.2. Fixed crediting period: C.2.2.1. Starting date:
01 February 2014
The expected date for the completed commissioning period. Refer to Appendix 23, page 19 of 19, Table 6- Project schedule, TWP section
C.2.2.2. Length:
10 Years 0 Months
SECTION D. Environmental impacts The Environmental Impact Assessment is undertaken in terms of the National Environmental Management Act No 107 of 1998 (NEMA) as amended and the Environmental Impact Assessment Regulations, 2010 [As corrected by “Correction Notice 1” (GN No. R660 of 30 July 2010) and “Correction Notice 2” (GN No. R 1159 of December 2010) for the proposed project. D.1. Documentation on the analysis of the environmental impacts, including transboundary impacts: Impacts of the proposed project activity on the following areas were assessed in the EIA:
- Noise - Water - Construction Waste - Atmospheric emissions from the power plant - Domestic waste - Staffing requirements - Transportation - Stormwater management - Environmental management - Health and Safety requirements - Social responsibility
No transboundary impacts were identified in the environmental impact study. Status of the EIA as of 31 May 2012: The EIA is in the finalisation of scoping report following public comment phase. D.2. If environmental impacts are considered significant by the project participants or the host Party, please provide conclusions and all references to support documentation of an environmental impact assessment undertaken in accordance with the procedures as required by the host Party: Conclusions:

PROJECT DESIGN DOCUMENT FORM (CDM PDD) - Version 03 CDM – Executive Board page 72
No environmental fatal flaws were identified to be associated with the proposed Exxaro On-Site energy facility. A number of issues requiring mitigation have been highlighted. Environmental specifications for the management of potential impacts are detailed within the draft Environmental Management Plan (EMP) included within the Draft Scoping Report. SECTION E. Stakeholders’ comments The environmental impact assessment (EIA) for the proposed Exxaro On-Site Energy Facility has been undertaken in accordance with the EIA Regulations published in Government Notice 28753 of 21 April 2006, in terms of Section 24(5) of the National Environmental Management Act (NEMA; Act No 107 of 1998). No environmental fatal flaws were identified to be associated with the proposed Exxaro On-Site energy facility. A number of issues requiring mitigation have been highlighted. Environmental specifications for the management of potential impacts are detailed within the draft Environmental Management Plan (EMP) included within the Draft Scoping Report. E.1. Brief description how comments by local stakeholders have been invited and compiled: Public participation process
• A public open day meeting was held on 1 June 2010 in Witbank to inform stakeholders of the proposed project and to discuss any relevant issues. Stakeholders had the opportunity to highlight issues at the meeting which were noted.
• Public notices to invite stakeholders to the open day were put up at several locations in Witbank. • Stakeholders also provided written comments by fax to SRK. • September 2010 – The Issues and Responses Report was published by the SRK,
addressing all the issues that were raised by stakeholders42.
E.2. Summary of the comments received: No relevant comments or questions were received relating to CDM or the CDM process. The comments and requests for information covered the creation of employment and air quality issues mostly43.
42 Annex 35 Report Number 408836, Draft Scoping Report for the proposed development of an Energy Recovery Plant at the Samancor Chrome Ferrometals Plant, Ferrobank, December 2011, Appendix G 43 Annex 35 Report Number 408836, Draft Scoping Report for the proposed development of an Energy Recovery Plant at the Samancor Chrome Ferrometals Plant, Ferrobank, December 2011, Appendix G

PROJECT DESIGN DOCUMENT FORM (CDM PDD) - Version 03 CDM – Executive Board page 73

PROJECT DESIGN DOCUMENT FORM (CDM PDD) - Version 03 CDM – Executive Board page 74
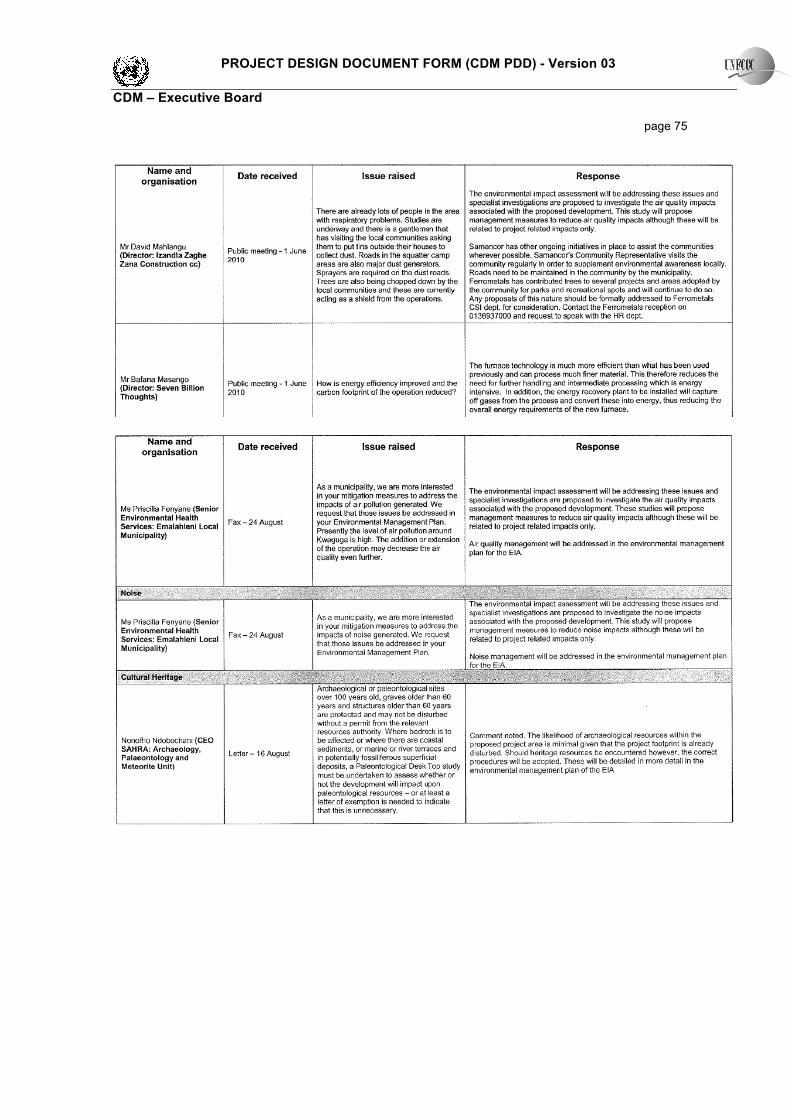
PROJECT DESIGN DOCUMENT FORM (CDM PDD) - Version 03 CDM – Executive Board page 75

PROJECT DESIGN DOCUMENT FORM (CDM PDD) - Version 03 CDM – Executive Board page 76
E.3. Report on how due account was taken of any comments received: The independent consultant managing the EIA process, SRK, responded to all the comments received by stakeholders.

PROJECT DESIGN DOCUMENT FORM (CDM PDD) - Version 03 CDM – Executive Board page 77
Annex 1
CONTACT INFORMATION ON PARTICIPANTS IN THE PROJECT ACTIVITY Organization: Exxaro On-Site Street/P.O.Box: 20 Peter Place Building: Coral House, 1st floor City: Bryanston State/Region: Gauteng Postcode/ZIP: Country: South Africa Telephone: +27(11)4639718 FAX: +27(0)866471775 E-Mail: URL: Represented by: Title: Director Salutation: Mr Last name: Posthumus Middle name: First name: Johan Department: Mobile: +27(0)824662452 Direct FAX: +27(0)866471775 Direct tel: +27(11)4639718 Personal e-mail: [email protected]

PROJECT DESIGN DOCUMENT FORM (CDM PDD) - Version 03 CDM – Executive Board page 78
Annex 2
INFORMATION REGARDING PUBLIC FUNDING
No public funding is involved in developing the project activity.

PROJECT DESIGN DOCUMENT FORM (CDM PDD) - Version 03 CDM – Executive Board page 79
Annex 3
BASELINE INFORMATION
The following information are presented in Annex 3: 1. Baseline emissions of Waste Gas Streams 2. The determination of the grid emission factor
1. Baseline Emissions of Waste Gas Streams Conservative baseline emissions of waste gas streams use with potential for interchangeable application exist in the project facility The waste gas streams and their current uses are summarised in the table below:
Table 16: Users of waste gas before project implementation Flaring Ladle heating Preheating of furnace
feeds on F4 and F5 Power generation
Furnace 4 off gas
Yes Yes Yes No
Furnace 5 off gas
Yes Yes Yes No
FMT Site Gas Flow Balance – Design Conditions Figure 9 below shows the gas energy users on the FMT site. The figures reflect the gas production and consumption at design conditions. Confidential energy balance submitted to the validator Figure 9 - FMT Design Gas Distribution FMT Actual plant data - 2011 Table 17 below shows the actual electricity and MR gas imports for 2011 as obtained from Eskom and Sasol gas invoices. It also shows the total site production as well as F4, F5 and IC3 production and utilization. Table 17: FMT site data – 2011 Table with confidential information submitted to validator Table 18 below shows the FMT site production and consumption excluding F4 and F5. The specific electricity consumption for the site excluding F4 and F5 is fairly constant at about 4.33 MWh/t. Table 18: FMT site data – 2011

PROJECT DESIGN DOCUMENT FORM (CDM PDD) - Version 03 CDM – Executive Board page 80
Table with confidential information submitted to validator Table 19(F4), Table 20 (F5) and Table 21 (combined) below shows the calculated waste gas production and use based on actual 2011 plant data. Ladle heating at F4 and F5 was with MR gas for about half the time and at F6 all the time. Table 19: F4 data – 2011 Table with confidential information submitted to validator Table 20: F5 data – 2011 Table with confidential information submitted to validator Table 21: F4, F5, F6 and net gas data - 2011 Table with confidential information submitted to validator FMT Site Gas Flow Balance – 2011 data The following figures from the 2011 data were used as input to the Gas Flow model:
a) The plant utilization figures from Table 1, b) F4 and F5 preheater availabilities and ladle utilization from Tables 3 and 4 c) F6 ladle heating utilization from Table 5
Figure 10: Gas flow balance - 2011 Confidential energy balance included in PDD submitted to validator The model predicts a MR gas demand for the site, given the above mentioned plant data inputs, of 27,743GJ/m. The actual consumption as per invoiced records was 27 626 GJ/m which is a 0.4% difference. This verifies the model as accurate and representative of current site gas distribution and use. 2. Determination of the grid emission factor The GHG emission calculation of the proposed project was based on the instruction of “Tool to calculate the emission factor for an electricity system”. All the data employed in the calculation is based on the available data from South African Power Grid. The baseline emission factor (EFy) is calculated as a combined margin (CM), consisting of the combination of operating margin (OM) and build margin (BM) factors: The following seven steps are applied to calculate the emission factor for an electricity system: STEP 1. Identify the relevant electricity systems. STEP 2. Choose whether to include off-grid power plants in the project electricity system (optional). STEP 3. Provide evidence that the simple operating margin is still the applicable selection. STEP 4. Calculate the simple operating margin emission factor according to the selected method, ex-ante STEP 5. Calculate the build margin (BM) emission factor, ex-ante.

PROJECT DESIGN DOCUMENT FORM (CDM PDD) - Version 03 CDM – Executive Board page 81
STEP 6. Calculate the combined margin (CM) emissions factor. Step 1: Identify the relevant electric power system For determining the electricity emission factors, a project electricity system is defined by the spatial extent of the power plants that are physically connected through transmission and distribution lines to the project activity and that can be dispatched without significant transmission constraints.
Project electricity system
The DNA of South Africa has, to date, not published a delineation of the project electricity system and connected electricity systems. Spot markets: There exists no spot market in South Africa for electricity. The National Electricity Regulator (NER) regulates the prices at which electricity can be sold. There are no public information available regarding the operation of transmission lines and therefore it is not possible to define a grid boundary. Electricity generated by the proposed project activity will displace the power production in the national grid of South Africa which is defined as the project electricity system by default. The project electricity system forms part of a connected electricity system whereby it is connected by transmission lines to the national grid of Botswana (Botswana Power Corporation), Mozambique, Namibia (NamPower), Zimbabwe (ZESA), Lesotho (Lesotho Electricity Company), Swaziland and Zambia (ZESCO).
Connected electricity system The South African grid is connected by transmission lines to grids in neighboring countries Mozambique, Botswana, Namibia and Zimbabwe. South Africa exports some electricity to neighboring countries and import some as well. Therefore, this larger grid is defined as the connected electricity systems. The connected electricity systems are not partially or totally located in Annex 1 countries. For the purpose of determining the operating margin emission factor, the CO2 emission factor(s) for net electricity imports from a connected electricity system is 0 tCO2/MWh, because information is not available for emission factors of any of the neighboring countries.
Step 2: Choose whether to include off-grid power plants in the project electricity system (optional)
Off-grid power plants are not included in the calculations as information is not available.
Step 3: Provide evidence that the simple operating margin can be applied Motivation for using Option (c): Simple Operating Margin The simple OM method can be used for as long as the low-cost/must-run resources constitute less than 50% of the total grid generation in the five most recent years.

PROJECT DESIGN DOCUMENT FORM (CDM PDD) - Version 03 CDM – Executive Board page 82
Source of information for the table: Eskom Integrated Report 2011, page 13 Total GWh from coal from 2007 - 2011= 1,086,219 Total GWh production from 2007 – 2011 = 1,170,740 %Share of coal fired in power stations: 92.78%. It is therefore confirmed that the low-cost/must-run resources constitute less than 50% of the total grid generation.
In terms of data vintages, the ex ante option were chosen to calculate the simple OM.
In this option a 3 year generation-weighted average are used for the grid power plants.
The data used in OM calculations are for the 3-year period indicated in the following Table. This is the latest public available data.
Table 22: Electricity generation information for the power plants in the grid used in the operating margin
Power plant
Type of fossil fuel
Electricity generated
(D) Electricity generated
(D)
Electricity generated
(D) Total
MWh MWh MWh MWh
Published data *data source: 1
Published data *data source: 1
Published data
*data source: 1
2008/9 2009/10 2010/11
Arnot Coal 11,987,281 13,227,864 12,194,878 37,410,023 Duvha Coal 21,769,489 22,581,228 20,267,508 64,618,225 Hendrina Coal 12,296,687 12,143,292 11,938,206 36,378,185

PROJECT DESIGN DOCUMENT FORM (CDM PDD) - Version 03 CDM – Executive Board page 83
Kendal Coal 23,841,401 23,307,031 25,648,258 72,796,690 Kriel Coal 18,156,686 15,906,816 18,204,910 52,268,412 Lethabo Coal 23,580,232 25,522,698 25,500,366 74,603,296 Matimba Coal 26,256,068 27,964,141 28,163,040 82,383,249 Majuba Coal 22,676,924 22,340,081 24,632,585 69,649,590 Matla Coal 21,863,400 21,954,536 21,504,422 65,322,358 Tutuka Coal 21,504,122 19,847,894 19,067,501 60,419,517
Ankerlig*
Kerosene
143,000* 49,000 * 190,501 *
382,501
Gourikwa* -
Acacia - - 992
992
Port Rex - - 5,507
5,507 Camden Coal 6,509,079 7,472,070 7,490,836 21,471,985 Grootvlei Coal 1,249,556 2,656,230 3,546,952 7,452,738 Komati Coal - 1,016,023 2,060,141 3,076,164 Imported electricity 9,162,000 10,047,000 13,613,000 32,822,000
Total excluding imported
electricity
648,239,432
MWh
Source: FuelConsumptionElectricityGen.xls published by Eskom. Website short cut access is: http://www.eskom.co.za/c/article/236/cdm-calculations/ *The source information for Ankerlig and Gourikwa: (Source: For generation of electricity for all four gas turbine stations: Eskom Annual Integrated Report 2011, page 13, Appendix 60. Please note: The electricity generation and fuel consumption figures pulished for the single cycle gas turbines that operate on kerosene are not given for each power plant separately. From the spreadsheet published by Eskom “FuelConsumptionElectricityGen.xls”, it seems that Acacia and Port Rex were not in operation in 2008/2009 and 2009/2010. In order to apply the emission factor calculations in the GEF spreadsheet, the total electricity generation and fuel consumption figures reported for gas fired power stations (published in Eskom Annual Integrated Report 2011, page 13, Appendix 60) are allocated to Ankerlig and Gourikwa for these years according to their design capacities. The electricity generation and fuel consumption figures for Acacia and Port Rex are provided for 2010/2011. These figures are deducted from the total figures provided in the Eskom Integrated Report 2011 in order to determine the fuel consumption and electricity generation for Ankerlig and Gourikwa. Therefore the figures for Ankerlig and Gourikwa are reflected as follows in the GEF spreadsheet:

PROJECT DESIGN DOCUMENT FORM (CDM PDD) - Version 03 CDM – Executive Board page 84
The following table shows the electricity imported from neighboring countries and also confirms the electricity that was purchased from private generators (Local IPP and co-generation).
Source: Eskom Holdings Limited Integrated Report 2011, page 13
Step 4: Calculate the simple operating margin emission factor
The simple OM emission factor (EFgrid,OMsimple,y) is calculated as the generation-weighted average CO2 emissions per unit net electricity generation (tCO2/MWh) of all generating power plants serving the system, not including low-cost/must-run power plants. The Option A is used as data on the net electricity generation of each power plant is available and a CO2
emission factor for the power plants can be determined.
Name of Power Unit/country
2008-2009 2009-2010 2010-2011
Net Electricity Generation (MWh)
Source: Appendix 61_FuelConsumptionElectricityGen.xls
puplished by Eskom. Website
short cut access is: http://www.eskom.co.za/c/article/236/cdm-
calculations/
Ankerlig
(Source: For generation of electricity for all four
gas turbine stations: Eskom Annual Integrated
Report 2011, page 13, Appendix 60.
For Kerosene (diesel) consumption: Eskom
Holdings Limited Integrated Report 2011, page
152, Appendix 62)
Gourikwa
Acacia
Port Rex
91,805 31,458 122,300
51,195 17,542 68,201
0.0 0.0 992
0.0 0.0 5,507
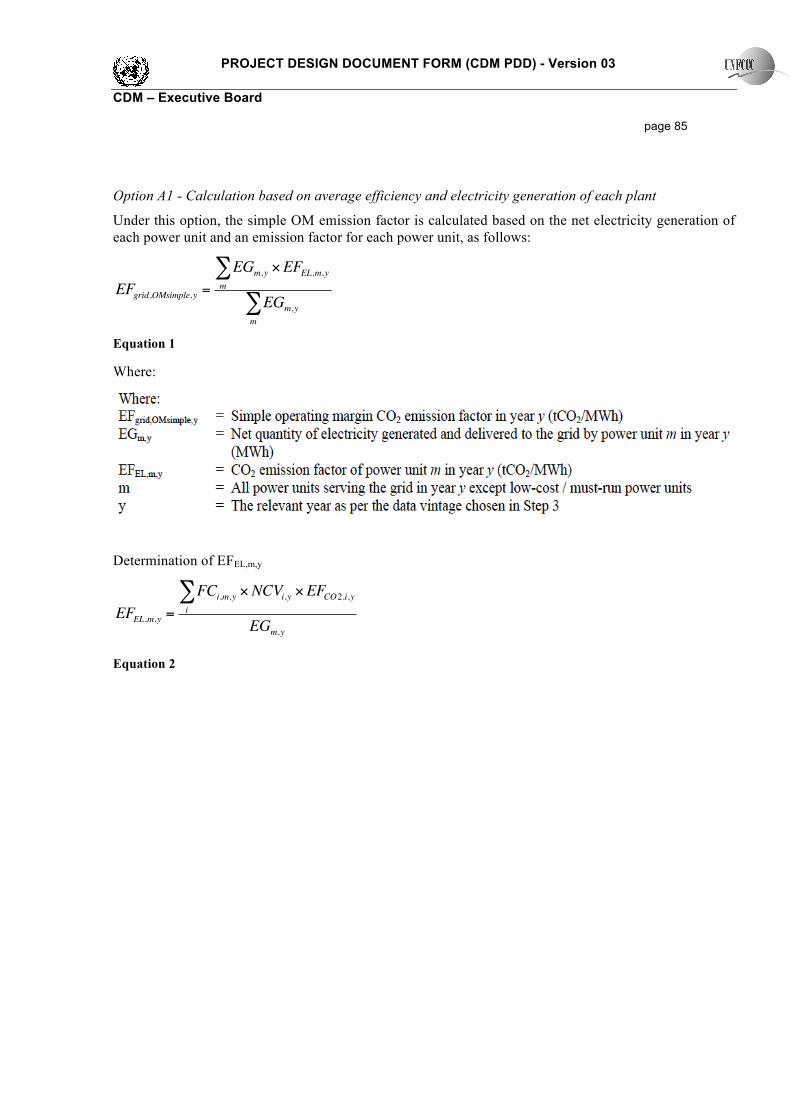
PROJECT DESIGN DOCUMENT FORM (CDM PDD) - Version 03 CDM – Executive Board page 85
Option A1 - Calculation based on average efficiency and electricity generation of each plant
Under this option, the simple OM emission factor is calculated based on the net electricity generation of each power unit and an emission factor for each power unit, as follows:
EFgrid,OMsimple,y =EGm,y !EFEL,m,y
m
"
EGm,y
m
"
Equation 1 Where:
Determination of EFEL,m,y
EFEL,m,y =FCi,m,y !NCVi,y !EFCO2,i,y
i
"
EGm,y
Equation 2

PROJECT DESIGN DOCUMENT FORM (CDM PDD) - Version 03 CDM – Executive Board page 86
Where: EFELm,y = CO2 emission factor of power unit m in year y (tCO2/MWh)
FCi,m,y = Amount of fossil fuel type i consumed by power unit m in year y (Mass or volume unit)
NCVi,y = Net calorific value (energy content) of fossil fuel type i in year y (GJ / mass or volume unit)
EFCO2,i,y = CO2 emission factor of fossil fuel type i in year y (tCO2 /GJ)
EG m,y = Net quantity of electricity generated and delivered to the grid by power unit m in year y (MWh)
i = All fossil fuel types combusted in power unit m in year y
m = The power plants/units delivering electricity to the grid, not including low-cost/must-run power plants/units, and including electricity imports to the grid
y = The relevant year as per the data vintage chosen in Step 3 Table 23: Power stations in the Operating Margin
Electricity import
i-1
International imports
(Source: Eskom Integrated Report, 2011, page
13), Appendix 60
i-2IPPs
(Source: Eskom Integrated Report, 2011, page
13), Appendix 60
No. Name of Power Unit/country
Net Electricity Generation (MWh)
Source: Appendix 61_FuelConsumptionElectricityGen.xls
puplished by Eskom. Website
short cut access is: http://www.eskom.co.za/c/article/236/cdm-
calculations/
Installed
Capacity (MW)
Source:
FuelConsumptio
nElectricityGen.
xls puplished by
Eskom, Appendix
612008-2009 2009-2010 2010-2011 2008-2009 2009-2010 2010-2011
12,189,000 13,754,000 13,613,000
0 0 1,833,000
Main Fuel Type/
Energey Source
Net Electricity Generation (MWh)
Source: Appendix 61_FuelConsumptionElectricityGen.xls
puplished by Eskom. Website
short cut access is: http://www.eskom.co.za/c/article/236/cdm-
calculations/
Main Fuel Consumption
(t (mass or volume unit))
Source: Appendix 61_FuelConsumptionElectricityGen.xls
puplished by Eskom
Website short cut access is:
http://www.eskom.co.za/c/article/236/cdm-calculations/
Electricity generation in the project electricity system
1 Arnot
2 Duvha
3 Hendrina
4 Kendal
5 Kriel
6 Lethabo
7 Matimba
8 Majuba
9 Matla
10 Tutuka
1980
3450
1895
3840
2850
3558
3690
3843
3450
3510
11,987,281 13,227,864 12,194,878 Other Bituminous Coal 6,395,805 6,794,134 6,525,670
21,769,489 22,581,228 20,267,508 Other Bituminous Coal 11,393,553 11,744,606 10,639,393
12,296,687 12,143,292 11,938,206 Other Bituminous Coal 7,122,918 6,905,917 7,139,198
23,841,401 23,307,031 25,648,258 Other Bituminous Coal 15,356,595 13,866,514 15,174,501
18,156,686 15,906,816 18,204,910 Other Bituminous Coal 9,420,764 8,504,715 9,527,185
23,580,232 25,522,698 25,500,366 Other Bituminous Coal 16,715,323 18,170,227 17,774,699
26,256,068 27,964,141 28,163,040 Other Bituminous Coal 13,991,453 14,637,481 14,596,842
22,676,924 22,340,081 24,632,585 Other Bituminous Coal 12,554,406 12,261,833 13,020,512
21,863,400 21,954,536 21,504,422 Other Bituminous Coal 12,689,387 12,438,391 12,155,421
21,504,122 19,847,894 19,067,501 Other Bituminous Coal 11,231,583 10,602,839 10,191,709
12
Ankerlig
(Source: For generation of electricity for all four
gas turbine stations: Eskom Annual Integrated
Report 2011, page 13, Appendix 60.
For Kerosene (diesel) consumption: Eskom
Holdings Limited Integrated Report 2011, page
152, Appendix 62)
13Gourikwa (electricity production and kerosene
consumption included in figures for Ankerlig)
14 Acacia
15 Port Rex
1327
740
171
171
143,000 49,000 190,501 Other Kerosene 24,776 13,803 53,901
0.0 0.0 0.0 Other Kerosene 0.0 0.0 0.0
0.0 0.0 992 Other Kerosene 0.0 0.0 381
0.0 0.0 5,507 Other Kerosene 0.0 0.0 242
24
Camden
*** Commissioning information source: Eskom
Holdings Limited Integrated Report 2011, page
148
25
Grootvlei
* Commissioing information source: Appendix
63_Eskom Annual Report 2010, page 126
http://financialresults.co.za/2010/eskom_ar2010/
downloads/eskom_ar2010.pdf
26
Komati
**Commissioing information source, Appendix
64_Eskom Annual Report 2010, page 127,
http://financialresults.co.za/2010/eskom_ar2010/
downloads/eskom_ar2010.pdf
1600
1200
1000
6,509,079 7,472,070 7,490,836 Other Bituminous Coal 3,876,211 4,732,163 4,629,763
1,249,556 2,656,230 3,546,952 Other Bituminous Coal 674,538 1,637,371 2,132,979
0 1,016,023 2,060,141 Other Bituminous Coal 0 664,497 1,271,010

PROJECT DESIGN DOCUMENT FORM (CDM PDD) - Version 03 CDM – Executive Board page 87
Source: GEF Spreadsheet and Appendix 61_FuelConsumptionElectricityGen.xls published by Eskom. Website short cut access is: http://www.eskom.co.za/c/article/236/cdm-calculations/
Table 24: Calculation of the Operating Margin emission factor
Step 5 Calculate the build margin (BM) emission factor Data Vintage – Option 1 is selected (ex-ante) Option 1: For the first crediting period, calculate the build margin emission factor ex ante based on the most recent information available on units already built for sample group m at the time of CDM-PDD submission to the DOE for validation. (a) According to the information provided by the national utility, SET5-units consist of the following 5 units (based on the power stations most recently added to the national grid):
Net Electricity
Generation
CO2 Emission
Factor
Net Electricity
Generation
CO2 Emission
Factor
Net Electricity
Generation
CO2 Emission
Factor
MWh t-CO!/MWh MWh t-CO!/MWh MWh t-CO!/MWh
Electricity importi-1 International imports (Source: Eskom Integrated Report, 2011, page 13), Appendix 6012,189,000 13,754,000 13,613,000i-2 IPPs (Source: Eskom Integrated Report, 2011, page 13), Appendix 600.0 0.0 1,833,000.0
Name of Power UnitNo.
Operating Margin Calculation Option Simple OM
2010-20112008-2009 2009-2010
Electricity generation in the project electricity system - - -
1 Arnot 11,987,281 0.9121 13,227,864 0.8835 12,194,878 0.9315
2 Duvha 21,769,489 0.8947 22,581,228 0.8947 20,267,508 0.9138
3 Hendrina 12,296,687 0.9902 12,143,292 0.9783 11,938,206 1.0410
4 Kendal 23,841,401 1.1011 23,307,031 1.0234 25,648,258 1.0299
5 Kriel 18,156,686 0.8870 15,906,816 0.9197 18,204,910 0.9110
6 Lethabo 23,580,232 1.2118 25,522,698 1.2246 25,500,366 1.2134
7 Matimba 26,256,068 0.9109 27,964,141 0.9004 28,163,040 0.9022
8 Majuba 22,676,924 0.9464 22,340,081 0.9442 24,632,585 0.9202
9 Matla 21,863,400 0.9922 21,954,536 0.9746 21,504,422 0.9840
10 Tutuka 21,504,122 0.8928 19,847,894 0.9189 19,067,501 0.9305
12 Ankerlig (Source: For generation of electricity for all four gas turbine stations: Eskom Annual Integrated Report 2011, page 13, Appendix 60. For Kerosene (diesel) consumption: Eskom Holdings Limited Integrated Report 2011, page 152, Appendix 62)143,000 0.5201 49,000 0.8456 190,501 0.8494
13
Gourikwa (electricity production and
kerosene consumption included in figures
for Ankerlig)
0 -
0 0.8456 0 0.8494
14 Acacia 0 - 0 0.8456 992 0.8494
15 Port Rex 0 - 0 0.8456 5,507 0.8494
24 Camden *** Commissioning information source: Eskom Holdings Limited Integrated Report 2011, page 1486,509,079 1.0180 7,472,070 1.0894 7,490,836 1.0786
25 Grootvlei * Commissioing information source: Appendix 63_Eskom Annual Report 2010, page 126 http://financialresults.co.za/2010/eskom_ar2010/downloads/eskom_ar2010.pdf1,249,556 0.9228 2,656,230 1.0604 3,546,952 1.3979
26 Komati **Commissioing information source, Appendix 64_Eskom Annual Report 2010, page 127, http://financialresults.co.za/2010/eskom_ar2010/downloads/eskom_ar2010.pdf0 - 1,016,023 1.1250 2,060,141 2.1776
224,022,925 229,742,904 235,862,603
EFgrid, OMsimple,y1 0.9269 EFgrid, OMsimple,y2 0.9208 EFgrid, OMsimple,y3 0.9293
Operating Margin Emission Factor(t-CO!/MWh) 0.9257
Annual Electricity Generation in Total
Simple Operating Margin CO2 Emission Factor

PROJECT DESIGN DOCUMENT FORM (CDM PDD) - Version 03 CDM – Executive Board page 88
SET5-units Plant Name Fuel type Commission year
Komati*** Coal 2009 Grootvlei** Coal 2008 Gourikwa Other Kerosene 2007 Ankerlig Other Kerosene 2007 Camden* Coal 2005
Source of information: *Re-commissioned power plant, Eskom Holdings Limited Integrated Report 2011, page 148 **Re-commissioned power plant, Eskom Annual Report 2010, page 126, http://financialresults.co.za/2010/eskom_ar2010/downloads/eskom_ar2010.pdf ***Re-commissioned power plant, Eskom Annual Report 2010, page 127, http://financialresults.co.za/2010/eskom_ar2010/downloads/eskom_ar2010.pdf
(a) Identify the set of power units, excluding power units registered as CDM project activities, that started to supply electricity to the grid most recently and that comprise 20% of the annual electricity generation of the project electricity system, AEGtotal (if 20% falls on part of the generation of a unit, the generation of that unit is fully included in the calculation) (SET≥20%).
(b) SET≥20% consist of the following power stations indicated in the table below.

PROJECT DESIGN DOCUMENT FORM (CDM PDD) - Version 03 CDM – Executive Board page 89
(c) In the GEF spreadsheet, the set of power units will be selected from SET5-units and SET≥20% that comprise the larger annual generation to calculate the build margin (SETsample).
AEG SET5-units = 13,288,430 MWh (see grid emission spreadsheet, sheet BM-D)
AEG SET>20% = 63,569,273 MWh (see grid emission spreadsheet, sheet BM-D)
SETsample is equal to SET≥20% because SET≥20% comprises the larger annual generation.
Identify the date when the power units in SETsample started to supply electricity to the grid.
If none of the power units in SETsample started to supply electricity to the grid more than 10 years ago, then use SETsample to calculate the build margin.
No. Name of power unitYear commissioned Fuel Type
Energey SourceNet Electricity
Generation (MWh/y) of the latest year
CO2 Emission Factor (t-CO₂/MWh) of the latest
year
CO2 Emissions (t-CO₂)
26
Komati **Commissioing information
source, Eskom Annual Report 2010, page 127,
http://financialresults.co.za/2010/eskom_ar2010/downloa
ds/eskom_ar2010.pdf
2009 Other Bituminous Coal 2 060 141 2.1776 4 486 265.9
25
Grootvlei * Commissioing information
source: Eskom Annual Report 2010, page 126
http://financialresults.co.za/2010/eskom_ar2010/downloa
ds/eskom_ar2010.pdf
2008 Other Bituminous Coal 3 546 952 1.3979 4 958 140.8
13
Gourikwa (electricity production and kerosene consumption included in
figures for Ankerlig)
2007 Other Kerosene 0 0.8494 0.0
12
Ankerlig (Source: For generation of electricity for all four gas turbine stations: Eskom
Annual Integrated Report 2011, page 13. For Kerosene (diesel)
consumption: Eskom Holdings Limited Integrated
Report 2011, page 152.)
2007 Other Kerosene 190 501 0.8494 161 806.8
24
Camden *** Commissioning
information source: Eskom Holdings Limited Integrated
Report 2011, page 148
2005 Other Bituminous Coal 7 490 836 1.0786 8 079 616.7
8 Majuba 1996 Other Bituminous Coal 24 632 585 0.9202 22 665 781.8
4 Kendal 1988 Other Bituminous Coal 25 648 258 1.0299 26 415 392.0
SET≥20%

PROJECT DESIGN DOCUMENT FORM (CDM PDD) - Version 03 CDM – Executive Board page 90
It is clear that Kendal and Majuba in SETsample have started to supply electricity to the grid more than 10 years ago.
(d) Exclude from SETsample the power units which started to supply electricity to the grid more than 10 years ago. This excludes the following power plants from SETsample.
• Kendal (1988)
• Majuba (1996)
The only CDM project activity that started supply electricity to the grid, is the Bethlehem Hydro plant. It is assumed that the Bethlehem Hydro plant delivers the expected MWh per year that is indicated in the PDD on page 12, i.e. 34,031 MWh.
AEGSET sample CDM < 0.2 × AEGtotal. Therefore, continue to the next step below:
No. Name of power unitYear commissioned Fuel Type
Energey SourceNet Electricity
Generation (MWh/y) of the latest year
CO2 Emission Factor (t-CO₂/MWh) of the latest
year
CO2 Emissions (t-CO₂)
26
Komati **Commissioing information
source, Eskom Annual Report 2010, page 127,
http://financialresults.co.za/2010/eskom_ar2010/downloa
ds/eskom_ar2010.pdf
2009 Other Bituminous Coal 2 060 141 2.1776 4 486 265.9
28
Bethlehem Hydro (Source: http://cdm.unfccc.int/Project
s/DB/SGS-UKL1245061289.99, CDM
PDD, page 12)
2009 Hydro 34 031 0.0000 0.0
25
Grootvlei * Commissioing information
source: Eskom Annual Report 2010, page 126
http://financialresults.co.za/2010/eskom_ar2010/downloa
ds/eskom_ar2010.pdf
2008 Other Bituminous Coal 3 546 952 1.3979 4 958 140.8
13
Gourikwa (electricity production and kerosene consumption included in
figures for Ankerlig)
2007 Other Kerosene 0 -
12
Ankerlig (Source: For generation of electricity for all four gas turbine stations: Eskom
Annual Integrated Report 2011, page 13. For Kerosene (diesel)
consumption: Eskom Holdings Limited Integrated
Report 2011, page 152.)
2007 Other Kerosene 190 501 0.8494 161 806.8
24
Camden *** Commissioning
information source: Eskom Holdings Limited Integrated
Report 2011, page 148
2005 Other Bituminous Coal 7 490 836 1.0786 8 079 616.7
SETsample-CDM

PROJECT DESIGN DOCUMENT FORM (CDM PDD) - Version 03 CDM – Executive Board page 91
(e) The plants that have to be added to make up the set that comprises 20% of the grid are Majuba and Kendal.
The build margin emissions factor is the generation-weighted average emission factor (tCO2/MWh) of all power units m during the most recent year y for which power generation data is available, calculated as follows: Equation 3
No. Name of power unitYear commissioned Fuel Type
Energey SourceNet Electricity
Generation (MWh/y) of the latest year
CO2 Emission Factor (t-CO₂/MWh) of the latest
year
CO2 Emissions (t-CO₂)
26
Komati **Commissioing information
source, Eskom Annual Report 2010, page 127,
http://financialresults.co.za/2010/eskom_ar2010/downloa
ds/eskom_ar2010.pdf
2009 Other Bituminous Coal 2 060 141 2.1776 4 486 265.9
28
Bethlehem Hydro (Source: http://cdm.unfccc.int/Project
s/DB/SGS-UKL1245061289.99, CDM
PDD, page 12)
2009 Hydro 34 031 0.0000 0.0
25
Grootvlei * Commissioing information
source: Eskom Annual Report 2010, page 126
http://financialresults.co.za/2010/eskom_ar2010/downloa
ds/eskom_ar2010.pdf
2008 Other Bituminous Coal 3 546 952 1.3979 4 958 140.8
13
Gourikwa (electricity production and kerosene consumption included in
figures for Ankerlig)
2007 Other Kerosene 0 -
12
Ankerlig (Source: For generation of electricity for all four gas turbine stations: Eskom
Annual Integrated Report 2011, page 13. For Kerosene (diesel)
consumption: Eskom Holdings Limited Integrated
Report 2011, page 152.)
2007 Other Kerosene 190 501 0.8494 161 806.8
24
Camden *** Commissioning
information source: Eskom Holdings Limited Integrated
Report 2011, page 148
2005 Other Bituminous Coal 7 490 836 1.0786 8 079 616.7
8 Majuba 1996 Other Bituminous Coal 24 632 585 0.9202 22 665 781.84 Kendal 1988 Other Bituminous Coal 25 648 258 1.0299 26 415 392.0
SETsample-CDM

PROJECT DESIGN DOCUMENT FORM (CDM PDD) - Version 03 CDM – Executive Board page 92
∑∑ ×
=
mym,
my,m,ELy,m
yBM,grid, EG
EFGEEF
Where: EFgrid,BM,y = Build margin CO2 emission factor in year y (tCO2/MWh) EGm,y = Net quantity of electricity generated and delivered to the grid by power unit m
in year y (MWh) EFEL,m,y = CO2 emission factor of power unit m in year y (tCO2/MWh) M = Power units included in the build margin Y = Most recent historical year for which power generation data is available The emission factor for each power unit is calculated applying Option A1, if the electricity generation and fuel consumption information for the generating units are publicly available. Determination of EFEL,m,y according to Option A1:
EFgrid,BM ,y =FCi,m,y !NCVi,y !EFCO2,i,y
i
"
EGm,y
The BM is calculated as 1.0503 tCO2/MWh (refer to GEF spreadsheet, Sheet BM) The diagram below demonstrates the build margin determination process in diagram format. The diagram can be found in the grid emission spreadsheet on sheet ‘BM Diagram’.

PROJECT DESIGN DOCUMENT FORM (CDM PDD) - Version 03 CDM – Executive Board page 93
Step 6: Calculate the combined margin emissions factor The calculation of the combined margin emission factor (EFgrid,CM,y) is determined by the Weighted average CM. (a) Weighted average CM The combined margin emissions factor is calculated as follows:
BMyBM,grid,OMygrid,OM,ygrid,CM, wEFwEFEF ×+×= Equation 4 Where: EFgrid,BM,y = Build margin CO2 emission factor in year y (tCO2/MWh) EFgrid,OM,y = Operating margin CO2 emission factor in year y (tCO2/MWh) wOM = Weighting of operating margin emissions factor (%) wBM = Weighting of build margin emissions factor (%) The methodology specifies default values of wOM = 0.5 and wBM = 0.5. The combined margin is calculated as 0.9880 tCO2/MWh (refer to GEF spreadsheet, Sheet CM, Cell I10)
AEGSET-5-
units13,288,430.0 MWh AEGSET-!20% 63,569,273.0 MWh
5 power units 7 power units
No
Yes
AEGSET-
sample-CDM13,322,461.0 MWh
6 power units
Yes
No
AEGsample-
CDM->10yrs63,603,304.0 MWh
8 power units
Step3.Exclude power units older than 10 years
and include power units registered in the CDM
SET!20%
Step5.Include power units older than 10 years
until the set comprises 20% of generation
Step2.Is there at least one power unit older
than 10 years in the set?
SETsample-CDM
SET5-units
Identify the 5 most recent power units, excluding
CDM
SET!20%
Identify the units that comprise at least 20% of the
system generation, excluding CDM
SETsample
Step1.Select the set of power units that
comprises the larger annual generation
The sample group of power units
m used to calculate the build
margin
SETsample-CDM->10yrsStep4.Does the set comprise at least 20% of
generation?
SETsample-CDM->10yrs

PROJECT DESIGN DOCUMENT FORM (CDM PDD) - Version 03 CDM – Executive Board page 94
Annex 4
MONITORING INFORMATION
- - - - -