cladding oxidation. resistance to quench and post … · ce document est la propriété de l ......
TRANSCRIPT
Système de management de la qualité IRSN certifié
RAPPORT T E C H N I CAL R E P O R T
A STATE-OF-THE-ART REVIEW OF PAST PROGRAMMES DEVOTED TO FUEL BEHAVIOUR UNDER LOSS-OF-COOLANT CONDITIONS. Part 3.
Cladding Oxidation. Resistance to Quench and Post-Quench Loads.
Claude GRANDJEAN, Georges HACHE DPAM/SEMCA 2008-093
DIRECTION DE LA PRÉVENTION DES ACCIDENTS MAJEURS Service d'Etudes et de Modélisation du Combustible en Situations Accidentelles


3/239
Fiche descriptive de la note technique/ Technical note record
Ce document est la propriété de l’IRSN et ne peut pas être communiqué ou reproduit sans son autorisation.
This document is IRSN proprietary and shall not be disseminated outside the Institute without its prior approval
Title
A STATE-OF-THE-ART REVIEW OF PAST PROGRAMMES DEVOTED TO FUEL BEHAVIOUR UNDER LOSS-OF-COOLANT CONDITIONS. Part 3.
Sub title
Cladding Oxidation. Resistance to Quench and Post-Quench Loads.
Auteur/author(s) : Claude GRANDJEAN, Georges HACHE
Type de document : Document type: NT
Date de diffusion : Distribution date :
Référence BDD-ST : SEMCA 2008-093 E-mail :
Mots-clés (Max. 5) :
Key-words (Max. 5): LOCA, QUENCH BEARING CAPABILITY, POST QUENCH DUCTILITY
ABSTRACT
This report makes a detailed literature review of the knowledge gained from the experimental results relative to oxidation, resistance to quench and post quench loads of Zircaloy cladding under LOCA conditions.
This document is mainly based on a previous French document (NT IRSN DPAM/SEMCA 2003/02) translated into English by Caroline Purcell (TST) and updated by Claude Grandjean (IRSN).

DPAM/SEMCA 2008-093 A State-Of-The-Art Review Of Past Programmes Devoted To Fuel Behaviour Under Loss-Of-Coolant Conditions. Part 3.
4/239
Ce document est la propriété de l’IRSN et ne peut pas être communiqué ou reproduit sans son autorisation.
This document is IRSN proprietary and shall not be disseminated outside the Institute without its prior approval
HISTORIQUE DES MODIFICATIONS/CHANGE HISTORY
Version/ Revision
Date Auteur/ Author
Pages ou paragra-phes modifiés/
Pages or paragraphs changed
Nature des modifications/ Nature of the changes
1 Document validé

DPAM/SEMCA 2008-093 A State-Of-The-Art Review Of Past Programmes Devoted To Fuel Behaviour Under Loss-Of-Coolant Conditions. Part 3.
5/239
Ce document est la propriété de l’IRSN et ne peut pas être communiqué ou reproduit sans son autorisation.
This document is IRSN proprietary and shall not be disseminated outside the Institute without its prior approval
Table des matières
EXECUTIVE SUMMARY................................................................................................................................... 9
ZIRCALOY OXIDATION UNDER LOCA CONDITIONS.............................................................................................. 9 CAPABILITY OF CLADDING TO WITHSTAND THERMAL-SHOCK AND POST-QUENCH LOADS.................................. 10
1 INTRODUCTION....................................................................................................................................... 13
1.1 CONTEXT ............................................................................................................................................... 13 1.2 ZIRCALOY OXIDATION ........................................................................................................................... 13 1.3 EMBRITTLEMENT OF OXIDISED CLADDING ............................................................................................. 15
2 EXPERIMENTAL RESULTS AND MODELS AVAILABLE IN 1972 ................................................ 16
2.1 OXIDATION KINETICS ............................................................................................................................. 16 2.1.1 Baker–Just correlation and tests ................................................................................................... 16 2.1.2 Hobson & Rittenhouse correlation................................................................................................ 19
2.2 RESISTANCE TO QUENCH THERMAL-SHOCK............................................................................................ 21 2.2.1 ANL tests ....................................................................................................................................... 21
2.2.1.1 Parametric oxidation and quench tests ...................................................................................... 21 2.2.1.2 Hydriding tests .......................................................................................................................... 23
2.2.2 General Electric tests (BWR rods) ................................................................................................ 24 2.2.2.1 Single-rod tests (TTE tests) ....................................................................................................... 24
2.2.2.1.1 Description of test equipment and procedure ..................................................................... 24 2.2.2.1.2 Results ................................................................................................................................ 24
2.2.2.2 Bundle experiments (BWR/FLECHT tests) .............................................................................. 27 2.2.2.2.1 Equipment and test conditions............................................................................................ 27 2.2.2.2.2 Observations and results ..................................................................................................... 27
2.2.3 Analysis of results.......................................................................................................................... 28 2.2.3.1 Criterion based on Equivalent Cladding Reacted (ECR)........................................................... 28 2.2.3.2 Criterion based on Dt**
1/2......................................................................................................... 32
2.2.3.3 Criterion based on a fraction of the ductile phase ..................................................................... 33 2.2.3.4 Temperature criterion ................................................................................................................ 34
2.3 POST-OXIDATION DUCTILITY.................................................................................................................. 35 2.3.1 Cincinnati General Electric tests .................................................................................................. 35 2.3.2 Meservey & Herzel tests (Idaho Nuclear) ..................................................................................... 37 2.3.3 Graber report (Idaho Nuclear) ..................................................................................................... 38 2.3.4 TREAT/ FRF-2 test........................................................................................................................ 39 2.3.5 Hobson & Rittenhouse tests (ORNL)............................................................................................. 40 2.3.6 Hobson slow compression tests ..................................................................................................... 41 2.3.7 San José General Electric tests ..................................................................................................... 43 2.3.8 Analytical evaluation of failure limits ........................................................................................... 45
3 ZIRCALOY OXIDATION (EXPERIMENTAL RESULTS AND MODELS SUBSEQUENT TO THE
1973 ECCS HEARING)...................................................................................................................................... 47
3.1 ISOTHERMAL OXIDATION KINETICS OF ZIRCALOY .................................................................................. 47 3.1.1 Tests by Biederman et al. (Worcester Polytechnic Institute, USA) ............................................... 47 3.1.2 Tests by Westerman & Hesson (Battelle Pacific Northwest Laboratories, USA).......................... 49 3.1.3 Tests by Suzuki and Kawasaki (JAERI, Japan) ............................................................................. 50 3.1.4 Tests by Cathcart, Pawel et al. (Oak Ridge National Laboratory, USA) ...................................... 51
3.1.4.1 Isothermal tests to determine oxidation kinetics ....................................................................... 52 3.1.4.2 Hydrogen absorption in one-sided oxidation tests..................................................................... 54
3.1.5 Tests by Brown and Healey (CEGB, UK) ..................................................................................... 56 3.1.6 Tests by Urbanic and Heidrick (AECL, Canada).......................................................................... 58 3.1.7 Tests by Leistikow, Schanz et al. (FZK, Germany)........................................................................ 62 3.1.8 Ocken report (EPRI, USA) ............................................................................................................ 69 3.1.9 Tests by Prater and Courtright (PNL, Richland, USA)................................................................. 72 3.1.10 Tests by Moalem and Olander (Univ. Ca., Berkeley, USA) .......................................................... 75

DPAM/SEMCA 2008-093 A State-Of-The-Art Review Of Past Programmes Devoted To Fuel Behaviour Under Loss-Of-Coolant Conditions. Part 3.
6/239
Ce document est la propriété de l’IRSN et ne peut pas être communiqué ou reproduit sans son autorisation.
This document is IRSN proprietary and shall not be disseminated outside the Institute without its prior approval
3.2 EFFECT OF THE FINITE SIZE OF SAMPLES................................................................................................. 79 3.3 TRANSIENT OXIDATION .......................................................................................................................... 81 3.3.1 Tests by Cathcart, Pawel et al....................................................................................................... 81 3.3.2 Tests by Leistikow, Schanz et al. ................................................................................................... 84
3.4 INFLUENCE OF INITIAL OXIDATION ......................................................................................................... 90 3.4.1 TAGCIS/ TAGCIR tests ................................................................................................................. 90 3.4.2 Tests by Leistikow and Schanz ...................................................................................................... 91
3.5 EFFECT OF IRRADIATION AND/OR INITIAL HYDROGEN CONTENT ............................................................ 94 3.5.1 TAGCIR tests................................................................................................................................. 94 3.5.2 Contribution of CODAZIR test results .......................................................................................... 95 3.5.3 HYDRAZIR oxidation tests............................................................................................................ 97
3.5.3.1 Analysis of the 1997 test series ................................................................................................. 97 3.5.3.2 Analysis of the 1999 test series ................................................................................................. 99 3.5.3.3 Global analysis of all oxidation tests......................................................................................... 99
3.5.4 Contribution of CINOG test results............................................................................................. 101 3.5.5 Information provided by foreign test program results ................................................................ 102
3.5.5.1 JAERI test results .................................................................................................................... 102 3.5.5.2 ANL test results....................................................................................................................... 103 3.5.5.3 Various results......................................................................................................................... 103
3.5.6 Conclusions regarding the effects of irradiation and pre-hydriding........................................... 104 3.6 OXIDATION UNDER LIMITED STEAM SUPPLY – EFFECT OF HYDROGEN CONCENTRATION IN AN OXIDISING
ATMOSPHERE ................................................................................................................................................... 106 3.6.1 Abnormal oxidation and hydrogen absorption in tests by Chung and Kassner .......................... 106 3.6.2 Tests by Chung and Thomas (ANL)............................................................................................. 108 3.6.3 Tests by Uetsuka (KfK)................................................................................................................ 110 3.6.4 Tests by Furuta and Kawasaki (JAERI) ...................................................................................... 113 3.6.5 Tests by Uetsuka and Otomo (JAERI) ......................................................................................... 116 3.6.6 Tests by Prater and Courtright ................................................................................................... 117 3.6.7 Tests by Moalem and Olander..................................................................................................... 118 3.6.8 Conclusion: oxidation under restricted steam flow and diluted steam atmosphere .................... 119
3.7 OXIDATION AT HIGH PRESSURE ............................................................................................................ 120 3.7.1 Tests by Pawel et al. .................................................................................................................... 120 3.7.2 Tests by Bramwell et al. .............................................................................................................. 123 3.7.3 Tests by Park et al. ...................................................................................................................... 126 3.7.4 Tests by Vrtilkova et al. ............................................................................................................... 128 3.7.5 Conclusions on oxidation at high pressure ................................................................................. 130
4 RESISTANCE TO THERMAL SHOCK - POST–OXIDATION DUCTILITY (EXPERIMENTAL
RESULTS AND MODELS OBTAINED AFTER THE ECCS HEARING) ................................... 131
4.1 TESTS BY UKAEA SPRINGFIELDS ....................................................................................................... 131 4.2 PAWEL CRITERION (ORNL) ................................................................................................................. 132 4.3 EMBRITTLEMENT TESTS AND SAWATZKY CRITERION (AECL, WHITESHELL) ...................................... 133 4.4 INSTRUMENTED IMPACT TESTS BY GARDE AND KASSNER (ANL) ........................................................ 136 4.5 TESTS AND CRITERIA BY CHUNG & KASSNER (ANL) .......................................................................... 139 4.5.1 Experimental characteristics....................................................................................................... 139 4.5.2 Resistance to quench thermal shock............................................................................................ 140
4.5.2.1 Quench resistance after slow cooling in the β→α' phase transformation range...................... 140 4.5.2.2 Effect of cooling rate through the β→α' transformation range ............................................... 143
4.5.3 Resistance to mechanical loads at ambient temperature ............................................................ 148 4.5.3.1 Results of non-deformed ring compression tests..................................................................... 148
4.5.3.1.1 Comparison with other experimenters.............................................................................. 148 4.5.3.1.2 Effect of cooling rate through the β → α' phase transformation ...................................... 150
4.5.3.2 Results of compression tests on ballooned rods ...................................................................... 151 4.5.3.3 Results of impact tests on non-deformed tubes ....................................................................... 154 4.5.3.4 Results of impact tests on ballooned rods ............................................................................... 155
4.5.4 Recommended embrittlement criteria based upon ANL investigation......................................... 158 4.6 CURRENT LOCA TEST PROGRAMME AT ANL...................................................................................... 160 4.6.1 Post-oxidation and post-quench ductility tests on cladding samples from various alloys .......... 160
4.6.1.1 Post-quench ductility for as-fabricated cladding alloys........................................................... 161 4.6.1.2 Post-quench ductility for pre-hydrided cladding alloys........................................................... 161

DPAM/SEMCA 2008-093 A State-Of-The-Art Review Of Past Programmes Devoted To Fuel Behaviour Under Loss-Of-Coolant Conditions. Part 3.
7/239
Ce document est la propriété de l’IRSN et ne peut pas être communiqué ou reproduit sans son autorisation.
This document is IRSN proprietary and shall not be disseminated outside the Institute without its prior approval
4.6.1.3 Effects of cooling rate and quench temperature on post-quench ductility for pre-hydrided
cladding 162 4.6.1.4 Post-quench ductility for high burn-up cladding alloys .......................................................... 163
4.6.2 LOCA integral tests ..................................................................................................................... 166 4.7 QUENCH TESTS BY SAWATZKY (AECL)............................................................................................... 169 4.8 JAERI TEST PROGRAM......................................................................................................................... 172 4.8.1 Experimental characteristics....................................................................................................... 172 4.8.2 Compression tests on non-ballooned rings oxidised in flowing steam (A Series) ....................... 173 4.8.3 Compression tests on ballooned, burst and oxidised rods (B Series).......................................... 177 4.8.4 Compression tests on tubes oxidised in a stagnant atmosphere (C Series) ................................. 180
4.8.4.1 Test results .............................................................................................................................. 180 4.8.4.2 Application to high burn-up Zircaloy-4 cladding.................................................................... 183
4.8.5 Compression tests on tubes oxidised in a flow of steam + hydrogen (D Series) ......................... 184 4.8.6 Integral-type tests prior to 1985 (E Series) ................................................................................. 185 4.8.7 Integral-type tests in the 1999 – 2007 period (F Series) ............................................................. 189 4.8.8 Conclusions on JAERI tests......................................................................................................... 196
4.9 IPSN / EDF RESEARCH PROGRAMME (TAGCIS, TAGCIR, HYDRAZIR AND CINOG SERIES)......... 197 4.9.1 TAGCIS programme.................................................................................................................... 197 4.9.2 TAGCIR programme ................................................................................................................... 198 4.9.3 HYDRAZIR programme .............................................................................................................. 198 4.9.4 CINOG programme..................................................................................................................... 198 4.9.5 Consistency of quench results between the TAGCIS, TAGCIR, HYDRAZIR & CINOG
programmes ................................................................................................................................................ 199 4.9.5.1 Test results for fresh cladding ................................................................................................. 199 4.9.5.2 Results of tests on pre-corroded, irradiated and slightly hydrided cladding............................ 200
4.9.6 Results of TAGCIR post-quench ring tensile tests....................................................................... 202 4.9.7 Conclusion on the TAGCIS, TAGCIR, HYDRAZIR and CINOG programmes ........................... 203
4.10 CEA STUDIES ON THE THERMAL-MECHANICAL BEHAVIOUR OF CLADDING ALLOYS IN LOCA CONDITIONS
204 4.10.1 Oxygen concentration profile in the prior-β phase layer............................................................ 204 4.10.2 Influence of hydrogen.................................................................................................................. 204
4.10.2.1 Intrinsic hydrogen effect ..................................................................................................... 205 4.10.2.2 Effect of hydrogen on the prior-β phase oxygen content and on the resulting post-quench mechanical properties.............................................................................................................................. 205
4.10.3 Influence of an initial corrosion layer......................................................................................... 206 4.10.4 Influence of the cooling scenario ................................................................................................ 207
4.11 UJP INVESTIGATIONS ON PRE-CORRODED CLADDING........................................................................... 209 4.12 IN-PILE TEST PROGRAMMES.................................................................................................................. 211 4.12.1 PBF tests ..................................................................................................................................... 211
4.12.1.1 Experimental characteristics................................................................................................ 211 4.12.1.2 Comparison between in-pile and out-of-pile test results: comparison with criteria ............ 212
4.12.1.2.1 Scatena criterion ............................................................................................................. 216 4.12.1.2.2 USNRC acceptance criteria ............................................................................................ 217 4.12.1.2.3 Pawel criterion................................................................................................................ 218 4.12.1.2.4 Sawatzky criterion .......................................................................................................... 220 4.12.1.2.5 Chung & Kassner criteria ............................................................................................... 220
4.12.1.3 Conclusions on the PBF in-pile tests................................................................................... 221 4.12.2 PHEBUS-LOCA tests .................................................................................................................. 222 4.12.3 Current and future in-pile test programmes................................................................................ 224
5 CONCLUSIONS ....................................................................................................................................... 225
5.1 ZIRCALOY OXIDATION UNDER LOCA CONDITIONS.............................................................................. 225 5.1.1 Isothermal oxidation kinetics ...................................................................................................... 225 5.1.2 Effect of the finite-size of samples ............................................................................................... 225 5.1.3 Transient oxidation ..................................................................................................................... 225 5.1.4 Effect of initial oxidation............................................................................................................. 225 5.1.5 Effect of irradiation or initial hydrogen concentration............................................................... 225 5.1.6 Influence of dilution of the steam oxidising atmosphere ............................................................. 226 5.1.7 Oxidation at high pressure .......................................................................................................... 226
5.2 CAPABILITY OF CLADDING TO WITHSTAND THERMAL SHOCK AND POST-QUENCH LOADS .................... 226

DPAM/SEMCA 2008-093 A State-Of-The-Art Review Of Past Programmes Devoted To Fuel Behaviour Under Loss-Of-Coolant Conditions. Part 3.
8/239
Ce document est la propriété de l’IRSN et ne peut pas être communiqué ou reproduit sans son autorisation.
This document is IRSN proprietary and shall not be disseminated outside the Institute without its prior approval
5.2.1 Capability to withstand thermal shock upon quenching from oxidation temperature................. 227 5.2.2 Influence of axial/ radial loads on thermal shock resistance ...................................................... 227 5.2.3 Effect of irradiation or initial corrosion and hydriding .............................................................. 227 5.2.4 Hydriding at the ends of ballooned and burst rods ..................................................................... 228 5.2.5 Influence of the cooling scenario ................................................................................................ 228 5.2.6 Resistance to failure under different kind of mechanical testing................................................. 229 5.2.7 Thermal-shock and handling failures in the PBF in-pile tests .................................................... 229
REFERENCES.................................................................................................................................................. 230

DPAM/SEMCA 2008-093 A State-Of-The-Art Review Of Past Programmes Devoted To Fuel Behaviour Under Loss-Of-Coolant Conditions. Part 3.
9/239
Ce document est la propriété de l’IRSN et ne peut pas être communiqué ou reproduit sans son autorisation.
This document is IRSN proprietary and shall not be disseminated outside the Institute without its prior approval
EXECUTIVE SUMMARY
Zircaloy oxidation under LOCA conditions
Since the publication of the Baker-Just equation in 1962, the oxidation of Zircaloy at high temperature by steam has been thoroughly investigated, making it possible to compile a comprehensive database on the various aspects of this phenomenon.
Isothermal oxidation kinetics are correctly represented by parabolic rate equations, with the reaction rate depending on the temperature according to an Arrhenius law, and by differentiating between the different phase domains of zirconia (monoclinic, tetragonal and cubic).
For long-lasting oxidation at high temperature, the finite size of the samples leads to the oxygen saturation of the metallic beta layer, resulting in a significant deviation from the parabolic kinetics on the alpha layer growth.
The key parameters involved in Zircaloy oxidation are as follows:
1. Influence of initial oxidation
Tests performed at KfK showed that an initial oxide layer – formed in steam between 350°C and 800°C – has a protective effect against oxidation at 1000°C but that this effect disappeared with oxidation at 1200°C. TAGCIS tests on pre-corroded cladding under PWR conditions, and TAGCIR tests on cladding irradiated at high burn-up revealed the poor protective effect of the initial oxide layer during high temperature oxidation (between 1050°C and 1300°C) which falls within the uncertainty on the measurement of the oxide thicknesses. Tests performed at JAERI indicated a slight protective effect of the corrosion layer pre-formed in reactor for oxidations in the low temperature and time ranges, but decreasing as temperature and time increase to vanish at T=1200°C and ECR>15%.
Results from recent investigations at UJP, involving steam oxidation in the 800-1000°C temperature range of pre-oxidised cladding samples, suggested that the initial oxide layer may partially dissolve in the underlying metal while oxygen diffusion from steam remains slow through the oxide scale. This may lead to high cladding embrtittlement from very low transient ECRs.
2. Influence of irradiation or initial hydrogen content
Irradiation (or initial corrosion) had an effect on the high-temperature oxidation kinetics in the TAGCIR tests, which was attributed to the hydrogen uptake in the Zircaloy cladding during the corrosion process. This minor effect (<15% in relation to the kinetics of as-received material) was not validated in tests on irradiated cladding performed in Japan. Though it cannot be disregarded entirely owing to the HYDRAZIR test results, an intrinsic effect of hydrogen was not clearly explained insofar as the effect observed remained restricted to low concentrations. If such an effect exists, the influence upon the oxidation kinetics is small and falls within the experimental uncertainties pertaining to this type of test.
3. Influence of dilution of the steam oxidising atmosphere
The dilution of steam in a mixture (steam + hydrogen or steam + neutral gas) only reduces the kinetics at high dilutions, typically for steam mole fractions less than 10%. This reduction essentially appears as a result of the limited quantity of steam on the sample surface. The presence of a significant quantity of hydrogen in the oxidising atmosphere does not result in a “blanketing” effect specific to hydrogen, thereby reducing the oxidation kinetics for a lower mole fraction than in the case of a neutral gas. However, a fraction of hydrogen of about 0.3 to 0.5 induces a fluctuation in the oxidation process, which in turn results in the significant absorption of hydrogen in the sample, associated with the appearance of a porous oxide consisting in a mixture of monoclinic and tetragonal phases.

DPAM/SEMCA 2008-093 A State-Of-The-Art Review Of Past Programmes Devoted To Fuel Behaviour Under Loss-Of-Coolant Conditions. Part 3.
10/239
Ce document est la propriété de l’IRSN et ne peut pas être communiqué ou reproduit sans son autorisation.
This document is IRSN proprietary and shall not be disseminated outside the Institute without its prior approval
4. Influence of pressure
Experimental investigations on oxidation at high pressure have revealed an accelerating effect of pressure upon the oxidation kinetics in steam at temperatures ranging between 750°C and 1000°C. The increase in the kinetics is related to the partial pressure of steam and not the total pressure . It seems that this kinetics increase can be connected to the appearance of cracks and porosities in the outer oxide layer, related to the tetragonal-to-monoclinic transformation of zirconia, which could possibly be favoured by the steam pressure. The physical phenomenon responsible for this accelerating effect at high steam pressure remains to be clarified. In the 35-50 bar range, the kinetics enhancement factor remains moderate (∼ < 2) and the pressure effect should not raise any additional safety problems for the as-received Zircaloy-4 cladding, on the condition that the absence of significant hydrogen absorption is checked. At higher pressure (> 120 bar), the enhancement factor is more pronounced (∼ 3 to 5), reaching a relative maximum at 750-800°C, which could question the correct evaluation of oxidation during certain types of accidental transients at high pressure (ATWS, etc.).
However, the available results of oxidation tests at high pressure only concern those on as-received or non-hydrided material. In view of the hypothetical role of hydrogen in the zirconia phase transformation, the behaviour of irradiated material during oxidation at high pressure remains to be checked.
Capability of cladding to withstand thermal-shock a nd post-quench loads
Since the publication of test results in the early 1970s on the resistance of oxidised cladding to thermal shock and post-quench loads (particularly the ANL tests by Hesson and the ORNL tests by Hobson), new test results from major programmes have enriched our knowledge of the failure-bearing capability of oxidised cladding under simulated LOCA conditions. The main results concern:
1. Capability to withstand thermal shock upon quenching from oxidation temperature
The ANL integral-type tests by Chung & Kassner, with quenching at oxidation temperature, indicated a thermal shock resistance limit above 33% ECR (best-estimate evaluation) for temperatures ≤ 1300°C, with this limit increasing at the lowest temperatures. JAERI unconstrained integral-type test results indicated a thermal-shock failure limit of about 38% ECR (evaluated using the Baker-Just correlation) in the 1983 tests, which increased to 60% in the 1999 tests. Comparative analysis of two-sided oxidation tests on as-received cladding from the TAGCIS, HYDRAZIR and CINOG programmes showed the good consistency of these results, with failure limits around 30% ECR (best-estimate evaluation) for quenching at oxidation temperature. These different results reveal the existence of a noticeable margin of conservatism in relation to the regulatory limit of 17% ECR (evaluated using the Baker-Just equation) for thermal shock resistance under LOCA conditions, even under penalising quench conditions at oxidation temperature.
2. Influence of axial/ radial loads on thermal-shock resistance
During the 1973 ECCS Hearing discussions, the Regulatory Staff and the AEC Commissioners were clearly reluctant about disregarding the effects of mechanical constraints – particularly assembly restraints and rod-to-rod interactions– in relation to thermal shock loads during quenching.
The results of the JAERI integral-type tests – constrained or unconstrained during reflood – demonstrated the significant effect of axial loads on the mechanical resistance of cladding during a LOCA. The fully restraint condition at quench reduces the ECR failure limit to about 20% (calculated with Baker-Just), therefore by a factor of 2 to 3 in comparison with the unrestrained case. The failure limit under fully restrained conditions during reflood drops to an ECR of 10% for pre-hydrided cladding (400-700 wppm), but is still around 20% for controlled axial restraint deemed more realistic (< 600 N).
The PHEBUS 219 test showed that bundle restraint loads and/or rod-to-rod interactions cannot be disregarded and that the existence of a temperature criterion is therefore justified.
3. Influence of irradiation or initial corrosion and hydriding
The TAGCIR test results on irradiated cladding suggest that the initial oxide layer does not contribute to the mechanical resistance to thermal-shock. Comparison of failure limits for as-received and irradiated materials led to the conclusion that the cladding irradiation and associated

DPAM/SEMCA 2008-093 A State-Of-The-Art Review Of Past Programmes Devoted To Fuel Behaviour Under Loss-Of-Coolant Conditions. Part 3.
11/239
Ce document est la propriété de l’IRSN et ne peut pas être communiqué ou reproduit sans son autorisation.
This document is IRSN proprietary and shall not be disseminated outside the Institute without its prior approval
corrosion do not noticeably modify thermal-shock resistance limits – under axially unrestrained conditions– in comparison with as-received cladding. Comparative analysis of the TAGCIR tests on irradiated cladding and HYDRAZIR tests on pre-hydrided cladding with a low hydrogen content (<1000 wppm) showed good consistency between the results, with similar failure limits upon direct quenching from the oxidation temperature, of about 28% to 30% transient ECR .
The integral-type tests performed at JAEA on irradiated PWR rods with Zircaloy-4 cladding (BU<44 GWd/t) – supplemented by more recent tests in the ALPS programme on PWR rods with advanced cladding alloys irradiated at BU from 66 to 79 GWd/t – follow the trend observed in tests on fresh pre-hydrided cladding tubes in terms of failure during quenching under restrained conditions. These tests also supported the conclusion by JAEA that the failure boundary is not significantly reduced by PWR irradiation in the intermediate and high burn-up level.
However, research performed by JAERI in the 1980s showed that hydrogen significantly reduced the post-quench ductility in comparison to fresh cladding oxidised under the same time-temperature conditions. These JAERI tests provided a preliminary estimate of the transient ECR criterion for Zircaloy-4 at high burn-ups: ~3% ECR for a hydrogen concentration of 535 wppm, and ~2.5% ECR for a hydrogen concentration of 755 wppm. These values are being refined and supplemented by the comprehensive results of the test programme underway at ANL since the mid-90s.
In recent investigations by CEA, post-quench mechanical tests revealed that hydrogen significantly influences the post-quench mechanical properties via two mechanisms: 1) an intrinsic hydrogen embrittlement effect, and 2) an enhanced hardening of the prior-β phase due to higher oxygen solubility in the presence of hydrogen.
The results of recent ANL ring compression tests at 135°C on pre-hydrided cladding oxidised at 1200°C and quenched at 800°C show a significant reduction in post-quench ductility. For 15x15 Zry-4 oxidised to 5% CP-ECR at ≈1190°C maximum oxidation temperature, the ductile-to-brittle transition hydrogen content was determined to be ≈530 wppm. For quench at 800ºC, post-quench ductility and ductile-to-brittle transition CP-ECR are therefore highly sensitive to the hydrogen content. A limited comparison of the data for slow-cooled samples suggests that the ductility of pre-hydrided Zry-4 is comparable (within the data scatter) to the ductility of high burn-up Zry-4.
4. Hydriding at the ends of ballooned and burst rods
Hydrogen uptake occurs on the inner surface of the cladding that has ruptured during the swelling phase due to steam ingress through the opening and inner oxidation in stagnant steam conditions. This uptake shows two peaks on each side of the opening in locations where the hydrogen + steam mixture is optimal and where the absorbed hydrogen content can reach several thousand wppm. The hydrogen uptake at these locations leads to a strong reduction in ductility despite oxidation rates well below 17% ECR calculated with the Baker-Just correlation.
Further results on this secondary hydriding phenomenon were recently obtained in ANL and JAEA integral-type tests on irradiated rods. For the high burn-up samples, the axial extent of hydrogen that could migrate in contact with the cladding would be limited by the presence of the fragmented and possibly relocated fuel in the balloon. Results of the ANL integral-type tests showed that the peaks of the hydrogen pickup in the high burn-up samples have shifted towards the burst centre, compared with the unirradiated samples. However, the maximum hydrogen pickups are at a similar level for both high burn-up (≈3000 wppm) and unirradiated (3500-4000 wppm) samples; this indicates that the fuel-cladding bond layer is hardly protective with respect to hydrogen uptake into the cladding.
5. Influence of the cooling scenario
During the slow cooling of Zircaloy in the β→α' transformation range, part of the oxygen found at high temperature in the β phase precipitates into oxygen-rich α incursions, which leaves a β matrix with oxygen-depleted regions, therefore more ductile than during fast cooling. This effect particularly results in better resistance to thermal shock or to a 0.3 J impact test at higher oxidation levels. The ANL integral-type tests by Chung & Kassner, which included a large body of direct quench tests or tests with slow cooling in the β→α' transformation range, revealed an increase in the oxidation time by a factor of 2 at the same temperature before the quench failure limit is reached.

DPAM/SEMCA 2008-093 A State-Of-The-Art Review Of Past Programmes Devoted To Fuel Behaviour Under Loss-Of-Coolant Conditions. Part 3.
12/239
Ce document est la propriété de l’IRSN et ne peut pas être communiqué ou reproduit sans son autorisation.
This document is IRSN proprietary and shall not be disseminated outside the Institute without its prior approval
Recent investigations at ANL indicated that although the ductile-to-brittle transition CP-ECR of as-fabricated alloys was relatively insensitive to slow-cooling to RT vs. quench at 800°C, this was no longer true for pre-hydrided HBR-type 15x15 Zry-4. Slow cooling to room temperature without quench resulted in a small, but significant, enhancement in ductility.
However, these results from ANL tests appear controversial in comparison with those recently obtained from investigations at CEA. Though these tests were conducted with significantly lower cooling rates, they nevertheless indicated 1) a surprisingly high restoration of the post-quench ductility after slow cooling down to 700 or 600°C and quench, and 2) some ductility restoration after slow cooling down to room temperature without quench, but significantly less than for quench at 700 or 600°C.
Further work is thus needed to better understand these complex phenomena while taking into account the effect of the pre-quenching cooling rate.
6. Resistance to failure under different kind of mechanical testing
ANL impact tests at 0.3 J on ballooned and burst rods by Chung & Kassner showed that the 17% ECR criterion guaranteed resistance to a 0.3 J impact, even at the ends of balloons having picked up a lot of hydrogen. In these tests, the effect of the hydrogen content seems to compensate for the thinning that resulted from ballooning.
However, recent investigations at the CEA showed good agreement between the energy-to-failure in all kinds of mechanical testing (ring compression, 3-point bending and impact), which made it possible to conclude that the energy-to-failure is a relevant parameter for analysing embrittlement in these various test types.

DPAM/SEMCA 2008-093 A State-Of-The-Art Review Of Past Programmes Devoted To Fuel Behaviour Under Loss-Of-Coolant Conditions. Part 3.
13/239
Ce document est la propriété de l’IRSN et ne peut pas être communiqué ou reproduit sans son autorisation.
This document is IRSN proprietary and shall not be disseminated outside the Institute without its prior approval
1 INTRODUCTION
1.1 Context
Within the framework of a joint R&D program with EDF, IRSN carried out an extensive State-of-the-Art-Review (SOAR) relative to fuel behaviour under LOCA conditions, covering the aspects of clad ballooning and flow blockage, coolability of partially blocked assemblies, clad oxidation and clad resistance to quench and post-quench loads. Together with the outcome from the recent results from experimental programs still in progress, this review makes it possible to update knowledge relative to fuel behaviour under LOCA conditions, thereby clearly identifying acquired knowledge, uncertainties and possible lacks in this knowledge base, the latter resulting in the need for complementary R&D programmes.
This State-of-the-Art-Review was initially divided into two parts, corresponding to the phenomenological aspects of the successive phases of a hypothetical large-break LOCA scenario:
♦ Clad ballooning up to rupture and the resulting partial blockage of flow channels;
♦ Oxidation and embrittlement of cladding, resistance to quench and post-quench loads.
Part one is devoted to cladding deformation and the resulting blockage of the sub-channels, which was discussed in a first document [1]. The impact of flow blockage upon the cooling of assemblies was studied in specific test programmes separate from the deformation/ rupture tests analysed in [1]; the review of test programs and analysis devoted to the coolability of deformed assemblies was therefore specifically discussed in a second document [2].
This third document is devoted to cladding oxidation and the resulting embrittlement with regard to the thermal shock of quench and post-quench loads at low temperature. The main safety issue pertaining to these aspects is the preservation of cladding integrity in view of ensuring core cooling following an accident transient and during post-accident operations. The specific chapters dealing with the embrittlement acceptance criteria (both the original and those under review) were discussed in the third part of the original French SOAR but have been removed from this part to form an additional fourth part in the English version.
This review of LOCA oxidation and embrittlement issues provides updated information - with some significant developments – of the main elements discussed in previous state-of-the-art reviews, particularly reference [3].
Except when specified otherwise, the nature of the cladding material used in the tests examined in this review is Zircaloy-4.
1.2 Zircaloy oxidation
Zircaloy oxidises in the presence of steam to form zirconia and gaseous hydrogen according to the following exothermic reaction:
Zr + 2 H2O → ZrO2 + 2 H2 ∆H = -586 kJ/mole
The detailed physical process corresponding to this reaction is rather complicated: it implies the adsorption and dissociation of water molecules at the oxide-steam interface, the formation of O2- ions and their diffusion in the oxide layer towards the oxide-metal interface where these ions will feed the oxidation reaction or continue diffusing in the metal to form an oxygen concentration gradient in the metal. If the reaction occurs at a temperature higher than the β transus temperature, the resulting microstructure is composed of three layers: oxide, α phase stabilised by oxygen, and β phase (respectively from the outer surface).
In terms of safety, the considerable consequences of such oxidation include changes to the cladding mechanical properties – owing to the formation of zirconia and uptake of oxygen (and possibly hydrogen) in the metal, the release of gaseous hydrogen and the generation of additional heat since the reaction is exothermic.

DPAM/SEMCA 2008-093 A State-Of-The-Art Review Of Past Programmes Devoted To Fuel Behaviour Under Loss-Of-Coolant Conditions. Part 3.
14/239
Ce document est la propriété de l’IRSN et ne peut pas être communiqué ou reproduit sans son autorisation.
This document is IRSN proprietary and shall not be disseminated outside the Institute without its prior approval
Oxidation reaction kinetics can mainly be controlled by two distinct physical mechanisms:
- Gaseous diffusion of steam from bulk to the cladding wall through the layer enriched in hydrogen generated by the dissociation of water molecules;
- Solid diffusion of oxygen anions in the anion-deficient zirconia layer towards the oxide-metal interface.
During the first few instants of the reaction, if the cladding is not initially oxidised and there is a sufficient quantity of steam in the channel, the reaction rate is initially limited by the mass transfer of steam in the channel to the interface; the reaction rate remains practically constant until the diffusion process in the oxide becomes prevailing, as illustrated in Figure 1.
Figure 1: Mechanisms controlling the metal-water oxidation reaction rate
The diffusion process of oxygen anions into the anion deficient oxide layer is ideally characterised by a parabolic rate equation: if w is a variable representing the quantity of metal consumed or of one of the products (mass gain of the cladding or hydrogen produced per unit of surface, thickness of one or several developed layers), the following applies:
w
K
dt
dw p
2= (differential form)
w2 = Kp t (integral form)
with the reaction rate Kp depending on the temperature according to the following Arrhenius law:
Kp = A exp (-Q/RT)
However, a deviation from the parabolic rate equation was observed for temperatures below ∼ 950°C in the α+β two-phase domain of Zircaloy where oxidation progression is closer to that produced by a cubic law. The oxidation reaction kinetics can therefore be controlled by a third physical phenomenon: the conduction of electrons in the oxide layer flowing in the opposite direction to the oxygen anions. Last of all, the occurrence of the breakaway phenomenon for temperatures < 1050°C and sufficiently long oxidation times results in almost linear kinetics.
T ime
Rea
ctio
n ra
te
parabolic law
c ontrollingrate
ox ide lay er has thic k ened s uffic ient lys o that the res is tanc e it offers to the difffus ion of ionic s pec ies is greater thanthat offered by the hy drogen gas lay er

DPAM/SEMCA 2008-093 A State-Of-The-Art Review Of Past Programmes Devoted To Fuel Behaviour Under Loss-Of-Coolant Conditions. Part 3.
15/239
Ce document est la propriété de l’IRSN et ne peut pas être communiqué ou reproduit sans son autorisation.
This document is IRSN proprietary and shall not be disseminated outside the Institute without its prior approval
It is mainly in the form of the above-mentioned parabolic rate equations that Zircaloy oxidation kinetics have been described, over a more or less broader temperature range and in an empirical manner based on various test series. Most of these test series are described hereafter in Section 2.1 and Chapter 3.
A more detailed description of the high temperature oxidation of Zircaloy, based on solving the oxygen diffusion equation in the different phase layers, has also been recommended, making it possible to calculate the radial profile of the oxygen concentration in the different layers.
Although minor in the 700-800°C temperature range, oxidation can already influence cladding deformation and rupture in the ballooning phase, even though oxidation of the material (and the resulting embrittlement) only occurs significantly at higher temperatures typically above 1000°C.
1.3 Embrittlement of oxidised cladding
The embrittlement of oxidised Zircaloy results from the formation of brittle phases: zirconia ZrO2 and α-Zr stabilised by oxygen, not to mention the diffusion of oxygen in the residual β-Zr ductile phase. The effect of the hydrogen content – absorbed under specific conditions – is also to be taken into account, particularly with regard to the cladding residual ductility after cooling below the precipitation temperature of hydrides.
The capability of oxidised cladding to withstand quench thermal-shock or post-quench mechanical loads was mainly characterised according to the extent of the cladding oxidation, based on various parameters and corresponding criteria.
Chapter 2 reviews the database of results from LOCA-related investigations that were performed before the ECCS acceptance criteria was established in 1973, with Section 2.1 addressing the Zircaloy oxidation kinetics data, and Section 2.2 and 2.3 addressing the thermal-shock and post-quench behaviours, respectively.
Chapter 3, and 4 review the corresponding results obtained after 1973 until recently, addressing respectively : oxidation kinetics (Chapter 3), thermal-shock behaviour and post-quench ductility (Chapter 4). Chapter 5 summarizes the main findings from this review.

DPAM/SEMCA 2008-093 A State-Of-The-Art Review Of Past Programmes Devoted To Fuel Behaviour Under Loss-Of-Coolant Conditions. Part 3.
16/239
Ce document est la propriété de l’IRSN et ne peut pas être communiqué ou reproduit sans son autorisation.
This document is IRSN proprietary and shall not be disseminated outside the Institute without its prior approval
2 EXPERIMENTAL RESULTS AND MODELS AVAILABLE IN 1972
2.1 Oxidation kinetics
2.1.1 Baker–Just correlation and tests
Zirconium-water oxidation reaction kinetics were initially investigated in the 1950s. The resulting reports were reviewed in the Baker & Just study which was published in 1962 [4] and is generally considered as a reference.
In the study carried out by Baker & Just, considerable attention was paid to the possibility of a violent reaction at high temperature with the significant generation of heat and hydrogen leading to a high risk of explosion. This issue was also investigated in earlier research, which explains why tests at temperatures close to the metal’s melting point were carried out. In a certain number of tests, zirconium (or Zircaloy) was heated to melting point and oxidation was measured on the metallic droplets after they dropped into a container of water. In this type of test, the oxidation kinetics of molten metal were not determined in a satisfactory manner, which made it difficult to reach a clear understanding of the physical process dominating the reaction: runaway kinetics or molten metal-water interactions possibly leading to an explosive reaction. This led to the studies carried out by Baker & Just at ANL which were based on a series of tests on filaments immersed in water and heated almost adiabatically by rapid condenser-discharge method. These tests corresponded to initially high temperatures, mainly from 1500°C to melting point at 1852°C (partially molten filament) and beyond (completely molten filament).
In their review of earlier research, Baker & Just mainly referred to the isothermal oxidation kinetic tests on Zircaloy-2 performed in water between 1300°C and 1760°C by Bostrom [5] and in steam between 1000°C and 1690°C by Lemmon [6]. The reaction kinetics of these different tests are illustrated in Figures 2 & 3 and expressed as the square of the mass of hydrogen produced or the mass of metal consumed as a function of time.
Figure 2: Oxidation kinetics between Zircaloy-2 and water (Lemmon data)

DPAM/SEMCA 2008-093 A State-Of-The-Art Review Of Past Programmes Devoted To Fuel Behaviour Under Loss-Of-Coolant Conditions. Part 3.
17/239
Ce document est la propriété de l’IRSN et ne peut pas être communiqué ou reproduit sans son autorisation.
This document is IRSN proprietary and shall not be disseminated outside the Institute without its prior approval
Figure 3: Oxidation kinetics between Zircaloy-2 and water (Bostrom data)
These figures show that the kinetics rather clearly follow a parabolic rate, except at the beginning of oxidation for the Lemmon tests at 1400°C and 1690°C and the Bostrom tests at 1750°C. Baker & Just put this initial deviation from the parabolic rate down to a possible delay in reaching the test temperature or a limitation by gaseous diffusion near the sample surface. Regardless of this fact, the slopes of the straight lines make it possible to calculate the squares of the reaction rate per unit of time for the domains in which growth is parabolic. These values were plotted as a function of the temperature and are illustrated in Figure 4, with the value at melting point (1852°C) obtained from the ANL condenser-discharge experiments. In this figure, the logarithm of the parabolic rate constant expressed as a function of reciprocal temperature was used to determine the following Arrhenius law:
Kp = A exp (-B / RT)
Figure 4 shows that the value at melting point is in line with the Lemmon points at T< 1400°C and consistent with the Bostrom points at 1450°C and 1600°C. However, the 4 Lemmon points at T ≥ 1400°C fall significantly below this correspondence, which could not be explained. A regression analysis over the results produced the following best-fit line:
Kp = 13.85 x 10⁶ exp (-43745 / RT ) (mg Zr /cm2)2/s (with R = 1.987 cal/mole/K)
It seems that Baker & Just preferred using a correlation that provided a more direct link between the melting point from ANL tests and the Lemmon low temperature points. Figure 4 shows that the rate constant correlation retained by Baker-Just (see below) is not far from the previous correlation, but is more conservative.
Kp = 33.3 x 10⁶ exp (-45500 / RT ) (mg Zr /cm2)2/s (2.1)
This law covers the 1000°C to 1852°C temperature range with only one couple of values for the parameters A and B of the Arrhenius law. This means disregarding kinetic discontinuities that can result from crystallographic structural changes, particularly the tetragonal to cubic transformation of zirconia around 1580°C.

DPAM/SEMCA 2008-093 A State-Of-The-Art Review Of Past Programmes Devoted To Fuel Behaviour Under Loss-Of-Coolant Conditions. Part 3.
18/239
Ce document est la propriété de l’IRSN et ne peut pas être communiqué ou reproduit sans son autorisation.
This document is IRSN proprietary and shall not be disseminated outside the Institute without its prior approval
Figure 4: Test results behind the Baker-Just correlation
However, as early as 1966, Pemsler pointed out a change in the reaction activation energy around 900°C related to the monoclinic → tetragonal transformation of oxide. The idea was adopted again in 1968 by Klepfer [7] who recommended using a correlation distinguishing the three allotropic forms of zirconia:
- Monoclinic: T <890°C Kp = 5.52 x 10⁴ exp (-29000 / RT)
- Tetragonal: 890 < T < 1577°C Kp = 3.58 x 10⁵ exp (-33500 / RT) (2.2)
- Cubic: 1577 < T < Tmelting Kp = 1.04 x 10¹¹ exp (-79800 / RT)
The proposed correlation was based on the test results used to define the Baker-Just law. Figure 5 (reproduced from reference [8]) illustrates the law obtained in comparison with the original Baker-Just law. This figure shows that applying only one activation energy between 1000°C and 1852°C in the Baker-Just correlation leads to the considerable overestimation of the oxidation kinetics above 1200°C. However, extrapolation of the kinetics below 1000°C proves to be non-conservative. Though the Klepfer correlation was available in 1972, the Baker-Just correlation was prescribed in the Appendix K of 10CFR50.46 for the calculation of Zircaloy cladding oxidation rate in LOCA evaluation models.
0.1
1
10
100
1000
10000
4.E-04 5.E-04 6.E-04 7.E-04 8.E-04 9.E-04
1 / T (°K)
Par
abol
ic r
ate
cons
tant
(m
g Z
r/cm
2 )2 /s
Lemmon (WAPD-104)
Bostrom (BMI-1154)
B&J (ANL-6548)
Linear regression
Baker-Just
k = 33.3 E6 exp(-190463/RT)
k = 13.85 E6 exp(-183117/RT)
Liquid Solid
100012001400160018002000 T (°C)

DPAM/SEMCA 2008-093 A State-Of-The-Art Review Of Past Programmes Devoted To Fuel Behaviour Under Loss-Of-Coolant Conditions. Part 3.
19/239
Ce document est la propriété de l’IRSN et ne peut pas être communiqué ou reproduit sans son autorisation.
This document is IRSN proprietary and shall not be disseminated outside the Institute without its prior approval
Figure 5: Zircaloy oxidation kinetics (correlation recommended by Klepfer)
2.1.2 Hobson & Rittenhouse correlation
The Hobson & Rittenhouse tests [9] at ORNL were designed to evaluate the ductility limits at low or medium temperature of Zircaloy cladding samples following a LOCA transient. Nineteen tubes, taken from PWR cladding (46 cm long, outer diameter of 10.72 mm, 0.69 mm thick), were oxidised

DPAM/SEMCA 2008-093 A State-Of-The-Art Review Of Past Programmes Devoted To Fuel Behaviour Under Loss-Of-Coolant Conditions. Part 3.
20/239
Ce document est la propriété de l’IRSN et ne peut pas être communiqué ou reproduit sans son autorisation.
This document is IRSN proprietary and shall not be disseminated outside the Institute without its prior approval
on both sides in steam under isothermal conditions in a furnace (∆t = 2 to 60 min, Tox = 927 to 1371°C). They were then quenched at Tox, before undergoing the deformation tests described in chapters 2.3.5 and 2.3.6.
By measuring the thickness ξ of the combined layer of oxide + α-Zr[O] phase, Hobson & Rittenhouse checked that the growth kinetics of ξ were parabolic, described as such:
ξ = δ√t
However, the lowest oxidation temperature (927°C) is located in a domain where it was later shown that the oxide growth kinetics were cubic below 3600 s [3]; the three experimental points by Hobson & Rittenhouse at 927°C are effectively better represented by cubic kinetics.
The expression they recommend for the empirical correlation of the δ coefficient in relation to the temperature is rather unexpected:
δ = -1.70 x 10⁻³ + 1.08 x 10⁻⁶ T + 5.15 x 10⁻⁶ T exp [.0.0168 (T-2200)] (T in °F) (2.3)
As indicated in Figure 6 (reproduced from reference [9]), it is not surprising to observe in this form that the ξ variation with temperature is practically linear up to 2200°F before rising very rapidly above this limit. The acceleration near 2500°F can undoubtedly be explained by the relatively more important influence of the heat-up to the test temperature, apparently disregarded by Hobson & Rittenhouse. Scatena’s [8] application of this model to the TTE test results (cf. § 2.2.2.1) led to ξ values greater than the cladding thickness for temperatures above 2500°F (1371°C), which demonstrates that this correlation cannot be extrapolated beyond 1371°C.
Figure 6: Rate of change of ξξξξ versus temperature as proposed by Hobson & Rittenhouse
As early as 1973 however, Pawel recommended a “standard” reformulation of the δ correlation drawn from the Hobson & Rittenhouse results in the form of an Arrhenius law [10]:
δ2/2= 0.3538 x exp( -41054 /RT) (cm2/s) (2.4)

DPAM/SEMCA 2008-093 A State-Of-The-Art Review Of Past Programmes Devoted To Fuel Behaviour Under Loss-Of-Coolant Conditions. Part 3.
21/239
Ce document est la propriété de l’IRSN et ne peut pas être communiqué ou reproduit sans son autorisation.
This document is IRSN proprietary and shall not be disseminated outside the Institute without its prior approval
2.2 Resistance to quench thermal-shock
2.2.1 ANL tests
The Argonne National Laboratory (ANL) tests by Hesson et al. published in 1970 [11] included several test series on Type 304 stainless steel or Zircaloy-2 cladding tubes containing UO2 pellets. The following test series were performed on Zircaloy-cladded rods:
a) 9 oxidation tests (8 single-rod tests, 1 test on a 4-rod bundle) in a furnace at temperatures of 1500°C to 1700°C without final quenching;
b) 2 meltdown tests (1 single-rod test, 1 test on a 4-rod bundle) by induction heating in flowing steam atmosphere and without final quenching;
c) 3 quench tests on single rods inductively-heated in flowing steam to high temperatures (1850°C, 2045°C & 2820°C) and then suddenly quenched by water sprayed from the top; these demonstrative tests proved that the extent of fragmentation was not necessarily related to the maximum temperature reached during the transient;
d) 18 parametric oxidation tests followed by quenching on single rods heated by induction;
e) 5 hydriding tests on single rods (3 on bare cladding, 2 on cladding pre-oxidised at 1100°C in steam) inductively-heated at high temperature (1400 – 1650°C).
The test results of series d) and e) provided by the authors in [11] will be explained and commented in detail hereafter.
2.2.1.1 Parametric oxidation and quench tests
All 18 tests were designed to evaluate the extent of damage and quench resistance after oxidation transients by testing the influence of various parameters:
• Heating rate,
• Maximum temperature before quenching,
• Reflood method (from the top or the bottom),
• Heating maintained or not during reflood.
These tests were performed on single-rods containing UO2 pellets encased in Zircaloy-2 tubing and filled with helium to a pressure of 0.7 bar. The outer diameter of the cladding was 14.4 mm (0.567") with a thickness of 787 µm (0.031"). The device (see Figure 7) was composed of a quartz tube containing the test rod and positioned into the coils of an induction heater with a heating length of 76 mm (3"); the steam was injected at the bottom of the tube and excess steam was condensed at the exit to measure the volume of hydrogen produced; reflood could be performed either from the bottom or the top of the quartz tube. The temperature was measured with a W-Re thermocouple positioned on the inside of the cladding near the median plane of the heated length.
Figure 7: ANL device used for parametric tests

DPAM/SEMCA 2008-093 A State-Of-The-Art Review Of Past Programmes Devoted To Fuel Behaviour Under Loss-Of-Coolant Conditions. Part 3.
22/239
Ce document est la propriété de l’IRSN et ne peut pas être communiqué ou reproduit sans son autorisation.
This document is IRSN proprietary and shall not be disseminated outside the Institute without its prior approval
Table 1 lists the test results in order of increasing average oxidation rate ECRi over the entire heated area.
Except for test No. 16, all tests in this series involved a temperature ramp of about 5°C/ s up to a predetermined temperature at which quenching was performed from the bottom or the top, depending on the test.
In order to simulate the persistence of the residual power during the reflood in a real LOCA, the electric power of the HF heating was maintained during the reflood phase for a certain number of tests. However, considering the considerable heat losses from a single rod, the power injected to reach the desired temperatures before quenching was significantly higher than the residual power in an actual fuel rod; this option maximised oxidation during the reflood phase and therefore the final oxidation rate.
Test No.
Heating Rate
(°C/s)
Quench Temp.
(°C)
Quench method
Power during quench
H2 produced
(mole)
ZrO2 developed (a) (mole %)
Average Max
Apparent dissolved O2in the Zr
(mole %)
Average ECR
(b)
(mole %)
Final state of cladding
(c)
12 9.0 1064 Top On 0.0 1.6 3.2 - - Int
16(d) ~50 1182 Top On 0.024 3.8 5.4 2.9 6.59 Int
4 4.8 1462 Bottom Off 0.025 3.5 6.8 3.45 6.87 Int
15 6.4 1548 Top Off 0.025 4.0 8.0 3.0 6.87 Int
7 6.0 1488 Bottom On 0.026 3.7 6.1 3.6 7.14 Int
8 3.1 1534 Bottom On 0.029 4.8 8.0 3.34 7.97 Int
9 5.2 1498 Top On (3.55)e 0.042 7.0 12.0 4.88 11.54 Int
5 5.0 1663 Bottom Off 0.062 12.3 21.1 5.0 17.03 Int
17 4.8 1798 Bottom Off 0.067 14.0 22.0 4.5 18.40 R-Ha
18 4.6 1569 Top On (3.0)e 0.068 14.3 22.3 4.5 18.68 R-Ha
10 4.5 1650 Top Off 0.080 17.6 29.0 5.18 21.98 R-Ha
6 5.7 1864 Bottom Off 0.081 17.4 34.5 5.6 22.25 R-Ha
11 5.7 1849 Top Off 0.081 16.0 22.1 7.3 22.25 R-Ha
3 4.7 1646 Bottom On 0.093 13.0 25.0 - 25.55 R-Q
13 5.1 1663 Top On (4.18)e 0.102 20.5 34.0 9.3 28.02 R-Ha
14 6.5 2052 Top On (2.75)e 0.14 30.0 41.0 12.0 38.46 R-Q
1 6.3 2110 Top On >0.1 - ~100 - - R-Q
2 5.2 1868 Top On >0.1 - ~100 - - R-Q
a: According to metallographic examination.
b: Average over the heated length based on the quantity of hydrogen produced.
c: Int= intact ; R-Ha= rupture during handling (metallographic preparation) ; R-Q = rupture during quenching.
d: Specific temperature transient simulating predetermined emergency core cooling conditions.
e: Time at which the power was turned off after the start of quench (min).
Table 1: Summary of ANL parametric tests of induction-heated, water-quenched rods
The table above shows a non-failure limit at 17% in terms of the average ECR oxidation rate for resistance to quench and "gentle handling" (as qualified by the authors). The degree of
i ECR (Equivalent Cladding Reacted) = equivalent oxidation rate defined as the fraction of Zr consumed (in relation to the initial thickness) if all the oxygen absorbed during the reaction and having reacted locally with the cladding were converted into stoichiometric zirconium dioxide.

DPAM/SEMCA 2008-093 A State-Of-The-Art Review Of Past Programmes Devoted To Fuel Behaviour Under Loss-Of-Coolant Conditions. Part 3.
23/239
Ce document est la propriété de l’IRSN et ne peut pas être communiqué ou reproduit sans son autorisation.
This document is IRSN proprietary and shall not be disseminated outside the Institute without its prior approval
fragmentation used to differentiate between the samples declared intact or ruptured is not specified.
Ruptures occurring with an ECR ≥ 18.4% all corresponded to temperature rises above 1560°C, therefore being considerably above a standard LOCA temperature range. Test No. 16 was based on a realistic LOCA transient (Tmax = 1182°C) however and led to a low oxidation rate, with the sample remaining intact after the transient.
Furthermore, ruptures observed with the lowest ECR actually occurred during handling in preparation for metallographic examinations; the lowest rupture during quenching occurred with an ECR of 25.5%.
It must be remembered that the ECR values represent average values over the entire rod (deduced from the quantities of released hydrogen), which are therefore lower than local values in the most embrittled areas. Examination of zirconia thicknesses revealed a factor of at least 1.4 between the maximum value and the average value on the same rod; application of this ratio, as a first approximate, between the maximum and average ECR values would result in an ECR of 35.7% for the lowest rupture during quenching.
Hesson did however express certain reservations: “…the unrestrained fuel rods that did not fail in these tests might have failed if subjected to the restraints and warpage that could occur in bundles of fuel rods in a reactor core.”
2.2.1.2 Hydriding tests
To evaluate the relative importance of hydriding associated with hydrogen production in the lower part of core capable of affecting the upper part of the rods during a LOCA, five scoping tests were performed on single rods with characteristics identical to those of the previous parametric test rods. Tests involved induction heating and maintaining the rods at a temperature of 1400°C to 1650°C for 6 to 9 minutes without final quenching. Table 2 summarises the conditions and results of these 5 tests.
Test T_plateau
(°C)
Time at T_plateau
(min)
Ambient gas
Absorbed H2 (at.%) mole average
Oxidation (%)
Max Average Final state of cladding
H1 1650 9 H2 0.049 34 - - Failure near ends of heated
section
H2 1400 6 H2+H2O not measured 9.7 6.1 Intact
H3 1400 6 H2 0.016 15 - - Intact
H4 1400 6 H2 0.0018 2 ~2 ~1.5 Intact
H5 1500 6 H2 0.00805 8 ~2 ~1.5 Intact
Table 2: ANL hydriding tests
H1 and H3 tests were performed on bare samples, whereas tests H4 and H5 were performed on samples pre-oxidised at 1100°C in steam (7 min for H4 and 6 min for H5). The ambient gas used in H2 was a mixture of 50% H2 + 50% H2O.
Metallographic examination of H1 to H4 samples revealed minimum hydriding in the median plane and maximum hydriding towards the ends of the heated length, therefore towards the coldest areas (3" heated length of the 12" long tubes), which corresponds well with the location of the rupture observed on the only H1 sample.
Comparison of the H2 and H4 samples with the H3 sample - all having been subjected to identical time-temperature conditions -, revealed:

DPAM/SEMCA 2008-093 A State-Of-The-Art Review Of Past Programmes Devoted To Fuel Behaviour Under Loss-Of-Coolant Conditions. Part 3.
24/239
Ce document est la propriété de l’IRSN et ne peut pas être communiqué ou reproduit sans son autorisation.
This document is IRSN proprietary and shall not be disseminated outside the Institute without its prior approval
- Less hydriding on H2 (visible on the metallographic cross-sections), certainly due to the formation of oxide in the H2+H2O mixture;
- Less hydriding also on H4 (about 1/10th according to the results in Table 2), due to the initial presence of the pre-oxidised layer.
According to the authors, the five hydriding tests mentioned above were mainly considered as scoping tests. These tests were not subject to any constraints, not even quench thermal shock. It therefore proves difficult to compare these results with the previous parametric tests and conclude that the embrittling effects of hydriding are secondary in relation to those resulting from oxidation, as indicated in reference [11].
2.2.2 General Electric tests (BWR rods)
2.2.2.1 Single-rod tests (TTE tests)
Time-temperature environment (TTE) tests were briefly reported in Appendix A of [8]. Two series (TTE-1 & TTE-2) were performed, respectively involving 8 and 6 tests on single rods.
2.2.2.1.1 Description of test equipment and procedure
The test rod was composed of a molybdenum heating element inserted in the GE-BWR type Zircaloy-2 cladding tube (91.4 cm long, 813 µm thick with an outer diameter of 14.3 mm) and isolated from the latter by alumina powder filling. The heated length was 30.5 cm (12 ") long.
The instrumentation of the TTE-1-1 to TTE-1-6 tests included only 2 thermocouples welded onto the inner surface of the cladding, with one positioned in the median plane and the other at the end of heated length. Early failure of the median-plane thermocouple was observed in 6 tests and was explained by the Zr-alumina interaction occurring around 1150°C; an additional thermocouple was therefore added on the outer surface of the cladding at the same level on the TTE-1-7 and TTE-1-8 test rods. For the TTE-2 series, 3 thermocouples (bottom, middle, top) were positioned on the only outer surface of the rods. This new feature did not however exclude the possibility of Zr-alumina interactions and their related effects (cf. BWR/ FLECHT tests, chapter 2.2.2.2).
After establishing a steam flow rate of 10 g/mn, the transient involved a heatup ramp of about 2 to 10 K/s until the average temperature of 2400°K (1315°C) was reached and maintained for several minutes before reflooding from the bottom with water. As was the case in some ANL tests (cf. § 2.2.1.1), power was maintained in the rod until the temperature dropped to about 600°F (315°C).
The mechanical tests performed on samples taken from the TTE-2 rods (except for TTE-2-4) are described in chapter 2.3.7.
2.2.2.1.2 Results
All rods remained intact after quenching except the TTE-1-7 test rod, shown to have failed near one end. This test underwent a more severe transient than the other tests (cf. Figure 8) in which, after a rather slow temperature rise to 2400°C (1315°C) in 32 minutes, the temperature escalated to 3000°F (1650°C) just before or during early quenching; the equivalent oxidation rate ECR was evaluated at 17.6% for this test, whereas it did not exceed 13% in the other tests (cf. Figure 9, § 2.2.3.1). Moreover, the oxidation rate in the TTE-1-7 test was that in the median plane, determined from metallographic measurements of the oxide and alpha-Zr layers thicknesses, thus in an intact area and not near the failed area for which local disturbance resulting from a Zr-alumina interaction cannot be excluded.

DPAM/SEMCA 2008-093 A State-Of-The-Art Review Of Past Programmes Devoted To Fuel Behaviour Under Loss-Of-Coolant Conditions. Part 3.
25/239
Ce document est la propriété de l’IRSN et ne peut pas être communiqué ou reproduit sans son autorisation.
This document is IRSN proprietary and shall not be disseminated outside the Institute without its prior approval
Figure 8: Temperature history in the test TTE-1-7.
Metallographic examinations were performed on each rod after testing: one examination in the median plane for the TTE-1 tests and one examination at each of the 3 thermocouple locations for the TTE-2 tests. This made it possible to distinguish 25 different test results in terms of time-temperature for only 14 rods.
Table 3, reproduced from [8], provides measurement results of oxide and Zr-α thicknesses from metallographic examinations, as well as the load and deflection values at failure for the ring compression tests performed on TTE-2 rods.
A layer of Zr-α on the inner surface of 4 TTE-1 rods and on all the TTE-2 rods could be observed. According to the authors, this layer resulted from the Zr-Al2O3 interaction. This layer must therefore be taken into account when evaluating the remaining Zr-β thickness, yet there is no evidence to suggest that the average oxygen concentration is similar to that found on the outer layer, which brings into question the calculation of the ECR equivalent oxidation rate.
Later on, the Zr-Al2O3 interaction, which also occurred in the TMI-2 [12] burnable poison rods during the start-up cycles, was studied by Hofmann [13] within the framework of the CORA B & C scoping tests; the progression kinetics of the inner α-Zr(O)/ β-Zr interface were similar to the diffusion kinetics of oxygen in the α-Zr(O) phase.

DPAM/SEMCA 2008-093 A State-Of-The-Art Review Of Past Programmes Devoted To Fuel Behaviour Under Loss-Of-Coolant Conditions. Part 3.
26/239
Ce document est la propriété de l’IRSN et ne peut pas être communiqué ou reproduit sans son autorisation.
This document is IRSN proprietary and shall not be disseminated outside the Institute without its prior approval
Stabilized α layer thickness
(µm)
Oxide + α layers total thickness
(µm)
Dt x 10-3
(cm)
Ring Compression Test Series
Sample
N°
Outer Oxide
Thickness
(µm) O.D. I.D. O.D. O.D. +I.D.
Load* (kg)
Deflection (mm) (%)
1 13 None None 13 13 4.1
2 28 51 None 79 79 5.8
3 33 58 None 91 91 5.8
4 38 66 69 104 173 7.9
5 51-58 71 None 127 127 4.5
6 23-38 46 38 76 114 8.3
7 137 305 76 442 518 19.1
TTE-1
8 64-71 102 66 170 236 10.8
1-Top 89 216 114 305 419 14.5 29.9 0.287 2.0
1-Med 81 168 117 249 366 - 25.8 0.185 1.3
1-Bot 89 124 112 213 325 8.9 28.5 0.234 1.6
2-Top 84 64 81 147 229 12.0 29.0 0.274 1.9
2-Med 69 102 79 170 249 7.9 19.1 0.211 1.5
2-Bot 56 53 56 109 165 6.3 30.7 0.351 2.4
3-Top 23 51 33 74 107 4.3 46.0 1.270 8.9
3-Med 10 25 10 36 46 2.5 121.1 3.124 21.9
3-Bot 20 5 8 25 33 0.8 152.4 3.886 27.2
4-Top 56 272 170 328 498 23.3 - - -
4-Bot 66 216 142 282 424 14.5 - - -
5-Top 33 254 91 287 378 19.7 1.5 0.137 1.0
5-Med 114 114 112 229 340 21.8 14.8 0.211 1.5
5-Bot 69 157 135 226 361 10.1 22.6 0.196 1.4
6-Top 10 13 10 23 33 1.1 130.6 4.04 28.3
6-Med 10 13 8 23 30 1.9 111.6 5.74 40.2
TTE-2
6-Bot 10 15 10 25 36 1.2 131.5 3.68 25.8
* At failure
Table 3: TTE test results

DPAM/SEMCA 2008-093 A State-Of-The-Art Review Of Past Programmes Devoted To Fuel Behaviour Under Loss-Of-Coolant Conditions. Part 3.
27/239
Ce document est la propriété de l’IRSN et ne peut pas être communiqué ou reproduit sans son autorisation.
This document is IRSN proprietary and shall not be disseminated outside the Institute without its prior approval
2.2.2.2 Bundle experiments (BWR/FLECHT tests)
Three BWR/FLECHT tests (called Zr-3, Zr-4 & Zr-5) were performed from March to June 1970; these tests are detailed in [14]. Two preliminary tests (Zr-1 & Zr-2) had previously been performed on stainless steel cladded rod bundles.
2.2.2.2.1 Equipment and test conditions
Tests were performed on 7 x 7 full-length rod bundles encased in a dual housing, with an inner wall made of 2 mm thick Zircaloy-2 and an outer wall made of 3.17 mm thick stainless steel. The dual channel arrangement created a flow path simulating that occurring between one fuel bundle and the adiabatic surface around it created by the surrounding bundles in a reactor core. The rod cladding was a standard GE Zircaloy-2 cladding tube with an outer diameter of 14.27 mm and thickness of 813 µm (identical to the TTE test cladding). The rods were heated with molybdenum heating elements, isolated by alumina filling; the heated length was 366 cm (144") for a total tube length of 422 cm (166"). The power was radially-distributed in the bundle in 6 groups of rods.
Bundle instrumentation was ensured by 44 thermocouples spot welded to the outer surface of 14 to 24 rods, depending on the test, with the median plane (72") being the most instrumented section.
The test transient involved a temperature ramp in the bundle under a steam atmosphere up to a prescribed temperature at which cooling by spraying was triggered; this spraying was followed by reflooding from the bottom in test Zr-5 (triggered 1 minute after the beginning of spraying).
Table 4 summarises the conditions of all 3 tests.
Zr-3 Zr-4 Zr-5
Maximum power (kW) 240 240 300
Spray flow rate (litre/min) 9.27 9.27 12.30
Cooling water temperature (°C) 56 56 56
Flooding rate (cm/s) - - 15.2
Maximum temperature at the beginning of spraying (°C)
- Median plane
- Hot spot
998
1285
1259
1259
1274
1274
Table 4: BWR/FLECHT test conditions
2.2.2.2.2 Observations and results
During the test transients, two disturbing phenomena occurred:
a) A strong variation in the electrical resistivity of molybdenum as a function of temperature, which resulted in an atypical axial power distribution in comparison with the reactor case: the power density increased in the hot areas and the axial shift was particularly sensitive during the spraying phase during which electrical power was maintained;
b) Chemical interaction between Zircaloy and the alumina-insulating material, resulting in the formation of liquid compounds (Zr,Al) at low temperature. These compounds penetrated the outer layer of the cladding, causing the liquid metal to come into contact with steam and resulting in unexpected local temperature excursions.
The combination of these two phenomena resulted in local temperature peaks of about 1600°C, which explains the failure of the nearby thermocouple and considerable local damage (oxidation, fragmentation or melting of cladding). Such damage is not typical of reactor assembly performance under LOCA; corresponding time-temperature data can therefore not be used to characterise the cladding failure range under LOCA conditions.

DPAM/SEMCA 2008-093 A State-Of-The-Art Review Of Past Programmes Devoted To Fuel Behaviour Under Loss-Of-Coolant Conditions. Part 3.
28/239
Ce document est la propriété de l’IRSN et ne peut pas être communiqué ou reproduit sans son autorisation.
This document is IRSN proprietary and shall not be disseminated outside the Institute without its prior approval
However, most of the time-temperature data provided by the thermocouples located in the areas that remained intact could still be used to characterise the non-failure range. It seems it was these points that were used in Scatena’s analysis of the test results (cf. § 2.2.3).
Duncan & Leonard merely compared the thicknesses of oxide and oxide + α-Zr layers revealed in metallographic examinations with previous results and model predictions. They noticed an obvious overestimation of the oxide layer using the Baker-Just correlation. They pointed out that a rate constant of 0.84 times that recommended by Baker & Just was found to overpredict 90% of the cladding oxidation data; a constant of 0.55 times that of Baker-Just was recommended for use in obtaining the best-estimate prediction of these oxidation rates.
2.2.3 Analysis of results
Analysis of test results from the different programmes discussed above was carried out by Scatena [8]. Thermal shock failure limits were examined in this analysis in relation to several parameters characterising the degree of oxidation. The different methods and correlations used to calculate these parameters were also evaluated.
2.2.3.1 Criterion based on Equivalent Cladding Reac ted (ECR)
Let be recalled here that the equivalent cladding reacted (ECR) is defined as the fraction of Zr consumed (in relation to the initial thickness) if all the oxygen having been diffused during the reaction and having reacted with the cladding locally were converted to stoichiometric ZrO2.
Figure 9 illustrates ANL and GE test results plotted in terms of equivalent cladding reacted (ECR) versus quench temperature .
Though the ANL results (cf. Table 1) provide an average experimental ECR value (derived easily from the volume of released H2), the same does not apply to the TTE and BWR/FLECHT tests, for which only local measurements of oxide and Zr-α thicknesses from metallographic examinations were available. It therefore seems that the ECR was determined from the oxide and alpha thicknesses according to the following type of relationship:
+
oxC
Ceoxe
inie
1-PBR= ECR αα (2.5)
where PBR represents the ratio between the thickness of the ZrO2 layer formed and the Zr thickness consumed during the oxidation reaction, with:
αC = Average oxygen concentration in the Zr-α layer (determined from the phase diagram),
oxC = Average oxygen concentration in the oxide layer.
Figure 9 reveals an ECR failure range of > 17% and T > 2860°F (=1570°C), but the small number of points near the ECR limit (only 3 tests failed with an ECR < 22%) is to be underlined; it must be recalled once again that failure at quenching in ANL tests does not occur before reaching an ECR of 25% (rod average), with the points located below corresponding to failure during handling operations.

DPAM/SEMCA 2008-093 A State-Of-The-Art Review Of Past Programmes Devoted To Fuel Behaviour Under Loss-Of-Coolant Conditions. Part 3.
29/239
Ce document est la propriété de l’IRSN et ne peut pas être communiqué ou reproduit sans son autorisation.
This document is IRSN proprietary and shall not be disseminated outside the Institute without its prior approval
Figure 9: Experimental fragmentation limits from ANL and GE tests

DPAM/SEMCA 2008-093 A State-Of-The-Art Review Of Past Programmes Devoted To Fuel Behaviour Under Loss-Of-Coolant Conditions. Part 3.
30/239
Ce document est la propriété de l’IRSN et ne peut pas être communiqué ou reproduit sans son autorisation.
This document is IRSN proprietary and shall not be disseminated outside the Institute without its prior approval
Scatena then compared the experimental ECR values of the ANL and TTE results with predictions obtained using various other models:
a) Baker-Just correlation (2.1) (only one law for the 900-1850°C interval);
b) Klepfer correlation (2.2) (one law for each allotropic range of zirconia: monoclinic, tetragonal & cubic);
c) Hobson & Rittenhouse correlation calculating the ξ thickness of the combined oxide plus stabilized α-Zr layer by:
ξ = {-1.70 x 10⁻³ + 1.08 x 10⁻⁶ T + 5.15 x 10⁻⁶ T exp [.0.0168 (T-2200)]} (T in °F)
associated with a relationship giving the fraction F of ξ consisting of ZrO2; it was possible to correlate this fraction with the ξ thickness based on the TTE and ORNL tests as shown in Figure 10; the relationship (2.5) was then used to determine the ECR.
Figure 10: Relative fraction of ZrO2 in ξξξξ for various degrees of oxidation
Figure 11 illustrates the performance of the 3 models discussed above in comparison with experimental data from the TTE and ANL tests. It can be observed that the Baker-Just correlation (Figure 11a) overestimates the oxidation rate by about a factor of 2 (confirming Duncan’s observations § 2.2.2.2.2), whereas the Klepfer correlation (Figure 11b) provides a better prediction. The Hobson & Rittenhouse correlation provides a correct prediction except for the 4 points for which the calculated ECR reaches 100%: these are TTE test points with T>2500°F, which are outside the range of validity for the ONRL correlation (1700<T<2500°F). For the same reason, the ANL points are not plotted on Figure 11c: since most of these tests were performed at T>2500°F, the ONRL correlation would have predicted an ECR of 100%.

DPAM/SEMCA 2008-093 A State-Of-The-Art Review Of Past Programmes Devoted To Fuel Behaviour Under Loss-Of-Coolant Conditions. Part 3.
31/239
Ce document est la propriété de l’IRSN et ne peut pas être communiqué ou reproduit sans son autorisation.
This document is IRSN proprietary and shall not be disseminated outside the Institute without its prior approval
(a) Baker/Just
(b) Klepfer
(c) Hobson & Rittenhouse
Figure 11: Comparison of experimental ECR with calculated rate using different rate equations

DPAM/SEMCA 2008-093 A State-Of-The-Art Review Of Past Programmes Devoted To Fuel Behaviour Under Loss-Of-Coolant Conditions. Part 3.
32/239
Ce document est la propriété de l’IRSN et ne peut pas être communiqué ou reproduit sans son autorisation.
This document is IRSN proprietary and shall not be disseminated outside the Institute without its prior approval
2.2.3.2 Criterion based on Dt** 1/2
It has been shown that the displacement of the α-Zr[O]/β-Zr boundary (slightly different parameter from the ξ thickness representing the combined oxide+α-Zr layer) could be simply expressed by:
ψ = 2 γ Dt (2.6)
where,
γ = dimensionless parameter dependent on the oxygen concentration at the various interfaces,
D = oxygen diffusion coefficient in the α-Zr.
Experimentally, several similar empirical correlations of the following form were established:
ψ = a Dt + b (2.7)
The work of Meservey and Herzel [15] suggested that a failure criterion based on the Dt parameter was possible; Figure 12 illustrates ANL and GE results plotted in terms of quench temperature and calculated Dt .
Figure 12: Experimental fragmentation limit with respect to Dt

DPAM/SEMCA 2008-093 A State-Of-The-Art Review Of Past Programmes Devoted To Fuel Behaviour Under Loss-Of-Coolant Conditions. Part 3.
33/239
Ce document est la propriété de l’IRSN et ne peut pas être communiqué ou reproduit sans son autorisation.
This document is IRSN proprietary and shall not be disseminated outside the Institute without its prior approval
Note: An inner layer of Zr-α developed in the TTE tests owing to the Zr/Al2O3 interaction. The contribution of this layer was taken into account by calculating the corresponding Dt value according to (2.7), before adding this result to the value determined for the outer surface.
Figure 12 suggests a failure limit due to quenching at a Dt value of about 0.02 cm, with Scatena
having disregarded the ANL-3 point (failure at quenching with Dt =0.016 cm) owing to the slow rod cooldown in this test, deemed atypical for a BWR case (see § 2.3.1 & 2.3.3).
By calculating the upper bound value of ECR corresponding to the Dt values of ANL and GE tests (using the upper bounds of the correlation (2.7) and Figure 10), Scatena observed (see Figure
13)that the limit of 17% in terms of the ECR corresponded to 0.02 cm in terms of the Dt ; the ANL-3 point having been disregarded in this plot.
Although it appears that a fragmentation limit of 0.02 cm for Dt was insufficiently supported by various test results, this limit was considered to correspond to the 17% ECR criterion in a conservative manner.
Figure 13: Relationship between ECR and Dt
2.2.3.3 Criterion based on a fraction of the ductil e phase
As was the case for the previous criterion, Scatena simply looked for the correspondence between the fraction of transformed β phase in the wall thickness (Fw) and the 17% ECR limit: Figure 14 shows that the bounding curve of the GE data, plotted in terms of Fw and ECR intersects the ECR value of 17% for a value of Fw ∼ 0.5. Once again, this is a conservative estimate, with a best estimate being closer to Fw∼0.4 for an ECR=17%.

DPAM/SEMCA 2008-093 A State-Of-The-Art Review Of Past Programmes Devoted To Fuel Behaviour Under Loss-Of-Coolant Conditions. Part 3.
34/239
Ce document est la propriété de l’IRSN et ne peut pas être communiqué ou reproduit sans son autorisation.
This document is IRSN proprietary and shall not be disseminated outside the Institute without its prior approval
Figure 14: Experimental fragmentation limits
Relationship between ECR and the fraction Fw of transformed ββββ phase in the wall thickness
2.2.3.4 Temperature criterion
As shown in Figures 9 and 12, Scatena suggested a temperature threshold of 2700°F (=1482°C), representing the lower bound of failures observed in the ANL and GE tests. This threshold is therefore considerably higher than the threshold in force at the time (2300°F = 1260°C) for the interim acceptance criterion (IAC).
It is nevertheless obvious that a temperature threshold, at least for these levels, is only valid if it is associated with a time at temperature, which in fact amounts to an oxidation rate limit.

DPAM/SEMCA 2008-093 A State-Of-The-Art Review Of Past Programmes Devoted To Fuel Behaviour Under Loss-Of-Coolant Conditions. Part 3.
35/239
Ce document est la propriété de l’IRSN et ne peut pas être communiqué ou reproduit sans son autorisation.
This document is IRSN proprietary and shall not be disseminated outside the Institute without its prior approval
2.3 Post-oxidation ductility
2.3.1 Cincinnati General Electric tests
In April 1970, Juenke & White [16] published the final report on mechanical tests performed on Zircaloy-4 oxidised samples. Most of the tests were performed on plates 50.8 cm long, 12.7 mm wide and 0.76 mm thick, with a tin content of 1.39%. These plates had been previously oxidised in a furnace under dry oxygen at 600°C – 700°C before being homogenised under purified argon at 1050°C for 15 to 16 hours.
Oxygen is thermodynamically more stable in solution in the metal than in oxide form [17]. When a partially-oxidised sample is heated at high temperature without any additional oxidising agent, the oxide is reduced by the metal that is non-saturated in oxygen according to the following reaction:
)42,0(2
122
<→
−+ xxZrOZrx
ZrOx
(2.8)
This is the standard way of preparing homogenous samples of zirconium alloy containing oxygen.
Two types of tests were performed: three-point bend tests and tensile tests. The bend tests were performed at a displacement rate of 2.54 cm/min. The results of these tests are provided in Figure 15; the displacement at fracture decreases when the oxygen content increases and reaches zero between 9.5 and 12 at.% O. The displacement corresponding to the elastic range is not identifiable in this figure.
Figure 15: Crosshead displacement at fracture versus oxygen content of Zircaloy-4 sheet
Tensile tests were performed on plate specimens with a length of 76 mm and a thickness of 0.76 mm, with a 6.4 mm wide by 25.4 mm long gauge section. Test results are provided in Figure 16, revealing a test temperature effect: the samples with 2.5 at.% O are brittle at ambient temperature but ductile as early as 300°C, whereas samples with 5.4 at.% O are ductile at 600°C and samples at 9.8 at.% O are still brittle at 600°C.

DPAM/SEMCA 2008-093 A State-Of-The-Art Review Of Past Programmes Devoted To Fuel Behaviour Under Loss-Of-Coolant Conditions. Part 3.
36/239
Ce document est la propriété de l’IRSN et ne peut pas être communiqué ou reproduit sans son autorisation.
This document is IRSN proprietary and shall not be disseminated outside the Institute without its prior approval
Figure 16: Tensile tests on oxidised and homogenised Zry-4. Ductility as a function of the oxygen content and test temperature (from Table 11, GEMP-731)
The programme was abandoned before completion for budgetary reasons. Only a limited number of tests were performed on partially-homogenised samples in an argon atmosphere at 1000°C. The results of bend tests are provided in Figure 17 and illustrate the decrease in the displacement at fracture in relation to the duration of the homogenisation process (reduction in the thickness of the β-Zr layer or even disappearance and increase in its oxygen content).
Figure 17: Three-point bend tests on homogenised Zry-4 after oxidation between 6 and 10 at.% O. Displacement at fracture versus homogenisation time (from Table 10, GEMP-731)
0
100
200
300
400
500
600
700
0 2 4 6 8 10 12Oxygen content (at%)
Ten
sile
test
tem
pera
ture
(°C
)
BrittleDuctileTransition
0
0.5
1
1.5
2
2.5
3
3.5
4
4.5
0 2 4 6 8 10 12 14 16Homogenisation time at 1000°C (hours)
Dis
plac
emen
t at f
ract
ure
(mm
)

DPAM/SEMCA 2008-093 A State-Of-The-Art Review Of Past Programmes Devoted To Fuel Behaviour Under Loss-Of-Coolant Conditions. Part 3.
37/239
Ce document est la propriété de l’IRSN et ne peut pas être communiqué ou reproduit sans son autorisation.
This document is IRSN proprietary and shall not be disseminated outside the Institute without its prior approval
2.3.2 Meservey & Herzel tests (Idaho Nuclear)
In September 1970, Meservey & Herzel [15] published the report on ring compression tests performed on Zry-2samples oxidised on the outer surface. These samples were taken from tubes with an outer diameter of 14.35 to 16.10 mm and a thickness of 0.762 to 0.777 mm. They were oxidised in a furnace in a water steam atmosphere either isothermally or according to a transient representative of BWR transients. The insides of these tubes were flushed with argon.
Two types of compression tests were performed: radial and axial tests. Radial compression tests were performed on 13 mm long rings at a strain rate of 1.3 mm per second. In these compression tests, the failure was identified by a significant load drop without subsequent recovery and the deflection was evaluated as a percentage of the tube’s initial diameter. Quantitative deflections were not documented in the report. Qualitative results are provided in Figure 18 and make it possible to distinguish the samples with zero ductility rupturing in the elastic domain.
Figure 18: Load-deflection curves obtained from radial compression tests
Several axial compression tests were performed, with the results provided in Table 5. These results show that ductility increases with the test temperature.

DPAM/SEMCA 2008-093 A State-Of-The-Art Review Of Past Programmes Devoted To Fuel Behaviour Under Loss-Of-Coolant Conditions. Part 3.
38/239
Ce document est la propriété de l’IRSN et ne peut pas être communiqué ou reproduit sans son autorisation.
This document is IRSN proprietary and shall not be disseminated outside the Institute without its prior approval
√Dt (cm) Room temperature 900°F 1800°F
0 to 0.007 Ductile (loads up to
>4000 lb) Ductile (loads up to
~650 lb)
0.007 to 0.010 A few cracks (loads up
to 3000 lb)
0.010 to 0.018
Cracks with oxide losses (loads up to
>4000 lb)
Cracks with oxide losses (loads up to
~1800 lb)
> 0.018
Cracks with oxide losses (loads up to
~4000 lb)
Ductile, no oxide loss (loads up to ~650 lb)
Table 5: Ductility and loads during axial compression tests in relation to oxidation and the compression temperature
2.3.3 Graber report (Idaho Nuclear)
In March 1971, Graber et al. [18] published the metallurgical assessment of the BWR/FLECHT tests (cf. § 2.2.2.2) and supplemented the Meservey & Herzel report. Figure 19 illustrates the deflection results of these tests as a function of the α-Zr[O] to β-Zr thickness ratio. The ductile-brittle transition occurs around α/β =14% and corresponds to a deflection at failure that is slightly lower than 10% (elastic deflection) for these BWR tubes of a larger diameter. Graber and co-workers also performed compression tests on BWR/FLECHT samples. However, they expressed the results in relation to the ratio of the outer α-Zr[O] thickness only over the β-Zr thickness thereby completely disregarding extra embrittlement owing to the reaction with alumina, so it is not surprising that they obtained results that were even more penalising than those obtained in Meservey & Herzel tests.
Figure 19: Ring compression percent as function of αααα to ββββ thickness ratio

DPAM/SEMCA 2008-093 A State-Of-The-Art Review Of Past Programmes Devoted To Fuel Behaviour Under Loss-Of-Coolant Conditions. Part 3.
39/239
Ce document est la propriété de l’IRSN et ne peut pas être communiqué ou reproduit sans son autorisation.
This document is IRSN proprietary and shall not be disseminated outside the Institute without its prior approval
Graber et al. also mentioned the Meservey & Herzel scoping tests with a heating ramp in argon, admission of steam on two sides for 3 minutes and slow cooling in argon. By varying the cooling time in argon, they observed – as illustrated in Figure 20 [19] – that the excessive increase in the cooling time has a negative effect on ductility (the oxygen homogenises, the β-Zr layer thickness decreases and its oxygen content increases).
Figure 20: The effect of time in the oxygen-extended αααα+ββββ two-phase region on Zircaloy-2
2.3.4 TREAT/ FRF-2 test
In the August 1971 issue of Nuclear Technology [20], Lorenz et al. published the results of the Fuel Rod Failure (FRF)-2 test performed in the TREAT reactor, with the final report issued in January 1972 [21]. This test was designed to study the release of fission products during a LOCA, but it also provided results on the ductility of oxidised rods.
This test involved an irradiated central fuel rod surrounded by a ring of six fresh rods with a length of 69 cm, a diameter of 14 mm and a clad thickness of 0.84 mm. All rods had a Zry-4 cladding and were pressurised. The rods were submitted to nuclear heating under a flowing mixture of steam and helium. Thermocouples were welded to the cladding of three fresh rods. One of these thermocouples indicated a maximum temperature of about 1316°C.
All rods ballooned, burst and then oxidised on both the outer and inner surfaces of the cladding. Hardness measurements indicated brittle areas at ambient temperature on all six fresh rods. During handling in the hot cell at ORNL, Rod 11 fell from the remote-handling device and fragmented (cf. Figure 21); Rod 17 and the irradiated rod were also accidentally fragmented.

DPAM/SEMCA 2008-093 A State-Of-The-Art Review Of Past Programmes Devoted To Fuel Behaviour Under Loss-Of-Coolant Conditions. Part 3.
40/239
Ce document est la propriété de l’IRSN et ne peut pas être communiqué ou reproduit sans son autorisation.
This document is IRSN proprietary and shall not be disseminated outside the Institute without its prior approval
Figure 21: Failure region of Rod 11 after fracture during post-irradiation examination
These results confirm the embrittlement of the oxidised rods around 1316°C and show that hot cell handling operations of oxidised rods resulted in considerable loads and can be considered in a way as random ductility tests.
2.3.5 Hobson & Rittenhouse tests (ORNL)
In January 1972, Hobson & Rittenhouse [9] completed the final report on compression-impact tests (high-strain-rate compression) on oxidised samples of Zry-4. The compression-impact test was considered as being representative of stress conditions other than thermal shock stresses that could exist during a LOCA.
Forty rings, each 6.4 mm long, sampled from the tubes mentioned in § 2.1.2 were subjected to compression-impact tests (∆D < 3.8 mm) at temperatures from room temperature and 1038°C in argon.
Hobson & Rittenhouse did not investigate the temperature range from 927°C to 1066°C, where one peak of the breakaway phenomenon was identified in subsequent studies by Leistikow et al. (cf. § 3.1.7). This phenomenon develops in a furnace after about 30 minutes and results in accelerated oxidation and high hydrogen absorption, two phenomena having an impact upon ductility.
Figure 22 provides the ductility results in relation to the deformation temperature and the fraction FW of the β-Zr phase (related to the total thickness after oxidation). A straight line bounds the zero-ductility points on the left: after testing, either their fragments can be reassembled to form a ring of the pre-test dimensions, otherwise the appearance of the rupture area is characteristic of a brittle fracture.

DPAM/SEMCA 2008-093 A State-Of-The-Art Review Of Past Programmes Devoted To Fuel Behaviour Under Loss-Of-Coolant Conditions. Part 3.
41/239
Ce document est la propriété de l’IRSN et ne peut pas être communiqué ou reproduit sans son autorisation.
This document is IRSN proprietary and shall not be disseminated outside the Institute without its prior approval
Figure 22: Specimen ductility as a function of deformation temperature and fraction of as-oxidized wall thickness (Fw) consisting of transformed ββββ phase for the high-strain-rate tests
The equation for this straight line is given by:
ZDT(°F) = 2727 - 3636 F W. (2.9)
Hobson & Rittenhouse having elsewhere correlated W (total wall thickness after oxidation) to W0 (original wall thickness before oxidation) and ξ (combined thickness of oxide and α-zr[O] phase on one surface): W = W0 + 0.252 ξ, they also expressed the equation in the following manner:
ξ+ξ
−−=°252,0W
2136362727)F(ZDT
0
(2.10)
Hobson & Rittenhouse stressed the fact that the tube samples were not thinned by ballooning in their tests and that in the reactor case, it would be necessary to take into consideration thicknesses after ballooning.
2.3.6 Hobson slow compression tests
During the 1973 ECCS Rule-Making Hearing, Hobson carried out a new series of compression tests with slow-strain-rate on samples from the same 19 tubes mentioned in § 2.1.2. The results of these tests were presented at the topical meeting on Water Reactor Safety in Salt Lake City in March 1973 [22].
Fifty-seven ring specimens were subjected to compression tests at a strain-rate of 2.5 mm/min in air at room temperature and in oil at 93°C and 149°C.
Figure 23 provides the test results as function of the deformation temperature and FW in the form of a ductility map showing three regions separated by the dashed lines: totally ductile specimens, specimens that had 1 to 4 through-wall fracture but showed some ductility, and the specimens that showed essentially no ductility. The dashed line on the left separates the zero ductility points (except those oxidised at 2400°F=1316°C for 2 min); the solid lines are the dashed lines from Figure 22.
The equation for the "zero ductility" line is as follows:
+−−=−=°
ξξ252,0
213660241036602410)(
0WFFZDT w
(2.11)

DPAM/SEMCA 2008-093 A State-Of-The-Art Review Of Past Programmes Devoted To Fuel Behaviour Under Loss-Of-Coolant Conditions. Part 3.
42/239
Ce document est la propriété de l’IRSN et ne peut pas être communiqué ou reproduit sans son autorisation.
This document is IRSN proprietary and shall not be disseminated outside the Institute without its prior approval
Figure 23: Specimen ductility as a function of deformation temperature and fraction of as-oxidized wall thickness (Fw) consisting of transformed ββββ phase for the low-strain-rate tests
The samples oxidised at 1316°C for 2 min – brittle even though their β-Zr phase thickness was sufficiently high – led Hobson to conclude that embrittlement was not simply a function of FW or ξ penetration alone, but was related in another way to the oxidation temperature. Metallographic examination of 108 ring specimens from the two series showed that:
• All brittle samples – excepting samples oxidised at 1316°C for 2 minutes – revealed the presence of α-Zr[O] incursions into the β-Zr phase;
• Samples oxidised at 1316°C for 2 minutes were the only samples to become brittle at low temperature without showing the presence of α incursions. Hobson concluded that the second cause of temperature-related brittleness was due to the excessive oxygen content in the β phase. Temperature does increase the solubility of oxygen in the β-Zr phase and accelerates the diffusion of oxygen. It is thus necessary to consider two parameters when describing ductility: an oxidation parameter such as FW and the exposure temperature.
Based on oxygen diffusion calculations previously published by Pawel [10], Hobson came to the conclusion that the embrittling oxygen concentration at low temperature was 7000 ppm (Figure 24). Hobson also referred to the brittleness of Rod 12 from the TREAT/FRF-2 test despite a FW of 0.9; this rod was oxidised during a transient up to a peak temperature of about 1316°C. In Figure 19, it is also likely that the Meservey-Graber samples, which appeared brittle at the lowest α/β values, were also oxidised at high temperature.

DPAM/SEMCA 2008-093 A State-Of-The-Art Review Of Past Programmes Devoted To Fuel Behaviour Under Loss-Of-Coolant Conditions. Part 3.
43/239
Ce document est la propriété de l’IRSN et ne peut pas être communiqué ou reproduit sans son autorisation.
This document is IRSN proprietary and shall not be disseminated outside the Institute without its prior approval
This phenomenon was not observed in the Hobson & Rittenhouse fast compression tests owing to the test matrix and not the strain rate. The samples oxidised at 1316°C for 2 minutes were not tested in a high-strain-rate compression configuration. As for the samples oxidised at 1371°C or 1316°C for 4 minutes, they were too oxidised and met the embrittlement criterion applicable to samples oxidised at 1204°C or less.
Figure 24: Average calculated weight percent oxygen in the ββββ-phase as a function of time. Isograms of fraction saturation are shown and ORNL data points are plotted
To conclude, two distinct embrittlement mechanisms were proposed:
• At low temperature (T < 1204°C), owing to the excessive reduction of the β-Zr phase thickness, resulting in a average oxygen content in this phase nearing 90% saturation (formation of α incursions into the β phase);
• At high temperature (T > 1316°C), owing to the oxygen content exceeding 7000 ppm in the β-Zr phase (solid-solution hardening).
2.3.7 San José General Electric tests
In October 1972, Scatena [8] published a report on embrittlement describing the Time-Temperature-Environment tests (TTE) in Appendix A (cf. § 2.2.2.1), with Part 2 (TTE-2) having been subject to ring compression tests.
Interaction between zirconium and alumina led to the formation of an inner layer of α-Zr[O]. Considering that this reaction resulted in additional embrittlement without any oxide layer forming on the inner surface, a parameter such as ξT/W0 seems more appropriate to describe this embrittlement than ECR (ξT = sum of the inner and outer oxide and α-Zr[O] layer thicknesses; W0 = original wall thickness before oxidation).
The results are provided in Figure 25 and compared to the Hobson limit (ZDT = 77°F corresponding to ξT/W0 = 0.38):
• All samples such that ξT/W0 > 0.38 experienced deflections less than 0.4 mm;
• All samples with a deflection greater than 1.25 mm are such that ξT/W0 < 0.38;
• All three TTE-2/2 samples combining ξT/W0 < 0.38 and deflections less than 0.4 mm were oxidised in a transient with a peak temperature greater than 1316°C.

DPAM/SEMCA 2008-093 A State-Of-The-Art Review Of Past Programmes Devoted To Fuel Behaviour Under Loss-Of-Coolant Conditions. Part 3.
44/239
Ce document est la propriété de l’IRSN et ne peut pas être communiqué ou reproduit sans son autorisation.
This document is IRSN proprietary and shall not be disseminated outside the Institute without its prior approval
Figure 25: TTE-2 ring compression tests Deflection as a function of ξT/ Wo (from Table A1, NEDO-10674)
The TTE-2 results are therefore perfectly consistent with Hobson’s results.
By calculating the thickness of the β-Zr layer based on the difference between the initial thickness and the thicknesses of the α-Zr[O] layers plus the oxide thickness divided by 1.54 (Pilling-Bedworth ratio evaluated by Scatena), it is possible to express results in relation to αT/β, as illustrated in Figure 26 (αT = sum of the inner and outer α-Zr[O] layer thicknesses). The ductile-brittle transition is consistent with that of Graber in Figure 19. Considering that the TTE-2/2 samples (αT/β = 0.15 to 0.3) were oxidised during transients with a peak temperature greater than 1316°C, this confirms the hypothesis that the Meservey-Graber samples observed to be brittle at the lowest α/β values were also oxidised at high temperature.
Figure 26: TTE-2 ring compression tests Deflection as a function of αT/ β (from Table A1, NEDO-10674)
0
1
2
3
4
5
6
0 0.1 0.2 0.3 0.4 0.5 0 .6
ξT / W o (ratio o f the to ta l th ickness of ox ide+ a lpha layers to the in itia l th ickness)
Def
lect
ion
(mm
)
TTE-2TTE-2 / 2Hobson , ZDT=77°F
0
5
10
15
20
25
30
35
40
45
0 0.1 0.2 0 .3 0.4 0.5 0.6 0 .7 0.8
αT / β (ratio o f the tota l th ickness of a lpha layers to t he beta layer th ickness)
Def
lect
ion
(% o
f the
initi
al d
iam
eter
)

DPAM/SEMCA 2008-093 A State-Of-The-Art Review Of Past Programmes Devoted To Fuel Behaviour Under Loss-Of-Coolant Conditions. Part 3.
45/239
Ce document est la propriété de l’IRSN et ne peut pas être communiqué ou reproduit sans son autorisation.
This document is IRSN proprietary and shall not be disseminated outside the Institute without its prior approval
2.3.8 Analytical evaluation of failure limits
In the same document [8], Scatena assesses the different cladding mechanical stresses expected during a LOCA. According to the author, it seems that maximum stress results from the circumferential tensile stresses occurring during the quench thermal shock. Such stresses are evaluated at 38000 psi (262 MPa) for an oxidation rate of 17% and appear to be relatively independent of the oxidation rate and cladding thickness.
By using the compression test data of the TTE-2 tests and similar tests performed by Meservey & Herzel [15], it is possible to associate a variable characterising the degree of oxidation (in this
case Dt : see definition § 2.2.3.2) with the compressive load at failure (cf. Figure 27).
Figure 27: Radial compressive load required to cause brittle failure

DPAM/SEMCA 2008-093 A State-Of-The-Art Review Of Past Programmes Devoted To Fuel Behaviour Under Loss-Of-Coolant Conditions. Part 3.
46/239
Ce document est la propriété de l’IRSN et ne peut pas être communiqué ou reproduit sans son autorisation.
This document is IRSN proprietary and shall not be disseminated outside the Institute without its prior approval
By plotting a stress of 38000 psi which corresponds to a load at failure of 68 lb/inch for a BWR
cladding, Scatena observed that failure will occur at Dt > 0.021 cm, or ECR > 17.5 % (according to Figure 13). This result is therefore consistent with the experimental quench resistance limit of 17% ECR deduced from ANL and GE tests.
However, thermal shock stress occurs at a rather high temperature where cladding is more ductile than at low temperature. Smaller stress at a lower temperature can also cause greater damage.

DPAM/SEMCA 2008-093 A State-Of-The-Art Review Of Past Programmes Devoted To Fuel Behaviour Under Loss-Of-Coolant Conditions. Part 3.
47/239
Ce document est la propriété de l’IRSN et ne peut pas être communiqué ou reproduit sans son autorisation.
This document is IRSN proprietary and shall not be disseminated outside the Institute without its prior approval
3 ZIRCALOY OXIDATION (experimental results and mode ls subsequent to the 1973 ECCS Hearing)
Following the ECCS Hearing, it was recognised in the Regulatory Staff’s conclusions that various research programmes had been launched by AEC or the industry to make up for the lack of LOCA knowledge on phenomena concerned in the evaluation of the ECCS. As new data and models became available, it was therefore clearly stated that improvements could be made to a certain number of evaluation models recommended in the original Appendix K. This was particularly the case for the Zircaloy steam oxidation model based on the recommended Baker-Just correlation suspected by most to be highly conservative.
3.1 Isothermal oxidation kinetics of Zircaloy
Various analytical test programmes on Zircaloy oxidation under LOCA conditions were performed from the 1970s through to the 1990s and were subjected to successive state-of-the-art reviews. In chronological order, it is worth citing the Parsons & Miller review in 1977 [23] which discusses results obtained prior to 1976. This review concluded on the lack of significant differences between the oxidation kinetics of the Zircaloy-4, Zircaloy-2 and Zr-2.5%Nb alloys in the temperature range of 910°C to 1577°C. It recommended the following Arrhenius correlation based on the results pertaining to this temperature range:
Kp =25.14 x 10⁶ exp (-45600 / RT ) (mg Zr /cm2)2/s (with R = 1.987 cal/mole/K)
The activation energy in this correlation is very similar to the Baker-Just correlation value (45500), but the pre-exponential term is 25% lower, thereby confirming the conservative nature of the Baker-Just correlation, which had already been pointed out by Klepfer (see § 2.1.1).
The Parsons review was updated in the 1986 OECD/CSNI report describing the state of the art of PWR cladding behaviour during a LOCA [3]. This second review describes the main experimental programmes performed between 1975 and 1985, the main characteristics of which will be detailed below.
3.1.1 Tests by Biederman et al. (Worcester Polytechnic Institute, USA)
In a preliminary investigation [24,25], 152 mm samples of Zircaloy-4 subjected to direct electrical heating were oxidised on both sides in steam between 871°C and 1482°C (1600 – 2700°F) under isothermal or transient temperature conditions (ramp or LOCA-type transient).
The temperature was measured by a Pt/Pt-13%Rh thermocouple welded to a tantalum element, itself welded to the outer cladding surface. The uncertainty of these measurements was evaluated in an analytical approach and then experimentally using materials with known melting points; the measurements were shown to underestimate the real temperature by about 60K at 870°C right up to 120K at 1370°C.
The extent of the reaction was mainly determined by measuring the thickness of the oxide and α-Zr(O) layers based on metallographs of the sample cross-section at the thermocouple elevation. Weight gain was also measured in a limited number of tests, so as to cross-check the weight gain inferred from metallographic measurements; for these same tests, the hydrogen content was also measured on a ring specimen taken adjacent to the weight gain specimen; the results indicated post-oxidation hydrogen contents ranging between 20 and 40 ppm.
The isothermal kinetic tests were performed in two series:
- High steam flow on the inside of the sample (Rey > 104) discharging into the reaction chamber and soaking the outer surface in almost-stagnant steam (123 tests);
- Stagnant steam atmosphere on the inner and outer surfaces (45 tests).
Oxidation on the inner and outer surfaces of the first series did not show any significant differences, which led the authors to conclude that the kinetics were practically independent of the steam flow as long as the steam remains in contact with the surfaces and the hydrogen can be removed.

DPAM/SEMCA 2008-093 A State-Of-The-Art Review Of Past Programmes Devoted To Fuel Behaviour Under Loss-Of-Coolant Conditions. Part 3.
48/239
Ce document est la propriété de l’IRSN et ne peut pas être communiqué ou reproduit sans son autorisation.
This document is IRSN proprietary and shall not be disseminated outside the Institute without its prior approval
An analytical regression of the oxide and alpha phase thicknesses, as well as the combined ξ=oxide+alpha thickness was used to adjust parabolic laws of the following type:
e2 = Kp t with Kp in the Arrhenius law: Kp = A exp (-B/RT)
for each of the thicknesses found on each side.
Comparison of the ξ correlation with that recommended by Hobson and Rittenhouse (cf. § 2.1.2) shows good agreement up to 1316°C but an increasingly larger discrepancy with increasing temperature beyond this point. This divergence is clearly due to the Hobson and Rittenhouse formula that deviates significantly from the Arrhenius law for temperatures greater than 2200°F.
With data on the equilibrium oxygen concentrations at the interfaces and assuming a linear profile of the concentration in each phase, the metallographic measurement of the oxide and alpha thicknesses were used to determine the total quantity of oxygen absorbed during oxidation. The weight gain, or the quantity of Zr consumed per unit of surface followed a parabolic growth for which the coefficient Kp can be correlated to fit an Arrhenius law. The correlation obtained for the mass of reacted Zr is as follows:
Kp = 3.1 x 10⁵ exp (-33370 / RT ) (mg Zr /cm2)2/s
This correlation is rather similar to that of Klepfer’s (cf. § 2.1.1): Kp= 3.58 x 10⁵ exp (-33500 / RT).
Comparison of the Worcester Polytechnic Institute (WPI) correlation above with the Klepfer and Baker-Just correlations over the 982-182°C temperature range demonstrated good overall agreement (+5%) with the Klepfer correlation, but significant discrepancy with the Baker-Just correlation ranging from –8% at 982°C to +83% at 1482°C
In a second complementary investigation [26], WPI studied the oxidation kinetics in the 1200-1800°F (649-982°C) temperature range in the α and α+β phases domains. This study showed that oxidation kinetics below the α+β→β transus remained parabolic but with oxidation rates higher than would be obtained by extrapolating the rate equation in the β range (T>980°); particularly in the α+β range the temperature dependence deviated from the Arrhenius law. Figure 28 illustrates the temperature dependence of the constant Kp in the 650-1580°C temperature range for the mass of consumed metal, inferred from WPI tests compared with the Baker-Just correlation.
Figure 28: WPI parabolic rate constant data compared with Baker-Just equation

DPAM/SEMCA 2008-093 A State-Of-The-Art Review Of Past Programmes Devoted To Fuel Behaviour Under Loss-Of-Coolant Conditions. Part 3.
49/239
Ce document est la propriété de l’IRSN et ne peut pas être communiqué ou reproduit sans son autorisation.
This document is IRSN proprietary and shall not be disseminated outside the Institute without its prior approval
Computation tools used to calculate transient oxidation were developed at WPI in parallel with the experimental programme and were based on two distinct modelling approaches:
- A computer code based on a succession of isothermal oxidation steps calculated by parabolic laws (TRANS1);
- A computer code based on a finite-difference resolution of one-dimensional diffusion of oxygen in a multi-phase system with moving boundaries (ZORO 1).
The first approach provided good agreement with experimental results for high heating and slow cooling rate transients. The second tool provided accurate predictions in more complex transients, particularly postulated LOCA transients with a high-temperature blowdown peak.
3.1.2 Tests by Westerman & Hesson (Battelle Pacific Northwest Laboratories, USA)
The Required and Acceptable Features of the Evaluation Models section in Appendix K of 10 CFR 50.46 prescribes for the calculation of the cladding oxidation rate that:
"The calculation of the reaction rate on the inside of the cladding shall also follow the Baker-Just equation, starting at the time when the cladding is calculated to rupture, and extending around the cladding inner circumference and axially no less that 1.5 inches each way from the location of the rupture, with the reaction assumed not to be steam limited."
In consideration of these prescriptions, the Electric Power Research Institute (EPRI) launched a programme at the Battelle Pacific Northwest Lab. (BNWL) specifically designed to study oxidation of the inner and outer surfaces on ballooned and ruptured cladding under representative LOCA conditions [27].This programme was primarily designed to realistically quantify the relative contributions of inner and outer surface oxidation following cladding failure. A secondary objective of this programme was to study the isothermal oxidation kinetics between 973°C and 1252°C for comparison with already available or pending oxidation test results.
In the oxidation kinetic tests, the inside of a closed tube of Zircaloy-4 with a length of 165 mm was maintained in an inert atmosphere at ambient pressure and oxidised on the outer side by induction heating in an unlimited flow of steam. Temperature was recorded by means of three Pt/Pt-Rh thermocouples attached to the outer surface with an interposing Nb barrier – protected from oxidation by a Pt film – to avoid the formation of the Zr-Pt eutectic. On a sample with a thermocouple equipping the inner surface, a difference of +25°F (13.9 K) was measured between the inner and outer surface temperatures.
The progression of the reaction was recorded on line by measuring the mass of released hydrogen. The released hydrogen is determined by measuring the gas flow rate at the outlet combined with the fraction of hydrogen obtained from a thermal conductivity meter. Post-test metallographic examinations at different elevations on the samples made it possible to evaluate the quantity of absorbed oxygen and showed good agreement with the integral of the released hydrogen mass flow rate, as well as with the overall measurement of the final hydrogen mass collected in a reservoir.
The plotted square of the released hydrogen flow as a function of time illustrates linear growth corresponding to the isothermal period of the test (cf. Figure 29), which therefore makes it possible to infer the parameters of a parabolic correlation. Expressed over the mass of consumed Zr, the following correlation was obtained:
W2 = 5.22 x 10⁵ exp (-34700 / RT ) ∆t (mg Zr /cm2)2/s
This correlation is rather similar to Biederman’s (WPI) or Klepfer’s correlation mentioned earlier on.
The relative deviation over pK with these correlations is limited to 7% for the 1800-2700°F (982-
1482°C) temperature range. The relative deviation with the Baker-Just correlation however increases by 1% at 1038°C up to 71% at 1482°C.
Hydrogen analysis was performed on 2 samples for each of the two tests at 1260 and 1371°C. Hydrogen contents of 64 and 73 ppm were recorded at 1260°C, 220 and 250 ppm at 1371°C, which are much higher than the values reported by Biederman (20 to 30 ppm). The authors nevertheless considered however these values as low: the highest value of 250 ppm only represented 4% of the total hydrogen liberated, which therefore does not call into question the method used to determine the oxidation kinetics by measuring the released hydrogen mass.

DPAM/SEMCA 2008-093 A State-Of-The-Art Review Of Past Programmes Devoted To Fuel Behaviour Under Loss-Of-Coolant Conditions. Part 3.
50/239
Ce document est la propriété de l’IRSN et ne peut pas être communiqué ou reproduit sans son autorisation.
This document is IRSN proprietary and shall not be disseminated outside the Institute without its prior approval
Figure 29: Hydrogen variations in BNWL oxidation experiments
3.1.3 Tests by Suzuki and Kawasaki (JAERI, Japan)
In the successive JAERI test series devoted to oxidation studies and Zircaloy cladding embrittlement under LOCA conditions, a test series of a fairly restrictive nature focusing on oxidation kinetics was also performed and is discussed in [28] & [29].
In these tests, 15 mm sections of Zry-4 tubes were oxidised between 900°C and 1330°C on both sides in unlimited flowing steam inside an alumina tube heated in a resistance furnace (cf. Figure 30). The temperature was measured by two thermocouples; one welded to a tantalum film on the outer surface, while the other was placed in close contact with the inner wall. The temperature indicated by the first thermocouple was taken as the test temperature. The extent of the reaction was determined by the weight gain and the thickness of the oxide and α-Zr layers measured in metallographic examination. Some of the samples had been previously pre-oxidised in water at 300°C for 74 hours to simulate initial corrosion produced in normal operation of a reactor; however, the corrosion thickness thus obtained was very thin, less than a µm.
Figure 30: Test apparatus for JAERI oxidation
experiments.

DPAM/SEMCA 2008-093 A State-Of-The-Art Review Of Past Programmes Devoted To Fuel Behaviour Under Loss-Of-Coolant Conditions. Part 3.
51/239
Ce document est la propriété de l’IRSN et ne peut pas être communiqué ou reproduit sans son autorisation.
This document is IRSN proprietary and shall not be disseminated outside the Institute without its prior approval
The oxidised samples were then subjected to diametral compression tests.
The authors reported a parabolic oxidation behaviour for temperatures of 1000°C and above, and a non-parabolic behaviour for temperatures of 900°C and 950°C, as illustrated in Figure 31 which shows the variations in weight gain in relation to time. The figure also shows the barely detectable influence of pre-corrosion upon kinetics at 1000-1100°C. This influence is more visible at 900°C and 950°C where it seems to slightly reduce the oxidation rate in comparison with the oxidation rate of fresh samples. However, the real influence of this very low pre-oxidation is too uncertain to be clearly stated.
(a) 1000 and 1100°C, steam (b) 900 and 950°C, steam
Figure 31: Oxidation of Zry-4 as a function of holding time in flowing steam
For oxidation temperatures between 1184°C and 1330°C, the temperature rise to the target temperature was integrated into the analysis of results by considering this ramp as a succession of short isothermal intervals and determining by trial and error the K0 & Q values of the Arrhenius law W2 = K0 exp( –Q/RT) which minimise the following expression:
∑ −=i
ciWmiWS 2)( for temperatures Ti > 1184°C
where Wmi and Wci respectively represent the measured and calculated weight gains for oxidation at Ti over a given time (240 s) common to each test series at the Ti temperatures in question.
By combining the corrected results for temperatures > 1184°C with the uncorrected results for temperatures between 1000°C and 1184°C, the authors derived a set of correlations for the weight gain W, oxide thickness and the combined ξ (oxide + α phase) thickness covering the 1000-1330°C range. The weight gain correlation, converted into the mass of consumed Zr, is expressed as thus:
W2 = 3.80 x 10⁶ exp (- 40710 / RT ) ∆t (mg Zr /cm2)2/s
3.1.4 Tests by Cathcart, Pawel et al. (Oak Ridge National Laboratory, USA)
Considerable progress in the study of Zircaloy-4 oxidation kinetics in the LOCA temperature range was made by Pawel, Cathcart et al. at ORNL [30,31,32].
This research was part of the Zirconium Metal-Water Oxidation Kinetics (ZMWOK) programme developed at ORNL with the following specific objectives:
- Determining the isothermal oxidation kinetics of Zircaloy-4 in steam between 900°C and 1500°C under well-controlled conditions;
- Measuring the diffusivity of oxygen in beta Zircaloy between 900°C and 1500°C;

DPAM/SEMCA 2008-093 A State-Of-The-Art Review Of Past Programmes Devoted To Fuel Behaviour Under Loss-Of-Coolant Conditions. Part 3.
52/239
Ce document est la propriété de l’IRSN et ne peut pas être communiqué ou reproduit sans son autorisation.
This document is IRSN proprietary and shall not be disseminated outside the Institute without its prior approval
- Measuring the extent of the Zircaloy-steam reaction after transient temperature oxidation in the same temperature range;
- Developing a computation tool designed to calculate transient oxidation;
- Performing scoping tests to evaluate the possible effect of parameters such as: steam flow rate, steam temperature and pressure, impurities (O2, N2, or H2) and small variations in the Zircaloy composition.
3.1.4.1 Isothermal tests to determine oxidation kin etics
Three apparatuses were built at ORNL to carry out oxidation tests: a high thermal inertia apparatus (MaxiZWOK), a low-thermal-inertia apparatus (MiniZWOK) and a specific apparatus for oxidation under high-pressure steam (SuperZWOK).
Most of the isothermal oxidation tests were performed in the MiniZWOK apparatus. This device included a quad-elliptical radiant furnace to heat the Zry-4 sample at more than 100°C/ s up to the target temperature plateau, which was maintained for the given time, before being rapidly cooled at initial rates greater than 100°C/s. Figure 32 illustrates this test apparatus. The Zircaloy sample (∼ 3 cm long) was supported between 2 quartz tubes and only the outer surface was exposed to flowing steam (∼ 1 m/s), with the inner surface having been maintained in a neutral atmosphere by a slight helium overpressure. The temperature was measured using 3 Pt/Pt-10%Rh thermocouples positioned at mid-height and spot welded to the inner surface via thin tantalum protective tabs. Frequent and careful calibration of the instrumentation made it possible to maintain the temperature uncertainty between ±4°C at 900°C and ±6°C at 1500°C. One thermocouple was connected to the furnace controller-programmer system, while the other two were connected to the data acquisition system.
Figure 32: Schematic diagram of the oxidation apparatus
By recording the time-temperature history during the entire test transient (heat up, plateau, cool down), it was possible to determine the effective duration teff of the isothermal test, taking into account the temperature rise and drop and by normalising the duration at nominal temperature of the test series (different times at an assigned temperature):
]/exp[
0)](/exp[
effRTQ
tdttRTQ
efft−
−=∫

DPAM/SEMCA 2008-093 A State-Of-The-Art Review Of Past Programmes Devoted To Fuel Behaviour Under Loss-Of-Coolant Conditions. Part 3.
53/239
Ce document est la propriété de l’IRSN et ne peut pas être communiqué ou reproduit sans son autorisation.
This document is IRSN proprietary and shall not be disseminated outside the Institute without its prior approval
Strictly speaking, this correction requires knowledge of the activation energy Q, which depends on the kinetics process in consideration (oxide or Zr-α thickness, weight gain, etc.). The activation energy also happens to be one of the results of the experimental study. In principle, an accurate calculation of teff therefore requires an iterative process. However, for most of the tests, it was estimated that using a nominal mean value (Q = 40 Kcal/mole) did not produce errors in the rate constants greater than 1%.
The extent of oxidation was determined by measuring the phase thicknesses from metallographs of a transverse cross-section at level with the thermocouples; the oxygen uptake was evaluated by assuming stoichiometric oxide, a linear oxygen concentration gradient in the alpha layer and a simplified diffusion calculation in the beta phase. Measurements were taken near each of the two data acquisition thermocouple positions based on the average of the read-outs from the 7 azimuthal positions. The measurements for each thermocouple location were averaged below 1400°C and identified above this point. The kinetics were determined based on a minimum of 10 tests at each temperature (from 900°C to 1500°C). The results revealed a parabolic behaviour in the growth of the oxide and alpha phase layers at oxidation temperatures above 1000°C, as illustrated in Figure 33 for tests at 1404°C, where good agreement in the results for each of the two thermocouples was noticed. For the temperatures of 900°C and 950°C however, a non-parabolic behaviour was clearly observed on oxide growth, whereas growth of the alpha phase remained roughly parabolic (cf. Figure 34). The authors considered that this deviation was possibly due to the zirconia phase transition (tetragonal-monoclinic) in this temperature range.
Figure 33: Growth of oxide and alpha
layers on Zircaloy-4 in steam at 1404°C
Figure 34: Growth of oxide and alpha layers on Zircaloy-4 in steam at 956°C. (Dashed line represents parabolic oxide growth expected on the basis of an
extrapolation of higher temperature data)
Based on the ORNL isothermal tests in the 1000-1500°C temperature range, the authors determined the following Arrhenius laws on the respective parabolic growth of oxide layer (x), alpha phase layer (α), the combined oxide+ alpha layer (ξ) and weight gain (m):
Wx2 = 0.02252 exp (-35890 / RT ) ∆t cm2/s
Wα2 = 1.523 exp (-48140 / RT ) ∆t cm2/s
Wξ2 = 0.6824 exp (-41700 / RT ) ∆t cm2/s
Wm2 = 0.3622 106 exp (-39940 / RT ) ∆t (mg/cm2)2/s
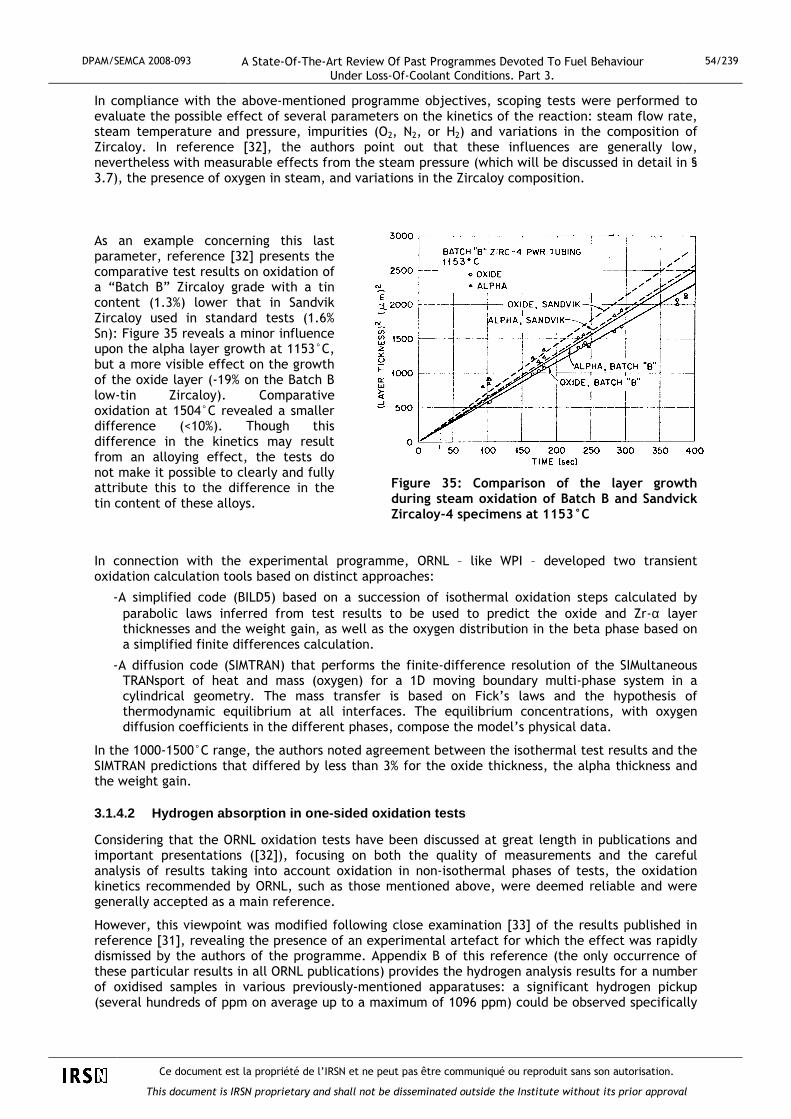
DPAM/SEMCA 2008-093 A State-Of-The-Art Review Of Past Programmes Devoted To Fuel Behaviour Under Loss-Of-Coolant Conditions. Part 3.
54/239
Ce document est la propriété de l’IRSN et ne peut pas être communiqué ou reproduit sans son autorisation.
This document is IRSN proprietary and shall not be disseminated outside the Institute without its prior approval
In compliance with the above-mentioned programme objectives, scoping tests were performed to evaluate the possible effect of several parameters on the kinetics of the reaction: steam flow rate, steam temperature and pressure, impurities (O2, N2, or H2) and variations in the composition of Zircaloy. In reference [32], the authors point out that these influences are generally low, nevertheless with measurable effects from the steam pressure (which will be discussed in detail in § 3.7), the presence of oxygen in steam, and variations in the Zircaloy composition.
As an example concerning this last parameter, reference [32] presents the comparative test results on oxidation of a “Batch B” Zircaloy grade with a tin content (1.3%) lower that in Sandvik Zircaloy used in standard tests (1.6% Sn): Figure 35 reveals a minor influence upon the alpha layer growth at 1153°C, but a more visible effect on the growth of the oxide layer (-19% on the Batch B low-tin Zircaloy). Comparative oxidation at 1504°C revealed a smaller difference (<10%). Though this difference in the kinetics may result from an alloying effect, the tests do not make it possible to clearly and fully attribute this to the difference in the tin content of these alloys.
Figure 35: Comparison of the layer growth during steam oxidation of Batch B and Sandvick Zircaloy-4 specimens at 1153°C
In connection with the experimental programme, ORNL – like WPI – developed two transient oxidation calculation tools based on distinct approaches:
- A simplified code (BILD5) based on a succession of isothermal oxidation steps calculated by parabolic laws inferred from test results to be used to predict the oxide and Zr-α layer thicknesses and the weight gain, as well as the oxygen distribution in the beta phase based on a simplified finite differences calculation.
- A diffusion code (SIMTRAN) that performs the finite-difference resolution of the SIMultaneous TRANsport of heat and mass (oxygen) for a 1D moving boundary multi-phase system in a cylindrical geometry. The mass transfer is based on Fick’s laws and the hypothesis of thermodynamic equilibrium at all interfaces. The equilibrium concentrations, with oxygen diffusion coefficients in the different phases, compose the model’s physical data.
In the 1000-1500°C range, the authors noted agreement between the isothermal test results and the SIMTRAN predictions that differed by less than 3% for the oxide thickness, the alpha thickness and the weight gain.
3.1.4.2 Hydrogen absorption in one-sided oxidation tests
Considering that the ORNL oxidation tests have been discussed at great length in publications and important presentations ([32]), focusing on both the quality of measurements and the careful analysis of results taking into account oxidation in non-isothermal phases of tests, the oxidation kinetics recommended by ORNL, such as those mentioned above, were deemed reliable and were generally accepted as a main reference.
However, this viewpoint was modified following close examination [33] of the results published in reference [31], revealing the presence of an experimental artefact for which the effect was rapidly dismissed by the authors of the programme. Appendix B of this reference (the only occurrence of these particular results in all ORNL publications) provides the hydrogen analysis results for a number of oxidised samples in various previously-mentioned apparatuses: a significant hydrogen pickup (several hundreds of ppm on average up to a maximum of 1096 ppm) could be observed specifically

DPAM/SEMCA 2008-093 A State-Of-The-Art Review Of Past Programmes Devoted To Fuel Behaviour Under Loss-Of-Coolant Conditions. Part 3.
55/239
Ce document est la propriété de l’IRSN et ne peut pas être communiqué ou reproduit sans son autorisation.
This document is IRSN proprietary and shall not be disseminated outside the Institute without its prior approval
on single-side oxidised samples in the MiniZWOK apparatus, whereas the preliminary double-side oxidation tests performed in the same apparatus revealed no significant hydrogen pickup. Beyond the considerable scatter in the measured hydrogen contents, it was soon realized that absorption on the sample’s inner surface was due to the particularities of the experimental apparatus. As illustrated in Figure 32, the sample was maintained between 2 quartz tubes with tantalum seals, providing however imperfect leaktightness. Despite the slight helium overpressure on the sample inner side, a small quantity of steam was able to enter the sample tube through its ends in some experiments, resulting in the slight oxidation towards said ends to release a quantity of hydrogen that was then absorbed near the sample’s centre in a non-oxidised area. This parasitic hydriding was even more pronounced for longer oxidation times, independent of the test temperature as shown in Figure 36.
Figure 36: Hydrogen content of Zircaloy-4 PWR tube specimens isothermally
oxidised in the MiniZWOK apparatus plotted as a function of the exposure time
The authors then attempted to show that this parasitic hydrogen pickup did not affect the oxidation kinetics and therefore did not call into question the validity of results. Their explanation was based on a number of indirect factors and on the analysis of comparative oxidation test results in pure oxygen where the parasitic hydrogen pickup was inexistent:
♦ Indirect factors were mainly based on the observation of good agreement between the oxidation kinetics in tests with the longest times (generally the tests most affected by the parasitic hydrogen pickup) and in tests with the shortest times (not at all or hardly affected by a hydrogen pickup). Furthermore, the authors stressed the consistency between results obtained from various ORNL apparatuses (MiniZWOK/ MaxiZWOK) and results from other test programmes, particularly JAERI and KfK results. This comparison of programmes mainly focused on oxide growth kinetics which are hardly affected by hydrogen. However, close comparison of alpha layer growth kinetics revealed differences that could have been explained by this hydrogen pickup [33]. The effect of hydrogen pickup on the oxidation kinetics will be discussed in detail in chapter 3.5.
♦ The oxidation tests in pure oxygen were performed in the MiniZWOK apparatus at 2 temperatures (1253°C & 1404°C). Ten tests were performed at each temperature. The results revealed slightly slower growth in the alpha layer thickness when oxidised in oxygen rather than in steam. Conversely, there was more rapid growth for the oxide layer, the combined oxide+alpha layer and the weight gain, which corresponds to a more rapid displacement of the oxide-alpha interface in oxygen rather than in steam. Based on this observation, the authors

DPAM/SEMCA 2008-093 A State-Of-The-Art Review Of Past Programmes Devoted To Fuel Behaviour Under Loss-Of-Coolant Conditions. Part 3.
56/239
Ce document est la propriété de l’IRSN et ne peut pas être communiqué ou reproduit sans son autorisation.
This document is IRSN proprietary and shall not be disseminated outside the Institute without its prior approval
examined a number of hypotheses to explain the possibility of a hydrogen effect (impacting oxidation in steam) in the metal or oxide phases which would remain consistent with this result. They came to the conclusion that the kinetic differences between oxidation in steam and oxidation in oxygen could only be explained by the stoichiometric variation in the oxide, related to the equilibrium oxygen concentration at the gas-oxide interface. Furthermore, similar values were produced (around ± 3%) by comparative analysis of the diffusion coefficients – inferred from steam and oxygen tests – for oxygen in the oxide and alpha phase. Analytical factors and kinetic results for oxidation in steam and oxygen were taken into account. This led the authors to believe that hydrogen – dissolved in Zircaloy during steam tests – neither significantly affected the equilibrium concentrations at the oxide-alpha and alpha-beta interfaces nor the diffusivity in the β phase. They concluded that the differences between oxidation in steam (with a possible hydrogen pickup) and in oxygen could not be explained by a noticeable effect of hydrogen upon the properties of the metallic α and β phases. (This result, however, was later contradicted by studies supporting JAERI tests that revealed that hydrogen shifts the α/β phase transformation temperatures towards lower temperatures or higher oxygen concentrations, therefore corresponding to an increase in the equilibrium oxygen concentration at the β/α interface [34]).
The authors came to the final conclusion that, within the limits of experimental uncertainties, the oxidation kinetics inferred from single-side oxidation tests in the MiniZWOK apparatus were not affected by the parasitic hydrogen pickup, which therefore made it possible to assert the validity of their results. This conclusion may be acceptable for the weight gain and oxide layer growth, but should not for the alpha-Zr(O) layer growth [33].
3.1.5 Tests by Brown and Healey (CEGB, UK)
Zircaloy-2 oxidation kinetics were studied within the 1000-1400°C temperature range by Brown and Healey [35] at CEGB.
Samples of 60 mm long Zircaloy-2 tube (SGHWR cladding) were oxidised under isothermal conditions in steam in a two-zone furnace. The tests were performed at twelve temperatures between 1000°C and 1400°C with 10 to 30 tests per temperature. At the end of the oxidation plateau, the sample was quickly removed from the furnace and immersed in water. Temperatures were measured by a single thermocouple fixed to a niobium pad spot welded to the outer surface of the tube. The extent of the reaction was determined by weighing the mass of the sample before and after the test. Metallographs were also taken to examine the microstructure after oxidation, but did not provide measurements of the oxide and alpha phase thicknesses needed to determine the kinetics on these parameters.
The metallographs revealed:
- A duplex-layer oxide structure composed of 2 sub-layers separated by a thin phase of tin-enriched precipitates for oxidations at T>1200°C;
- A more than often single-layer structure and occasionally a duplex-layer structure for oxidations at T<1200°C.
The causes of this structural particularity were not clarified.
Figure 37 illustrates the variations in the weight gain as a function of the square root of time (corrected of time t0 taken to reach the test temperature) for the different test temperatures. For temperatures < 1200°C, the weight gain in specimens with double-layer oxide was lower than that in specimens with single-layer oxide. The kinetics remained parabolic for both structures, except at 1000°C where a deviation occurred at t > 400 s.

DPAM/SEMCA 2008-093 A State-Of-The-Art Review Of Past Programmes Devoted To Fuel Behaviour Under Loss-Of-Coolant Conditions. Part 3.
57/239
Ce document est la propriété de l’IRSN et ne peut pas être communiqué ou reproduit sans son autorisation.
This document is IRSN proprietary and shall not be disseminated outside the Institute without its prior approval
Figure 37: Weight measurements for Zircaloy-2 tube specimens oxidised in steam
The authors therefore defined two correlations based on the Arrhenius law for both single and duplex oxide structures:
Kp_single = 1.671 x 10⁶ exp(-38955/RT) (mg Zr /cm2)2/s (single-layer oxide)
Kp_duplex = 3.637 x10⁶ exp(-41596/RT) (mg Zr /cm2)2/s (double-layer oxide)
Figure 38 compares these correlations with the Baker-Just correlation and the Parsons-Miller [23] correlation for the only tests on Zircaloy-2:
Kp_Zy2 = 2.1 x10⁷ exp(-44900/RT) (mg Zr /cm2)2/s

DPAM/SEMCA 2008-093 A State-Of-The-Art Review Of Past Programmes Devoted To Fuel Behaviour Under Loss-Of-Coolant Conditions. Part 3.
58/239
Ce document est la propriété de l’IRSN et ne peut pas être communiqué ou reproduit sans son autorisation.
This document is IRSN proprietary and shall not be disseminated outside the Institute without its prior approval
Figure 38: Comparison of the temperature dependence of oxidation rate constants derived from CEGB and previous studies
This comparison reveals the conservatism of the Baker-Just and Parsons correlations. Due to their lack of understanding of the mechanism leading to the double-layer structure, Brown and Healey recommended using the more penalizing single-layer correlation for the 1000-1400°C temperature range so the oxidation calculation would remain conservative in a LOCA transient simulation.
3.1.6 Tests by Urbanic and Heidrick (AECL, Canada)
Canadian tests performed by Urbanic and Heidrick (AECL) also contributed to Zircaloy oxidation kinetics studies. More specifically, they explored the temperature range leading up to the vicinity of the Zircaloy melting point [36].
Solid cylindrical samples of Zircaloy-2 or Zircaloy-4 with a diameter of 1.27 cm and length of 2.54 cm were inductively heated at high temperature (1050-1850°C). Two methods were used to determine the oxidation kinetics:
a) Hydrogen evolution method
In this method a complete kinetic curve at a given temperature can be obtained on a continuous basis from a single exposure. The sample was initially immersed in the water volume filling the reaction chamber -surrounded by the HF inductor- and the graduated column collecting the hydrogen generated (cf. Figure 39). While ramping up to the heating power, a steam blanket formed around the sample ready for oxidation at the desired temperature, with this temperature being controlled by a Pt/Pt-10%Rh thermocouple placed inside the alumina support tube. The surface temperature was measured using an optical pyrometer which had been calibrated against the known melting points of various metals. An uncertainty of ±25°C [36] for these measurements was considerable in comparison with that in the previously mentioned ORNL tests (4°C to 6°C).
The volume of collected hydrogen as function of time was then converted into the mass of Zr reacted. Weighing and post-test metallographic examinations were performed to check the final reaction rate obtained by measuring the quantity of released hydrogen.

DPAM/SEMCA 2008-093 A State-Of-The-Art Review Of Past Programmes Devoted To Fuel Behaviour Under Loss-Of-Coolant Conditions. Part 3.
59/239
Ce document est la propriété de l’IRSN et ne peut pas être communiqué ou reproduit sans son autorisation.
This document is IRSN proprietary and shall not be disseminated outside the Institute without its prior approval
Figure 39: Apparatus for measuring high temperature oxidation rates by the hydrogen evolution method
b) Gravimetric method
In this method, the samples were oxidised in flowing steam (or steam+ helium) for various oxidation times at a fixed temperature. The progress of the reaction was determined based on the weight gain by weighing before and after the test. As was the case for the previous method, the samples were heated in an induction furnace placed around a transparent Vycor reaction tube (cf. Figure 40). Owing to the lack of specific information, the temperature was presumably controlled and measured in the same manner for both apparatuses.
Figure 40: Apparatus for measuring high-temperature oxidation rates by the gravimetric method

DPAM/SEMCA 2008-093 A State-Of-The-Art Review Of Past Programmes Devoted To Fuel Behaviour Under Loss-Of-Coolant Conditions. Part 3.
60/239
Ce document est la propriété de l’IRSN et ne peut pas être communiqué ou reproduit sans son autorisation.
This document is IRSN proprietary and shall not be disseminated outside the Institute without its prior approval
The results show good agreement between the weight gain kinetics obtained by both methods. There did not seem to be any noticeable differences between the oxidation kinetics of the Zircaloy-4 and Zircaloy-2 alloys. Variation in the mass of Zr reacted in relation to time indicated parabolic kinetics expressed as W2 = Kp t, with Kp being dependent on the temperature according to an Arrhenius law. However, a discontinuity appeared in this law near 1580°C, as shown in Figure 41. The kinetics inferred from the tests were therefore expressed as such:
Kp = 2.96 105 exp(-16820/T) (mg Zr/cm2)2/s for T < 1580°C
Kp = 8.79 105 exp(-16610/T) (mg Zr/cm2)2/s for T > 1580°C
Figure 41: Reaction rate of zirconium, Zircaloy-2 and Zircaloy-4 in steam
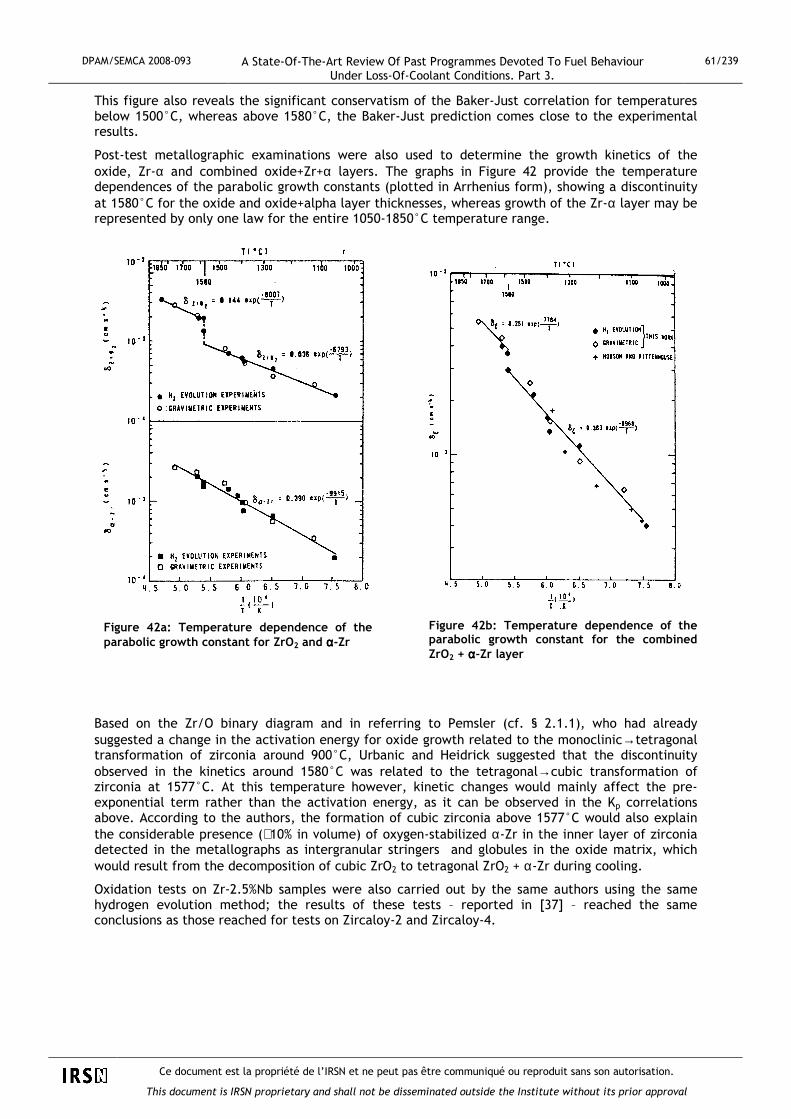
DPAM/SEMCA 2008-093 A State-Of-The-Art Review Of Past Programmes Devoted To Fuel Behaviour Under Loss-Of-Coolant Conditions. Part 3.
61/239
Ce document est la propriété de l’IRSN et ne peut pas être communiqué ou reproduit sans son autorisation.
This document is IRSN proprietary and shall not be disseminated outside the Institute without its prior approval
This figure also reveals the significant conservatism of the Baker-Just correlation for temperatures below 1500°C, whereas above 1580°C, the Baker-Just prediction comes close to the experimental results.
Post-test metallographic examinations were also used to determine the growth kinetics of the oxide, Zr-α and combined oxide+Zr+α layers. The graphs in Figure 42 provide the temperature dependences of the parabolic growth constants (plotted in Arrhenius form), showing a discontinuity at 1580°C for the oxide and oxide+alpha layer thicknesses, whereas growth of the Zr-α layer may be represented by only one law for the entire 1050-1850°C temperature range.
Figure 42a: Temperature dependence of the parabolic growth constant for ZrO2 and αααα-Zr
Figure 42b: Temperature dependence of the parabolic growth constant for the combined ZrO2 + αααα-Zr layer
Based on the Zr/O binary diagram and in referring to Pemsler (cf. § 2.1.1), who had already suggested a change in the activation energy for oxide growth related to the monoclinic→tetragonal transformation of zirconia around 900°C, Urbanic and Heidrick suggested that the discontinuity observed in the kinetics around 1580°C was related to the tetragonal→cubic transformation of zirconia at 1577°C. At this temperature however, kinetic changes would mainly affect the pre-exponential term rather than the activation energy, as it can be observed in the Kp correlations above. According to the authors, the formation of cubic zirconia above 1577°C would also explain the considerable presence (∼10% in volume) of oxygen-stabilized α-Zr in the inner layer of zirconia detected in the metallographs as intergranular stringers and globules in the oxide matrix, which would result from the decomposition of cubic ZrO2 to tetragonal ZrO2 + α-Zr during cooling.
Oxidation tests on Zr-2.5%Nb samples were also carried out by the same authors using the same hydrogen evolution method; the results of these tests – reported in [37] – reached the same conclusions as those reached for tests on Zircaloy-2 and Zircaloy-4.

DPAM/SEMCA 2008-093 A State-Of-The-Art Review Of Past Programmes Devoted To Fuel Behaviour Under Loss-Of-Coolant Conditions. Part 3.
62/239
Ce document est la propriété de l’IRSN et ne peut pas être communiqué ou reproduit sans son autorisation.
This document is IRSN proprietary and shall not be disseminated outside the Institute without its prior approval
3.1.7 Tests by Leistikow, Schanz et al. (FZK, Germa ny)
One of the most important contributions to the study of Zircaloy oxidation at high temperature by steam came from research performed at FZK (ex-KfK) by Leistikow, Schanz et al. [38,39,40].
Different test series were performed in the 600-1600°C temperature range under isothermal and LOCA transient conditions. Additional parametric studies were also performed to study the effect of parameters such as initial pre-corrosion and deformation.
The basic double-side isothermal oxidation tests [41] were carried out between 700°C and 1300°C at different test times ranging from 1 to 15 min. The samples used were 30 mm long sections of PWR Zircaloy-4 cladding with an outer diameter of 10.75 mm and a thickness of 0.725 mm.
For the main test series (900-1300°C), oxidation was performed under flowing steam in a quartz tube inside a resistance furnace. The device is illustrated in Figure 43. The sample – initially at 300°C outside the heated area – was moved on its support using a quartz handling mast inside the furnace. It was then removed in the same way at the end of the oxidation and quenched in a water tank. This procedure necessarily involved a temperature ramp prior to the isothermal oxidation plateau.
a = argon, b = furnace, c = sample, d = thermocouple, e = quartz tube, g = steam generator
Figure 43: KfK oxidation test device
Another procedure was tested that involved heating the sample to the desired temperature under argon atmosphere inside the furnace before triggering the flow of steam. Owing to the exothermic nature of the Zircaloy-water oxidation reaction, this procedure induced a temperature overshoot after the steam was introduced; the temperature peak was rather small (∼13°C) at about 900-1000°C but could rise 240°C at 1300°C. This procedure was used for one test series only between 700°C and 1000°C.
A limited test series was also carried out using induction heating in the same device mainly used for transient tests.
The temperature range was then extended into the higher temperatures up to 1600°C where tests were performed up to the complete metal consumption of the tubing, before extending into the lower temperatures down to 600°C. Last of all, tests at 1000°C and below were extended to cover test times ranging from 15 min to 25 h, which made it possible to characterise the kinetic transition process known as the “breakaway” phenomenon.
The temperature was measured by a Pt/Pt-Rh thermocouple on the outer surface. This thermocouple was only in contact with the sample in the resistance furnace tests, but was welded to the sample with an iridium spacer foil in the induction furnace tests. For the resistance furnace tests, the temperature ramp time was added to the oxidation time in an approximate manner based

DPAM/SEMCA 2008-093 A State-Of-The-Art Review Of Past Programmes Devoted To Fuel Behaviour Under Loss-Of-Coolant Conditions. Part 3.
63/239
Ce document est la propriété de l’IRSN et ne peut pas être communiqué ou reproduit sans son autorisation.
This document is IRSN proprietary and shall not be disseminated outside the Institute without its prior approval
on the assumption that isothermal oxidation had began at nominal temperature when the measured temperature had reached 90% of the desired temperature. This corresponded to about 95% of the desired temperature in terms of the real temperature, taking into account the temperature difference indicated by the thermocouple in contact with the sample. For induction furnace tests, isothermal oxidation was said to have begun at 95% of the maximum temperature in terms of the measured temperature by the welded thermocouple.
The extent of the reaction was determined by measuring a) the weight gain after testing and b) the thicknesses of the oxide and Zr-α layers by metallography of cross sections .
Results of short exposure tests (<40 mn)
Figure 44 shows the variations in the weight gain as a function of the square root of time for tests performed between 900°C and 1300°C, and clearly reveals parabolic behaviour. Comparison with Hobson-Rittenhouse, Lemmon and Baker-Just kinetics at 1200°C shows the increasing conservatism of these correlations.
Figure 44: Weight gain as a function of the square root of time during the
isothermal exposure of Zircaloy-4 tube sections to flowing steam
The test results in the 1000-1300°C temperature range were used to infer the following Arrhenius laws for the respective parabolic growth constants: oxide thicknesses (x), alpha phase (α), the combined oxide+alpha layer (ξ) and the weight gain (m):
Wx2 = 0.0782 exp (-40164 / RT ) ∆t cm2/s
Wα2 = 0.508 exp (-43561 / RT ) ∆t cm2/s
Wξ2 = 1.66 exp (-43885 / RT ) ∆t cm2/s
Wm2 = 0.524 106 exp (-41651 / RT ) ∆t (mg/cm2)2/s
(R = 1.987 cal/mole/K)

DPAM/SEMCA 2008-093 A State-Of-The-Art Review Of Past Programmes Devoted To Fuel Behaviour Under Loss-Of-Coolant Conditions. Part 3.
64/239
Ce document est la propriété de l’IRSN et ne peut pas être communiqué ou reproduit sans son autorisation.
This document is IRSN proprietary and shall not be disseminated outside the Institute without its prior approval
Figure 45 summarises the weight gain kinetics results in a double logarithmic scale for all the isothermal tests. It shows the transition to cubic kinetics at oxidation temperatures below 1000°C for times of ∆t<40 min
Figure 45: High temperature steam oxidation of Zircaloy-4 cladding Kinetics of weight gain (600-1600°C, 2min-25h)
The Arrhenius plot of the weight gain kinetics in relation to the reciprocal of the temperature between 1000°C and 1600°C (cf. Figure 46) reveals an acceleration in the kinetics at 1550°C and 1600°C, which is in good agreement with both the Urbanic & Heidrick results (cf. § 3.1.6 above) and the metallographic observations of an inner oxide sub-layer containing α-Zr(O) filaments, formed during the cubic→ tetragonal transformation of zirconia upon cooling. The figure also illustrates the conservatism of the Baker-Just correlation for the temperature range in question.
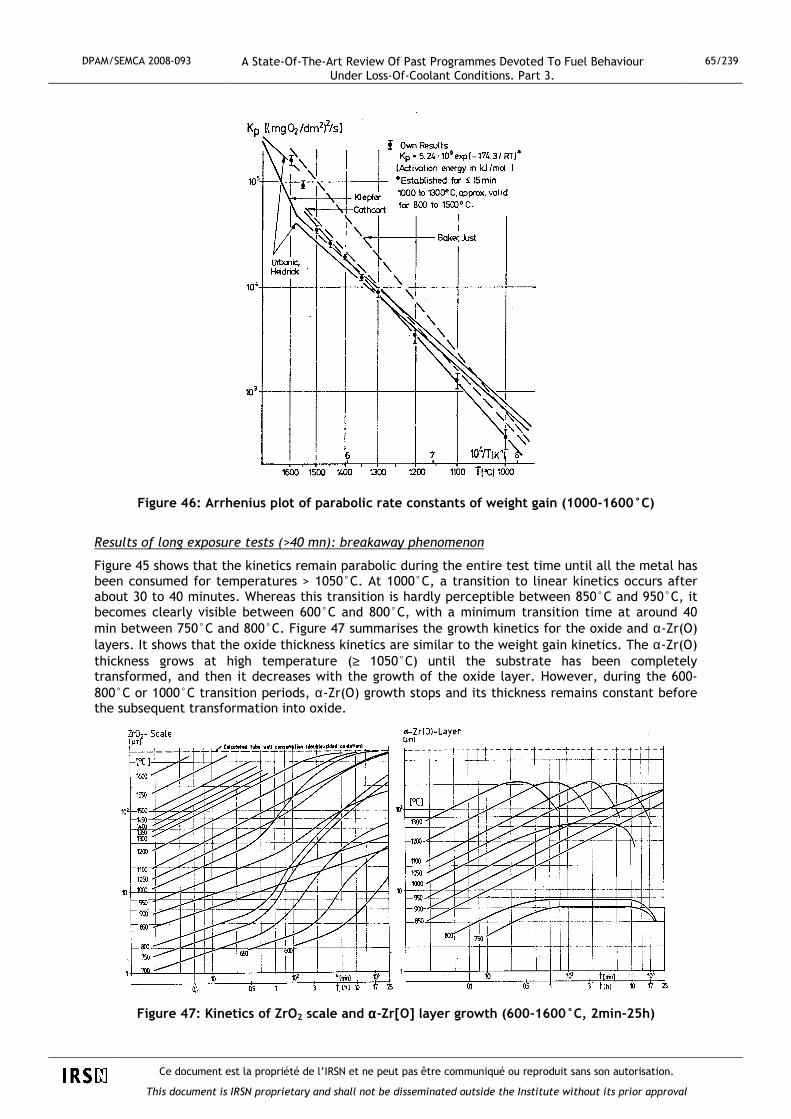
DPAM/SEMCA 2008-093 A State-Of-The-Art Review Of Past Programmes Devoted To Fuel Behaviour Under Loss-Of-Coolant Conditions. Part 3.
65/239
Ce document est la propriété de l’IRSN et ne peut pas être communiqué ou reproduit sans son autorisation.
This document is IRSN proprietary and shall not be disseminated outside the Institute without its prior approval
Figure 46: Arrhenius plot of parabolic rate constants of weight gain (1000-1600°C)
Results of long exposure tests (>40 mn): breakaway phenomenon
Figure 45 shows that the kinetics remain parabolic during the entire test time until all the metal has been consumed for temperatures > 1050°C. At 1000°C, a transition to linear kinetics occurs after about 30 to 40 minutes. Whereas this transition is hardly perceptible between 850°C and 950°C, it becomes clearly visible between 600°C and 800°C, with a minimum transition time at around 40 min between 750°C and 800°C. Figure 47 summarises the growth kinetics for the oxide and α-Zr(O) layers. It shows that the oxide thickness kinetics are similar to the weight gain kinetics. The α-Zr(O) thickness grows at high temperature (≥ 1050°C) until the substrate has been completely transformed, and then it decreases with the growth of the oxide layer. However, during the 600-800°C or 1000°C transition periods, α-Zr(O) growth stops and its thickness remains constant before the subsequent transformation into oxide.
Figure 47: Kinetics of ZrO2 scale and αααα-Zr[O] layer growth (600-1600°C, 2min-25h)

DPAM/SEMCA 2008-093 A State-Of-The-Art Review Of Past Programmes Devoted To Fuel Behaviour Under Loss-Of-Coolant Conditions. Part 3.
66/239
Ce document est la propriété de l’IRSN et ne peut pas être communiqué ou reproduit sans son autorisation.
This document is IRSN proprietary and shall not be disseminated outside the Institute without its prior approval
The microstructures obtained after long-term oxidations between 600°C and 800°C (cf. Figure 48) revealed the presence of various circumferential cracks and deep radial cracks in the oxide layer. This degradation of the oxide layer would explain the acceleration in the kinetics in a breakaway process comparable to the transition process during Zircaloy corrosion in reactor conditions. According to the authors, this breakaway process would be the result of the non-homogeneous transformation of tetragonal zirconia into monoclinic zirconia, formed on the oxidation front and initially stabilised below the normal transformation temperature under the combined action of stress, sub-stoichiometry and the small grain size.
Figure 48: Zircaloy-4 cladding tube microstructures after double-sided steam oxidation at 600 to 800°C
A phenomenological “model” illustrated in Figure 49 was recommended by the authors [42] to describe the different stages of this process. The cracking and spalling of the monoclinic zirconia helped restore the initial oxidation conditions for a new tetragonal sub-layer at the interface with the metal. The periodic repetition of this process resulted in quasi-linear kinetics.

DPAM/SEMCA 2008-093 A State-Of-The-Art Review Of Past Programmes Devoted To Fuel Behaviour Under Loss-Of-Coolant Conditions. Part 3.
67/239
Ce document est la propriété de l’IRSN et ne peut pas être communiqué ou reproduit sans son autorisation.
This document is IRSN proprietary and shall not be disseminated outside the Institute without its prior approval
Figure 49: Tentative sequence of causal mechanisms for breakaway effect during Zircaloy-4 high-temperature oxidation in steam

DPAM/SEMCA 2008-093 A State-Of-The-Art Review Of Past Programmes Devoted To Fuel Behaviour Under Loss-Of-Coolant Conditions. Part 3.
68/239
Ce document est la propriété de l’IRSN et ne peut pas être communiqué ou reproduit sans son autorisation.
This document is IRSN proprietary and shall not be disseminated outside the Institute without its prior approval
Simultaneously with the onset of the kinetics transition, it was observed that the cladding picked up a considerable amount of hydrogen (cf. Figure 50). This revealed the damaged the integrity of the oxide layer, thus allowing for the possible ingress of steam to form a stagnant oxidising atmosphere. After the water molecules have dissociated, the hydrogen can then easily migrate towards the metallic substrate.
Figure 50: Hydrogen content as a function of exposure time (650 – 1000°C)
The cause of the cubic→parabolic transition and minor breakaway effect observed for oxidations between 850°C and 950°C was not clearly established, but it seems to be related to the existence of the α+β two-phase domain of Zircaloy.

DPAM/SEMCA 2008-093 A State-Of-The-Art Review Of Past Programmes Devoted To Fuel Behaviour Under Loss-Of-Coolant Conditions. Part 3.
69/239
Ce document est la propriété de l’IRSN et ne peut pas être communiqué ou reproduit sans son autorisation.
This document is IRSN proprietary and shall not be disseminated outside the Institute without its prior approval
3.1.8 Ocken report (EPRI, USA)
As the tests related to the preceding investigations were all performed during the second half of the 1970s, it was commonly accepted in the early 1980s that they had provided sufficient and correct information on the issue of Zircaloy isothermal oxidation kinetics in steam.
In 1979, Ocken [43,44] completed a comparative review of the seven Zircaloy oxidation test programs discussed above. Table 6 compares the values of the oxidation kinetic coefficients adjusted in relation to the test results. The heating method used in the different investigations is also stated.
Kp = A exp (-B/RT) Authors Organisation Heating method
A ( g/Zr/cm2)2/s B (cal/mole)
Biederman WPI internal 0.310 33370
Westerman & Hesson BNWL internal 0.522 34700
Urbanic & Heidrick AECL internal 0.296.a 33420 a
Suzuki & Kawasaki JAERI external 3.80 40710
Cathcart & Pawel ORNL external 2.94 39940
Brown & Healey CEGB external 3.64 41600
Leistikow & Schanz KfK external 4.26 b 41653 b
a: Value specified in the Urbanic report (slightly different to that in Table 3 from the Ocken report cited in Ref.[43])
b: Value specified in the Leistikow report (slightly different to that in Table 3 from the Ocken report cited in Ref.[43])
Table 6: Comparison of kinetics inferred from the 7 Zircaloy oxidation test programs
This table clearly shows that the constants A and B of the correlations resulting from each investigation fall into two groups corresponding to the heating method: internal (direct Joule effect or induction heating) and external (resistance furnace heating). This led Ocken to regroup the tests according to each heating technique (cf. Figure 51) in order to infer the two corresponding correlations, listed in table 7, including the correlation for all results independent of the heating technique.
Kp = A exp (-B/RT)
A ( g/Zr/cm2)2/s B (kcal/mole) a B (kJ/mole) a
Internal heating 0.333 33.6 ± 2.4 140.6 ± 11.0
External heating 4.14 41.2 ± 1.9 172.4 ± 8.0
All test types 1.33 37.8 ± 2.0 158.2 ± 8.5 a: Limits for an interval with a 99% confidence level.
Table 7: Zircaloy oxidation kinetic coefficients according to the type of heating
Figure 51 shows that scatter remains moderate in each group, which seems to indicate that the discrepancy between the 2 groups is not a result of the different methods used to measure the progress of the reaction, nor a result of the different sample compositions. Ocken explained this difference by the existence of a radial temperature gradient in the cladding; a gradient for which the direction depended on the heating technique: the temperature decreases from the inside outwards for internal heating and does the opposite for external heating. This difference led to relative differences in oxygen diffusion rates in the oxide and metal, which must result in differences in the oxide/α-Zr thickness ratio in relation to the temperature. This was partially

DPAM/SEMCA 2008-093 A State-Of-The-Art Review Of Past Programmes Devoted To Fuel Behaviour Under Loss-Of-Coolant Conditions. Part 3.
70/239
Ce document est la propriété de l’IRSN et ne peut pas être communiqué ou reproduit sans son autorisation.
This document is IRSN proprietary and shall not be disseminated outside the Institute without its prior approval
confirmed in Ocken’s comparative analysis [43] in which the oxide/α-Zr ratio seems higher in tests with external heating, excluding the JAERI tests. Assessing the impact of a radial temperature gradient on the oxide/α-Zr thickness ratio is only relevant for the isothermal part of the test and can be largely distorted by the corrective method chosen to take into account oxidation during the temperature ramp phase.
Figure 51: Best-estimate fit to parabolic rate constant data for reacted zirconium: (a): externally-heated specimens (b): internally-heated specimens
The location of the temperature measurement (to which the oxidation kinetics are related) also plays a part in differentiating between the test results. This is illustrated in Figure 51a (external heating) which plots both the ORNL tests using internal temperature measurements, and CEGB tests using external temperature measurements: the latter appear to be plotted below the former, conveying a higher temperature for the same reaction Kp.
Figure 52 compares the kinetics from Table 7 with those from earlier Bostrom, Lemmon and Baker-Just tests. It shows that the average correlations inferred respectively from internal and external heating tests meet around 1250°C. The “internal heating” correlation gives higher values than those resulting from the “external heating” correlation for temperatures < 1243°C. This figure also shows that the Baker-Just correlation is in the average of the other kinetics at around 1000°C (1/T ∼ 8. E-4), but it quickly deviates at higher temperatures by more than a factor of 2 at 1400°C (1/T ∼ 6. E-4). In agreement with Ocken, this deviation seems to be a consequence of the selection of data that were used to derive the Baker-Just correlation, using a combination of results from the main temperature range (T<1500°C) with results at high temperature (1850°C), the latter being therefore influenced by the kinetics change above the tetragonal-cubic transformation of zirconia. Based on the Lemmon and Bostrom results used by Baker & Just (cf. § 2.1.1) and by selecting tests with T< 1850°K, Ocken obtained the following weight gain correlation:
Kp = 0.492 exp (-141300/RT) ( g/Zr/cm2)2/s
The coefficients of this correlation are similar to those of correlation for the internal heating tests in Table 7. Figure 52 shows that this correlation is located in the upper bound of the previous correlations around 1400°C but significantly diverges at lower temperatures around 1000°C.

DPAM/SEMCA 2008-093 A State-Of-The-Art Review Of Past Programmes Devoted To Fuel Behaviour Under Loss-Of-Coolant Conditions. Part 3.
71/239
Ce document est la propriété de l’IRSN et ne peut pas être communiqué ou reproduit sans son autorisation.
This document is IRSN proprietary and shall not be disseminated outside the Institute without its prior approval
Figure 52: Comparison of oxidation kinetics with internal and external heating
Ultimately, in consideration of the following elements:
- Internal heating corresponds to the situation of a fuel rod in a reactor,
- The temperature range of interest for Zircaloy oxidation under LOCA conditions is between about 900°C (beginning of significant oxidation) and 1300°C (beyond the current peak cladding temperature limit),
- The internal heating correlation is conservative around the low temperatures of the interval, particularly in the least-explored range (T<1000°C) in which Zircaloy and zirconia phase transformations occur,
Ocken recommends replacing the Baker-Just correlation with the average correlation resulting from internal heating tests:
Kp = 0.333 exp (-140600/RT) ( g/Zr/cm2)2/s
0.1
1
10
100
5.0E-04 6.0E-04 7.0E-04 8.0E-04 9.0E-04
1/T (K-1)
Kp
(mg
Zr/
cm2 )2 /s
Int. Heating
Ext. Heating
All
Bostrom-Lemmon
Baker-Just

DPAM/SEMCA 2008-093 A State-Of-The-Art Review Of Past Programmes Devoted To Fuel Behaviour Under Loss-Of-Coolant Conditions. Part 3.
72/239
Ce document est la propriété de l’IRSN et ne peut pas être communiqué ou reproduit sans son autorisation.
This document is IRSN proprietary and shall not be disseminated outside the Institute without its prior approval
3.1.9 Tests by Prater and Courtright (PNL, Richland , USA)
In the middle of the 80s, additional contribution to Zircaloy oxidation studies was provided by Prater & Courtright [45,46] within the framework of the Severe Core Damage Materials Property Tests Program. This program particularly covered the 1300-2400°C high temperature range, thus considerably beyond the metal’s melting point temperature.
Isothermal oxidation tests at very high temperatures require an apparatus with very low thermal inertia. The method used in this case involved heating the sample – composed of a Zircaloy disk with a diameter of 3.8 mm and a thickness of 0.9 mm – with an infrared laser beam. The test apparatus is illustrated in Figure 53. The temperature was measured by a two-colour pyrometer, making it possible to automatically control the power delivered by the laser. The pyrometer was designed to either target the sample’s directly-heated side or the opposite side. This made it possible to take into account important gradients in oxide thicknesses on each side, and assess the oxidation kinetics at the mean temperature of the two sides.
Figure 53: High temperature oxidation apparatus
Typically, all tests were initiated by pre-heating the samples in argon at an intermediate temperature plateau, before injecting steam preheated at 600°C. This generally resulted in a rapid temperature rise to reach the target temperature thanks to additional external laser heating controlled by the pyrometer. The oxidation phase was ended by closing the shutter on the laser, thus resulting in a very fast cooling (∼ 500 K/s at initial rate).
An example of the temperature history is given in Figure 54 for a test at 2300°C. Correction was applied to the test time to take into account oxidation occurring during the temperature ramp up to the target temperature.
The oxidation rate was determined by measuring the thicknesses of the oxide and α-Zr[O] layers in post-test metallographic examinations. Measurements were taken from 5 different points in the central two thirds of the area heated by laser. The weight gain was later determined based on the layer thicknesses and the oxide and α-Zr[O] densities which were evaluated according to the weight gain measurements taken from a selection of samples.

DPAM/SEMCA 2008-093 A State-Of-The-Art Review Of Past Programmes Devoted To Fuel Behaviour Under Loss-Of-Coolant Conditions. Part 3.
73/239
Ce document est la propriété de l’IRSN et ne peut pas être communiqué ou reproduit sans son autorisation.
This document is IRSN proprietary and shall not be disseminated outside the Institute without its prior approval
Figure 54: Temperature-time excursion for isothermal oxidation experiment at 2300°C as recorded by
computer. Actual data points are plotted along with the pre-programmed curve
Oxidation kinetics were determined from 1300°C to 2400°C at temperature intervals of 100°C. The results reveal parabolic behaviour over the entire temperature range for standard parameters: oxide, alpha, and oxide+alpha layer thicknesses, as well as weight gain. Figure 55 shows the dependence of the oxide and oxide+alpha growth constants on temperature (consistent with an Arrhenius law). The curves correspond respectively to the temperatures measured on both the heated side and the opposite side of the samples. The authors arbitrarily chose the average kinetics which were representative of isothermal kinetics, as shown by the curve plotted at the mid-temperature interval between the two previous curves.
(a) (b)
Figure 55: Parabolic rate constants for (a) oxide-layer growth and (b) combined-layer growth

DPAM/SEMCA 2008-093 A State-Of-The-Art Review Of Past Programmes Devoted To Fuel Behaviour Under Loss-Of-Coolant Conditions. Part 3.
74/239
Ce document est la propriété de l’IRSN et ne peut pas être communiqué ou reproduit sans son autorisation.
This document is IRSN proprietary and shall not be disseminated outside the Institute without its prior approval
Figure 55 clearly shows discontinuity in the growth rates in relation to the temperature. This discontinuity – around 1510°C – is associated with the tetragonal-to-cubic phase transformation of zirconia. No other discontinuity in the growth rates was observed, neither upon melting of the metal (∼1980°C) nor upon disappearance of the tetragonal phase of zirconia (2285°C).
Isothermal test results made it possible for the authors to recommend the following relationships for the growth kinetics of the oxide layer (x), the combined oxide+ alpha (ξ) layer and the weight gain:
Wx = 1.004 exp (-12230 / T) t 0.5 cm/s1/2 (1300 < T <1510°C)
Wx = 5.46 exp (-14210 / T) t 0.5 cm/s1/2 (1510 < T <2400°C)
Wξ = 0.060 exp (-6160 / T) t 0.5 cm/s1/2 (1300 < T <1510°C)
Wξ = 2.05 exp (-11550 / T) t 0.5 cm/s1/2 (1510 < T <1900°C)
Wm = 5.74 exp (-13220 / T) t 0.5 (g/cm2)/s1/2 (1510 < T <2400°C)
Comparison with other program results
Figure 56 compares the oxide layer growth rates obtained from PNL tests with the growth rates from correlations recommended by Cathcart, Urbanic and Baker-Just. As the Cathcart-Pawel curve was very similar to the Prater & Courtright curve (PNL) for T< 1510°C, the authors felt relatively confident in the validity of their results at high temperature, considering the reference position of the Cathcart correlation. The PNL correlation at high temperature seems however very high, especially higher than the Baker-Just correlation. Furthermore, a considerable difference in the kinetics can be observed in comparison with the AECL correlation by Urbanic & Heidrick, not to mention a difference in the temperature at which the discontinuity occurs (1580°C in the AECL correlation). These differences were not clearly explained, which the authors attributed to the differences in experimental methodologies and uncertainties in temperature measurements.
Figure 56: Comparison of parabolic-rate constants for oxide layer growth determined in PNL study with earlier works
Comparison with the KfK results of isothermal tests performed between 1450°C and 1600°C – as briefly mentioned in [47] – nevertheless called into question the validity of the PNL approach used to obtain the average kinetics based on temperature measurements on both sides of the sample. Table 8 below compares the growth rates Kox (eox = Kox t
1/2 ) of the oxide layer inferred from KfK and PNL test results between 1450°C and 1600°C at different times. The two values corresponding to the temperatures measured on both sides of the sample are reported for the PNL results.

DPAM/SEMCA 2008-093 A State-Of-The-Art Review Of Past Programmes Devoted To Fuel Behaviour Under Loss-Of-Coolant Conditions. Part 3.
75/239
Ce document est la propriété de l’IRSN et ne peut pas être communiqué ou reproduit sans son autorisation.
This document is IRSN proprietary and shall not be disseminated outside the Institute without its prior approval
Kox (10-4 cm / s0.5)
T (°C) t (minute) Leistikov (KfK) Prater-Courtright (PNL)
5 6.8 1450
10 7.2 7 9.5
5 8.6 1500
10 9.2 8.3 20
2 19.5 1550
5 17 19 28
2 24.6 1600
3 28.5 23 35
Table 8: Comparison of oxide growth rates from KfK and PNL tests between 1450°C and 1600°C
This comparison clearly revealed the fact that the KfK tests growth rates – obtained with reliable temperature measurements – were much closer to the smaller of the 2 kinetic values inferred from PNL tests; this value corresponds to the temperature measured on the side heated by the laser beam. According to Berdyshev [47], this is because the infrared laser beam does not deposit energy on the surface only. Some of the energy is also absorbed over a certain length of the oxide layer, which reduces the temperature gradient in this layer in comparison to the hypothesis of an energy deposit on the outer surface only. Furthermore, the heat generation from the exothermic reaction at the oxide-metal interfaces also helps reduce this temperature gradient between the heated side and the metal. Ultimately, the high temperature kinetics in the PNL approach would be better represented by the lower curve, therefore bringing the results closer to those of the Urbanic results (AECL).
3.1.10 Tests by Moalem and Olander (Univ. Ca., Berk eley, USA)
A more recent study (1990) by Moalem and Olander [48] unexpectedly shed light on Zircaloy oxidation kinetics in the 1100-1500°C range and above 1600°C, as well as providing new information on the effect of hydrogen a) in an oxidising atmosphere or b) pre-loaded in the material.
Figure 57 illustrates the test apparatus which consists in a resistance furnace surrounding the reaction chamber made of an alumina tube with a diameter of 3.8 cm. The sample to be oxidised – a 4 mm thick disk of Zircaloy-4 with a diameter of 12 mm – was suspended in the tube from a platinum-rhodium wire connected to a microbalance located above the furnace. The temperature was measured both by a Pt-Rh thermocouple which was positioned in the oxidation chamber near the sample (1 cm) and by means of a pyrometer pointing on the sample through a quartz-sapphire composite rod inserted into the reaction chamber from the base. This pyrometer was mainly designed to detect rapid temperature variations after the oxidation process had been started by steam injection. In calibration tests, the temperature difference between the thermocouple in the furnace and a thermocouple fixed to the sample was limited to 3°C in an inert atmosphere. During the tests, the weight gain and temperature were recorded continuously by the microbalance and the furnace thermocouple.
Figure 57: Apparatus for investigating Zr oxidation by steam using the continuously-recording microbalance technique

DPAM/SEMCA 2008-093 A State-Of-The-Art Review Of Past Programmes Devoted To Fuel Behaviour Under Loss-Of-Coolant Conditions. Part 3.
76/239
Ce document est la propriété de l’IRSN et ne peut pas être communiqué ou reproduit sans son autorisation.
This document is IRSN proprietary and shall not be disseminated outside the Institute without its prior approval
In each experiment, the test temperature was first stabilised in a neutral atmosphere (argon or hydrogen), before triggering oxidation by switching to a gaseous flow of steam (or steam-hydrogen or steam-helium mixture). For this reason, this procedure differed from most the previous investigations, in which the test temperature was reached during a temperature ramp phase already in a steam atmosphere. Nevertheless, this procedure did not produce purely isothermal tests as the reaction energy generated a temperature excursion during the first few moments that escalated rapidly with the temperature at the argon-steam switchover.
The weight gain measurements recorded by the microbalance were used to continuously monitor the reaction’s progress, thus making it possible to express the growth rate Kw, in a parabolic form, for example:
)( 00 ttwKWW −+=
where W0 represents the weight gain at the time t0 .
Isothermal oxidation tests at 1100°C < T < 1500°C
Figure 58A shows the weight gain as a function of time for an oxidation test at 1190°C; 58B gives a parabolic representation according to the above-mentioned equation. The data points at the beginning of the oxidation were influenced by various effects: limitation by gas-phase mass transfer, an initial temperature excursion, and possible absorption of hydrogen. This is why they differed from the parabolic relationship that fits for (t-t0) > 140 s, which means they can easily be excluded from the curve fitting. Tests performed at higher temperatures also differed from the parabolic law in the presence of significant oxidation. This was due to the effect of the sample’s finite thickness, as illustrated in 58C for a test at 1500°C, which once again reduced the interval available for parabolic curve fitting.
Figure 58A: Weight-gain plot for oxidation of pure Zircaloy in pure steam at 1190°C

DPAM/SEMCA 2008-093 A State-Of-The-Art Review Of Past Programmes Devoted To Fuel Behaviour Under Loss-Of-Coolant Conditions. Part 3.
77/239
Ce document est la propriété de l’IRSN et ne peut pas être communiqué ou reproduit sans son autorisation.
This document is IRSN proprietary and shall not be disseminated outside the Institute without its prior approval
Figure 58B: Plot to determine the parabolic weight-gain rate constant using the data in Figure 58A
Figure 58C: Plot to determine the parabolic weight-gain rate constant for oxidation of Zircaloy in
pure steam at 1500°C
In Figure 59, the weight-gain rate constant was adjusted to the parabolic portions of the continuous test measurements and expressed as an Arrhenius equation in relation to temperature in the 1100-1500°C interval. This weight-gain constant is compared with the correlations resulting from the previously discussed programs. The Moalem & Olander results – correlated by the following equation – were surprisingly very similar to the Baker-Just correlation and consequently, distinctly higher than correlations resulting from the previous programs.
Wm = 1.9 exp (-11298 / T) t 0.5 (g/cm2)/s1/2 (1100 < T <1500°C)
According to the authors, this discrepancy cannot be explained by inaccurate temperature measurements, which would require an overestimation of 60°C to 70°C to make the kinetics match the average obtained by previous investigations. In fact, the calibration tests only indicated a difference of 3°C or less between the furnace thermocouple and the thermocouple fixed to the sample. According to the authors, this difference could be due to the decision to integrate the results of the initial non-isothermal phase into the analysis, distorting the kinetics all the more so since the isothermal oxidation time was short.

DPAM/SEMCA 2008-093 A State-Of-The-Art Review Of Past Programmes Devoted To Fuel Behaviour Under Loss-Of-Coolant Conditions. Part 3.
78/239
Ce document est la propriété de l’IRSN et ne peut pas être communiqué ou reproduit sans son autorisation.
This document is IRSN proprietary and shall not be disseminated outside the Institute without its prior approval
Figure 59: Arrhenius plot of the weight-gain rate constants for Zircaloy oxidation in steam
(Open circles = Moalem-Olander data; squares = Evans-Burman data)
However, this explanation offered by Moalem & Olander was not demonstrated convincingly. Therefore, it cannot be considered sufficient in invalidating the consistency of results from previous investigations in the 1100-1500°C range, which generally integrated a more or less accurate correction of the initial temperature ramp phase into the isothermal oxidation time (cf. Pawel, § 3.1.4.1).
Oxidation tests at T ≥ 1500°C
For tests at temperatures T ≥ 1500°C in the zirconia cubic phase domain and considering the sudden argon-steam switchover method in the Moalem tests, the initial transient period induced a considerable temperature excursion that was not resorbed rapidly enough before the finite-size effects of the samples appeared in the kinetics. According to the authors, it is for this reason that oxidation can never be considered parabolic in this temperature range. According to the same authors, this conclusion would therefore also apply to the high temperature test results by Urbanic et al. and Prater et al. for which the parabolic kinetics would not be representative of the oxidation reaction. According to Moalem and Olander, taking into account the initial transient effects and the finite-size effect of the samples, the correct analysis of the oxidation tests in the zirconia cubic phase domain requires a transient oxygen diffusion model based on the application of Fick’s laws in a multiphase system with moving boundaries.

DPAM/SEMCA 2008-093 A State-Of-The-Art Review Of Past Programmes Devoted To Fuel Behaviour Under Loss-Of-Coolant Conditions. Part 3.
79/239
Ce document est la propriété de l’IRSN et ne peut pas être communiqué ou reproduit sans son autorisation.
This document is IRSN proprietary and shall not be disseminated outside the Institute without its prior approval
3.2 Effect of the finite size of samples
The parabolic form of the correlations inferred from test results of the above-mentioned investigations implies an ideal diffusion process in a semi-infinite medium. It is obvious that this condition is never fulfilled and the parabolic form is only followed approximately over test times that are short enough so that the oxygen concentration in the central metallic substrate remains far from being saturated.
As part of research at ORNL (cf. § 3.1.4 above), a specific series of oxidation tests at 1300°C was performed up to oxidation times of 1237 s leading to oxygen saturation in the beta phase [49]. Metallographic examinations of the oxidised samples at intermediary times revealed the growth of a compact alpha layer at times corresponding to a mean oxygen concentration up to about 75% saturation in the beta phase. An irregular α/β interface and α incursions in the β phase were then observed at longer test times, corresponding to a mean oxygen concentration of > 80% saturation in the Zr-β layer, and thus a low concentration gradient in this phase. The appearance of α incursions during isothermal oxidation in the vicinity of the β phase saturation was inconsistent with Sawatsky’s conclusions [50], which considered that such incursions only developed during cooling owing to supersaturation in the β phase. In two oxidised samples with 99% saturation in the β phase, cooled at different rates(one sample was cooled from 1200°C to 850°C at 3°C/s, while the other cooled rapidly from 1200°C), Sawatzky did not observe any α incursions in the rapidly-cooled sample. In the ORNL tests, the isothermal oxidation phase was stopped by turning off the furnace heating, which resulted in an initial temperature drop of about 100°C/s. This led Pawel and Campbell to believe that the α incursions observed in their tests mainly occurred at the end of the isothermal oxidation, though they still recognised the possibility of an additional contribution during slow-cooling for samples with a β phase nearing saturation.
For the above-mentioned ORNL test series at 1300°C, the metallographic examinations made it possible to determine the thicknesses of the oxide and α phase layers, in terms of both the compact α layer only and the equivalent layer with α incursions; the oxygen weight gain was also inferred by assuming a linear concentration gradient in each of these layers. Figure 60 compares the oxide and Zr-α layer thicknesses measured in these tests with predictions obtained with the MULTRAN diffusion code (MULTRAN is a simplified version of the SIMTRAN code developed by ORNL).
The figure shows that the experimental results were correctly predicted by the parabolic correlations for short test times up to about 400 s. Beyond 500 s, the following was observed:
- A slight deceleration in the growth of the oxide thickness, which appears to be below predictions by the parabolic model and MULTRAN code. According to the authors, this difference could be due to the structural changes in the oxide, though it is small enough to be disregarded in the prediction model (parabolic correlation or diffusion model);
- A very distinct increase in the growth of the Zr-α thickness (compact or with incursions), the equivalent thickness with incursions being rather similar to the MULTRAN prediction which only took into account the ideal growth of an incursion-free Zr-α layer; this prediction was about 2 times greater than the extrapolation of the parabolic law at times > 1200 s.

DPAM/SEMCA 2008-093 A State-Of-The-Art Review Of Past Programmes Devoted To Fuel Behaviour Under Loss-Of-Coolant Conditions. Part 3.
80/239
Ce document est la propriété de l’IRSN et ne peut pas être communiqué ou reproduit sans son autorisation.
This document is IRSN proprietary and shall not be disseminated outside the Institute without its prior approval
Figure 60: Growth of oxide and αααα-Zr layers on Zircaloy-4 in steam at 1300°C
For a sample with an oxygen-saturated β layer, the authors concluded that the variation in the Zr-α growth kinetics, as indicated in Figure 60, corresponded to the progressive saturation of the β phase. This conclusion was based on the assumption that the growth of the Zr-α layer remained parabolic but with a rate constant greater than that with the initial oxygen concentration (CO = 0.12% weight) owing to the absence of oxygen flowing towards β. To support this conclusion, the growth kinetic constants Kp for the oxide layer, the Zr-α layer and the weight gain were recalculated based on MULTRAN predictions for a material with an initial oxygen concentration corresponding to saturation in the β phase at temperatures between 1000°C and 1500°C. They were then compared with the corresponding predictions for the standard initial concentration CO = 0.12%. A slight increase of 3% to 17% was observed in the oxide growth constant but an increase of 45% to 135% was remarked in the Zr-α growth constant. However, the weight gain growth constant was increased by only 3% to 13% due to the fact that there was no diffusion in the β phase.
In short, the effects related to the finite size of the samples can be observed with times and temperatures that can lead to an oxygen concentration in the β phase greater than 75% of saturation. These effects will therefore mainly affect two-sided oxidations all the more so since the cladding is thin.
Moalem and Olander (cf. § 3.1.10) also demonstrated the difficulty of interpreting high temperature tests with a parabolic model, partially due to the finite-size effect.
Correctly predicting oxidation under ‘time - temperature’ conditions where the sample’s finite-size is no longer negligible therefore require a oxygen diffusion model based on the application of Fick’s laws in a multiphase system with moving boundaries.

DPAM/SEMCA 2008-093 A State-Of-The-Art Review Of Past Programmes Devoted To Fuel Behaviour Under Loss-Of-Coolant Conditions. Part 3.
81/239
Ce document est la propriété de l’IRSN et ne peut pas être communiqué ou reproduit sans son autorisation.
This document is IRSN proprietary and shall not be disseminated outside the Institute without its prior approval
3.3 Transient oxidation
3.3.1 Tests by Cathcart, Pawel et al.
Within the scope of testing the transient temperature predictions of the BILD5 and SIMTRAN codes developed in connection with the ORNL oxidation test program (cf. § 3.1.4), a limited number of tests were also carried out with temperature transients such as those shown in Figure 61. Figure 61(a) shows various heating and cooling ramps up to (or from) an isothermal plateau, whereas 61(b) shows a hollow in the temperature plateau, and 61(c) shows the simulation of a hypothetical LOCA transient with a more or less high temperature at first peak.
Figure 61: Schematic representations of the time-temperature profiles of transient temperature oxidation tests

DPAM/SEMCA 2008-093 A State-Of-The-Art Review Of Past Programmes Devoted To Fuel Behaviour Under Loss-Of-Coolant Conditions. Part 3.
82/239
Ce document est la propriété de l’IRSN et ne peut pas être communiqué ou reproduit sans son autorisation.
This document is IRSN proprietary and shall not be disseminated outside the Institute without its prior approval
Oxide layer thicknesses predicted by BILD5 and SIMTRAN were over-estimated by 1.8% to 4.7% for (a) type transients and by 9% to 14% for (b) type transients. The alpha layer thickness was correctly estimated by BILD5, which was expected seeing that it used the correlation inferred from experimental measurements of the compact α-Zr layer thickness. However, SIMTRAN predictions were clearly overestimated, particularly for (b) type transients, corresponding to the precipitation of α incursions in the β phase during cooling (not modelled by the code). The unexpected result of measurement-to-prediction comparisons is to be considered in terms of the oxide layer thickness for (c) type tests at different temperature peaks, as it can be seen in the results in Table 9 below:
Test/ TC Material T 1st peak Measured thicknesses Calculated thickness (BILD5)
Oxide (µm) Alpha (µm) Oxide (µm) Alpha (µm)
S-160/TC-2 Zyr-4 900°C 45.8 49.8 50.5 47.9
S-162/TC-2 Zyr-4 900°C 47.5 51.0 51.6 49.7
S-196/TC-2 Zyr-4 1400°C 40.2 52.4 51.2 49.6
S-199/TC-2 Pure Zr 900°C 32.6 61.4
S-200/TC-2 Pure Zr 1400°C 26.0 66.4
Table 9: Measured and calculated thicknesses for LOCA transients at different 1st peak temperatures
When the BILD5 calculation indicated a greater oxide layer thickness for the highest 1st peak, the measured oxide layer thickness was lower in the test with the 1st peak at 1400°C than in the test with the 1st peak at 900°C, though the transients were identical after this 1st peak. This result was confirmed by two similar tests performed on pure zirconium samples. A similar result had already been observed in transient tests performed by Dobson et al. at WPI [51], but had never been explained.
It was therefore thought that this result was most probably related to the transient characteristics around this 1st peak: maximum temperature, cooling rate and minimum temperature after 1st peak, as well as perhaps the ramp rate and 2nd peak temperature. To determine the effect of these parameters, a certain number of tests were carried out in the MiniZWOK facility, with a transient involving a 10-second ramp up to a 1st peak T1, a 10-second cooling period until the lower temperature T2 was reached, followed by another temperature ramp up to T3 (unless T3 = T2) maintained for the time t3. Table 10 provides the test parameters and oxide layer thicknesses that were measured or predicted by BILD5. Three tests show a considerable difference between calculation and experimental values (>100%) whereas this difference remains <10% for the other tests. These three tests were characterised by a 2-peak transient, with the decisive elements being the significant cooling (T2 = 650°C) after the 1st peak and the moderate temperature of the 2nd peak (T3 < 1100°C).

DPAM/SEMCA 2008-093 A State-Of-The-Art Review Of Past Programmes Devoted To Fuel Behaviour Under Loss-Of-Coolant Conditions. Part 3.
83/239
Ce document est la propriété de l’IRSN et ne peut pas être communiqué ou reproduit sans son autorisation.
This document is IRSN proprietary and shall not be disseminated outside the Institute without its prior approval
Oxide Layer Thickness
Test N°
Max. Temp. of 1st Peak T1
(°C)
Min. Temp. after 1st Peak T2 (°C)
Plateau Temperature
T3 (°C)
Plateau Time t3 (s)
Calculated (µm)
Observed (µm)
Difference (%)
S-224 1050 650 1050 210 25.2 12.2 107
S-225 1400 650 1050 210 27.2 12.6 116
S-226 1400 650 1200 110 38.8 36.3 7
S-227 1050 650 1400 55 52.9 50.2 5
S-228 1400 650 1400 55 56.7 54.0 5
S-229 1400 1200 1200 190 51.7 49.7 4
S-230 1400 1200 1200 210 50.0 48.4 3
S-231 1400 x 1200 1200 160 54.9 53.1 3
S-232 1400 x 1200 1200 100 61.4 60.6 1
S-238 1400 1050 1050 200 28.4 29.4 -3
S-239 1400 650 1090 165 28.2 10.5 169
( x: cooled slowly from T1 )
Table 10: Nominal test conditions for ORNL anomalous transient temperature oxidation tests
The test results in Table 10 seem to suggest that the apparently anomalous oxidation behaviour is related to the tetragonal-monoclinic phase transformation of zirconia in the 700-1200°C temperature range, owing to hysteresis occurring during this transformation. Figure 62 illustrates this phenomenon. It can be seen that the monoclinic-tetragonal transformation occurs during heating over a relatively limited temperature range around 1200°C, whereas the inverse transformation during cooling occurs just below 1000°C and over a more broader temperature range down to 700°C. It is generally accepted that this stabilisation of the tetragonal zirconia towards lower temperatures results from the combined action of stress, the small grain size and the concentration of defects (understoichiometry).
Figure 62: Hysteresis in the monoclinic-tetragonal phase transformation in ZrO2, according to Grain & Garviei
i C.F. Grain and R.C. Garvie, Mechanism of the Monoclinic
to Tetragonal Transformation of Zirconium Dioxide, U.S. Bureau of Mines report 6619 (1965).

DPAM/SEMCA 2008-093 A State-Of-The-Art Review Of Past Programmes Devoted To Fuel Behaviour Under Loss-Of-Coolant Conditions. Part 3.
84/239
Ce document est la propriété de l’IRSN et ne peut pas être communiqué ou reproduit sans son autorisation.
This document is IRSN proprietary and shall not be disseminated outside the Institute without its prior approval
It was therefore suggested by Cathcart et al. that oxidation between 900°C and 1000°C begins with the formation of a tetragonal zirconia film on the oxidation front, before the tetragonal zirconia partially transforms into monoclinic zirconia through stress release and grain growth. As oxygen diffusion is slower in the monoclinic phase than in the tetragonal phase, the progressive phase transformation slows down the kinetics in comparison with the standard parabolic process; this was observed by ORNL in tests at 900°C and 950°C (cf. above).
Based on the phenomenological elements provided above, the anomalous oxidation behaviour observed during certain transients listed Table 10 can be explained as follows:
- The oxide formed during heating to the 1st temperature peak (1050°C to 1400°C) is predominantly tetragonal;
- This oxide transforms to the monoclinic structure during cooling at 650°C;
- During heating to the temperature plateau the monoclinic phase persists up to over 1100°C; as oxygen diffusion occurs at a slower rate in the monoclinic phase than in the tetragonal phase, the final oxidation can be expected to be below the prediction based on the tetragonal phase kinetics over the whole temperature transient. Therefore, with a high enough plateau temperature and a fast ramp rate (favouring a faster tetragonal phase re-transformation), the oxidation kinetics slowing down in the monoclinic phase will be relatively slight, and concealed by the development of parabolic oxidation kinetics in the tetragonal phase.
On the basis of these remarks, it seems that any model based entirely on the parabolic laws determined from isothermal tests in the 1000-1500°C temperature range (e.g. the Cathcart-Pawel laws) will overestimate oxidation expected during a hypothetical LOCA transient with significant cooling after the 1st temperature peak. Other than distinguishing between the growth kinetics for the monoclinic and tetragonal phases (as already recommended by Klepfer, cf. § 2.1.1), advanced modelling should include a monoclinic-to-tetragonal phase transformation law for zirconia in non-equilibrium conditions, so as to determine the phase fraction used to weight the kinetics corresponding to each phase.
3.3.2 Tests by Leistikow, Schanz et al.
The KfK tests designed to determine isothermal oxidation kinetics were concluded with a set of important transient tests simulating a fraction of or the entire hypothetical LOCA transient [52].
These transient tests were performed in the induction heating facility. Figure 63 illustrates the different types of tests that were carried out:
- Temperature peak: temperature ramp of 100 K/s up to a peak between 950°C and 1200°C, cooling at 25 K/s, and quenching at 750°C;
- LOCA-type transient: first peak at 950°C, cooling at 750°C, temperature rise (or drop) until a plateau temperature T = 700 to 1200°C, with total test time of 90 s or 180 s;
- LOCA-type transient: first peak at 950°C, cooling at 750°C, temperature rise to a plateau temperature T = 1300°C, up to t = 3 min, before final cooling at 2.2 to 57.5 K/s.

DPAM/SEMCA 2008-093 A State-Of-The-Art Review Of Past Programmes Devoted To Fuel Behaviour Under Loss-Of-Coolant Conditions. Part 3.
85/239
Ce document est la propriété de l’IRSN et ne peut pas être communiqué ou reproduit sans son autorisation.
This document is IRSN proprietary and shall not be disseminated outside the Institute without its prior approval
Figure 63: Exposure to various PWR LOCA-similar temperature transient oxidations and resulting weight gain

DPAM/SEMCA 2008-093 A State-Of-The-Art Review Of Past Programmes Devoted To Fuel Behaviour Under Loss-Of-Coolant Conditions. Part 3.
86/239
Ce document est la propriété de l’IRSN et ne peut pas être communiqué ou reproduit sans son autorisation.
This document is IRSN proprietary and shall not be disseminated outside the Institute without its prior approval
Comparison of transient and isothermal oxidations at the same plateau temperatures and total test times show – in all cases – low oxidation levels for transients (cf. Figure 64), mainly due to the shorter period of time at high temperature in transient resulting from the cooling after the first peak. LOCA-type transient oxidation is about 32% below the KfK isothermal oxidation tests and 47% below the corresponding prediction obtained by the Baker-Just correlation.
Figure 64: Temperature-transient Zircaloy-4 high temperature steam oxidation - Comparison of mass increase during LOCA-similar transients with those of isothermal exposure and as calculated by the Baker-Just equation
Comparative calculations of certain transients were performed using the SIMTRAN code developed at ORNL (cf. § 3.1.4.1) and modified by S. Malang at KfK. Figure 65 shows satisfactory agreement in terms of weight gain but a significant difference in the α-Zr layer thickness at the end of the transient. The calculation had predicted that the layer would continue to grow during the fast cooling, whereas the experiment reveals alpha phase precipitation in the central β-Zr layer.
Figure 65: Oxidation during a typical PWR LOCA transient. Comparison of SIMTRAN calculation with experimental data

DPAM/SEMCA 2008-093 A State-Of-The-Art Review Of Past Programmes Devoted To Fuel Behaviour Under Loss-Of-Coolant Conditions. Part 3.
87/239
Ce document est la propriété de l’IRSN et ne peut pas être communiqué ou reproduit sans son autorisation.
This document is IRSN proprietary and shall not be disseminated outside the Institute without its prior approval
Effect of the tetragonal-to-monoclinic phase transf ormation of zirconia
In the large-break LOCA temperature range, zirconia formed during Zircaloy oxidation can be found in two allotropic forms – monoclinic and tetragonal. The equilibrium temperature may vary between 600°C and 1100°C, mainly as a function of the stress levels resulting from the difference in metal and oxide densities. As the hypo-stoichiometry (then the concentration of oxygen vacancies) is less-pronounced in the monoclinic phase than in the tetragonal phase, the diffusion of oxygen is slower and therefore results in a lower oxidation rate than that obtained in the tetragonal phase only.
The Pawel tests (cf. § 3.3.1) had already explored the issue of transient oxidation in a temperature range likely to lead to the tetragonal ↔ monoclinic phase transformation of zirconia. These tests helped explain anomalous oxidation behaviour in transients with a 1st peak and intermediary cooling owing to the hysteresis phenomenon occurring during the zirconia phase transformation.
In KfK research, two transient test series with various temperature histories helped to produce conditions leading to a significantly lower weight gain (in certain tests) than that predicted by the integration of the kinetics deduced from previous isothermal tests.
Table 11 provides the test conditions for these two series, as well as both the measured and calculated weight gain values; the two measured values for each transient correspond to the duplication of each test. In most of the tested transients, the measured weight gain tended to be higher than the corresponding calculated value; however, several measured values indicated the opposite trend (in bold): this abnormal oxidation behaviour was investigated by the authors.
Metallographic examination of the samples listed in Table 11 provided additional information, which is given in Figure 66:
- On samples corresponding to “normal” oxidation, the oxide layer seemed divided into two by a line of tin-rich metallic particles located about 2/3 into the layer starting from the outside; the oxide/ alpha-Zr interface seemed regular and smooth; last of all, the ratio between the oxide/ alpha-Zr thicknesses was equivalent to about 0.7 – 0.95;
- On samples corresponding to a “abnormal” oxidation, the oxide layer seemed homogenous, with no precipitation of metallic particles; the oxide/ alpha-Zr interface seemed wavy with the local presence of cavities; last of all, the ratio between the oxide/ alpha-Zr thicknesses was distinctly lower than in the previous case, equivalent to about 0.2 – 0.5.
Abnormal oxidation was attributed to the partial transformation into monoclinic zirconia of the tetragonal zirconia initially formed and stabilised below the equilibrium temperature, particularly under the action of stress and understoichiometry. This transformation apparently occurred during the isothermal plateaus at 900°C or 950°C in the first series, and during intermediary cooling in the second series; the monoclinic phase persisted during the subsequent temperature ramp to 1000°C or 1100°C owing to transformation hysteresis, which resulted in slower oxygen diffusion and therefore lesser oxidation. In agreement with the results of similar ORNL tests, the temperature rise to 1200°C results in the fast re-transformation into the tetragonal phase, hiding the slowing effect of the monoclinic phase, while this transformation takes more than a minute at 1100°C.
The observation by metallographic examination of a wavy oxide-alpha interface with pores was likened to an identical observation made for pre-corroded cladding (cf. § 3.4.2), which seems to imply that similar mechanisms are occurring: during the tetragonal-to-monoclinic transformation: the higher stoichiometry of the monoclinic oxide results in supersaturation of anion vacancies, which condense into pores at the interface. In the same manner, it seems reasonable to assume that the high temperature oxidation behaviour of pre-oxidised material can also be explained by the partial phase transformation of zirconia. Therefore, loss of the protective effect of the initial oxide layer at 1200°C (as indicated in tests discussed in § 3.4.2) could be partially attributed to the transformation of the monoclinic pre-oxide into tetragonal oxide where oxygen diffusion is easier.

DPAM/SEMCA 2008-093 A State-Of-The-Art Review Of Past Programmes Devoted To Fuel Behaviour Under Loss-Of-Coolant Conditions. Part 3.
88/239
Ce document est la propriété de l’IRSN et ne peut pas être communiqué ou reproduit sans son autorisation.
This document is IRSN proprietary and shall not be disseminated outside the Institute without its prior approval
Temperature history (°C)
Measured weight gain (mg/dm2)
Calculated weight gain (mg/dm2)
Temperature ramp at ∼100°C/s, final cooling at ∼60°C/s
2 min 950 / 2 min 1100
5 min 950 / 2 min 1100
15 min 950 / 2 min 1100
2 min 900 / 2 min 1100
5 min 900 / 2 min 1100
15 min 900 / 2 min 1100
2 min 800 / 2 min 1100
5 min 800 / 2 min 1100
15 min 800 / 2 min 1100
437 466
329 + 441
525 576
588 + 468
733 + 416 +
376 + 386
497 472
494 451
405 550
419
453
520
400
417
458
387
389
396
Temperature ramp at ∼100°C/s, intermediary cooling at ∼25°C/s, ramp at ∼25°C/s, final cooling at ∼60°C/s
16 s 950 / 4 s 600 / 60 s 1100
16 s 950 / 16 s 750 / 60 s 1100
4 s 1200 / 4 s 600 / 60 s 1100
4 s 1200 / 16 s 750 / 60 s 1100
4 s 1000 / 4 s 600 / 85 s 700
4 s 1000 / 4 s 600 / 81 s 800
4 s 1000 / 4 s 600 / 77 s 900
4 s 1000 / 4 s 600 / 73 s 1000
4 s 1000 / 4 s 600 / 4 s 1200 / 53 s 1000
113 s 1000
4 s 1000 / 4 s 600 / 69 s 1100
4 s 1000 / 4 s 600 / 4 s 1200 / 57 s 1100
40 s 1000 / 69 s 1100
260 242
327+ 243 +,1
251 286
249 311
68.4 47.2 2
85.4 83.1
109 84.2
128 124 +
319 241 3
298 + 226
337 263
379 439
460 + 436
299
300
347
348
69
79
105
177
248 176 3
210
307
328
326
+: sample subjected to metallographic examination. 1: 8 s plateau at 750°C 2: no plateau at 1000°C 3: Cooling from 1200°C (instead of 1000°C)
Table 11: KfK tests studying the effect of phase changes (tetragonal ↔↔↔↔ monoclinic) in zirconia upon the oxidation kinetics of Zircaloy-4

DPAM/SEMCA 2008-093 A State-Of-The-Art Review Of Past Programmes Devoted To Fuel Behaviour Under Loss-Of-Coolant Conditions. Part 3.
89/239
Ce document est la propriété de l’IRSN et ne peut pas être communiqué ou reproduit sans son autorisation.
This document is IRSN proprietary and shall not be disseminated outside the Institute without its prior approval
← oxide
← alpha
← beta
← oxide
← alpha
← oxide
← alpha
← beta
← oxide
← alpha
Figure 66: Metallographic cross sections of samples after “normal” and “abnormal” oxidation

DPAM/SEMCA 2008-093 A State-Of-The-Art Review Of Past Programmes Devoted To Fuel Behaviour Under Loss-Of-Coolant Conditions. Part 3.
90/239
Ce document est la propriété de l’IRSN et ne peut pas être communiqué ou reproduit sans son autorisation.
This document is IRSN proprietary and shall not be disseminated outside the Institute without its prior approval
3.4 Influence of initial oxidation
3.4.1 TAGCIS/ TAGCIR tests
The TAGCIS and TAGCIR experiments were performed within the framework of a EDF/IPSN cooperative program[53].They aimed at studying the quench resistance of Zircaloy-4 cladding for high burn-up fuel. This was achieved through a series of oxidation tests at high temperature with quenching on as-received pre-corroded samples under PWR conditions (TAGCIS tests), and on irradiated samples of defueled rods removed from EDF PWRs (TAGCIR tests). The key knowledge resulting from these tests is provided in document [53], which includes all references of intermediary documents published within the scope of these programs.
Determining the oxidation kinetics of TAGCIS pre-corroded cladding and TAGCIR irradiated cladding was not one of the program objectives, as these kinetics were not expected to differ significantly from those of as-received Zircaloy cladding. However, analysis of these test results provided interesting information on the oxidation behaviour, particularly on the effect of the initial oxide layer upon the development of the LOCA transient oxidation (“protective” effect or not).
The TAGCIS program involved 25 tests on samples that had been pre-corroded under PWR conditions in the REGGAE loop at CEA, 15 of which were double-sided oxidation tests and 10 of which were one-sided oxidation tests. Thirteen of the double-sided oxidation tests were subjected to metallographic examination, which provided the thicknesses of the different layers developed during oxidation at high temperature until final quench.
The protective effect of the initial oxide layer has been investigated by comparing oxide thicknesses formed at high temperature on the inner and outer surfaces of the double-sided oxidised samples; the outer thickness only may have been influenced by the effect of the initial oxide. Examination of the differences in the inner and outer thicknesses for the 13 relevant tests showed that the inner surfaces tended to have a slightly higher oxidation, which might indicate that the initial oxide layer provided a partial protective effect with regard to transient oxidation on the outer surface. For 9 of the 13 tests however, this difference remained ≤ 10 µm, thus laying within uncertainty on metallographic thickness measurements.
Within the TAGCIR program, the 14 double-sided oxidation tests of the first test series were used for similar comparisons, as with previous tests on pre-corroded TAGCIS samples.
During examination of the differences in inner and outer thickness, 11 of the 14 tests once again showed a tendency for slightly higher oxidation on the inner side, though this was limited to 10 µm, laying again within uncertainty on thickness measurements.
Figure 67 compares the measured and calculated total thicknesses of the oxide layer on the outer surfaces. The transient oxidation was calculated with the Cathcart-Pawel correlation both taking into account and disregarding a full protective effect of the initial oxide layer. Excepting one test, the measured values were the highest, though similar to the calculated values without a protective effect by about 10 µm on average. However, the measured values deviated by about an average of 40 to 50 µm from the calculated values with a full protective effect.
In conclusion, within the range of temperature and oxidation time of these tests, the protective effect of the initial oxide layer with regard to transient oxidation seems to be negligible and covered by uncertainty on the oxide thickness measurements. This result can be explained by the fact that the oxide layer formed during in-reactor operation has a layered structure with numerous transverse cracks acting as short-circuits for the diffusion of oxygen towards the dense zirconia layer formed on the oxidation front. Therefore, this dense oxide layer only ensures a rather insignificant protective role with regard to transient oxidation, owing to its considerably reduced thickness and damage most probably incurred during the LOCA transient temperature rise.

DPAM/SEMCA 2008-093 A State-Of-The-Art Review Of Past Programmes Devoted To Fuel Behaviour Under Loss-Of-Coolant Conditions. Part 3.
91/239
Ce document est la propriété de l’IRSN et ne peut pas être communiqué ou reproduit sans son autorisation.
This document is IRSN proprietary and shall not be disseminated outside the Institute without its prior approval
Figure 67: TAGCIR double-sided tests on irradiated samples. Measurements versus Cathcart calculations of the total outer surface oxide thickness with or without protective effect of the initial oxide
3.4.2 Tests by Leistikow and Schanz
The effect of initial pre-oxidation was studied in the series of isothermal and transient temperature tests performed by Leistikow and Schanz at KfK
Concerning the isothermal tests [41], the samples were pre-corroded in steam between 350°C and 1300°C for times resulting in an initial oxide layer ranging from several µm to about 50 µm (up to 2000 hours at 350°C and 400°C). The thickest pre-corroded layers revealed a more or less defective structure with the presence of circumferential cracks. Coloration ranged from grey to white, which differs from the uniform black aspect of oxide layers formed at high temperature. The pre-corroded samples were then oxidised in isothermal conditions for 5 minutes at a temperature between 1000°C and 1200°C. Figure 68 shows the effects of various pre-oxidised thicknesses obtained between 350°C and 600°C on the total mass gain after oxidation at 1000°C to 1200°C. Comparison is made with the mass gain on a non pre-corroded sample. It seems that the initial oxide layer has a slightly accentuated protective effect on the transient oxidation at 1000°C, with the total thickness of the initial oxide layer + transient oxide layer being less than the thickness of the oxide formed on a bare sample. This accentuated protection can be explained by slower diffusion in the initial oxide layer (monoclinic) than in the layer formed at high temperature (tetragonal). However, this effect does not increase with the initial layer thickness, with maximum protection observed at a pre-oxidised thickness < 10 µm. At 1200°C, a slight protective effect can still be observed in the initial layers up to 10 µm, but this effect disappears for considerable initial thicknesses: a total mass gain higher than that obtained on bare cladding was even remarked. The authors suggest that this disappearance of the protective effect against transient oxidation for a thick layer is due to degradation of the layer’s cohesion during late-occurring corrosion, before being accentuated during the temperature transient. However, this decohesion does not spread to the oxide layer formed under the pre-corroded layer at high temperature and which presents a standard sound columnar structure.
0
10
20
30
40
50
60
70
80
90
100
110
120
130
140
150
160
170
180
TR05 TR22 TR23 TR24 TR25 TR26 TR27 TR28 TR29 TR30 TR31 TR32 TR33 TR34
Test No.
Tot
al o
xide
thic
knes
s on
out
er s
urfa
ce (
µm)
measured
calculated without protective effect
calculated with protective effect

DPAM/SEMCA 2008-093 A State-Of-The-Art Review Of Past Programmes Devoted To Fuel Behaviour Under Loss-Of-Coolant Conditions. Part 3.
92/239
Ce document est la propriété de l’IRSN et ne peut pas être communiqué ou reproduit sans son autorisation.
This document is IRSN proprietary and shall not be disseminated outside the Institute without its prior approval
Figure 68: Effect of pre-oxidation developed between 350°C and 600°C upon a 5-minute oxidation at 1000°C or 1200°C
The samples to be used in transient tests [52] were pre-corroded in steam between 400°C and 800°C for times resulting in an initial oxide layer of about 30 µm. These samples were then subjected to a LOCA-type transient in steam for 3 minutes. This transient involved a temperature rise of 100°C/s up to 950°C, cooling at 25°C/s down to 750°C, then another rise of 5°C/s up to 1000°C, 1100°C or 1200°C, before being maintained at this temperature and then rapidly cooled at a rate of 60°C/s. Figure 69 shows the effects of various pre-oxidised thicknesses obtained between 400°C and 800°C upon the total mass gain following transient oxidation at 1000°C, 1100°C or 1200°C. Comparison is made with the mass gain on a sample that wasn’t pre-corroded.
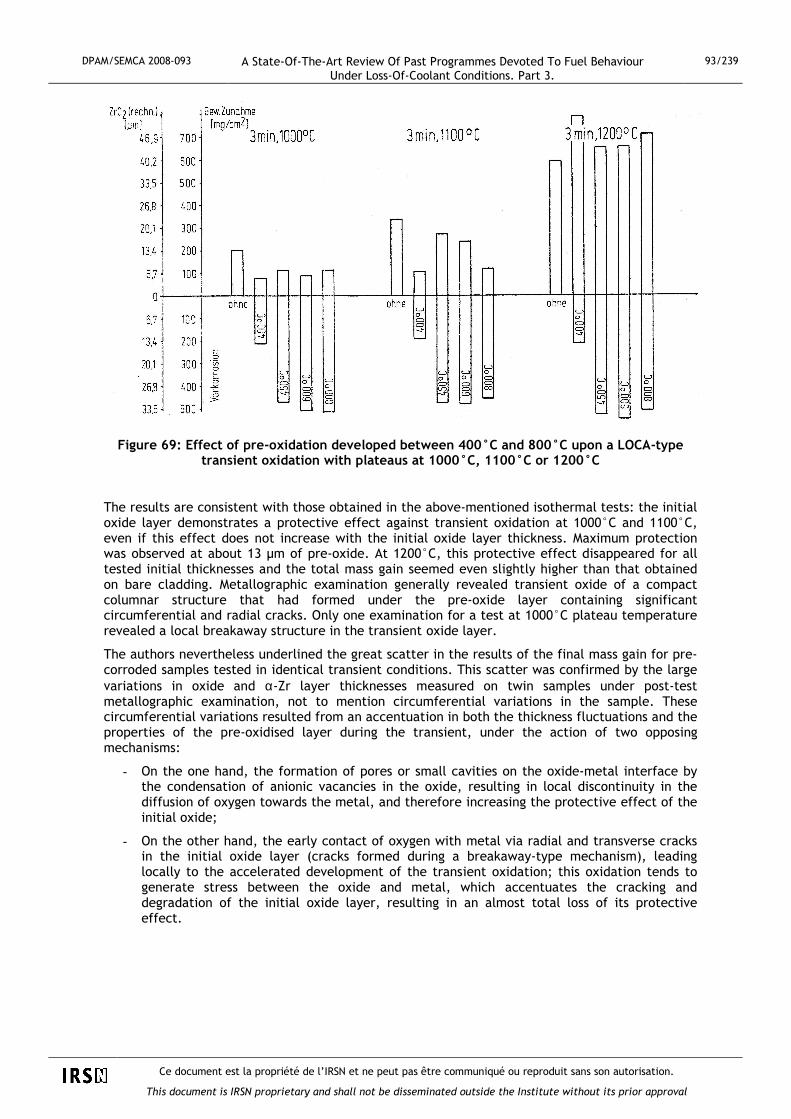
DPAM/SEMCA 2008-093 A State-Of-The-Art Review Of Past Programmes Devoted To Fuel Behaviour Under Loss-Of-Coolant Conditions. Part 3.
93/239
Ce document est la propriété de l’IRSN et ne peut pas être communiqué ou reproduit sans son autorisation.
This document is IRSN proprietary and shall not be disseminated outside the Institute without its prior approval
Figure 69: Effect of pre-oxidation developed between 400°C and 800°C upon a LOCA-type transient oxidation with plateaus at 1000°C, 1100°C or 1200°C
The results are consistent with those obtained in the above-mentioned isothermal tests: the initial oxide layer demonstrates a protective effect against transient oxidation at 1000°C and 1100°C, even if this effect does not increase with the initial oxide layer thickness. Maximum protection was observed at about 13 µm of pre-oxide. At 1200°C, this protective effect disappeared for all tested initial thicknesses and the total mass gain seemed even slightly higher than that obtained on bare cladding. Metallographic examination generally revealed transient oxide of a compact columnar structure that had formed under the pre-oxide layer containing significant circumferential and radial cracks. Only one examination for a test at 1000°C plateau temperature revealed a local breakaway structure in the transient oxide layer.
The authors nevertheless underlined the great scatter in the results of the final mass gain for pre-corroded samples tested in identical transient conditions. This scatter was confirmed by the large variations in oxide and α-Zr layer thicknesses measured on twin samples under post-test metallographic examination, not to mention circumferential variations in the sample. These circumferential variations resulted from an accentuation in both the thickness fluctuations and the properties of the pre-oxidised layer during the transient, under the action of two opposing mechanisms:
- On the one hand, the formation of pores or small cavities on the oxide-metal interface by the condensation of anionic vacancies in the oxide, resulting in local discontinuity in the diffusion of oxygen towards the metal, and therefore increasing the protective effect of the initial oxide;
- On the other hand, the early contact of oxygen with metal via radial and transverse cracks in the initial oxide layer (cracks formed during a breakaway-type mechanism), leading locally to the accelerated development of the transient oxidation; this oxidation tends to generate stress between the oxide and metal, which accentuates the cracking and degradation of the initial oxide layer, resulting in an almost total loss of its protective effect.

DPAM/SEMCA 2008-093 A State-Of-The-Art Review Of Past Programmes Devoted To Fuel Behaviour Under Loss-Of-Coolant Conditions. Part 3.
94/239
Ce document est la propriété de l’IRSN et ne peut pas être communiqué ou reproduit sans son autorisation.
This document is IRSN proprietary and shall not be disseminated outside the Institute without its prior approval
3.5 Effect of irradiation and/or initial hydrogen c ontent
3.5.1 TAGCIR tests
The results of the first TAGCIR tests revealed unexpected particularities, especially over-oxidation that proved to be sensitive in comparison to calculation estimates obtained with the PECLOX code that was developed by KfK [54] and adapted by IRSN to prepare and analyse the TAGCIS/TAGCIR tests. Table 12 summarises measured and calculated oxide and alpha-phase layer thicknesses on the outer surface for the first 4 TAGCIR tests.
Test No. Temperature plateau (°C)
Plateau time (s)
Measured oxide layer thickness (µm)
Calculated oxide layer thickness (µm)
Measured Zr-α layer thickness (µm)
Calculated Zr-α layer thickness (µm)
TR01 1200 410 85 70 105 92
TR02 1200 470 92 75 136 100
TR03 1100 1350 104 81 113 96
TR05 1200 470 105 75 152 100
Table 12: Comparison of measurements and calculations for the first 4 TAGCIR tests on irradiated cladding
Table 12 clearly shows the systematic difference in measurements by 20% to 40% in relation to calculation estimates for the oxide layer thicknesses. The azimuthal scatter of measurements also remained below 10 µm, i.e. within the measurement’s uncertainty. Three possible causes may have contributed to this over-oxidation:
1) Temperature drift in relation to the target value,
2) Intrinsic effect: acceleration in the oxidation kinetics of the irradiated Zircaloy,
3) System effect: thermal screen effect of the initial oxide layer.
A temperature drift in the facility was immediately suspected and then ruled out following a new series of verification tests performed on new standard cladding, which showed good agreement between measurements and calculations.
It was therefore assumed that the transient oxidation kinetics of irradiated Zircaloy experienced acceleration in comparison with the kinetics of as-received Zircaloy. This was confirmed by carrying out couples of twin tests under identical conditions: one on as-received cladding and the other on irradiated cladding. The oxide layer was removed by abrasion over 30 mm length of the irradiated cladding prior to testing so as to be free of any disruptive effect from this layer. The results of these tests showed an increase in the oxide layer thickness of 13% to 20% on the irradiated cladding in relation to the corresponding tests on as-received cladding, which incidentally showed good agreement between measurements and calculations by about 10 µm, i.e.: less than 7%.
An alternative or additional cause was also mentioned: a thermal screen effect of the initial oxide layer on the metallic layer subjected to energy deposition from induction heating. This cause was suggested due to the layered structure of this oxide layer revealed by metallographic examination during cladding characterisation prior to testing. The local over-oxidation resulting from the more or less accentuated decohesion of the initial oxide sub-layers is expected to vary significantly and be randomly located on samples, which makes it difficult to quantify the effect. This possible thermal screen effect raises the question of the offset between the metallographic examination plane and the pyrometer sighting plane. However, this offset remains low enough (9 mm) to allow us to assume that any associated temperature drift would also remain very low, considering axial thermal conduction in the metal.
As all the TAGCIR tests – on as-received and irradiated samples – were subjected to post-test metallographic examination to assess the layers thickness obtained at the end of the test, it is possible to compare these measurement results in relation to correlation estimates by distinguishing between each group of samples. Figure 70 shows measured outer oxide layer thicknesses in relation

DPAM/SEMCA 2008-093 A State-Of-The-Art Review Of Past Programmes Devoted To Fuel Behaviour Under Loss-Of-Coolant Conditions. Part 3.
95/239
Ce document est la propriété de l’IRSN et ne peut pas être communiqué ou reproduit sans son autorisation.
This document is IRSN proprietary and shall not be disseminated outside the Institute without its prior approval
to calculated thicknesses for all TAGCIR tests, by distinguishing between tests on as-received cladding and those on irradiated cladding. Calculations were based on the Urbanic/Heidrick correlation, using the target temperature as the surface temperature (emissivity = 1) and taking into account the temperature gradient in the transient oxide layer during growth.
Figure 70: Comparison of measured and calculated outer oxide layer thicknesses for TAGCIR tests on as-received and irradiated cladding
Though the tests on as-received cladding are more or less evenly scattered on either side of the bisecting line (or slightly below), it can be clearly seen that the tests on irradiated cladding are mostly located above this line, which reveals the apparent increase in their oxidation kinetics in comparison with the oxidation kinetics of as-received cladding. This difference does however remain limited, with a linear regression of the “irradiated” points providing a slope of 1.123 and thus an apparent kinetics increase of 12.3% regardless of the temperature. This result is in agreement with comparisons performed during the analysis of the first 6 TAGCIR tests.
It was this result that led to the development of the CODAZIR program, which in turn led to the final program HYDRAZIR.
3.5.2 Contribution of CODAZIR test results
The CODAZIR tests were isothermal oxidation tests at different temperatures between 1050°C and 1300°C during 470 seconds. They were performed on 3 types of samples: as-received samples, irradiated samples with the corrosion having been removed, and samples pre-hydrided at about 500 wppm.
With the implementation of the laser pyrometer in the TAGCIR test facility, the CODAZIR oxidation test results could be analysed either in terms of the apparent temperature (provided by the laser’s monochrome pyrometer function) or in terms of the temperature corrected to account for the surface emissivity, assumed to be the “true” temperature.
Figure 71 shows the weight gain per unit of surface area as a function of the apparent temperature (uncorrected temperature measured by the pyrolaser). No particular difference in behaviour can be observed between the as-received and hydrided samples, with only apparently weaker kinetics at high temperatures for irradiated samples.
TAGCIR tests
0
20
40
60
80
100
120
140
160
180
200
0 20 40 60 80 100 120 140 160 180 200
Calculated outer oxide thickness (µm)
Mea
sure
d ou
ter
oxid
e th
ickn
ess
(µm
)
as-received
irradiated

DPAM/SEMCA 2008-093 A State-Of-The-Art Review Of Past Programmes Devoted To Fuel Behaviour Under Loss-Of-Coolant Conditions. Part 3.
96/239
Ce document est la propriété de l’IRSN et ne peut pas être communiqué ou reproduit sans son autorisation.
This document is IRSN proprietary and shall not be disseminated outside the Institute without its prior approval
Figure 71: CODAZIR tests – Weight gain per unit of surface area as a function of the apparent temperature (temperature not corrected for surface emissivity)
Figure 72 shows the weight gain per unit of surface area as a function of the temperature taking into account the measured emissivity. This figure reveals the very distinct difference in behaviour between as-received and pre-hydrided samples, with the irradiated samples showing an intermediary behaviour.
Figure 72: CODAZIR tests – Weight gain per unit of surface area as a function of the true temperature (temperature corrected for surface emissivity)
5
10
15
20
25
1000 1050 1100 1150 1200 1250 1300 1350
Apparent temperature (°C)
Wei
ght g
ain
(mg/
cm2)
as-received
hydrided
irradiated
5
10
15
20
25
1050 1100 1150 1200 1250 1300 1350 1400 1450
True temperature (°C)
Wei
ght g
ain
(mg/
cm2)
as-received
hydrided
irradiated

DPAM/SEMCA 2008-093 A State-Of-The-Art Review Of Past Programmes Devoted To Fuel Behaviour Under Loss-Of-Coolant Conditions. Part 3.
97/239
Ce document est la propriété de l’IRSN et ne peut pas être communiqué ou reproduit sans son autorisation.
This document is IRSN proprietary and shall not be disseminated outside the Institute without its prior approval
On the basis of these results, the following conclusions were reached:
- Hydrogen is responsible for the increase in the oxidation kinetics apparently observed in the pre-hydrided samples;
- The intermediary behaviour of the irradiated samples with the corrosion layer being removed results from the random removal of the surface layer of metal containing hydrides formed during reactor irradiation. Moreover, in terms of the oxidation kinetics at high temperature, the irradiated material only differs from the as-received material by its hydrogen content, which confirms the generally-accepted idea that irradiation defects are annealed during the temperature transient, as well as during the α→β phase transformation.
Following this analysis, it was recommended that the tests on irradiated cladding be supplemented with tests on pre-hydrided unirradiated cladding, which would be easier to obtain and much easier to handle. This was the objective of the HYDRAZIR test program.
However, the qualification tests performed during the last program showed that analysis of the CODAZIR tests – as reported above – had been strongly challenged due to the fact that the surface specularity effect had been ignored. This effect notably affects as-received and irradiated samples with removed corrosion layer by giving them an unrealistic low apparent emissivity. The temperature correction resulting from these low emissivities shifts the test points towards higher temperatures (Figure 72), which differentiates them from tests on hydrided samples whose measured emissivities were higher.
The similar behaviours of as-received and irradiated samples with removed corrosion layer – and thus the different behaviour of the pre-hydrided unirradiated samples – may have been more so related to this effect than the effect of having removed part of the surface hydrides.
Ultimately, the CODAZIR results were not taken into account from a quantitative viewpoint. Qualitatively speaking, it was retained that the oxidation behaviour of the irradiated material mainly differed from that of the as-received material because of its initial hydrogen content; with this hydrogen content probably having an effect on the oxidation kinetics – an effect that was assessed in a more quantitative manner in the tests that followed on from HYDRAZIR series.
3.5.3 HYDRAZIR oxidation tests
The HYDRAZIR oxidation tests were performed between 1997 and 2000 in the facility used for the TAGCIR and CODAZIR tests. Three main test series were performed:
� 1997 series: 61 tests at 3 temperatures (1050°C, 1150°C and 1250°C) with 5 different hydrogen contents (0, 500, 1000, 2000 & 5000 wppm);
� 1999 series: 24 additional tests at 1150°C with 4 different hydrogen contents (0, 650, 2000 & 5000 wppm);
� 2000 series: 61 tests during which the kinetics were resumed completely at 1150°C with 5 different hydrogen contents (0, 500, 1000, 2000 & 5000 wppm) and with only two contents (0 & 500 wppm) at 1250°C; this series also included 28 additional oxidation tests at 1150°C and 1250°C on samples provided by ZIRCOTUBE, that were either as-received or pre-charged at 450 wppm.
3.5.3.1 Analysis of the 1997 test series
Preliminary analysis of the 1997 test results revealed an acceleration in the oxidation kinetics of Zircaloy hydrided at 500 wppm. This acceleration tended to disappear with hydriding of 1000 wppm or more. This acceleration is illustrated in Figure 73. It shows that the effect increases slightly with the temperature, with an increase in the linear regression slope ∆m = K√t in relation to the kinetics of as-received material from +8.5% at 1050°C to +22.6% at 1250°C. These values are only indicative of the three relevant temperature levels, with the real temperatures being within ± 20°C from the set temperature. Though uncertain owing to the limited number of tests by temperature and by H content (≤ 4), normalising the measured weight gains on the basis of these set temperatures would reduce the kinetic increases to(from ?) +5.3% at 1050°C to +20.3% at 1250°C.

DPAM/SEMCA 2008-093 A State-Of-The-Art Review Of Past Programmes Devoted To Fuel Behaviour Under Loss-Of-Coolant Conditions. Part 3.
98/239
Ce document est la propriété de l’IRSN et ne peut pas être communiqué ou reproduit sans son autorisation.
This document is IRSN proprietary and shall not be disseminated outside the Institute without its prior approval
Figure 73 also shows that the kinetics at 500 wppm of hydrogen remain below the Baker-Just correlation at all temperatures, which therefore retains its conservative nature.
Figure 73: HYDRAZIR tests – Oxidation kinetics of as-received and pre-hydrided cladding at 500 wppm (1997 test series)
Figure 74 compares the weight gain kinetics at 1200°C resulting from linear regressions on the results of tests with different hydrogen contents (all temperatures included). Again, this figure shows the acceleration in the kinetics (+10.7%) for 500 wppm of hydrogen. The kinetics with 1000 wppm of hydrogen are very similar to the kinetics of as-received material, and slightly lower with contents of 2000 wppm and 5000 wppm (-3% and –6% respectively). These rather low deviations at high hydrogen content do not seem significant considering the scatter in the results which increases with the hydrogen content.
Figure 74: HYDRAZIR tests – Oxidation kinetics of Zy-4 at 1200°C (1997 tests; linear regressions with contents between 0 and 5000 wppm H, all temperatures included)
0
5
10
15
20
25
30
0 10 20 30 40 50 60 70Time **0.5 (s**0.5)
Wei
ght g
ain
(mg/
cm2)
0 ppm H
500 ppm HBaker-Just
1050 °C
1150°C
1250°
0
5
10
15
20
25
30
35
0 10 20 30 40 50 60 70
T im e**0.5 (s**0 .5)
Wei
ght g
ain
(mg/
cm2)
0 ppm
500 p pm
1000 pp m
2000 pp m
5000 pp m
DPAM/SEMCA 2008-093 A State-Of-The-Art Review Of Past Programmes Devoted To Fuel Behaviour Under Loss-Of-Coolant Conditions. Part 3.
99/239
Ce document est la propriété de l’IRSN et ne peut pas être communiqué ou reproduit sans son autorisation.
This document is IRSN proprietary and shall not be disseminated outside the Institute without its prior approval
The results observed on TAGCIR irradiated/ as-received samples (see § 3.5.1) are in good agreement with the apparent increase in the oxide growth kinetics (+12.3% all temperatures included). They confirm the hypothesis that was expressed during analysis of the CODAZIR tests, based on the assumption that the hydrogen content has an effect on the oxidation kinetics. More specifically, it seemed that this effect would be limited to hydrogen contents less than 1000 wppm, thus at a level corresponding to the end-of-life in-reactor corrosion of Zircaloy-4 cladding.
3.5.3.2 Analysis of the 1999 test series
The results of tests performed in 1999 revealed a difference in the kinetics of as-received cladding in comparison with the kinetics inferred from the 1997 tests, reaching -17% on the regression slope ∆m = K√t at 1150°C.
Other than this difference in kinetics in relation to the 1997 tests, the results of the 1999 tests also revealed the specific kinetics of samples pre-hydrided at 5000 wppm, particularly revealing saturation for long oxidation times. When gas analysis (prior to the oxidation) of samples pre-hydrided at 5000 wppm indicated contents up to 4000 wppm of oxygen and 970 wppm of nitrogen, it was thought that such kinetic deviations may have resulted from parasitic pollution by oxygen and/or nitrogen during the pre-hydriding of samples.
Nitrogen pollution during hydrogen charging seemed to concern all the hydrided samples. Because of additional uncertainty due to an insulation problem with the solenoid in the HF furnace, it was deemed necessary to re-evaluate the kinetics for all the hydrogen contents (0 to 5000 wppm). This was done once the problems of parasitic nitrogen pollution and solenoid insulation had been solved. Re-evaluation was limited to only one temperature (1150°C) with the possibility of several additional points at 1250°C. This was the objective of the oxidation tests performed in 2000. The experimentalists at EDF/Chinon specifically evaluated the impact of parasitic nitrogen pollution, which led to the conclusion that nitrogen did not have any notable effect at hydrogen contents less than 500 wppm and even 1000 wppm weight. The artefact resulting from the parasitic nitrogen pollution in pre-hydrided samples in 1997 and 1999 was deemed negligible upon the corresponding test results, which can therefore be integrated into the database of results.
3.5.3.3 Global analysis of all oxidation tests
The results of the oxidation tests performed in 2000 confirmed the discrepancy in relation to the 1997 results that had already been remarked in the 1999 test results. After having eliminated any possible causes related to nitrogen pollution and azimuthal temperature heterogeneities owing to the HF solenoid insulation, the origin of this discrepancy still required clarification.
For this reason, it was decided to perform a global analysis of all the results, all test series included. A detailed presentation of these results is provided in the detailed review of the TAGCIS/TAGCIR/HYDRAZIR program [53].
By comparing the kinetics of as-received material from the 1997 tests at 1150°C with the kinetics of as-received material from the 1999/2000 series at the same temperature, a 17% decrease in the 1999/2000 series was remarked in relation to the 1997 series. For cladding hydrided at 500 wppm, the kinetics in the 2000 series once again indicated a 14.3% decrease in relation to the kinetics in the 1997 series. With 1000 wppm and 2000 wppm of hydrogen, the decrease was no longer systematic between the 1997 and the 1999 or 2000 kinetics, with the latter encompassing the 1997 kinetics. The 1997 kinetics were similar to the kinetics in one 2000 series at 5000 wppm, but scatter between the various 2000 series was pronounced (>48%). Figure 75 compares the different kinetics at various hydrogen contents (all test series included). The figure shows an acceleration in the kinetics which is limited to 13% for 500 wppm of hydrogen in comparison with the kinetics of as-received material. The variation is therefore located below the maximum variations observed between the 1999 and 2000 series for hydrogen contents of 2000 and 5000 wppm. It also appears that the Leistikow kinetics are located in the upper bound of the kinetics interval at a temperature of 1150°C, corresponding to 0 and 500 wppm of hydrogen.

DPAM/SEMCA 2008-093 A State-Of-The-Art Review Of Past Programmes Devoted To Fuel Behaviour Under Loss-Of-Coolant Conditions. Part 3.
100/239
Ce document est la propriété de l’IRSN et ne peut pas être communiqué ou reproduit sans son autorisation.
This document is IRSN proprietary and shall not be disseminated outside the Institute without its prior approval
Figure 75: HYDRAZIR tests – Oxidation kinetics at 1150°C (all series included) Hydrogen content = 0, 500, 1000, 2000 and 5000 wppm
At 1250°C, only tests on as-received material with 500 wppm of hydrogen were resumed in 2000. Figure 76 shows that the variations in the kinetics at 1250°C (all series included) between 0 and 500 wppm H has been reduced to 10.3% and these two kinetics perfectly bound those of Leistikow.
Figure 76: HYDRAZIR tests – Oxidation kinetics at 1250°C (all series included) Hydrogen content = 0 and 500 wppm
5
10
15
20
25
30
35
20 25 30 35 40 45 50 55 60 65 70 75 80 85
Time (s 1/2)
Sta
ndar
dise
d w
eigh
t gai
n (m
g/cm
2 )
Variation : 500 ppm/as-received = 1.132 1000 ppm/as-received = 1.104 2000 ppm/as-received =
LEISTIKOW
0 ppm
2000 ppm
5000 ppm
500 ppm
1000 ppm
y = 0.7099x
R2 = 0.9548
y = 0.7831x
R2 = 0.9127
5
10
15
20
25
30
35
15 20 25 30 35 40 45 50
Time (s 1/2)
Sta
ndar
dise
d w
eigh
t gai
n (m
g/cm
2)
Variation :500 ppm / 0 ppm = 1.103
LEISTIKOW
500 ppm
0 ppm

DPAM/SEMCA 2008-093 A State-Of-The-Art Review Of Past Programmes Devoted To Fuel Behaviour Under Loss-Of-Coolant Conditions. Part 3.
101/239
Ce document est la propriété de l’IRSN et ne peut pas être communiqué ou reproduit sans son autorisation.
This document is IRSN proprietary and shall not be disseminated outside the Institute without its prior approval
This global analysis led to the conclusion that though the effect of hydrogen on the oxidation kinetics cannot be entirely ruled out from the HYDRAZIR test results, it remains limited to a maximum of 10% to 13% for 500 wppm of hydrogen, and thus falls within the margin of uncertainty resulting from the experimental scatter of the different test series results.
3.5.4 Contribution of CINOG test results
The CINOG program was designed to characterise new M4 and M5 alloys developed by AREVA-NP under LOCA conditions. This program was similar to the HYDRAZIR program and also included oxidation kinetics test series and quench test series. Tests on Zircaloy-4 were performed to be used as a reference tests.
Oxidation tests were performed between 1050°C and 1400°C on as-received Zircaloy samples, and at 1200°C on samples pre-hydrided at 200 wppm and 450 wppm. ZIRCOTUBE ensured the hydrogen charging of these samples using a different procedure to that used by EDF for the HYDRAZIR samples. Furthermore, contrary to HYDRAZIR tests, the CINOG samples were not subject to surface preparation before testing; this treatment was not necessary owing to the absence of emissivity measurements in these tests.
Figure 77 provides the results of oxidation kinetic tests at 1200°C for CINOG samples pre-hydrided at 200 wppm and 450 wppm. These results are compared with the kinetics of as-received material from CINOG tests (solid line) and HYDRAZIR tests (dashed line) .
Figure 77: CINOG tests – Oxidation kinetics of Zy-4 at 1200°C As-received and pre-hydrided cladding at 200 and 450 wppm H
The kinetics inferred from the results of samples pre-hydrided at 200 wppm and 450 wppm were practically the same, but were 12% below the kinetics of as-received material (0 wppm) inferred from the CINOG tests. However, the kinetics of CINOG pre-hydrided cladding seemed very similar to the kinetics of as-received material in the HYDRAZIR tests (all series included). This agreement may be a coincidence but it may also correspond to the fact that HYDRAZIR kinetics were mainly based on tests between 1150°C and 1250°C, and therefore encompass the temperature of 1200°C used in CINOG pre-hydrided tests. CINOG tests on as-received material however included tests at 1400°C which shifted the Arrhenius correlation [Kp = A exp(-B/T)] into the high temperature range; excluding the data at 1400°C reduces the HYDRAZIR/CINOG difference to about 7%.
y = 0,6234x
y = 0,5507x
0
2
4
6
8
10
12
14
0 2 4 6 8 10 12 14 16 18 20
Time**0.5 (s**0.5)
Wei
ght g
ain
(mg/
cm2)
CINOG 200 ppm
CINOG 450 ppm
CINOG 0 ppm
HYDRAZIR 0 ppm

DPAM/SEMCA 2008-093 A State-Of-The-Art Review Of Past Programmes Devoted To Fuel Behaviour Under Loss-Of-Coolant Conditions. Part 3.
102/239
Ce document est la propriété de l’IRSN et ne peut pas être communiqué ou reproduit sans son autorisation.
This document is IRSN proprietary and shall not be disseminated outside the Institute without its prior approval
However that may be, Figure 77 does not show an acceleration in the oxidation kinetics for the samples pre-hydrided at 200 wppm and 450 wppm, contrary to what was observed in the HYDRAZIR tests for samples pre-hydrided at 500 wppm. This difference may be explained by the charging method or the state of the sample surface as a result of any pre-test preparation, i.e.: HYDRAZIR samples were systematically etched for good pyrometer laser measurements, whereas the CINOG samples were not. To clarify the origin of this difference in hydrogen effects, EDF performed a number of oxidation tests on Zircotube samples at 1150°C and 1250°C. These samples were either as-received or pre-hydrided at 450 wppm, with or without etching according to the EDF procedure. The results of these tests indicated that:
- At 1150°C, there was a significant discrepancy (∼+14%) between the kinetics of non etched as-received material and the kinetics of etched as-received material. Etching by either Zircotube or EDF produced practically identical kinetics; Zircotube samples with 450 wppm – etched or not – produced oxidation kinetics between the 2 previous kinetics for as-received etched and non etched material;
- At 1250°C, there was a deviation of about 5% between the kinetics of etched material and the kinetics of non etched material for samples with 450 wppm of hydrogen; the kinetics of etched material pre-hydrided at 450 wppm therefore seem very similar to those of etched as-received material.
It was therefore concluded that difference in kinetics between CINOG and HYDRAZIR test results were mainly due to differences in emissivities related to variations in the state of the sample surface. In the CINOG tests, when hydrogen does affect the oxidation kinetics, it remains low and masked by the experimental uncertainty associated with the surface state.
3.5.5 Information provided by foreign test program results
Complementary data were found in the results of oxidation tests performed as part of various foreign programs on pre-hydrided or irradiated Zircaloy which can provide information on the possible effect of hydrogen charging or irradiation upon the oxidation kinetics.
3.5.5.1 JAERI test results
Complex results were produced by tests performed by JAERI [55] on samples of Zircaloy-4 that were pre-hydrided at contents from 200 to 1600 wppm H, and then oxidised in steam at constant temperatures between 500°C and 1300°C. These results revealed non-monotonic variations in the weight gain ratio between hydrided and non-hydrided samples, as a function of the a) temperature, b) hydrogen content and c) exposure time. According to JAERI, the increasing or lowering effect of hydrogen on the kinetics is related to the structure of the Zr-H compound formed by hydrogen in solid solution in the Zr matrix: reduction in α phase, enhancement in β phase, with inversion corresponding to phases changes at T<1173 K. This dependence would be partially masked at higher temperatures (>1270 K) by the zirconia phase transformation, which is also probably influenced by the hydrogen content. In any case, the kinetic variations observed in the JAERI tests were small, limited to 10% in the most penalising combination of temperature, exposure time and hydrogen content.
The search for a parabolic correlation with the temperature dependence expressed as an Arrhenius law – for material hydrided at 1600 wppm – would result in a law almost identical to the law for as-received material. Though well-identified in the JAERI tests, the effect of hydrogen on the oxidation kinetics seems perfectly negligible.

DPAM/SEMCA 2008-093 A State-Of-The-Art Review Of Past Programmes Devoted To Fuel Behaviour Under Loss-Of-Coolant Conditions. Part 3.
103/239
Ce document est la propriété de l’IRSN et ne peut pas être communiqué ou reproduit sans son autorisation.
This document is IRSN proprietary and shall not be disseminated outside the Institute without its prior approval
3.5.5.2 ANL test results
Information was also obtained from the preliminary oxidation test results of a program currently underway at ANL [56], mainly performed on as-received and irradiated (BWR, Limerick, 57 GWd/tU) Zircaloy-2 samples and several Zircaloy-4 irradiated samples (PWR, TMI-1, 49 GWd/tU). These tests were carried out to support the preparation and interpretation of LOCA integral tests performed at ANL. These are one-sided oxidation tests on 25 mm long samples at temperature plateaus of 1000°C, 1100°C and 1200°C, followed by slow cooling at ∼5°C/s down to 800°C prior to final slow cooling. The oxidation rate – proportional to the weight gain per unit of surface – was obtained by a) directly measuring the sample’s weight before and after testing, b) measuring the oxygen content before and after testing, or c) calculating the quantity of oxygen in the different oxide, alpha and beta layers whose thicknesses were evaluated by metallographic examination of the midplane cross-section. The last method provided the most accurate results, with as-received material proving to be in very good agreement with Cathcart-Pawel model predictions. The preliminary analysis of tests at 1200°C indicated that the weight gain for irradiated Zircaloy-2 were ∼+9% higher than the average results for as-received samples. This difference - rather similar to differences between as-received HYDRAZIR samples and HYDRAZIR samples pre-hydrided at 500 wppm.- was considered by the authors to be insignificant of a kinetics change. It must however be mentioned that the hydrogen content of the irradiated samples used in the ANL tests was relatively low, considering the low level of corrosion: 70 wppm for BWR Limerick samples (10 µm oxide) and 150 wppm for PWR TMI-1 samples (30 µm oxide). This supports the idea that the difference between irradiated and as-received material observed in the ANL results is not significant of an irradiation effect and remains attributable to experimental uncertainties.
However, metallographic examinations of the irradiated samples revealed an irregular alpha-beta interface corresponding to a significant increase in the mean thickness of the alpha layer (∼+40% in relation to the Cathcart-Pawel estimate), as well as the presence of alpha inclusions in the beta layer. The ANL experimenters [57] attributed these variations to the diffusion of oxygen from the β phase towards the α phase during slow cooling from 1200°C to 800°C (differing from the ORNL tests by Cathcart-Pawel using faster cooling). It may also be thought that the difference in the ORNL tests with the ANL tests may be due to hydrogen absorption on the inner surface, which reduces the thickness of the alpha-Zr(O) phase; the inner surface was more leaktight in the ANL tests, therefore the hydrogen effect was lower. The impact of the Cathcart-underestimated formation of the fragile α phase may remain low in terms of weight gain, but be significant in terms of mechanical resistance to quench and post-quench ductility.
The ANL program also planned oxidation tests on irradiated Zry-4 PWR cladding samples (H.B. Robinson, ∼ 67 GWd/tU) with initial oxide thickness of 50 to 100 µm, corresponding to an initial hydrogen content up to 500 wppm.
3.5.5.3 Various results
In Reference [58], Ozawa et al. report the results of oxidation tests on Zircaloy-4 samples that were as-received, pre-hydrided, pre-hydrided & pre-oxidised and irradiated at 49 GWd/tU. The oxidation results between 1060°C and 1225°C did not reveal any difference between the kinetics of as-received material and those of hydrided material (420 wppm to 840 wppm H) as shown in Figure 78. The authors also came to the conclusion that hydrogen did not influence the oxidation kinetics. The irradiated samples with corrosion thicknesses < 56 µm and hydrogen contents estimated between 50 and 360 wppm produced oxidation kinetics that were similar to those of as-received material, or that were sometimes even below this for the most corroded samples (see Figure 79). This can be explained by the persistence of a residual protective effect of the initial oxide layer in these tests.

DPAM/SEMCA 2008-093 A State-Of-The-Art Review Of Past Programmes Devoted To Fuel Behaviour Under Loss-Of-Coolant Conditions. Part 3.
104/239
Ce document est la propriété de l’IRSN et ne peut pas être communiqué ou reproduit sans son autorisation.
This document is IRSN proprietary and shall not be disseminated outside the Institute without its prior approval
Figure 78: Time dependency of weight gain for unirradiated, hydrogen pre-charged cladding
Information on the oxidation of irradiated Zircaloy-2 is reported by Aomi et al. in Reference [59]. Various samples of BWR Zy-2 cladding, irradiated between 7 GWd/tU and 55 GWd/tU were oxidised in steam at temperatures from 1100°C to 1200°C. Mechanical compression tests at ambient temperature and hardness measurements were performed on samples after the oxidation tests. The results of the oxidation tests showed that there was practically no difference in weight gain, oxide thickness and alpha phases between as-received and irradiated samples. These authors had previously performed similar tests on unirradiated pre-hydrided samples which had not revealed any hydrogen effect on the oxidation kinetics. The results of the tests on irradiated materials enabled the same authors to the come to the conclusion that neither irradiation defects nor hydrogen pick-up significantly increased the oxidation kinetics under LOCA conditions.
In Reference [48], Moalem and Olander report the results of two tests in which a sample of Zircaloy-4 was first hydrided until saturation at 1100°C or 1200°C, before being oxidised in steam at the same temperature. The hydrogen contents were 29 at% at 1100°C and 20 at% at 1200°C, respectively equivalent to 4500 wppm and 2700 wppm. These results produced kinetic slopes (in ∆m = Kp t
1/2) of –6% and +3% respectively in relation to the kinetics at the same temperature on hydrogen-free samples. Considering the experimental uncertainty, the authors came to the conclusion that the hydrogen content did not affect the oxidation kinetics in steam.
3.5.6 Conclusions regarding the effects of irradiat ion and pre-hydriding
The comparison of results from different oxidation test programs focusing on Zircaloy samples that have been irradiated or pre-hydrided at an equivalent hydrogen content actually revealed that variations in the oxidation kinetics at high temperature cannot clearly be associated with a hydrogen content equivalent to the maximum pick-up found in fuel rod cladding at the end-of-life.

DPAM/SEMCA 2008-093 A State-Of-The-Art Review Of Past Programmes Devoted To Fuel Behaviour Under Loss-Of-Coolant Conditions. Part 3.
105/239
Ce document est la propriété de l’IRSN et ne peut pas être communiqué ou reproduit sans son autorisation.
This document is IRSN proprietary and shall not be disseminated outside the Institute without its prior approval
Figure 79: Time dependency of weight gain for irradiated cladding
Though it was not completely excluded in consideration of TAGCIR and HYDRAZIR tests results, the intrinsic effect of hydrogen has not been clearly explained insofar as the effect observed in HYDRAZIR tests was limited to low contents, whereas the effect of hydrogen on the oxidation microstructures developed at high temperature was obvious (see [53] § 6.3.3).
Therefore, the effect of hydrogen on the oxidation kinetics – if such an effect exists – is small (typically <15% on the slope ∆m = Kp t
1/2) and remains within the limits of experimental uncertainties for this type of test. On this subject, the differences between results from different programs would also require exploring the probable but unevaluated effect of secondary parameters, such as:
- Charging method: cathodic/ gaseous and related parameters (temperature, partial hydrogen pressure, etc.);
- State of sample surface, with surface preparation or not before charging and/or before oxidation.

DPAM/SEMCA 2008-093 A State-Of-The-Art Review Of Past Programmes Devoted To Fuel Behaviour Under Loss-Of-Coolant Conditions. Part 3.
106/239
Ce document est la propriété de l’IRSN et ne peut pas être communiqué ou reproduit sans son autorisation.
This document is IRSN proprietary and shall not be disseminated outside the Institute without its prior approval
3.6 Oxidation under limited steam supply – Effect o f hydrogen concentration in an oxidising atmosphere
In certain circumstances, more specifically beyond the conditions expected for a large-break LOCA, the steam flow can be considerably reduced and/or highly enriched in hydrogen formed during cladding oxidation at lower elevations. This can result in oxidation that is significantly different from that observed in unlimited steam conditions as in isothermal test conditions used in above-mentioned investigations. This is also the case for conditions obtained on the inner surface of burst cladding following a LOCA ballooning phase with steam ingress in the gap, which results in a stagnant atmosphere highly enriched in hydrogen near the opening.
Zircaloy oxidation in a limited steam flow, in stagnant steam, or in a gaseous flux of steam-hydrogen mixture has been occasionally observed during the course of some investigations or was specifically studied in a certain number of investigations, of which the results of some were controversial. The main contributions were provided by research in the 1980s by ANL and JAERI.
3.6.1 Abnormal oxidation and hydrogen absorption in tests by Chung and Kassner
In the ANL tests by Chung and Kassner [60], metallographic examination of the inner and outer layers revealed – in certain conditions – an abnormal oxide morphology of two distinct types:
• On the outer surface only: presence of a white porous sub-layer and nodules of variable thicknesses with radial cracks on a compact columnar oxide sub-layer; the Zr-α sub-layer thickness is reduced under the nodules;
• On the inner and outer surface: abnormally thick layer of porous oxide with circumferential cracks on a compact columnar sub-layer of oxide.
Abnormalities appear at temperatures below 1150°C (with a peak around 1000°C) and long oxidation times (longer than 1800 s), i.e.: typical breakaway conditions identified by Schanz [40].
The scanning electron microscopic (SEM) examination clearly shows the beginning of the oxide cracking process when the columnar sub-layer reaches 20 µm on the inner surface or 35 µm on the outer surface. The final laminated aspect is apparently the result of successive cyclic cracks in the columnar sub-layer: as oxidation progresses, its thickness reaches the indicated critical values.
The significant variations in the oxide morphology (compact and porous) and related thicknesses – occurring over small axial or azimuthal distances – seem to exclude the possibility of a direct cause related to temperature changes. Chung and Kassner suggested a stress effect to explain the appearance of a porous oxide. By testing empty tubes or tubes with different columns of alumina pellets in similar conditions, they observed a delay in the appearance of internal porous oxide in the empty tubes (therefore without pellets-cladding axial stress); however, the result is perhaps mainly related to the effect of hydrogen. In an empty tube, the critical H2/H2O ratio favouring the appearance of porous oxide (see § 3.6.4) takes longer to reach because the tube’s internal volume is bigger for the same quantity of hydrogen produced.
The respective roles of stress and hydrogen are therefore not clearly established in the ANL tests. However, Chung and Kassner results showed a relation between hydrogen absorption and the nature of the oxide on the inner surface of the oxidised cladding. Nine tubes having undergone an “integral” test (ballooning, burst, oxidation and quench) were cut into sections around TC locations. The hydrogen content CH and internal oxide thickness were measured for each section. The following was observed:
a) For short oxidation times at high temperature, the inner oxide layer – compact in nature – reaches a maximum thickness nearing rupture, which drops to zero ±50 mm on each side of the opening (see Figure 80); the absorbed hydrogen follows an inverse pattern: the minimum is reached at rupture and a maximum is reached on either side of the opening.

DPAM/SEMCA 2008-093 A State-Of-The-Art Review Of Past Programmes Devoted To Fuel Behaviour Under Loss-Of-Coolant Conditions. Part 3.
107/239
Ce document est la propriété de l’IRSN et ne peut pas être communiqué ou reproduit sans son autorisation.
This document is IRSN proprietary and shall not be disseminated outside the Institute without its prior approval
Figure 80: Hydrogen content and thickness of inner-surface oxide layer as a function of the axial distance along a Zircaloy tube oxidized in steam for 240 s at 1410-1580 K
b) For long oxidation times at moderate temperature (T<1350°K), a porous oxide is formed, except in the immediate vicinity of the rupture, and the hydrogen uptake is practically proportional to the oxide thickness (see Figure 81). The minimum oxide layer at the rupture is related to the minimum temperature, resulting from the heating method.
Figure 81: Temperature, hydrogen content and average thickness of inner-surface
oxide layer as a function of axial distance from the rupture location of a Zircaloy tube oxidized in steam for 10.5 ks at 1120-1250 K

DPAM/SEMCA 2008-093 A State-Of-The-Art Review Of Past Programmes Devoted To Fuel Behaviour Under Loss-Of-Coolant Conditions. Part 3.
108/239
Ce document est la propriété de l’IRSN et ne peut pas être communiqué ou reproduit sans son autorisation.
This document is IRSN proprietary and shall not be disseminated outside the Institute without its prior approval
The appearance of a porous internal oxide layer is therefore related to hydrogen absorption and occurs in confined areas where the gaseous H2/H2O mixture is favourable. This result will be confirmed in the JAERI tests by Furuta et al. (see § 3.6.4) where the detrimental effects related to axial temperature heterogeneities do not occur, which were found in the ANL tests.
Lastly, the hydrogen content in the areas of maximum absorption range from about 500 to 1000 ppm; further on in this document (see § 4.7.3), it can be seen that this uptake level may significantly decrease the post-quench mechanical resistance of Zircaloy.
In the Chung and Kassner tests, hydrogen absorption is a phenomenon associated with oxidation but which mainly seems to result from internal oxidation in a steam-depleted stagnant atmosphere.
3.6.2 Tests by Chung and Thomas (ANL)
Later on, Chung and Tomas performed a series of oxidation tests in a mixture of hydrogen + steam or helium + steam at temperatures between 1200°C and 1700°C – beyond the LOCA temperature range – to investigate the Zircaloy oxidation in a depleted steam atmosphere under severe accidents conditions.
In a series of preliminary tests [61], a 153 mm long Zircaloy-4 tube heated by direct Joule effect was oxidised at 1375°C or 1500°C in a reaction chamber in flowing mixtures of hydrogen and steam with a constant partial pressure of steam of 8 kPa and a relative partial pressure of hydrogen (pH2/ptot) ranging between 0 and 1. For tests of the same duration, the results showed a clear decrease in the oxide thickness for a relative partial pressure of hydrogen > ∼ 0.5 (see Figure 82). Based on the assumption that the steam and hydrogen flows are well-mixed before entering the reaction vessel and that the resulting flow is turbulent, the authors assumed that the steam concentration gradient was negligible and that the reaction was not restricted by a gaseous diffusion process within the mixture. They suggested that the oxidation rate limitation resulted from a process occurring on the tube surface due to the high partial pressure of hydrogen, thereby reducing the chemisorption and dissociation of water molecules on the oxide surface, as well as the desorption of recombined hydrogen. It should be stressed that the strong reduction in oxidation rate observed as early as pH2/ptot >0.5 must be put in perspective with the low steam pressure level (8 kPa): a shift towards relative pH2/ptot pressures that are closer to 1 can be expected for higher steam pressures.
Figure 82: Oxide-layer thickness after oxidation of Zircaloy-4 for 200 s at 1500°C and a constant steam pressure of 8 kPa as a function of partial hydrogen pressure

DPAM/SEMCA 2008-093 A State-Of-The-Art Review Of Past Programmes Devoted To Fuel Behaviour Under Loss-Of-Coolant Conditions. Part 3.
109/239
Ce document est la propriété de l’IRSN et ne peut pas être communiqué ou reproduit sans son autorisation.
This document is IRSN proprietary and shall not be disseminated outside the Institute without its prior approval
In a subsequent publication [62], the same authors reported slightly different tests on a 90 mm long Zircaloy-4 tube that was partially opened at its upper end. This sample was oxidised in the previously-mentioned facility but this time in a practically stagnant helium atmosphere at 33 kPa or helium with a small quantity of steam for a total pressure of 33.4 kPa at 20°C. In terms of oxide thickness growth, the following results were observed:
a) For short oxidation times with the lowest steam supply rates, linear kinetics were observed in a H2+H2O atmosphere as well as in a He+H2O atmosphere (but with a greater oxidation rate than in a H2+H2O atmosphere); for slightly higher steam supply rates , the kinetics remained linear in a H2+H2O atmosphere but became parabolic again in He+H2O;
b) For longer oxidation times, parabolic kinetics were observed, with the rate always smaller in a hydrogen + steam atmosphere than in pure steam or helium + steam; the difference being even more pronounced at the lowest steam supply rates and at the highest temperatures.
These observations led the authors to believe that if the reaction could be limited by a gaseous steam diffusion process in the mixture during the early stages of oxidation, an additional process was also occurring in the presence of hydrogen, considering the very similar diffusivities of steam in both mixtures. This process would explain the weaker parabolic growth rate at oxidation times that are sufficiently long enough for the kinetics to be once again determined by the solid-phase diffusion of oxygen.
The authors suggested that this process was related to the absorption of hydrogen in the oxide layer: the H+ ions dissolved in the oxide either by insertion or substitution would produce an increase in the oxygen vacancy concentration primarily near the oxide-gas interface, thereby reducing the vacancy gradient in the oxide layer, and therefore the oxygen diffusion towards the metal and the resulting oxidation rate. This hypothesis is supported by analysis of oxygen and hydrogen contents performed on oxide powders obtained from the surface skin of samples oxidised at 1705°C in a H2+H2O mixture of various contents. The results – illustrated in Figure 83 – show an increase in the hydrogen content and a corresponding drop in the oxygen content for decreasing steam supply rate, which produces an oxide skin composition similar to ZrOH for the test with the lowest steam content. The crystal structure corresponding to this composition would explain the variation in the oxide growth rate in the mixtures with low steam contents.
Figure 83: Hydrogen and oxygen contents of the fine powders obtained from the surface skin of the oxide formed during oxidation at 1705°C for ∼∼∼∼ 120 s in various hydrogen-steam mixtures (with constant H overpressure ∼∼∼∼ 33 kPa at 20°C)

DPAM/SEMCA 2008-093 A State-Of-The-Art Review Of Past Programmes Devoted To Fuel Behaviour Under Loss-Of-Coolant Conditions. Part 3.
110/239
Ce document est la propriété de l’IRSN et ne peut pas être communiqué ou reproduit sans son autorisation.
This document is IRSN proprietary and shall not be disseminated outside the Institute without its prior approval
Nevertheless, this test series did not make it possible to reliably quantify the effect of hydrogen upon the oxidation kinetics owing to the specific experimental conditions. The stagnant atmosphere in a large volume around the vertically-positioned sample rendered the local characteristics of the hydrogen + steam mixture uncertain and variable in natural circulation near the sample surface. Furthermore, the results were no longer parameterised with relative partial pressure as was the case for the previous series, but with the steam flow entering the vessel before oxidation and the resulting mole fraction was not specified. In a subsequent test series, the same authors performed oxidation in a flowing mixture of hydrogen + steam at hydrogen mole fractions between 0.71 and 0.94. Figure 84 gives the ratio of the oxide growth rate obtained in a hydrogen + steam mixture to that obtained in pure steam as a function of the temperature (only temperatures > 1500°C). The results of this last test series support the results of the previous series and the corresponding explanation suggested by the authors.
Figure 84: Ratio of parabolic oxide layer growth rate constant obtained in flowing hydrogen-steam mixtures to that obtained in an unlimited flux of pure steam as a function of Zircaloy-4 temperature and average hydrogen mol fraction in the inlet mixtures. Hydrogen input to the shrouded reaction channel was 0.446 mol/min and steam flow was varied 0.5 – 3.2 g/mn
3.6.3 Tests by Uetsuka (KfK)
The presence of a blanketing effect in relation to hydrogen absorption and as suggested by Chung and Thomas was contradicted by the test results obtained by Uetsuka at KfK [63], on Zircaloy-4 samples oxidised at 1000°C and 1300°C in a limited steam flow with reduced mass velocity until starvation was obtained.
The test facility used was the same as that used for the Leistikow and Schanz tests reported in § 3.1.7. Samples of 30 mm long rings were oxidised in a resistance oven inside a tubular quartz chamber with flowing steam at a constant mass velocity ranging between 3 and 170 mg/cm2/min. The temperature was measured by a TC welded to the inner surface; the extent of the reaction was determined by measuring the weight gain and the oxide thickness by metallographic examination. A selection of tests was subject to post-test oxygen and hydrogen analysis, performed on the top-end and bottom-end of each sample.

DPAM/SEMCA 2008-093 A State-Of-The-Art Review Of Past Programmes Devoted To Fuel Behaviour Under Loss-Of-Coolant Conditions. Part 3.
111/239
Ce document est la propriété de l’IRSN et ne peut pas être communiqué ou reproduit sans son autorisation.
This document is IRSN proprietary and shall not be disseminated outside the Institute without its prior approval
Several interesting observations were drawn from the results of these tests:
- The steam starvation effect (reduction in the kinetics owing to the lack of steam) only occurs at very low mass flow rates: 13 and 20 mg/cm2/min at 1000°C and 1300°C respectively, which corresponds to a velocity of about 13 mm/s at 1000°C.
- Figure 85 provides the weight gains for oxidations at 1000°C between 2 and 60 minutes for three different steam supply rates. It shows that the parabolic behaviour persists up to 60 min for the highest flow rate (40 mg/cm2/min) greater than the starvation limit. For the intermediate flow rate close to the starvation limit, the kinetics appeared parabolic in the beginning, before increasing towards linear kinetics around 15 minutes. For the lowest supply rate (3.2 mg/cm2/min), the weight gain – significantly below the values obtained without starvation for a 2 minute oxidation – rapidly increased with the oxidation time to reach that obtained at 60 minutes with the highest flow rate. Metallographic examination of the samples oxidised for 60 minutes revealed the presence of a breakaway structure in all 3 cases, with the oxide being more porous and thick, the lower supply rate. The corresponding hydrogen absorption was consistent with this observation: with measured contents of 2300, 1400 and 410 ppm after 60 minutes of oxidation for respective flow rates of 3.2, 12.7 and 40.7 mg/cm2/min. The author concluded that the incubation time of the breakaway process can be reduced under a limited steam supply.
Figure 85: Mass increase as a function of the oxidation time in steam at different supply rates
(2 ∼∼∼∼ 60 mn, 1000°C)
- For oxidations at 1300°C, Figure 86 gives the weight gain for the 15 minutes tests as a function of the steam supply rate. The figure shows the rapid reduction for supply rates below the starvation limit and also reveals a small peak (∼ +15 at 18%) for supply rates between 20 and 60 mg/cm2/min. For Test No.150 for 15 minutes at 1300°C with a supply rate of 29 mg/cm2/min, the weight gain was used to establish that the fraction of consumed steam was about 50% and the VH2/VH2O ratio downstream of the sample was equal to 1.03; hydrogen contents up to 1300 ppm were determined by post-test analysis in this sample. A correlation therefore clearly exists between absorbed hydrogen content and the hydrogen-steam volume ratio in the gaseous flux flowing through the sample. This result is qualitatively consistent with the results of the specific oxidation tests under a hydrogen + steam mixture performed at JAERI by Furuta et al., and provided below.

DPAM/SEMCA 2008-093 A State-Of-The-Art Review Of Past Programmes Devoted To Fuel Behaviour Under Loss-Of-Coolant Conditions. Part 3.
112/239
Ce document est la propriété de l’IRSN et ne peut pas être communiqué ou reproduit sans son autorisation.
This document is IRSN proprietary and shall not be disseminated outside the Institute without its prior approval
Figure 86: Correlation between weight gain of specimen and steam supply rate to the cross-sectional area of reaction tube
- At 1300°C for supply rates slightly higher than the starvation limit (∼20 mg/cm2/min), the VH2/(VH2O +VH2) volume fraction is about 0.6, which corresponds to the value of the reduction in the oxidation rate observed in the Chung and Thomas tests. The fact that the oxidation rate in the Uetsuka tests was higher than the oxidation rate in unrestricted steam led the author to conclude that the hydrogen blanketing effect was not confirmed by these tests. The reduction in the oxidation rate at very low supply rates can therefore be fully explained by the lack of steam (starvation).

DPAM/SEMCA 2008-093 A State-Of-The-Art Review Of Past Programmes Devoted To Fuel Behaviour Under Loss-Of-Coolant Conditions. Part 3.
113/239
Ce document est la propriété de l’IRSN et ne peut pas être communiqué ou reproduit sans son autorisation.
This document is IRSN proprietary and shall not be disseminated outside the Institute without its prior approval
3.6.4 Tests by Furuta and Kawasaki (JAERI)
From all the studies performed at JAERI devoted to the behaviour of Zircaloy-4 cladding in LOCA conditions (see § 4.7), a specific series of analytical tests was designed to quantify 1) the effect of hydrogen in a steam + hydrogen mixture upon oxidation between 950°C and 1100°C and 2) the ductility of samples oxidised in a gaseous flux of various compositions [64].
Figure 87 shows the typical effect of the VH2/VH2O volume fraction in the mixture upon the weight gain of samples oxidised at given temperatures and times: the weight gain fluctuates at a critical fraction fc between 0.3 to 0.5, the fluctuation being even more pronounced the lower the gaseous flow rate.
Figure 87: Variation in the weight gain of a Zircaloy-4 tube oxidised in a steam-hydrogen
mixture for 1200 s at 1323 K
Figure 88 shows the variations in the weight gain W as a function of the fraction VH2/VH2O, parameterised according to the oxidation time and temperature. It can be seen that W remains constant for f below the critical fraction fc, it fluctuates during the transition to fc, and then drops slightly beyond this point.
For T ≥ 1273°K, a drop in the critical fraction fc can be seen when the temperature increases; this drop may be related to the intrinsic production of hydrogen, which increases with T and which therefore increases the local fraction f when the gaseous flow is not too high. At T=1223°K (950°C), the fluctuation on W is hardly visible but seems to occur at an f value that is less than that corresponding to T=1273°K; this could be explained by the variations in the oxidation kinetics (therefore the process) occurring at T<1000°C (see § 3.1.3).

DPAM/SEMCA 2008-093 A State-Of-The-Art Review Of Past Programmes Devoted To Fuel Behaviour Under Loss-Of-Coolant Conditions. Part 3.
114/239
Ce document est la propriété de l’IRSN et ne peut pas être communiqué ou reproduit sans son autorisation.
This document is IRSN proprietary and shall not be disseminated outside the Institute without its prior approval
Figure 88: Variation in the total weight gain of the oxidised specimen with
hydrogen volume fraction in a steam-hydrogen mixture
The effect upon hydrogen absorption in the sample is illustrated in Figure 89. It can be seen that this absorption is practically non-existent below the critical fraction, before suddenly increasing when f reaches fc, possibly reaching several thousands of mass ppm.
Figure 89: Hydrogen content absorbed by a specimen oxidised in a steam-hydrogen mixture
Hydrogen volume fraction in a steam-hydrogen mixture (VH/VH20)

DPAM/SEMCA 2008-093 A State-Of-The-Art Review Of Past Programmes Devoted To Fuel Behaviour Under Loss-Of-Coolant Conditions. Part 3.
115/239
Ce document est la propriété de l’IRSN et ne peut pas être communiqué ou reproduit sans son autorisation.
This document is IRSN proprietary and shall not be disseminated outside the Institute without its prior approval
Furthermore, the post-test metallographic examinations on samples, supplemented by X-ray diffraction analysis, made it possible to reveal a structural change in the oxide when the volume fraction f exceeds the critical fraction: when f<fc, the oxide is dense and mainly composed of monoclinic ZrO2, however when f>fc, the oxide is porous and composed of a mixture of monoclinic and tetragonal phases. Oxidation in a gaseous hydrogen + steam mixture at the critical fraction fc would therefore favour the formation of tetragonal oxide.
Figure 90 briefly summarises the observations made for this test series. Three simultaneous phenomena occur when the hydrogen volume fraction in the gaseous mixture exceeds the critical fraction:
• Drop in weight gain W, • Considerable hydrogen absorption in Zircaloy, • Formation of porous oxide.
Figure 90: Effect of hydrogen volume fraction on oxidation behaviour of specimens
oxidised at 1273 K for 600 s in a steam-hydrogen mixture
Based on past physical data, the authors recommended several relationships describing the physical processes governing the appearance of these phenomena:
• A tetragonal-phase oxide is formed at the interface with the metal, which transforms to monoclinic phase as the oxidation progresses; the tetragonal oxide is metastable below 1000°C but can be stabilised at low temperature by the presence of hydrogen in the oxidising atmosphere and under the action of compressive stresses at the metal-oxide interface.
• The transport of hydrogen through a dense, crack-free oxide layer is assumed to be governed by a hydrogen atom diffusion process in the anionic oxygen vacancies of zirconia. Cracks that may occur in the oxide layer act as short-circuits for diffusion, thus enabling faster hydrogen charging of the inner metallic substrate. The tetragonal oxide – in comparison with dense monoclinic oxide – has a high defect structure, and the pores and cracks representing these defects offer just as many short-circuits for diffusion.
�

DPAM/SEMCA 2008-093 A State-Of-The-Art Review Of Past Programmes Devoted To Fuel Behaviour Under Loss-Of-Coolant Conditions. Part 3.
116/239
Ce document est la propriété de l’IRSN et ne peut pas être communiqué ou reproduit sans son autorisation.
This document is IRSN proprietary and shall not be disseminated outside the Institute without its prior approval
• Hydrogen and oxygen compete to diffuse into the inner Zr-β layers. Hydrogen diffuses faster and seems to delay the diffusion of oxygen ions in Zircaloy, which finally results in a smaller weight gain than in the case of oxygen diffusion only.
3.6.5 Tests by Uetsuka and Otomo (JAERI)
Within the scope of Zircaloy oxidation studies in severe accident conditions, isothermal oxidation tests in a steam-argon mixture were performed a little later at JAERI by Uetsuka and Otomo [65].
In these tests, plate-like specimens prepared from PWR Ziraloy-4 cladding tubes were oxidised in an infrared furnace at temperatures between 1000°C and 1490°C in a flux of steam + argon mixture at steam mole fractions between 0.2% and 30%. The temperature was measured by a Pt-Pt/13%Rh TC welded to the sample at its midpoint. After testing, the weight gain was measured and metallographic examination was performed for each test; a hydrogen analysis and X-ray diffraction analysis of the oxide layer were also performed on a selection of tests.
The results of these tests revealed the following main points:
- At a given temperature and time, the weight gain – and thus the oxidation rate – increases with the steam mole fraction f of the mixture from very low f values up to a critical fc value beyond which the weight gain remains constant (see Figure 91). The values of this critical fraction – beyond which the dilution effect is no longer sensitive – are low: from 1.3% to 5.3% for oxidations of 900 seconds at 1000°C and 1400°C respectively.
Figure 91: Mass increase of Zircaloy-4 isothermally oxidised in steam/argon
mixtures as a function of f(H2O)
- For a steam mole fraction of 30% or, generally speaking, for a mole fraction greater than the
critical fraction for the tested conditions, the oxidation kinetics at temperatures between 1000°C and 1490°C do not differ from those inferred from tests in unlimited supply of pure steam.
- For a given temperature, the critical mole fraction of steam decreases with the oxidation time; for long oxidation times, the quantity of steam required for unlimited oxidation decreases and then quickly exceeds the corresponding quantity in diluted steam at low mole fractions: for example, at 1100°C with a steam mole fraction of 0.6%, oxidation is limited up to about 3600 seconds but returns to unlimited supply parabolic kinetics beyond 3600 seconds.
- Hydrogen absorption in the samples appears at low fsteam mole fractions, with the presence of a peak for a specific time, which is followed by a decrease in relation to time (see Figure 92).

DPAM/SEMCA 2008-093 A State-Of-The-Art Review Of Past Programmes Devoted To Fuel Behaviour Under Loss-Of-Coolant Conditions. Part 3.
117/239
Ce document est la propriété de l’IRSN et ne peut pas être communiqué ou reproduit sans son autorisation.
This document is IRSN proprietary and shall not be disseminated outside the Institute without its prior approval
Figure 92: Correlation between absorbed hydrogen content of Zircaloy-4 oxidised at
1100°C and oxidation time for 4 different steam molar fraction f(H2O)
By referring to the results of tests by Furuta and Kawasaki described in the previous paragraph, the authors explain that the generation of hydrogen (owing to the oxidation reaction) near the sample surface, combined with a low steam fraction in the steam + argon mixture, can result in VH2 /VH2O ratios favouring hydrogen absorption as shown in the tests in a controlled steam + hydrogen mixture. The authors also suggest that the decrease in the hydrogen content at long oxidation times after the peak may be related to the reduction in the thickness of the metallic phase where hydrogen is absorbed, since the hydrogen contents measured in these tests are relative to the total mass of the oxidised sample (metal + oxide). In terms of hydrogen absorption, though the results of these tests in a steam + argon mixture cannot be directly related to the results of tests in a steam + hydrogen mixture as performed by Furuta owing to a lack of knowledge of the gaseous atmosphere conditions on the sample surface, the results of these two series do remain qualitatively consistent.
3.6.6 Tests by Prater and Courtright
In research by Prater and Courtright (see § 3.1.9), oxidation tests in a hydrogen + steam atmosphere at different hydrogen contents (between 0 and 95% mole) were also performed at 1565°C and 1815°C. In these tests, a constant steam mass flow rate was chosen to avoid starvation and the hydrogen flow rate was adapted to obtain the desired content. Figure 93 shows that at 1565°C, the kinetics were not affected by any of the various dilutions (0-95% mole H2).

DPAM/SEMCA 2008-093 A State-Of-The-Art Review Of Past Programmes Devoted To Fuel Behaviour Under Loss-Of-Coolant Conditions. Part 3.
118/239
Ce document est la propriété de l’IRSN et ne peut pas être communiqué ou reproduit sans son autorisation.
This document is IRSN proprietary and shall not be disseminated outside the Institute without its prior approval
Figure 93: Effect of hydrogen on oxidation kinetics. Zircaloy was oxidised
(a) at 1565°C for 2 s and (b) at 1817°C for 40 s in various steam-hydrogen mixtures
In the figure 93 (b), a sudden reduction in oxidation can be observed at 1817°C for a concentration CH2 > 92%; a dilution in helium shows a similar trend for CHe > 91%, which seems to suggest that the oxidation reduction is not related to the nature of the diluent but due to the restriction of steam available on the sample surface. Even though the steam mass flow rate was kept constant for different dilutions, the high hydrogen flow rate required for concentrations > 90% reduces the steam mass transfer from the bulk mixture to the wall, which becomes the limiting factor of the oxidation reaction.
3.6.7 Tests by Moalem and Olander
Last of all, in research by Moalem and Olander (see § 3.1.10 above), several exploratory tests – 4 tests at 1200°C – were performed in a mixture of steam + hydrogen (50% to 91% mole H2) or steam + helium (90% mole He). The results of these tests showed that the dilution of steam up to the tested values does not change the parabolic oxidation kinetics; however, the fast absorption of hydrogen (exothermic) in the initial phase accentuated the transient temperature excursion, which resulted in increased oxidation in comparison with an equivalent test in pure steam or steam + helium.

DPAM/SEMCA 2008-093 A State-Of-The-Art Review Of Past Programmes Devoted To Fuel Behaviour Under Loss-Of-Coolant Conditions. Part 3.
119/239
Ce document est la propriété de l’IRSN et ne peut pas être communiqué ou reproduit sans son autorisation.
This document is IRSN proprietary and shall not be disseminated outside the Institute without its prior approval
3.6.8 Conclusion: oxidation under restricted steam flow and diluted steam atmosphere
The results of the different investigations described in this document make it possible to establish the following main conclusions:
- Dilution of steam in a mixture (steam + hydrogen or steam + neutral gas) only reduces the oxidation kinetics at high dilutions, typically at steam mole fractions less than 10%. Therefore, this reduction mainly appears as a result of a limited quantity of steam on the sample’s surface during both the gaseous diffusion from the bulk mixture towards the wall and the processes of chemisorption and dissociation of the water molecules on the wall.
- The presence of a significant quantity of hydrogen in the oxidising atmosphere does not result in a blanketing effect specific to hydrogen to reduce the oxidation kinetics for a lower mole fraction than in the case of a neutral gas. However, a fraction of hydrogen close to VH2/VH2O ∼ 0.3 to 0.5 leads to a fluctuation in the oxidation process, which in turn results in the significant absorption of hydrogen in the sample, associated with the appearance of a porous oxide composed of a mixture of monoclinic and tetragonal phases. It seems this process could be explained by a stabilisation of the faulty tetragonal phase in the presence of hydrogen.

DPAM/SEMCA 2008-093 A State-Of-The-Art Review Of Past Programmes Devoted To Fuel Behaviour Under Loss-Of-Coolant Conditions. Part 3.
120/239
Ce document est la propriété de l’IRSN et ne peut pas être communiqué ou reproduit sans son autorisation.
This document is IRSN proprietary and shall not be disseminated outside the Institute without its prior approval
3.7 Oxidation at high pressure
Oxidation of Zircaloy or the cladding material at high pressure general involves conditions that may occur in a small-break LOCA or even during accidental high-pressure transients without break, such as an anticipated transient without scram (ATWS) in BWRs.
In comparison to the many comprehensive investigations that have been devoted to Zircaloy oxidation at high temperature in steam at atmospheric pressure, oxidation at higher pressure has only been investigated over the past three decades. The main available results were recently reviewed by G. Hache [33].
A study by B. Cox published in 1973 [66] on the oxidation of Zircaloy-2 in stagnant steam between 350°C and 600°C at pressures up to 34 MPa (5000 psi) showed a significant increase in the oxidation rate at 500°C and 600°C for pressures greater than 34 bar. Porosity measurements in the oxide layers showed that porosities developed faster at high pressure, which led the author to suggest that the acceleration in the oxidation was related to the changes in the oxide’s morphology.
3.7.1 Tests by Pawel et al.
In the following ORNL tests at atmospheric pressure discussed in § 3.1.4, Pawel et al. performed oxidation tests on Zircaloy-4 at 900°C and 1100°C in flowing steam at pressures ranging from 34.5 to 103.4 bar (500 to 1500 psi) [67].
These tests were performed in the SuperZWOK facility illustrated in Figure 94.
Figure 94: Schematic drawing of the apparatus used for high-pressure oxidation studies
The sample was a length of PWR Zircaloy-4 cladding tube which was surrounded by a quartz tube to channel the steam generated in the lower boiler. This sample was heated by a quad-elliptical

DPAM/SEMCA 2008-093 A State-Of-The-Art Review Of Past Programmes Devoted To Fuel Behaviour Under Loss-Of-Coolant Conditions. Part 3.
121/239
Ce document est la propriété de l’IRSN et ne peut pas être communiqué ou reproduit sans son autorisation.
This document is IRSN proprietary and shall not be disseminated outside the Institute without its prior approval
radiant heating furnace that was contained within the reaction chamber. A pressurised argon atmosphere was maintained inside the tube, with the argon entering through the sample support tube and mixing with the steam flux at the outlet. Two TC ((Pt/Pt-10%Rh) were welded to the internal surface at mid-height of the tube’s heated length (∼ 25 cm): one TC was used to control the furnace temperature by regulating the power supply, and the other was used to measure the test temperature. Owing to the greater exchanges by convection at the highest pressures, it proved harder to control the temperature than at low pressures. Nevertheless, variations in relation to the set temperature were limited by ± 5 to 10°C in most tests, which was deemed very satisfactory. The progression of the oxidation reaction was determined for oxide and α-Zr[O] thicknesses measured by post-test metallographic examination of a cross-section at the elevation with the TC beads. As was the case for the tests performed at atmospheric pressure, the weight gain was assessed based on these thicknesses (see § 3.1.4.1). To simplify comparison with the results of tests at atmospheric pressure, the effective isothermal oxidation times were normalised for temperatures of 905°C and 1101°C, as shown in § 3.1.4.1.
Results
Figure 95 compares oxide thicknesses at 1101°C, 34.5 bar, 69 bar and at atmospheric pressure. This figure does not reveal any significant effect of pressure upon the oxidation kinetics at this temperature, at least for the given pressures and test times. This tendency also applies to alpha phase thicknesses.
At 905°C, this tendency is more difficult to assess. Figure 96 once again compares oxide thicknesses at 34.5 bar, 69 bar, and at atmospheric pressure. This figure shows various results at 34.5 bar that are similar or even below results obtained at Patm, but with however a major tendency towards an increase in oxidation. This increase can be observed in all tests at 69 bar. The figure also reveals slower kinetics for pressures up to 69 bar than the kinetics observed in tests performed at high temperature and at atmospheric pressure.
Figure 95: Oxide layer growth during oxidation of Zircaloy-4 PWR tubing at 1101°C in steam at 3.45 MPa and at atmospheric pressure. Solid line represents data for oxidation at atmospheric pressure
Figure 96: Oxide layer growth during oxidation of Zircaloy-4 PWR tubing at 905°C in steam at high pressures and at atmospheric pressure. Solid line represents data for oxidation at atmospheric pressure. Dashed line represents parabolic kinetics extrapolated from high-temperature data
❏ ❏
❏
❏
❏
❏
❏

DPAM/SEMCA 2008-093 A State-Of-The-Art Review Of Past Programmes Devoted To Fuel Behaviour Under Loss-Of-Coolant Conditions. Part 3.
122/239
Ce document est la propriété de l’IRSN et ne peut pas être communiqué ou reproduit sans son autorisation.
This document is IRSN proprietary and shall not be disseminated outside the Institute without its prior approval
Figure 97 summarises the results obtained at 905°C for all tested pressures. It reveals the existence of a steam pressure effect upon the oxidation kinetics, which results in an increase in the oxide growth rate with increasing pressure.
Figure 97: Linear plot of oxide layer growth during oxidation of Sandvik Zircaloy-4 PWR tubing at 905°C in steam at various pressures
Discussion
The observation of a pressure effect upon the oxidation kinetics at 900°C but not at 1100°C raised a number of questions with the authors, who tried to find an acceptable explanation. Based on the suggestion by Cox concerning the morphological changes in the oxide, they observed a bright sub-layer on the outer surface of samples subject to the pressure effect during microscopic examination under polarized light. This sub-layer was not found on samples oxidized at 1) atmospheric pressure, 2) 1100°C, or 3) 900°C at 34 bar without kinetic increases. However, the relative thickness of this sub-layer – when detected – increased with pressure in tests at 900°C.
The authors therefore examined several explanations in an attempt to tie this observation to the increase in the oxidation kinetics at high pressure:
a) The tetragonal → monoclinic phase transition of zirconia occurring below 1000°C may be influenced by the pressure. The partial transformation around 900-950°C of tetragonal zirconia into monoclinic zirconia (in which oxygen diffuses at a slower rate) had already been suggested as a possible explanation for the slowing down from parabolic to cubic kinetics observed at these temperatures. Stabilisation of the tetragonal form at 900°C under the action of pressure could therefore lead to an increase in the kinetics. However, this increase would be limited by the full stabilisation of the tetragonal phase, and oxidation at this temperature would not exceed the extrapolation of the parabolic kinetics deduced from high temperature tests where the tetragonal phase only exists. Figures 96 and 97 show that though the points at 69 bar and t <700 s are located more or less on the extrapolation of the parabolic kinetics, the points plotted
DPAM/SEMCA 2008-093 A State-Of-The-Art Review Of Past Programmes Devoted To Fuel Behaviour Under Loss-Of-Coolant Conditions. Part 3.
123/239
Ce document est la propriété de l’IRSN et ne peut pas être communiqué ou reproduit sans son autorisation.
This document is IRSN proprietary and shall not be disseminated outside the Institute without its prior approval
at 103 bar are found well above: stabilisation of the tetragonal zirconia alone can not explain the observed increase in the kinetics.
b) The pressure effect may also appear due to its impact on the occurrence of a “breakaway” process, which may be suggested by the low reproducibility of the tests at 905°C and 34.5 bar. However, when compared to the "classical breakaway” process described by Leistokow et al. (see § 3.1.7), the oxidation rate here remains a decreasing function of time, even at 103 bar. The authors nevertheless observed that the dark inner sub-layer of oxide in tests at high pressure showed a growth rate that was independent from the pressure and slightly less than that for oxide growth at atmospheric pressure. They suggested the possibility of a partial “breakaway” process with continuous growth of the compact layer.
c) Lastly, the authors explain the observation of the bright oxide sub-layer by the presence of micro-cracks developed at the grain boundaries that reflect light beneath the polished surface of the sample. However, the presence of these micro-cracks could not be directly confirmed by SEM examinations. The presence of these micro-cracks would certainly lead to an increase in the oxidation kinetics. The effect of pressure upon the formation of these cracks was not understood, but it was suggested that disappearance of the pressure effect at 1100°C could be explained by an improved relaxation of stresses resulting in a structural defect repair process in the oxide.
3.7.2 Tests by Bramwell et al.
Several years after Pawel, Bramwell et al. (AEA Technology) published the results of oxidation tests on Zircaloy-4 in steam between 750°C and 1000°C at different pressures up to 186 bar [68].
The test facility – rather similar to that used for ORNL tests – was composed of two interconnected, heated vessels; one vessel was used as a steam generator to supply the upper vessel where the sample was oxidised. The tested sample was a Zy-4 tube heated by direct electrical heating and equipped with two TCs welded to the outer surface. One TC was for measuring the temperature and controlling the heating power, while the other was used for safety reasons in the event the control TC became unstuck from the wall. Once again, the progression of the oxidation reaction was determined for oxide and α-Zr[O] thicknesses measured by standard post-test metallographic examination on a cross-section at the elevation of the measurement TC.
The Zircaloy-4 cladding in these tests was from the same batch as that used for previous tests performed at atmospheric pressure (the same tests for which the resulting oxidation model was used to compare the results of tests at high pressure).
Results
The test matrix involved 23 tests at temperatures between 750 and 1000°C, distributed as follows: - 1 test at 750°C, 117 bar,
- 6 tests at 800°C (1 to 117 bar, 3 to 152 bar, 2 to 186 bar), - 13 tests at 900°C (2 to 2 bar, 3 to 69 bar, 3 to 117 bar, 4 to 152 bar, 1 to 186 bar), - 3 tests at 1000°C (2 to 69 bar, 1 to 152 bar)
Figure 98 compares the results of tests at 800°C with the AEA model predictions at atmospheric pressure and the corresponding results by Leistikow et al. at atmospheric pressure [39]. An increase by a factor of 3 to 5 in oxide thickness at high pressure can be observed in relation to the AEA model predictions at atmospheric pressure. However, the results do not significantly differ between tests at 117 bar and 186 bar, which seem to indicate a saturation of the pressure effect at this temperature for those pressure levels.

DPAM/SEMCA 2008-093 A State-Of-The-Art Review Of Past Programmes Devoted To Fuel Behaviour Under Loss-Of-Coolant Conditions. Part 3.
124/239
Ce document est la propriété de l’IRSN et ne peut pas être communiqué ou reproduit sans son autorisation.
This document is IRSN proprietary and shall not be disseminated outside the Institute without its prior approval
Figure 98: Oxide thickness as a function of test pressure at 800°C
Two control tests were performed at low pressure (2 bar) and at 900°C to check that the effects observed at 800°C were not a result of artefacts in the experimental procedure. These tests – dubbed “atmospheric pressure” – are shown in Figure 99, which compares the results of tests at high pressure at 900°C using the AEA model and the KfK results at atmospheric pressure. This figure also shows the tendencies resulting from the corresponding Pawel tests discussed in the previous section. The two “atmospheric pressure” tests fall well within the AEA model prediction range. It can also be seen that oxidations at 69 bar correspond well with the Pawel results for test times shorter than 1500 s. At 2500 s however, oxidation is clearly above the Pawel extrapolation at 69 bar, which could indicate a transition from cubic kinetics towards “breakaway” oxidation. At 117 bar and above, the increase in oxidation in relation to the atmospheric pressure is greater than that observed at 69 bar, but more scatter in the data than at 800°C. Oxide thicknesses around 100 µm appeared in two tests and indicate the occurrence of a breakaway process.
At 1000°C, the two tests at 69 bar show oxidation that is similar to that at atmospheric pressure, whereas the test at 152 bar shows an enhancement factor of 2.1 in relation to oxidation at Patm. This suggests a distinct decrease in the pressure effect for temperatures ≥ 1000°C, which is in agreement with the observation of the absence of effect at 1100°C in the Pawel tests.

DPAM/SEMCA 2008-093 A State-Of-The-Art Review Of Past Programmes Devoted To Fuel Behaviour Under Loss-Of-Coolant Conditions. Part 3.
125/239
Ce document est la propriété de l’IRSN et ne peut pas être communiqué ou reproduit sans son autorisation.
This document is IRSN proprietary and shall not be disseminated outside the Institute without its prior approval
Figure 99: Oxide thickness as a function of test pressure at 900°C
Discussion
As for the ORNL tests by Pawel, examination of the metallographic cross section using polarised light revealed two types of structures in the oxide formed during the various tests at high pressure:
- A compact, uniform structure for tests at 750°C and 800°C, as well as for the test at 900°C and 69 bar lasting 240 s;
- A non-uniform layered structure with different sub-layers including one uniform, bright outer sub-layer for the other tests.
In comparison to the Pawel tests, the presence of the bright sub-layer here is not directly related to an acceleration in the kinetics, seeing that the tests at 800°C (with an acceleration factor between 3 and 5) do not reveal such a bright band in the oxide under polarized light. Furthermore, for tests with this bright sub-layer, it was not possible to correlate its thickness with the oxidation enhancement factor or, with the pressure in contrast to the ORNL tests .
Despite good agreement with the Pawel tests at 900°C and 69 bar up to around 1500 s, the Bramwell tests reveal the occurrence of breakaway phenomena, without it being possible to identify the possible threshold in terms of time or oxide thickness. The authors concluded that insufficient results made it impossible to clearly identify the phenomenon responsible for the acceleration in the oxidation rate at high pressure, and therefore a reliable prediction model could not be produced.

DPAM/SEMCA 2008-093 A State-Of-The-Art Review Of Past Programmes Devoted To Fuel Behaviour Under Loss-Of-Coolant Conditions. Part 3.
126/239
Ce document est la propriété de l’IRSN et ne peut pas être communiqué ou reproduit sans son autorisation.
This document is IRSN proprietary and shall not be disseminated outside the Institute without its prior approval
3.7.3 Tests by Park et al.
In a more recent publication, Park et al. gave the results of oxidation tests on Zircaloy-4 between 700°C and 900°C in steam or a mixture of steam and argon at pressures between 1 and 150 bar [69].
Figure 100 illustrates the facility used for these tests. Steam is produced in an outer vessel heated at 400°C by evaporation of a given quantity of water. A volume of argon can also be mixed with steam to study the effect of partial steam pressure in relation to the total pressure. Oxidation occurred in a stagnant atmosphere. The sample consisted of a 15 mm length of PWR Zircaloy-4 tubing horizontally supported by the TC, which was inserted into the sample via a hole at the bottom, used to measure the internal temperature. It was heated by a resistance heater in an inner vessel contained inside the outer vessel. After testing the extent of oxidation was determined by measuring the oxide thickness by metallographic examination.
Figure 100: Experimental set-up for the measurement of high temperature oxidation of Zircaloy-4 under high pressure steam
Results
A first series of tests made it possible to specify the effect of partial steam pressure in relation to the total pressure. Oxidation tests lasting 1000 s and 1500 s at 750°C were performed in pure steam at 1 bar, 75 bar or 150 bar and in steam + argon mixtures at 5+70 or 5+95 bar partial pressures respectively. In these cases, the oxidation state was determined by measuring the weight gain. Figure 101 compares the results of these tests and clearly shows that oxidations under a partial pressure of steam of 5 bar – despite a total pressure of 75 or 100 bar – remain similar to oxidations in steam at atmospheric pressure. This made it possible to conclude that the steam pressure is the decisive parameter for oxidation kinetics.
Figure 101: Comparison between oxides formed at 750°C in different steam partial pressures.

DPAM/SEMCA 2008-093 A State-Of-The-Art Review Of Past Programmes Devoted To Fuel Behaviour Under Loss-Of-Coolant Conditions. Part 3.
127/239
Ce document est la propriété de l’IRSN et ne peut pas être communiqué ou reproduit sans son autorisation.
This document is IRSN proprietary and shall not be disseminated outside the Institute without its prior approval
Figure 102 summarises the results of oxidation tests lasting 1500 s at various temperatures between 700°C and 900°C and at steam pressures between 1 bar and 150 bar. The continuous oxide growth with pressure can be observed, but a pressure threshold governing the kinetic increase could not be detected. The pressure effect seems more pronounced at ∼ 750-800°C, as more clearly illustrated in Figure 103 which compares oxide growths as a function of time between 700 and 900°C for steam pressures of 50 or 100 bar.
Figure 102: Measured oxide thickness of Zry-4 oxidized 1500 s at different steam pressures
Figure 103 Oxide growth rate at different
steam pressures
The authors also studied the effect of an initial oxide layer formed in steam at 500°C upon subsequent oxidation at 750-850°C at high pressure. The results showed a protective effect of this initial oxide layer, thus reducing oxidation at high pressure by 40% to 60% of the value corresponding to a bare sample, but without any significant difference between the effects of an initial thickness of 20 or 50 µm.
Based on their test results, the authors finally recommended an empirical correlation for Zircaloy-4 oxidation between 700°C and 900°C for steam pressures between 1 and 150 bar. Figure 104 compares the performance of this model with the experimental results. It shows good prediction at the highest temperatures (850-900°C), as well as a tendency to overestimate at lower temperatures (< 800°C) for the shortest oxidation times (500 s).
Figure 104: Comparison of suggested model
to the measured data

DPAM/SEMCA 2008-093 A State-Of-The-Art Review Of Past Programmes Devoted To Fuel Behaviour Under Loss-Of-Coolant Conditions. Part 3.
128/239
Ce document est la propriété de l’IRSN et ne peut pas être communiqué ou reproduit sans son autorisation.
This document is IRSN proprietary and shall not be disseminated outside the Institute without its prior approval
Discussion
Park et al. observed that the pressure effect upon the oxidation kinetics is maximum around 750-800°C, which corresponds to the temperatures where the highest acceleration in kinetics occurs owing to the breakaway effect as noted in the Leistikow et al. tests (Figure 45, § 3.1.7). The latter explained the breakaway process by the cyclic repetition of physical phenomena associated with the tetragonal to monoclinic transformation of zirconia following a certain incubation time. Park suggested that the pressure effect on the oxidation kinetics could also be related to the zirconia phase transformation, insofar as this transformation is favoured by the steam pressure. On the basis of comparative oxidation tests in steam and in oxygen, which showed a much higher proportion of tetragonal oxide for oxidations in oxygen, Garzarolli [70] suggested that the presence of hydrogen in steam could accelerate the tetragonal to monoclinic transformation. This hypothesis is however contradictory with the proposal from Furuta and Kawasaki to explain the results of tests in hydrogen + steam atmospheres (see § 3.6.4). It may rather be concluded that the presence of steam accelerates the zirconia transformation in relation to tests in oxygen (see Japanese test references in [33]), while the free hydrogen on the contrary forms a faulty structure with tetragonal + monoclinic mixture as demonstrated by Furuta and Kawasaki.
During the transformation, the monoclinic phase (with a higher molar volume than the tetragonal phase) induces tensile stress in the newly generated protective sub-layer, thereby resulting in the formation of micro-cracks that will lead to an increase in the oxidation. This explanation is consistent with the observation concerning the effect of steam partial pressure, not the total pressure. This explanation is also confirmed by the comparison of the surfaces of samples oxidised for 1500 s in high pressure steam or argon + steam mixture: large cracks appear in the sample oxidised in 75 bar steam, whereas no cracks was found in the sample oxidised under the same total pressure with low steam pressure (5 bar)..
Last of all, Park compared the model prediction deduced from tests at high pressure with the Baker-Just correlation for oxidations of 1500 s at temperatures between 700°C and 900°C. This comparison showed that the Baker-Just prediction was exceeded in all cases when the pressure was ≥ 50 bar. The conclusion reached from this comparison of the non-conservatism of Baker-Just equation for oxidation at high steam pressure must however be qualified owing to the fact that the Baker-Just correlation was not validated below 1000°C and had already been proved to underestimate in the range of cubic oxidation (see Figure 28, § 3.1.1).
3.7.4 Tests by Vrtilkova et al.
In the tests by Vrtilkova et al., samples of Zr1%Nb (E110) and Zircaloy-4 were tested comparatively in oxidations between 600°C and 900°C under high pressure up to 100 bar [71].
Two 3 cm long samples of both alloys were simultaneously oxidised in a stagnant atmosphere of steam or steam + argon inside a pressurised vessel placed in a resistance furnace. The temperature was measured using a TC located near the samples. The extent of the oxidation was determined by measuring the weight gain. The oxidation kinetics at the different temperatures was mainly studied with a steam pressure of 40 bar. The effect of the steam pressure was especially studied between 750°C and 850°C.
The results concerning Zircaloy-4 only will be discussed very briefly hereafter.
Examination of the weight gain for oxidation times of 1 hour in steam at 40 bar and at different temperatures between 600°C and 900°C revealed oxidation rates that were higher by a factor of 1.4 to 2.4 in comparison to the Leistikow results at atmospheric pressure [39]. The variation in relation to the oxidation time in steam at high pressure was similar to that observed at atmospheric pressure over the entire temperature interval of the tests performed.
Figure 105 shows the variations in the weight gain as a function of pressure for a given oxidation time at 750°C and 850°C. It shows a distinct and practically linear increase with pressure at 750°C, but a small variation at 850°C. This result at 850°C differs from that obtained in the Park tests at the same temperature, which still showed a significant increase in the oxide thickness with (pressure, even though a little smaller than that at 750°C (see Figure 102). Generally speaking, the Vrtilkova results remain consistent with those obtained by Park and both investigations in stagnant atmosphere also remain in good agreement with the two previous investigations in flowing steam.

DPAM/SEMCA 2008-093 A State-Of-The-Art Review Of Past Programmes Devoted To Fuel Behaviour Under Loss-Of-Coolant Conditions. Part 3.
129/239
Ce document est la propriété de l’IRSN et ne peut pas être communiqué ou reproduit sans son autorisation.
This document is IRSN proprietary and shall not be disseminated outside the Institute without its prior approval
a) 750°C; 0.5 hour
b) 850°C; 0.5 hour
Figure 105: Influence of steam pressure on the weight gain of Zr-alloys at 750 and 850°C after 0.5 h

DPAM/SEMCA 2008-093 A State-Of-The-Art Review Of Past Programmes Devoted To Fuel Behaviour Under Loss-Of-Coolant Conditions. Part 3.
130/239
Ce document est la propriété de l’IRSN et ne peut pas être communiqué ou reproduit sans son autorisation.
This document is IRSN proprietary and shall not be disseminated outside the Institute without its prior approval
3.7.5 Conclusions on oxidation at high pressure
The four experimental investigations discussed in the previous paragraphs have provided a consistent series of results revealing the accelerating effect of pressure upon the oxidation kinetics in steam at temperatures between 750°C and 1000°C.
The kinetic increase is associated with the partial pressure of steam and not the total pressure. It seems that this kinetic increase can be related to the appearance of cracks and porosities in the outer oxide layer, connected to the tetragonal to monoclinic transformation of zirconia, which may be favoured by the steam pressure. The physical phenomenon responsible for this accelerating effect at high steam pressure remains to be clarified.
In the 35-50 bar interval, (the possible pressure range covered during a small-break LOCA), the kinetic enhancement factor remains moderate (∼ <2) and the pressure effect should not induce any additional safety problems for fresh Zircaloy-4 cladding. However, it must be checked that hydrogen absorption (only one measurement at low oxidation ratio in the Pawel tests) does not occur, and complementary tests for residual ductility (ring compression tests) should be performed if hydrogen is present (see Chapter 4). At higher pressure (>120 bar), the enhancement factor is more pronounced (∼ 3 à 5), with a relative maximum around 750-800°C, which could make a question when trying to correctly assess oxidation in certain types of accident transients at high pressure (ATWS, etc.).
Based on Figure 105, which shows a very high enhancement in the oxidation kinetics at 850°C and pressures above 20 bar for certain Zr1%Nb alloys (greater than the Baker-Just kinetics at 1204°C), complementary tests on the M5 alloy with induction heating has been launched in France (CINOG test programme). It would be important to check these tests by performing tests with furnace heating, seeing that induction heating may disrupt abnormal oxidation phenomena [60].
Last of all, it is worth pointing out that the available oxidation results at high pressure only concern tests on fresh or non-hydrided material. Taking into account the suggested role of hydrogen in the zirconia phase transformation, as well as the effects observed in the TAGCIR and HYDRAZIR oxidation tests (see § 3.5.1 and 3.5.3), the behaviour of irradiated material during oxidation at high pressure remains to be fully examined. Tests on fresh pre-hydrided material - HYDRAZIR or CINOG type tests – should be performed, followed by verification tests on irradiated cladding. Furthermore, considering the role of the inner oxide layer formed during irradiation in relation with hydrogen absorption near the balloon opening observed on rod IE-19 in the PBF/IE-5 test, it would be important to perform tests involving both ballooning and oxidation at high pressure on irradiated cladding – possibly after having removed the pellets – while keeping the inner oxide layer intact. Such tests should only be carried out under furnace heating, as induction heating is disrupted by ballooning and bursting; the furnace tests mentioned in the previous paragraph would contribute to the development of such tests.
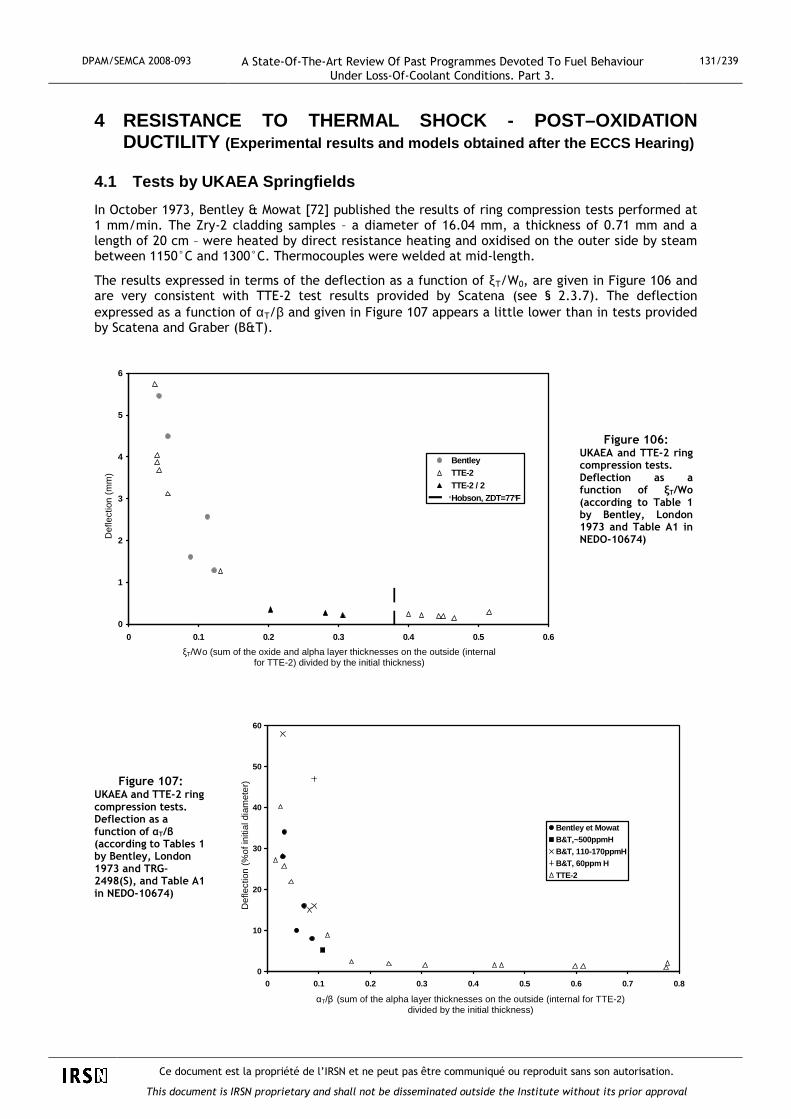
DPAM/SEMCA 2008-093 A State-Of-The-Art Review Of Past Programmes Devoted To Fuel Behaviour Under Loss-Of-Coolant Conditions. Part 3.
131/239
Ce document est la propriété de l’IRSN et ne peut pas être communiqué ou reproduit sans son autorisation.
This document is IRSN proprietary and shall not be disseminated outside the Institute without its prior approval
4 RESISTANCE TO THERMAL SHOCK - POST–OXIDATION DUCTILITY (Experimental results and models obtained after the ECCS Hearing)
4.1 Tests by UKAEA Springfields
In October 1973, Bentley & Mowat [72] published the results of ring compression tests performed at 1 mm/min. The Zry-2 cladding samples – a diameter of 16.04 mm, a thickness of 0.71 mm and a length of 20 cm – were heated by direct resistance heating and oxidised on the outer side by steam between 1150°C and 1300°C. Thermocouples were welded at mid-length.
The results expressed in terms of the deflection as a function of ξT/W0, are given in Figure 106 and are very consistent with TTE-2 test results provided by Scatena (see § 2.3.7). The deflection expressed as a function of αT/β and given in Figure 107 appears a little lower than in tests provided by Scatena and Graber (B&T).
Figure 106: UKAEA and TTE-2 ring compression tests. Deflection as a function of ξT/Wo (according to Table 1 by Bentley, London 1973 and Table A1 in NEDO-10674)
Figure 107: UKAEA and TTE-2 ring compression tests. Deflection as a function of αT/β (according to Tables 1 by Bentley, London 1973 and TRG-2498(S), and Table A1 in NEDO-10674)
0
10
20
30
40
50
60
0 0.1 0.2 0.3 0.4 0.5 0.6 0.7 0.8
ααααΤΤΤΤ/ββββ (quotient de la somme des épaisseurs des couches a lpha, externes(et interne pour TTE-2), par l'épaisseur initiale)
Déf
lexi
on (
% d
u di
amèt
re in
itial
)
Bentley et MowatB&T,~500ppmH B&T, 110-170ppmHB&T, 60ppm HTTE-2
0
1
2
3
4
5
6
0 0.1 0.2 0.3 0.4 0.5 0.6
ξT / Wo (quotient de la somme des épaisseurs des couc hes oxyde et alpha, externes(et interne pour TTE-2), par l'épaisseur initiale)
Déf
lexi
on (
mm
)
BentleyTTE-2TTE-2 / 2Hobson, ZDT=77°F
ξT/Wo (sum of the oxide and alpha layer thicknesses on the outside (internal for TTE-2) divided by the initial thickness)
Def
lect
ion
(mm
)
αT/β (sum of the alpha layer thicknesses on the outside (internal for TTE-2) divided by the initial thickness)
Def
lect
ion
(%of
initi
al d
iam
eter
)

DPAM/SEMCA 2008-093 A State-Of-The-Art Review Of Past Programmes Devoted To Fuel Behaviour Under Loss-Of-Coolant Conditions. Part 3.
132/239
Ce document est la propriété de l’IRSN et ne peut pas être communiqué ou reproduit sans son autorisation.
This document is IRSN proprietary and shall not be disseminated outside the Institute without its prior approval
An explanation can be found in a report completed several months later by Bentley & Trowse [73]. This report showed that hydrogen was absorbed, as in the Cathcart-Pawel tests (see § 3.1.4.2) and in the one-sided TAGCIS tests (see [53]) owing to a probably imperfect leaktightness: 450-510 ppm for samples oxidised at 1235°C for 3 minutes and already 170 ppm for 0.71 mm thick samples oxidised at 1180°C for 3 minutes. Tests were also performed with 0.42 mm thick cladding. For the same α/β value, the oxidation time was shorter and the ductility was greater (the shorter oxidation time leaves less time for hydrogen to be absorbed). Bentley & Trowse could have revealed this hydrogen effect upon ductility before Chung & Kassner (see § 4.5) and JAERI (see § 4.7) but they merely retained the cladding thickness effect.
4.2 Pawel criterion (ORNL)
In 1974 and several months after Hobson, Pawel published a document [10] based on the Hobson & Rittenhouse tests and containing distribution calculations of oxygen in Zr-β, which had already been mentioned by Hobson. Pawel specified the characteristics of these calculations:
- Diffusion in a finite medium from a moving interface [74];
- Interface displacement (therefore the remaining Zr-β thickness) was obtained based on a parabolic law:
ξ = δ √t
where, contrary to Hobson & Rittenhouse, δ is correlated according to the Arrhenius law:
δ = A exp [-B/T]
- The oxygen diffusion coefficient Dβ in Zr-β and the boundary condition on oxygen concentration at the interface Cβ/α were taken from literature.
Figure 108 provides the mean concentrations in the beta layer as function of √t for the range of temperatures used in the Hobson tests; the 19 experimental results chosen for these calculations are also shown in this figure, including information on the response to the slow compression test at ambient temperature and on the observation of alpha incursions.
Resuming the conclusions by Hobson, Pawel suggested an embrittlement criterion focusing on the concentration Cβ of oxygen in Zr-β with two limits:
� Cβ ≤ 95% of saturation,
� Cβ ≤0.7% in mass.
As shown in Figure 108, the concentration remains below 0.7wt.% for temperatures less than 1260°C, and the saturation limit therefore applies. At higher temperatures, the limit of 0.7 wt.% applies.

DPAM/SEMCA 2008-093 A State-Of-The-Art Review Of Past Programmes Devoted To Fuel Behaviour Under Loss-Of-Coolant Conditions. Part 3.
133/239
Ce document est la propriété de l’IRSN et ne peut pas être communiqué ou reproduit sans son autorisation.
This document is IRSN proprietary and shall not be disseminated outside the Institute without its prior approval
Figure 108: Average oxygen concentration in remaining ββββ-Zircaloy as a function of time. (Two-sided isothermal reaction of 0.0686 cm specimen in steam. The data points correspond to the time-temperature histories of the Hobson & Rittenhouse specimens set and are coded to reflect their observations on α-incursions and room temperature ductility).
It must be pointed out that the saturation concentration of oxygen in Zr-β varies continuously for a transient with considerable temperature variations, which makes it impossible to apply the Pawel criterion as formulated above.
4.3 Embrittlement tests and Sawatzky criterion (AEC L, Whiteshell)
In 1978, Sawatzky [75] published the results of tensile mechanical tests on oxidised samples of Zircaloy cladding from CANDU reactors. These 10 mm long samples taken from tubes with an outer diameter of 15.2 mm, a thickness of 0.43 mm (or 0.71 mm in a few tests) were oxidised in steam beforehand at 900°C then homogenised in argon at 1485°C for 600 s, cooled at 20°C/s to 850°C before being rapidly cooled to ambient temperature. They were then tensile tested at temperatures ranging from 24°C to 800°C (in air up to 500°C and in argon above 500°C), with measurement of the ultimate tensile stress (UTS) and maximum elongation to failure.
The sensitivity analysis of the cooling rate and the maximum temperature for the homogenisation phase in argon before cooling did not reveal an apparent dependency of UTS and maximum elongation on these parameters.
Two series with a very limited number of tests made it possible to confirm the decisive effect of the concentration and distribution of oxygen in Zr-β on embrittlement:
a) Samples (0.43 and 0.71 mm thick) underwent oxidation in steam according to a postulated LOCA temperature transient involving a 12 s spike at a temperature TM ranging between 1000°C and 1600°C, followed by an isothermal oxidation at 1000°C for 288 s before rapid cooling to room temperature.
Figure 109 shows the ultimate tensile stress (UTS) and corresponding elongation ε as a function of the peak temperature TM; the numbers in brackets indicate the percent oxidation of each

DPAM/SEMCA 2008-093 A State-Of-The-Art Review Of Past Programmes Devoted To Fuel Behaviour Under Loss-Of-Coolant Conditions. Part 3.
134/239
Ce document est la propriété de l’IRSN et ne peut pas être communiqué ou reproduit sans son autorisation.
This document is IRSN proprietary and shall not be disseminated outside the Institute without its prior approval
test, determined by the weight gain of the sample; the decrease in UTS and ε (and therefore the drop in ductility) does not seem to be strictly related to an increase in the oxidation rate.
Figure 110 shows the radial profile of the oxygen concentration (determined from micro-hardness measurements) in 0.43 mm samples exposed to a temperature spike of 1400°C and 1500°C; at 1400°C the concentration is about 0.5 wt.% over the central half of the cladding, whereas it is about an average of 1 wt.% over barely a central third of the cladding at 1500°C. The ultimate tensile stress shown in Figure 109 is about 10 times smaller at 1500°C than at 1400°C.
Figure 109: UTS and elongation as a function of maximal temperature for Zircaloy-4 exposed to a 12 s temperature peak followed by 288 s at 1000°C
Figure 110: The oxygen distribution through the wall of 0.43 mm Zircaloy-4 cladding exposed to 1400 and 1500°C temperature peaks
b) Eight samples 0.43 mm thick were oxidised for 1200 s or 1800 s at 1150°C in a mixture of helium
+ steam at low steam partial pressure, rapidly cooled and then tensile- or compression-tested at ambient temperature.
Even though the equivalent oxidation rate was rather low (3.5% to 15.3%), the samples exhibited a low residual ductility (UTS < 100 MPa, ε < 2%). Metallographic examination revealed a very thin or inexistent oxide layer, whereas the Zr-α layer tended to extend over half of the cladding thickness. It is this layer – with a oxygen concentration greater than 2 wt.% - that is responsible for sample embrittlement.
On the basis of these observations and the results of previous tests by Hesson, Hobson and Rittenhouse, Sawatzky proposed an embrittlement criterion rather similar to that of Pawel: the oxygen concentration in the cladding must remain below 0.7 wt.% over at least half of the cladding thickness.
Sawatzky specifies that his criterion can be applied to oxidation during a temperature transient, which is not the case with Pawel’s criterion.

DPAM/SEMCA 2008-093 A State-Of-The-Art Review Of Past Programmes Devoted To Fuel Behaviour Under Loss-Of-Coolant Conditions. Part 3.
135/239
Ce document est la propriété de l’IRSN et ne peut pas être communiqué ou reproduit sans son autorisation.
This document is IRSN proprietary and shall not be disseminated outside the Institute without its prior approval
Using the one-sided isothermal oxidation of a 0.42 mm thick cladding as a basis for comparison, Sawatzky compared the critical embrittlement times for temperature levels of 900°C to 1600°C, as given by the USAEC-73, Pawel and Sawatzky criteria; the corresponding curves t = f(T) are given in Figure 111. It can be seen that the Sawatzky criterion is the least conservative for T < 1250°C and that it meets Pawel’s criteria at T > 1300°C.
Figure 111: Critical time for oxygen embrittlement as a function of temperature of Zircaloy-4 cladding 0.42 mm thick oxidized on one surface only
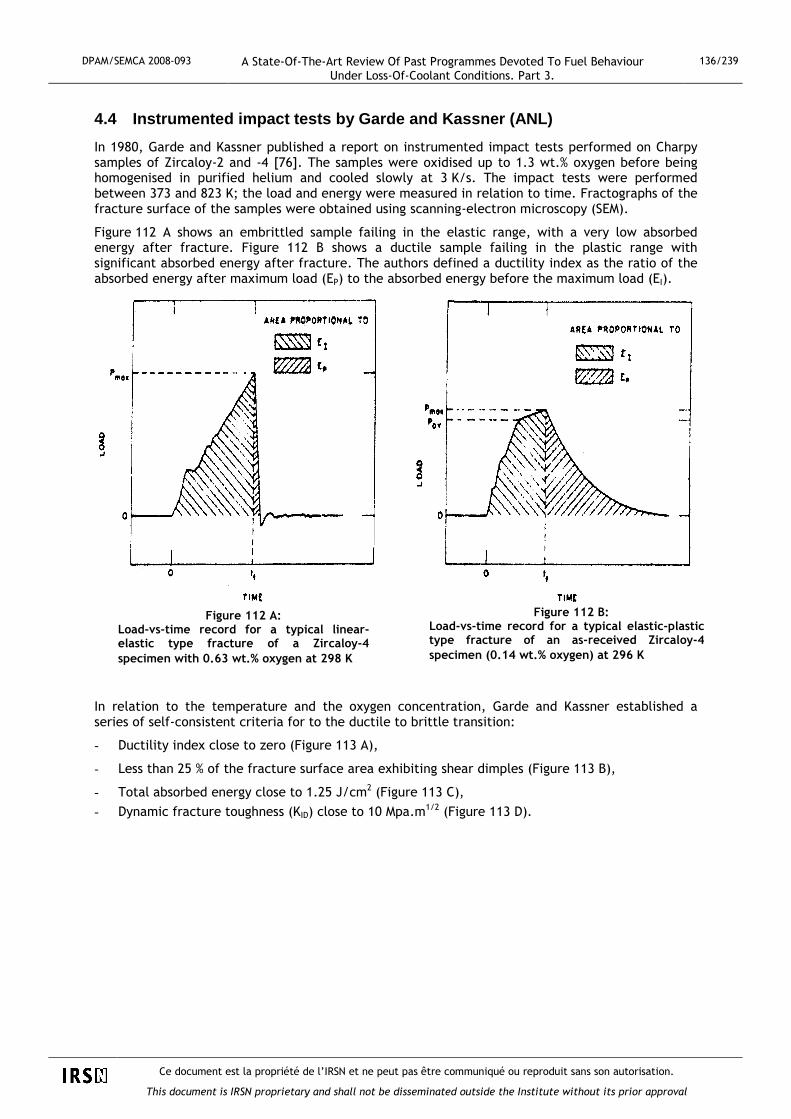
DPAM/SEMCA 2008-093 A State-Of-The-Art Review Of Past Programmes Devoted To Fuel Behaviour Under Loss-Of-Coolant Conditions. Part 3.
136/239
Ce document est la propriété de l’IRSN et ne peut pas être communiqué ou reproduit sans son autorisation.
This document is IRSN proprietary and shall not be disseminated outside the Institute without its prior approval
4.4 Instrumented impact tests by Garde and Kassner (ANL)
In 1980, Garde and Kassner published a report on instrumented impact tests performed on Charpy samples of Zircaloy-2 and -4 [76]. The samples were oxidised up to 1.3 wt.% oxygen before being homogenised in purified helium and cooled slowly at 3 K/s. The impact tests were performed between 373 and 823 K; the load and energy were measured in relation to time. Fractographs of the fracture surface of the samples were obtained using scanning-electron microscopy (SEM).
Figure 112 A shows an embrittled sample failing in the elastic range, with a very low absorbed energy after fracture. Figure 112 B shows a ductile sample failing in the plastic range with significant absorbed energy after fracture. The authors defined a ductility index as the ratio of the absorbed energy after maximum load (EP) to the absorbed energy before the maximum load (EI).
In relation to the temperature and the oxygen concentration, Garde and Kassner established a series of self-consistent criteria for to the ductile to brittle transition:
- Ductility index close to zero (Figure 113 A),
- Less than 25 % of the fracture surface area exhibiting shear dimples (Figure 113 B),
- Total absorbed energy close to 1.25 J/cm2 (Figure 113 C),
- Dynamic fracture toughness (KID) close to 10 Mpa.m1/2 (Figure 113 D).
Figure 112 A: Load-vs-time record for a typical linear-elastic type fracture of a Zircaloy-4 specimen with 0.63 wt.% oxygen at 298 K
Figure 112 B: Load-vs-time record for a typical elastic-plastic type fracture of an as-received Zircaloy-4 specimen (0.14 wt.% oxygen) at 296 K

DPAM/SEMCA 2008-093 A State-Of-The-Art Review Of Past Programmes Devoted To Fuel Behaviour Under Loss-Of-Coolant Conditions. Part 3.
137/239
Ce document est la propriété de l’IRSN et ne peut pas être communiqué ou reproduit sans son autorisation.
This document is IRSN proprietary and shall not be disseminated outside the Institute without its prior approval
(A) (B)
(C) (D) Figure 113: Ductile-to-brittle transition as a function of temperature and oxygen concentration of
homogeneous Zircaloy-2 and –4 alloys based upon the following criteria: (A) ductility index of ∼∼∼∼ 0; (B) <25% of the fracture surface area exhibiting shear dimples. (C) total absorbed energy of ∼∼∼∼1.3 x 10⁴ J/m2 ; (D) <dynamic fracture toughness of ∼∼∼∼ 10 MPa. m1/2
Figures 114 and 115 show isothermal cross sections at 373 K for Zry-4 in relation to the oxygen concentration, for the total absorbed energy and dynamic fracture toughness KID respectively. The ductile-brittle transition (1.25 J/cm2 or 10 MPa. m1/2) occurs between 0.6 and 0.7 wt. %O, which is consistent with Hobson’s conclusions at 135°C, as well as with conclusions reached by Pawel and Sawatzky.

DPAM/SEMCA 2008-093 A State-Of-The-Art Review Of Past Programmes Devoted To Fuel Behaviour Under Loss-Of-Coolant Conditions. Part 3.
138/239
Ce document est la propriété de l’IRSN et ne peut pas être communiqué ou reproduit sans son autorisation.
This document is IRSN proprietary and shall not be disseminated outside the Institute without its prior approval
Figure 114: ANL instrumented impact tests at 373 K on Zircaloy-4 Total surface energy absorbed as a function of the oxygen concentration
(according to Tables B1 to B3 from NUREG/CR-1408)
Figure 115: ANL instrumented impact tests at 373 K on Zircaloy-4 KID as a function of the oxygen concentration
(according to Tables B1 to B3 from NUREG/CR-1408)
0
0.5
1
1.5
2
2.5
3
3.5
0 0.1 0.2 0.3 0.4 0.5 0.6 0.7 0.8 0.9 1
Oxygen concentration(wt.%)
Tot
al a
bsor
bed
surf
ace
ener
gy (
J/cm
²)
0
5
10
15
20
25
0 0.1 0.2 0.3 0.4 0.5 0.6 0.7 0.8 0.9 1
Oxygen concentration (wt.%)
KID
(M
Pa.
m0,
5 )

DPAM/SEMCA 2008-093 A State-Of-The-Art Review Of Past Programmes Devoted To Fuel Behaviour Under Loss-Of-Coolant Conditions. Part 3.
139/239
Ce document est la propriété de l’IRSN et ne peut pas être communiqué ou reproduit sans son autorisation.
This document is IRSN proprietary and shall not be disseminated outside the Institute without its prior approval
4.5 Tests and criteria by Chung & Kassner (ANL)
A significant contribution to the qualitative and quantitative study on Zircaloy embrittlement under accident conditions was provided from research by Chung and Kassner at the end of the 70s [60]. A new program was launched at ANL towards the end of the 90s to supplement the previous results with a series of oxidation tests, post-oxidation mechanical tests on as-received, pre-hydrided or irradiated cladding samples and LOCA-integral type tests on irradiated fuel rod sections[57,77]. The main findings from this research still underway at ANL will be discussed in Section 4.6 below.
Research prior to 1980 includes:
1) A series of tests on pellet-free cladding tubes that were not pressurised and therefore not deformed, with:
- Isothermal two-sided oxidation, with slow cooling (5 K/s) or fast cooling (100 K/s for quench at Tox) through the β→α’ transformation range,
- Tests at ambient temperature (300 K) to evaluate critical fracture loads under pendulum impact and then diametral compression on rings samples cut on each side of the impact-fractured region.
2) A series of integral tests on pressurised cladding tubes with alumina pellets: swelling up to failure, followed by isothermal oxidation, slow or fast cooling and then final quench. Samples that did not fail after quench thermal shock were subjected to additional mechanical tests by pendulum impact at energies of 0.03, 0.15 and 0.3 Joule. The non-fractured tubes after these impact tests were finally subjected to diametral compression at different positions on the tubing (near or away from the ballooned regions) up to fragmentation or cladding-pellet contact. All tests were carried out at ambient temperature (300°K).
3) A series of integral tube-burst/tensile tests on 30 cm long pressurized Zircaloy-4 tubes with alumina pellets. The specimens were induction-heated. The integral testing included:
- Temperature ramp, cladding swelling and burst, isothermal oxidation in steam, cooling (5 K/s) to 810 K, quench; all these phases were free of axial load,
- Final axial tensile test at 300°K;
This very limited series (6 tests) was designed to check the consistency of mechanical properties under tensile testing in relation to the characteristics deduced from impact and diametral compression tests.
Analysis of these successive tests helped to establish a double criterion pertaining to the resistance of Zircaloy cladding to 1) thermal shock during LOCA reflood, and 2) secondary loads (hydraulic) during accident and post-accident (handling and transport) mechanical loads.
A brief summary of the experimental characteristics of these tests is provided and the main data drawn from these tests is analysed.
4.5.1 Experimental characteristics
The standard tests used 200 mm long Zircaloy-4 tubes with an outer diameter of 10.9 mm and a thickness of 0.635 mm. These tubes contained a stack of alumina pellets and were pressurised at 69 bar in helium or argon at room temperature.
Direct electrical heating (Joule effect) was applied to the tubes to simulate the experimental transient, which produced temperature non-uniformities after tube ballooning and rupture, inducing some peculiarities in results, as shall be seen further on.
Figure 116 shows typical time-temperature records for integral LOCA transients involving:
- A temperature ramp at 10 K/s from 300 K up to the isothermal oxidation temperature for the test. During this ramp, the cladding ruptured under the effect of internal pressure around 1040 K (= 767°C), i.e. in the high α phase domain, with a maximum deformation rate ranging between 65% and 100%,
- Isothermal oxidation in steam at temperatures between 1140 K and 1770 K (867 to 1497°C),

DPAM/SEMCA 2008-093 A State-Of-The-Art Review Of Past Programmes Devoted To Fuel Behaviour Under Loss-Of-Coolant Conditions. Part 3.
140/239
Ce document est la propriété de l’IRSN et ne peut pas être communiqué ou reproduit sans son autorisation.
This document is IRSN proprietary and shall not be disseminated outside the Institute without its prior approval
- For 218 tests: slow cooling at 5 K/s from maximum temperature to 1100 K (end of β→α transformation) followed by quench by bottom-flooding with water,
- For 66 tests: a direct flooding from Tmax, which corresponds to fast cooling at about 100°K/s in the β→α transformation range.
Figure 116: Temperature vs time from a tube-burst/thermal-shock test that shows an abrupt change in the cooling rate at temperatures between ∼∼∼∼ 750 and 840 K.
The Zircaloy-4 tube ruptured in steam at ∼ 1040 K, oxidised at 1550 K for 780 s, slow-cooled to ∼ 1100K, and bottom-flooded with water at a rise rate of ∼6.5 mm/s. Typical cooling curves produced by flooding at the maximum oxidation temperature are also shown. ANL Neg. No. 306-78-212 Rev. 1.
After testing the thicknesses of the oxide, Zr-α and Zr-β layers were measured based on metallographic examinations of cross sections, and the mean hydrogen concentration was also determined by an inert-gas fusion technique. However, the local oxygen concentration was never measured: this concentration was determined by a simplified calculation of the diffusion in the cladding.
4.5.2 Resistance to quench thermal shock
4.5.2.1 Quench resistance after slow cooling in the ββββ→→→→αααα' phase transformation range
Failure maps for fracture of the cladding by thermal shock in the ANL tests with slow cooling (5 K/s) in the β→α' phase transformation were parameterised in relation to the oxidation temperature (x-axis) and a variable characterising the extent of oxidation (y-axis) (ECR, fraction of remaining Zr-β, fractional saturation of Zr-β, Zr-β thickness containing less than a critical oxygen concentration). These various parameters were computed by the BSF 11 program from measured values of the oxide and α layers on the inner and outer surfaces of the cladding, and the time at the isothermal oxidation temperature. The corresponding failure maps are given in Figures 117, 118, 119 and 120.

DPAM/SEMCA 2008-093 A State-Of-The-Art Review Of Past Programmes Devoted To Fuel Behaviour Under Loss-Of-Coolant Conditions. Part 3.
141/239
Ce document est la propriété de l’IRSN et ne peut pas être communiqué ou reproduit sans son autorisation.
This document is IRSN proprietary and shall not be disseminated outside the Institute without its prior approval
Figure 117: Failure map for Zircaloy-4 cladding by thermal shock or normal handling relative to ECR parameter and isothermal oxidation temperature after rupture in steam
In terms of the equivalent cladding reaction (ECR), Figure 117 shows that no failure occurs at an ECR <28% for the highest temperatures, and that the amount of allowable oxidation increases significantly for T<1350 K.
It is worth pointing out that an ECR of 28%, if calculated according to the best-estimate Cathcart correlation, corresponds to ECR values of 36.7% for T=1477°K to 41.5% for T=1700°K according to the Baker-Just correlation.
Figure 118: Failure map for Zircaloy-4 cladding by thermal shock relative to the fractional thickness of previous ββββ-phase layer and isothermal oxidation temperature after rupture in steam
Figure 118 shows a failure limit relative to the fractional thickness of Zr-β (Fw) that is close to 0.25, which corresponds to about half the value recommended by the Scatena criterion.
Figure 119 shows that the parameter FBS – fractional oxygen saturation in the Zr-β layer – is an unsuitable variable to parameterise failure seeing that at T<1600 K, the ruptures correspond to complete saturation (FBS=1) of Zr-β.

DPAM/SEMCA 2008-093 A State-Of-The-Art Review Of Past Programmes Devoted To Fuel Behaviour Under Loss-Of-Coolant Conditions. Part 3.
142/239
Ce document est la propriété de l’IRSN et ne peut pas être communiqué ou reproduit sans son autorisation.
This document is IRSN proprietary and shall not be disseminated outside the Institute without its prior approval
Figure 119 : Failure map for Zircaloy-4 cladding by thermal shock relative to fractional saturation of ββββ phase and isothermal oxidation temperature after rupture in steam
Last of all, Figure 120 shows that a failure limit appears more clearly by quantifying the degree of oxidation based on the thickness Lc<1 of Zr-β containing less than a critical oxygen concentration (1 wt.%): rupture occurs for Lc<1 < 0.1 mm.
Figure 120: Failure map for Zircaloy-4 cladding (cooled through ββββ→→→→αααα' transformation at ∼∼∼∼ 5 K/s) by thermal shock relative to wall thickness with ≤≤≤≤ 1.0 wt% oxygen and isothermal oxidation temperature

DPAM/SEMCA 2008-093 A State-Of-The-Art Review Of Past Programmes Devoted To Fuel Behaviour Under Loss-Of-Coolant Conditions. Part 3.
143/239
Ce document est la propriété de l’IRSN et ne peut pas être communiqué ou reproduit sans son autorisation.
This document is IRSN proprietary and shall not be disseminated outside the Institute without its prior approval
4.5.2.2 Effect of cooling rate through the ββββ→→→→αααα' transformation range
This effect appears when comparing previous results with the results of tests where the quench was performed directly from the oxidation temperature by bottom-flooding with water, which results in cooling of about 100°K/s through the temperature range of the β→α'transformation.
At temperatures ≤1600°K, the oxidation times leading to thermal shock failure are about 2 times shorter than for tests at the same temperature with slow cooling.
Figure 121 shows the failure map relative to maximum oxidation temperature and ECR; this map also plots the test data of Hesson et al. and Scatena, as well as the failure boundary deduced from previous, slow cooling tests. It can be seen that the failure boundary is located around ECR=20% for temperatures ≥1650 K, and significantly increases again as T decreases below 1350 K.
Figure 121: Thermal-shock failure map for Zircaloy-4 cladding (bottom flooded with water at the
oxidation temperature) relative to the equivalent-cladding-reacted parameter and maximum oxidation temperature after rupture in steam
As beforehand, the corresponding limit calculated using the Baker-Just is located between 26% and 30% ECR depending on the oxidation temperature.
Figure 122 – similar to Figure 120 – shows that the failure domain is well delimited by the parameter: Zr-β thickness containing less than 0.9% of oxygen; failure occurs at Lc<0.9 < 0.1 mm (except for one point that ruptured around Lc<0.9 ∼ 0.14 mm).

DPAM/SEMCA 2008-093 A State-Of-The-Art Review Of Past Programmes Devoted To Fuel Behaviour Under Loss-Of-Coolant Conditions. Part 3.
144/239
Ce document est la propriété de l’IRSN et ne peut pas être communiqué ou reproduit sans son autorisation.
This document is IRSN proprietary and shall not be disseminated outside the Institute without its prior approval
Figure 122: Failure map for Zircaloy-4 cladding by thermal shock relative to the wall thickness with ≤≤≤≤ 0.9 wt.% oxygen after isothermal oxidation and flooding with water at the oxidation temperature. Cooling rate through ββββ→→→→αααα' transformation was ∼∼∼∼ 100 K/s.
Chung & Kassner analysed the microstructures of several samples with slow and fast cooling trough the β → α' transformation and evaluated the oxygen distribution by scanning-Auger microscopy (SAM). The results for samples with slow cooling are given in Figure 123 and those of samples with fast cooling are given in Figure 124. These figures show that the effect of cooling rate on embrittlement is related to the redistribution of oxygen in the transformed β phase: during slow cooling, part of the oxygen precipitates into α grains or platelets (rich in oxygen), leaving a β matrix with oxygen-depleted regions that is therefore more ductile than during fast cooling. However, during fast cooling, the redistribution is negligible, which means that β remains relatively homogeneous and more brittle. However, the effect of cooling rate on oxygen redistribution becomes less significant at elevated temperatures (>1600 K) and for oxygen content exceeding ∼0.9 wt.%.

DPAM/SEMCA 2008-093 A State-Of-The-Art Review Of Past Programmes Devoted To Fuel Behaviour Under Loss-Of-Coolant Conditions. Part 3.
145/239
Ce document est la propriété de l’IRSN et ne peut pas être communiqué ou reproduit sans son autorisation.
This document is IRSN proprietary and shall not be disseminated outside the Institute without its prior approval
Figure 129: Specimen oxidized 18 ks at 1273 K and cooled through ββββ→→→→αααα' transformation at ∼∼∼∼ 5 K/s
Figure 124: Specimen oxidized 12 ks at 1273 K and cooled through ββββ→→→→αααα' transformation at ∼∼∼∼ 100 K/s
Scanning-Auger micrographs of the transformed ββββ phase region of two specimens oxidized in steam at 1273 K and cooled through the ββββ→→→→αααα' transformation range at ∼∼∼∼ 5 and 100 K/s respectively. (A) Optical micrograph of the region, (B) map of oxygen distribution, and (C) oxygen concentration profile across the tube wall at the location of line in (A)

DPAM/SEMCA 2008-093 A State-Of-The-Art Review Of Past Programmes Devoted To Fuel Behaviour Under Loss-Of-Coolant Conditions. Part 3.
146/239
Ce document est la propriété de l’IRSN et ne peut pas être communiqué ou reproduit sans son autorisation.
This document is IRSN proprietary and shall not be disseminated outside the Institute without its prior approval
By analysing the micro-hardness, Böhmert [78] confirmed the existence of α inclusions for Zry-4 (see Figure 125) but observed a flat profile in the β layer for the Russian alloy E110 (see Figure 126).
Figure 125: Radial profiles of micro-hardness; Zry-4 after steam oxidation at 1000°C
Figure 126: Radial profiles of micro-hardness; ZrNb1 after steam oxidation at 1000°C, 30 min,
quenched in water

DPAM/SEMCA 2008-093 A State-Of-The-Art Review Of Past Programmes Devoted To Fuel Behaviour Under Loss-Of-Coolant Conditions. Part 3.
147/239
Ce document est la propriété de l’IRSN et ne peut pas être communiqué ou reproduit sans son autorisation.
This document is IRSN proprietary and shall not be disseminated outside the Institute without its prior approval
Based on electron probe analysis, Brachet [79] also confirmed the existence of these α incursions for Zry-4 (see Figure 127) but observed a monotonous profile in the ex-β layer for the M5 alloy (see Figure 128). The cooling rate effect in the β → α' transformation range should therefore not exist for Zr1%Nb tin-free alloys.
Figure 127: Typical electron probe X-ray map and concentration profile of oxygen in Zry-4 oxidised at 1100°C up to ECR∼∼∼∼ 10.5%
Figure 128: Typical electron probe X-ray map and concentration profile of oxygen in M5TM oxidised at 1100°C up to ECR∼∼∼∼ 10.5%

DPAM/SEMCA 2008-093 A State-Of-The-Art Review Of Past Programmes Devoted To Fuel Behaviour Under Loss-Of-Coolant Conditions. Part 3.
148/239
Ce document est la propriété de l’IRSN et ne peut pas être communiqué ou reproduit sans son autorisation.
This document is IRSN proprietary and shall not be disseminated outside the Institute without its prior approval
4.5.3 Resistance to mechanical loads at ambient tem perature
4.5.3.1 Results of non-deformed ring compression te sts
4.5.3.1.1 Comparison with other experimenters
Chronologically speaking, these tests were performed after the impact tests but they are discussed here for comparison with the results obtained by other experimenters, particularly Hobson. Figure 129 provides a typical load-vs-deflection curve; four abrupt and unrecovered load drops can be observed, which correspond to four fractures at azimuths 3H and 9H (decrease in the curvature radius) then azimuths 6H and 12 (increase in the curvature radius).
Figure 129: Schematic of typical load-vs-deflection curve from a diametral ring-compression test on a segment of oxidised Zircaloy cladding. Abrupt decreases in load correspond to four sequential fractures before fragmentation during slow compression
In the NUREG/CR-1344 report [60], the deflection at the 4th crack was used as the total deflection to fragmentation (deflection up to point E in Figure 129). Figure 130 shows the total deflection to fragmentation as a function of ECR for samples with slow cooling (5K/s) in the β→α' transformation range. In this figure, it can be seen that all the samples were significantly oxidised since all exceed a measured ECR of 14%. Furthermore, as the compression tests were performed at ambient temperature, all these samples can be expected to be brittle.
Figure 130: Relationship between total deflection to fragmentation and ECR parameter for undeformed Zircaloy cladding oxidized in steam at the inner and outer surfaces at 1373, 1477, 1588 and 1673 K and cooled through the ββββ→→→→αααα' phase transformation at ∼∼∼∼ 5 K/s
The total deflection to initial crack (deflection AD in Figure 129) – rather than total deflection to fragmentation – was used to quantify the ring-compression properties in tests by Meservey/ Graber,

DPAM/SEMCA 2008-093 A State-Of-The-Art Review Of Past Programmes Devoted To Fuel Behaviour Under Loss-Of-Coolant Conditions. Part 3.
149/239
Ce document est la propriété de l’IRSN et ne peut pas être communiqué ou reproduit sans son autorisation.
This document is IRSN proprietary and shall not be disseminated outside the Institute without its prior approval
Scatena, UKAEA Springfields and more recently by CEA and other laboratories in Eastern countries. The total deflection to initial crack, which was also listed in the NUREG/CR-1344 report for samples with slow cooling (5K/s) in the β→α' transformation range, has been plotted in Figure 131 in relation to the ECR. As expected, deflection does not exceed 0.5 mm and therefore corresponds to brittle samples.
Figure 131: Total deflection to initial crack as function of ECR in ANL ring compression tests on undeformed Zircaloy cladding after oxidation in steam and slow cooling through the ββββ→→→→αααα' phase transformation range (from Table V and VI of NUREG/CR-1344)
In Figure 132, this deflection is provided as a function of ξT/WO to enable comparison with results by Scatena, and Bentley & Mowat, as well as (…to enable comparison) with the Hobson limit (ZDT = 77°F corresponds to ξT/WO = 0.38). The results by Chung & Kassner are consistent with those by Scatena, Bentley & Mowat, and Hobson. Chung & Kassner tested two ring-compression rates; as can be seen in the Figures 131 and 132, there is no significant effect of compression rate in the range under investigation.
Figure 132:Total deflection to initial crack as function of the ξξξξT/W0 ratio in ANL ring compression tests on undeformed Zircaloy cladding after oxidation in steam and slow cooling through the ββββ→→→→αααα' phase transformation range. Comparison with TTE-2 and Bentley & Mowat data
0
0.2
0.4
0.6
0.8
1
1.2
1.4
1.6
0 5 10 15 20 25 30 35
Equivalent Cladding Reacted (%)
Tot
al D
efle
ctio
n to
Initi
al C
rack
(m
m) 0.043 mm/s
0.33 mm/s
0
1
2
3
4
5
6
0 0.1 0.2 0.3 0.4 0.5 0.6 0.7 0.8 0.9 1
ξT/Wo
Tot
al D
efle
ctio
n to
Initi
al C
rack
(m
m)
ANL-0,043mm/sANL-0,33mm/sBentley & MowatTTE-2TTE-2 / 2Hobson, ZDT=77°F

DPAM/SEMCA 2008-093 A State-Of-The-Art Review Of Past Programmes Devoted To Fuel Behaviour Under Loss-Of-Coolant Conditions. Part 3.
150/239
Ce document est la propriété de l’IRSN et ne peut pas être communiqué ou reproduit sans son autorisation.
This document is IRSN proprietary and shall not be disseminated outside the Institute without its prior approval
4.5.3.1.2 Effect of cooling rate through the β → α' phase transformation
As specified in § 4.5.2.2, this effect becomes apparent through the comparison of previous results with the results of samples subjected to quench from the oxidation temperature, which leads to a cooling rate of about 100 K/s in the β → α' phase transformation range. Figures 133 and 134 show total deflection to fragmentation as a function of the residual thickness of the β phase for cladding oxidised in steam at 1477 and 1588 K respectively. They show that for a residual thickness of the β phase ≥0.3 mm, the slow-cooled cladding exhibits larger deflection to fragmentation than the fast-cooled cladding.
Figure 133: Total deflection to fragmentation at 300 K vs thickness of transformed ββββ-phase layer for Zircaloy-4 cladding oxidized in steam at 1477 K and cooled through the phase transformation at rates of ∼∼∼∼ 5 and 100 K/s
Figure 134: Total deflection to fragmentation at 300 K vs thickness of transformed ββββ-phase layer for Zircaloy-4 cladding oxidized in steam at 1588 K and cooled through the phase transformation at rates of ∼∼∼∼ 5 and 100 K/s

DPAM/SEMCA 2008-093 A State-Of-The-Art Review Of Past Programmes Devoted To Fuel Behaviour Under Loss-Of-Coolant Conditions. Part 3.
151/239
Ce document est la propriété de l’IRSN et ne peut pas être communiqué ou reproduit sans son autorisation.
This document is IRSN proprietary and shall not be disseminated outside the Institute without its prior approval
4.5.3.2 Results of compression tests on ballooned r ods
For ballooned and burst cladding having survived quench thermal shock and then 0.3 J impact loads, diametral compression tests were performed at different axial locations on the tube ( in and adjacent to the ballooned regions, see Figure 135), until fragmentation or pellet-cladding contact occurs (see Figure 136). Segments of the cladding were retained after the compression tests for metallographic examination and hydrogen analysis.
Figure 135: Schematic representation of a Zircaloy cladding specimen after rupture in steam showing the sequence of axial locations for compression tests used to determine the deflection to produce fragmentation or pellet-cladding contact
Figure 136: Typical load vs deflection curves from diametral tube-compression tests on rupture Zircaloy-4
cladding showing an abrupt increase in load due to contact between the cladding and pellet
Again for comparison with results of other experimenters (particularly Hobson) deflection at maximum load was used as tabulated in report [60] (up to point D in Figure 136). Figure 137 shows deflection to maximum load as a function of ECR and reveals brittle points (deflection < 0.9 mm) for low ECR values, despite the slow cooling in the β → α' transformation range. Figure 138 shows the same deflection as a function of ξT/WO, for comparison with Hobson’s limit (ξT/WO = 0.38 at room temperature). Samples were therefore found brittle (deflection < 0.9 mm) below the Hobson’s limit (ξT/WO < 0.38) despite slow cooling in the β→α' transformation range.
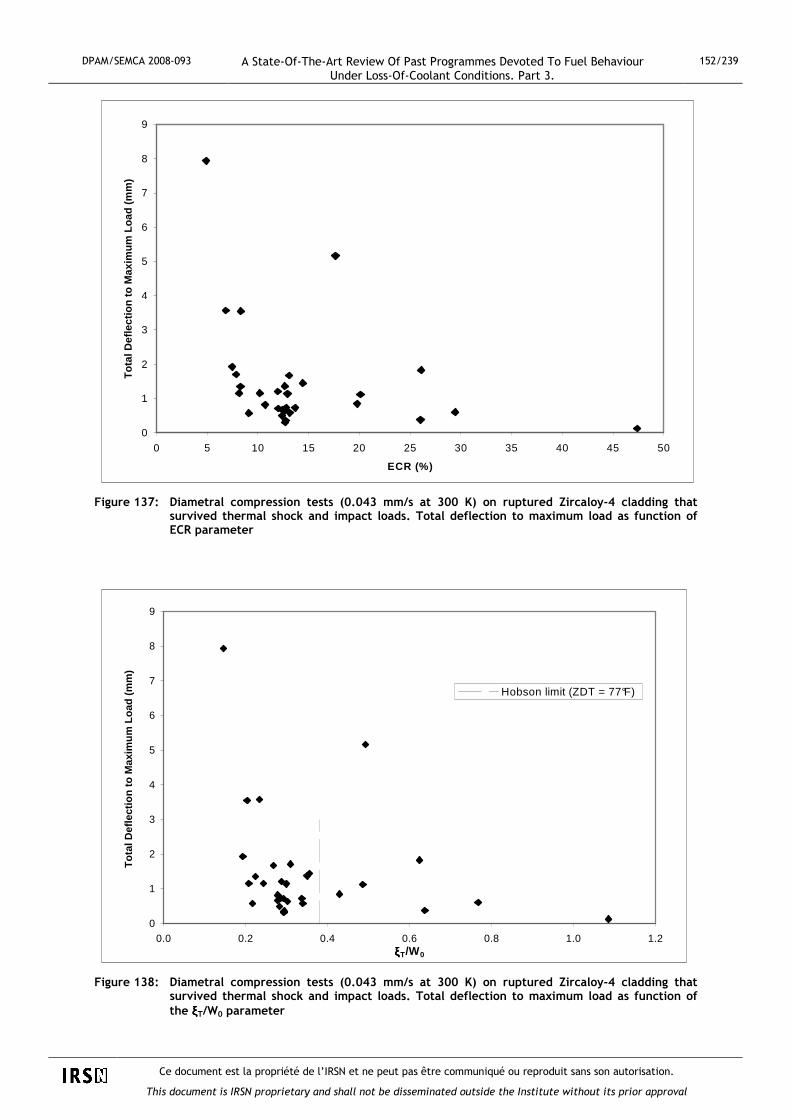
DPAM/SEMCA 2008-093 A State-Of-The-Art Review Of Past Programmes Devoted To Fuel Behaviour Under Loss-Of-Coolant Conditions. Part 3.
152/239
Ce document est la propriété de l’IRSN et ne peut pas être communiqué ou reproduit sans son autorisation.
This document is IRSN proprietary and shall not be disseminated outside the Institute without its prior approval
Figure 137: Diametral compression tests (0.043 mm/s at 300 K) on ruptured Zircaloy-4 cladding that survived thermal shock and impact loads. Total deflection to maximum load as function of ECR parameter
Figure 138: Diametral compression tests (0.043 mm/s at 300 K) on ruptured Zircaloy-4 cladding that survived thermal shock and impact loads. Total deflection to maximum load as function of the ξξξξT/W0 parameter
0
1
2
3
4
5
6
7
8
9
0 5 10 15 20 25 30 35 40 45 50
ECR (%)
Tot
al D
efle
ctio
n to
Max
imum
Loa
d (m
m)
0
1
2
3
4
5
6
7
8
9
0.0 0.2 0.4 0.6 0.8 1.0 1.2ξξξξT/W0
Tot
al D
efle
ctio
n to
Max
imum
Loa
d (m
m)
Hobson limit (ZDT = 77°F)

DPAM/SEMCA 2008-093 A State-Of-The-Art Review Of Past Programmes Devoted To Fuel Behaviour Under Loss-Of-Coolant Conditions. Part 3.
153/239
Ce document est la propriété de l’IRSN et ne peut pas être communiqué ou reproduit sans son autorisation.
This document is IRSN proprietary and shall not be disseminated outside the Institute without its prior approval
Deflection to maximum load is plotted in relation to the hydrogen content (see Figure 139) and shows a very pronounced decrease in ductility from very low hydrogen contents (< 200 wt.ppm), which is in good agreement with the JAERI tests (see § 4.7).
Figure 139: Diametral compression tests (0.043 mm/s at 300 K) on ruptured Zircaloy-4 cladding that survived thermal shock and impact loads. Total deflection to maximum load as a function of the hydrogen content
Nine tubes from the integral tube-burst/ thermal shock tests were selected for correlation of the hydrogen content with inner surface oxidation characteristics. Figure 140 shows the hydrogen content and oxide layer thickness plotted in relation to the axial position along the tube oxidised 900 s at 1205-1433 K. ,A high level of hydrogen uptake was observed at the balloon ends, as a result of inner surface oxidation by stagnant vapour . The highest brittleness is expected at these locations, as observed in the JAERI tests (see § 4.7). This figure also shows that the axial temperature profile is not uniform; this was attributed to the direct electrical heating of the tube which resulted in lower temperatures in the ballooned region, lower hydrogen generation rate and hydrogen uptake by the cladding than in experiments with furnace heating.
Figure 140: Temperature, hydrogen content and average thickness of inner-surface oxide layer as a function of axial distance from the rupture location of a Zircaloy tube oxidized in steam for 900 s at 1205-1423 K
0
1
2
3
4
5
6
7
8
9
0 200 400 600 800 1000 1200 1400 1600 1800 2000
Hydrogen Content (wt. ppm)
Tot
al D
efle
ctio
n to
Max
imum
Loa
d (m
m)

DPAM/SEMCA 2008-093 A State-Of-The-Art Review Of Past Programmes Devoted To Fuel Behaviour Under Loss-Of-Coolant Conditions. Part 3.
154/239
Ce document est la propriété de l’IRSN et ne peut pas être communiqué ou reproduit sans son autorisation.
This document is IRSN proprietary and shall not be disseminated outside the Institute without its prior approval
In Figure 141, the results of compression tests on ballooned tubes and undeformed rings are plotted in a ductility map relative to the ECR parameter and the hydrogen content.
Figure 141: Compression tests on ANL ballooned tubes and undeformed rings Ductility map (based on total deflection to fragmentation or to maximum load) as a function of ECR and
the hydrogen content (according to Tables V and X by NUREG/CR-1344)
4.5.3.3 Results of impact tests on non-deformed tubes
The impact tests on non-deformed tubes helped quantify the failure-impact energy at different temperatures and oxidation levels (see Figure 142). In this figure, it can be seen that, although all samples proved to be brittle upon slow compression testing (see Figure 130), extrapolation of the results at T ≤1588 K near the 17% ECR limit indicates a rather significant failure-impact energy at room temperature (>∼ 1 J). It can also be observed that the impact energy at ECR values corresponding to thermal shock failure (≥ 28 %, § 4.5.2.1) are very low.
Figure 142: Relationship between failure-impact energy at 300 K and ECR parameter for undeformed Zircaloy cladding oxidized in steam at the inner and outer surfaces at 1373, 1477, 1588 and 1673 K and cooled through the ββββ→→→→αααα' transformation range at ∼∼∼∼ 5 K/s
1
10
100
10 100 1000 10000
Hydrogen content (ppm)
EC
R (
%)
ANL, di>1,1mmANL, di<0,9mm

DPAM/SEMCA 2008-093 A State-Of-The-Art Review Of Past Programmes Devoted To Fuel Behaviour Under Loss-Of-Coolant Conditions. Part 3.
155/239
Ce document est la propriété de l’IRSN et ne peut pas être communiqué ou reproduit sans son autorisation.
This document is IRSN proprietary and shall not be disseminated outside the Institute without its prior approval
As in § 4.5.2.2 and 4.5.3.1.2, the effect of the cooling rate through the β → α' phase transformation range on impact properties was also investigated (see Figure 143) and led to the same conclusions: for the same β phase layer thickness, the impact energy required for failure is higher when cooling in the β→α' transformation range is slower.
Figure 143: Failure-impact energy at 300 K vs thickness of transformed ββββ-phase layer for Zircaloy cladding oxidized in steam at 1477 K and cooled through the phase transformation range at ∼∼∼∼ 5 and 100 K/s
4.5.3.4 Results of impact tests on ballooned rods
For samples having survived thermal shock, the objective of these additional mechanical tests was to assess the residual resistance of heavily oxidised cladding to mechanical loads at low temperature representative of hydraulic loads during reflooding, seismic loads as well as anticipated loads during post-accident handling.
It was suspected that dissolved hydrogen in the cladding during high temperature oxidation and the precipitation of hydrides may both play an important role at low temperature. This was not revealed during thermal shock tests where the maximum stress to thermal shock occurs at temperatures between 475°C and 600°C.
With ballooned and burst tubes, therefore with the additional effect of wall thinning, increasing impact energies were applied to rods having survived thermal shock (see Figure 144). For time-temperature oxidation conditions just below the thermal shock failure limit, failure upon impact occurred at about 0.03 J.
Figure 144: Capability of Zircaloy-4 tubes having survived thermal shock to withstand impact energies of 0.03, 0.15 and 0.3 J at 300K. Impact velocities were ∼∼∼∼ 1.7 m/s

DPAM/SEMCA 2008-093 A State-Of-The-Art Review Of Past Programmes Devoted To Fuel Behaviour Under Loss-Of-Coolant Conditions. Part 3.
156/239
Ce document est la propriété de l’IRSN et ne peut pas être communiqué ou reproduit sans son autorisation.
This document is IRSN proprietary and shall not be disseminated outside the Institute without its prior approval
By dividing this failure energy (0.03 J) by the cross sectional surface area of the β phase layer, values less than 1.25 J/cm2 are obtained (see Figure 145). Samples failing under thermal-shock loading are therefore brittle under impact loading according to the results by Garde and Kassner (see § 4.4).
Figure 145: Impact tests on ANL ballooned tubes Rupture energy per unit of cross sectional β surface area as a function of this rupture energy
(according to Table VIII by NUREG/CR-1344)
Even though the type and magnitude of probable loads on the cladding, other than thermal shock during accident and post-accident situations (e.g. hydraulic, seismic and handling loads ) were not precisely estimated, an impact energy of 0.3 J (equivalent to 10 times the value corresponding to the thermal shock) was chosen as the reference value for the pendulum impact tests at 300°K.
The failure map based on a 0.3 J impact load and parameterised according to ECR parameter and oxidation temperature is shown in Figure 146. This map is consistent with the 17% ECR oxidation limit in the acceptance criteria. No test ruptured below an ECR of 17% when the oxidation temperature was below 1477 K. One test ruptured at a low ECR following oxidation above 1477 K, which therefore justifies the temperature limit of the acceptance criteria.
Figure 146: Failure characteristics of Zircaloy-4 cladding under 0.3 J impact load at 300 K relative to ECR parameter and oxidation temperature. (The ECR parameter was calculated based on observed phase layer thicknesses)
0
1
2
3
4
5
6
7
8
0 0.05 0.1 0.15 0.2 0.25 0.3 0.35
Failure energy (J)
Impa
ct fa
ilure
ene
rgy
per
uni
t cro
ss s
ectio
nal a
rea
of
tran
sfor
med
β β β β
laye
r (J
/cm
2)

DPAM/SEMCA 2008-093 A State-Of-The-Art Review Of Past Programmes Devoted To Fuel Behaviour Under Loss-Of-Coolant Conditions. Part 3.
157/239
Ce document est la propriété de l’IRSN et ne peut pas être communiqué ou reproduit sans son autorisation.
This document is IRSN proprietary and shall not be disseminated outside the Institute without its prior approval
ANL investigators plotted failure maps of Zircaloy-4 cladding under 0.3 J impact load, parameterised in relation to the absorbed hydrogen content (CH) and a variable quantifying the amount of oxidation. In Figure 147, the oxidation was quantified by the equivalent-cladding-reacted parameter (ECR). In the case where the data point with failure at low ECR and oxidation above 1477 K is ignored, the failure boundary appears independent of the hydrogen content. Compensation between the hydrogen content and wall thinning is likely to occur; the thickness is reduced but the hydrogen content is low at the balloon mid-height, whereas the hydrogen content is high but the cladding wall undergoes very little thinning at the balloon necks.
Figure 147: Failure characteristics of Zircaloy-4 cladding under 0.3 J impact load at 300 K relative to ECR parameter and hydrogen content. (The ECR parameter was calculated based on observed phase layer thicknesses)
In terms of the Zr-β layer thickness with an oxygen content less than a critical value (0.7% mass) – written LC<0.7 – Figure 148 shows that the failure boundary is located around LC<0.7 < 0.3 mm and appears independent of the hydrogen content for CH < 2200 ppm.
Figure 148: Capability of Zircaloy-4 cladding to withstand an impact energy of 0.3 J at 300K relative to the thickness of ββββ-phase layer containing < 0.7 wt% oxygen and the hydrogen content of the cladding

DPAM/SEMCA 2008-093 A State-Of-The-Art Review Of Past Programmes Devoted To Fuel Behaviour Under Loss-Of-Coolant Conditions. Part 3.
158/239
Ce document est la propriété de l’IRSN et ne peut pas être communiqué ou reproduit sans son autorisation.
This document is IRSN proprietary and shall not be disseminated outside the Institute without its prior approval
4.5.4 Recommended embrittlement criteria based upon ANL investigation
Based on the analysis of integral thermal shock tests and 0.3 J impact tests, Chung and Kassner recommended physical criteria as an alternative to the AEC 1973 criteria, which differentiate between two different loading modes:
� Capability to withstand thermal shock during LOCA reflood: The calculated thickness of the cladding containing less than 0.9 wt.% oxygen, based on the average wall thickness at any axial location, shall be greater than 0.1 mm.
� Capability to withstand other mechanical loads (hydraulic, seismic, handling and transport): The calculated thickness of the cladding containing less than 0.7 wt.% oxygen, based on the average wall thickness at any axial location, shall be greater than 0.3 mm.
The 0.7 wt.% threshold oxygen concentration is consistent with results from Hobson, Pawel and Garde & Kassner. This criterion is independent of the hydrogen content, which therefore does not need to be evaluated (practically impossible to do anyway owing to the lack of experimental data). This criterion combines the ECR and maximum cladding temperature criteria into one unique criterion, but it requires a rather complex diffusion calculation at high temperature. Recent investigations have shown that hydrogen increases the oxygen solubility in the beta phase [80, 111]. However, this effect was not known at the time of Chung and Kassner's investigation and consequently not accounted for in their analysis of test results for samples having absorbed hydrogen at high temperature. Thus, the criteria established by Chung and Kassner may possibly be used for test analysis but should not be recommended for regulatory purposes.
Figure 149 shows that the 0.7 wt.% oxygen concentration criterion is also confirmed by the non-deformed tubes oxidised at 1373 K and 1477 K, cooled slowly in the β → α' transformation. This figure does not make it possible to draw conclusions for tubes oxidised at 1588 K and 1673 K, as the thickness containing less than 0.7 wt.% oxygen would have to be calculated. It is expected that the tubes oxidised at 1673 K, as well as those oxidised at 1588 K that ruptured below 0.3 J, would have such a thickness containing less than 0.7 wt.% oxygen lower than 0.3 mm.
Figure 149: Energy required to produce fracture of undeformed Zircaloy cladding by pendulum impact at 300 K after oxidation of inner and outer surfaces in steam at temperatures between 1373 and 1673 K for various Times. The cladding was cooled through the β→α' transformation at ∼ 5 K/s

DPAM/SEMCA 2008-093 A State-Of-The-Art Review Of Past Programmes Devoted To Fuel Behaviour Under Loss-Of-Coolant Conditions. Part 3.
159/239
Ce document est la propriété de l’IRSN et ne peut pas être communiqué ou reproduit sans son autorisation.
This document is IRSN proprietary and shall not be disseminated outside the Institute without its prior approval
However, having been based on ballooned rods cooled slowly in the β → α' transformation, this criterion does not cover the case of fast cooling in the β → α' transformation: Figure 143 shows that three non-deformed tubes oxidised at 1477 K and having failed below 0.3 J impact energy despite a β phase layer (containing less than 0.7 wt.% O at this temperature) slightly higher than 0.3 mm were not predicted by Chung & Kassner's criterion for handling failures.
The authors specifically pointed out that the criteria can be applied independently from knowledge of the transient temperature histories, the initial cladding thickness before oxidation and the total oxygen concentration in the cladding. The effect of absorbed hydrogen in the beta Zircaloy would also be implicitly included in the criteria.
It is important to draw attention to the specific formulation of these criteria in terms of a calculated quantity that has never been measured (Zr-β layer thickness where the local oxygen concentration is less than a given threshold) inferred from experimental variables using a rather complex concentration profile calculation. All models available for this calculation – particularly the model used by Chung & Kassner to analyse their tests results– contain simplified options and hypotheses. It can therefore be thought that the validity of the Chung & Kassner criteria used to predict the cladding rupture in a LOCA accident sequence is greatly conditioned by the use – in the oxygen concentration profile calculation –of the same model as that used to establish the authors’ criteria.
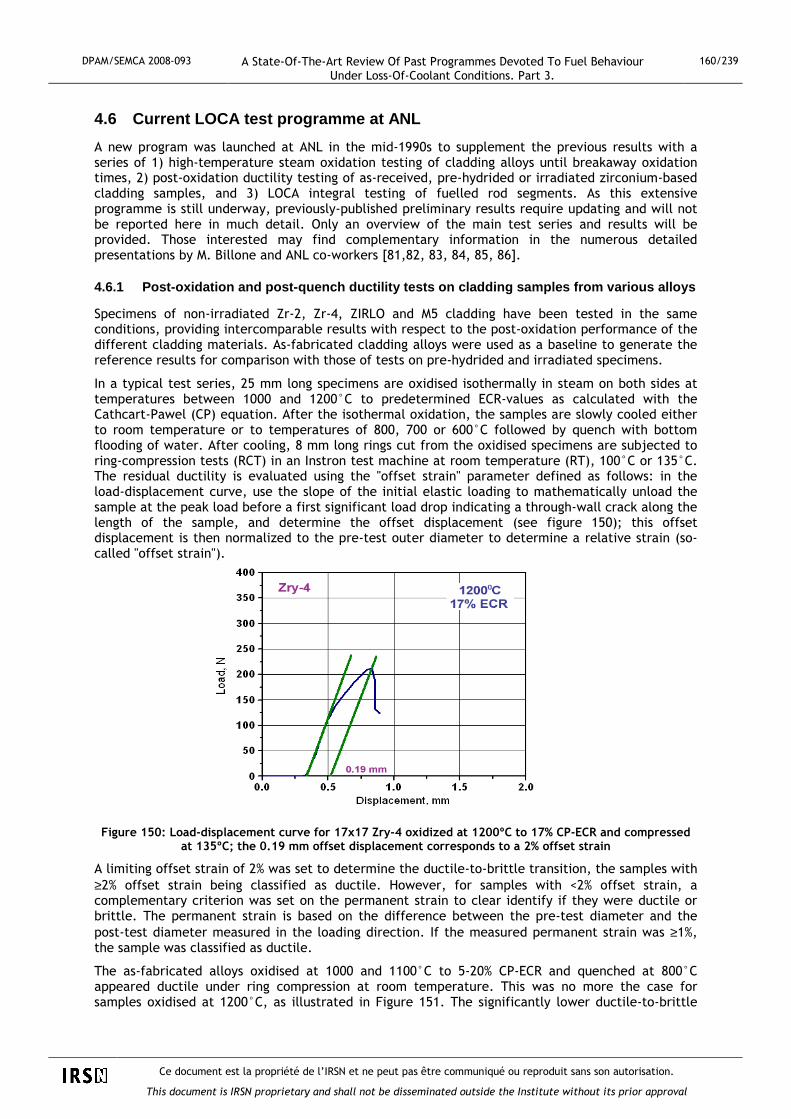
DPAM/SEMCA 2008-093 A State-Of-The-Art Review Of Past Programmes Devoted To Fuel Behaviour Under Loss-Of-Coolant Conditions. Part 3.
160/239
Ce document est la propriété de l’IRSN et ne peut pas être communiqué ou reproduit sans son autorisation.
This document is IRSN proprietary and shall not be disseminated outside the Institute without its prior approval
4.6 Current LOCA test programme at ANL
A new program was launched at ANL in the mid-1990s to supplement the previous results with a series of 1) high-temperature steam oxidation testing of cladding alloys until breakaway oxidation times, 2) post-oxidation ductility testing of as-received, pre-hydrided or irradiated zirconium-based cladding samples, and 3) LOCA integral testing of fuelled rod segments. As this extensive programme is still underway, previously-published preliminary results require updating and will not be reported here in much detail. Only an overview of the main test series and results will be provided. Those interested may find complementary information in the numerous detailed presentations by M. Billone and ANL co-workers [81,82, 83, 84, 85, 86].
4.6.1 Post-oxidation and post-quench ductility test s on cladding samples from various alloys
Specimens of non-irradiated Zr-2, Zr-4, ZIRLO and M5 cladding have been tested in the same conditions, providing intercomparable results with respect to the post-oxidation performance of the different cladding materials. As-fabricated cladding alloys were used as a baseline to generate the reference results for comparison with those of tests on pre-hydrided and irradiated specimens.
In a typical test series, 25 mm long specimens are oxidised isothermally in steam on both sides at temperatures between 1000 and 1200°C to predetermined ECR-values as calculated with the Cathcart-Pawel (CP) equation. After the isothermal oxidation, the samples are slowly cooled either to room temperature or to temperatures of 800, 700 or 600°C followed by quench with bottom flooding of water. After cooling, 8 mm long rings cut from the oxidised specimens are subjected to ring-compression tests (RCT) in an Instron test machine at room temperature (RT), 100°C or 135°C. The residual ductility is evaluated using the "offset strain" parameter defined as follows: in the load-displacement curve, use the slope of the initial elastic loading to mathematically unload the sample at the peak load before a first significant load drop indicating a through-wall crack along the length of the sample, and determine the offset displacement (see figure 150); this offset displacement is then normalized to the pre-test outer diameter to determine a relative strain (so-called "offset strain").
Figure 150: Load-displacement curve for 17x17 Zry-4 oxidized at 1200ºC to 17% CP-ECR and compressed at 135ºC; the 0.19 mm offset displacement corresponds to a 2% offset strain
A limiting offset strain of 2% was set to determine the ductile-to-brittle transition, the samples with ≥2% offset strain being classified as ductile. However, for samples with <2% offset strain, a complementary criterion was set on the permanent strain to clear identify if they were ductile or brittle. The permanent strain is based on the difference between the pre-test diameter and the post-test diameter measured in the loading direction. If the measured permanent strain was ≥1%, the sample was classified as ductile.
The as-fabricated alloys oxidised at 1000 and 1100°C to 5-20% CP-ECR and quenched at 800°C appeared ductile under ring compression at room temperature. This was no more the case for samples oxidised at 1200°C, as illustrated in Figure 151. The significantly lower ductile-to-brittle

DPAM/SEMCA 2008-093 A State-Of-The-Art Review Of Past Programmes Devoted To Fuel Behaviour Under Loss-Of-Coolant Conditions. Part 3.
161/239
Ce document est la propriété de l’IRSN et ne peut pas être communiqué ou reproduit sans son autorisation.
This document is IRSN proprietary and shall not be disseminated outside the Institute without its prior approval
transition ECR is clearly attributed to the increased oxygen diffusion in the β-phase at 1200°C. To remain consistent with the Hobson & Rittenhouse compression temperature, all 1200°C-oxidised samples were ring-compressed at 135°C.
0
10
20
30
40
50
60
70
0 5 10 15 20 25
Measured ECR, %
Off
set s
trai
n, %
1200 C
1100 C
1000 C
Figure 151: Effect of oxidation temperature on the post-quench ductility of Zircaloy-4 compressed at RT
4.6.1.1 Post-quench ductility for as-fabricated cla dding alloys
The ring compression tests at 135°C on as-fabricated alloys (Zircaloy-4, ZIRLO and M5) oxidised at 1200°C and subsequently quenched at 800°C indicated a ductile-to-brittle transition CP-ECR ranging from 15.6% to 20%. The lowest value is for 15x15 HBR-type Zry-4 and the highest value for M5. The 17x17 Zry-4, ZIRLO and M5 alloys were also tested after slow cooling from 1200°C to room temperature with no quench. The slow cooling appeared to have no effect on the ductile-to-brittle transition CP-ECR, even though the offset strains at lower CP-ECR may differ between quenched and slow-cooled samples.
4.6.1.2 Post-quench ductility for pre-hydrided clad ding alloys
As the high-burnup in-reactor operation is known to result in cladding corrosion and associated hydrogen pickup, pre-hydrided non-irradiated cladding was used as a surrogate of high-burnup cladding to generate the baseline data needed on the effect of hydrogen on embrittlement. Such tests with unirradiated samples being much easier to conduct, a relatively large number of tests can be performed to map out embrittlement as a function of various parameters: oxidation level, hydrogen content and quench temperature.
During the June-October 2004 period, pre-hydriding was performed at 400°C in a closed chamber on both modern 17x17 Zry-4 and HBR-type 15x15 Zry-4 alloys. The pre-hydriding method was later improved using a flowing 4%H2-96%Ar gas mixture at 350°C to provide HBR-type 15x15 Zircaloy-4 cladding specimens pre-hydrided to 180-880 wppm.
The results of ring compression tests at 135°C on pre-hydrided cladding oxidised at 1200°C and quenched at 800°C show a significant reduction in post-quench ductility as illustrated in Figure 152. For 15x15 Zry-4 oxidised to 5% CP-ECR at ≈1190°C maximum oxidation temperature, the ductile-to-brittle transition hydrogen content was determined to be ≈530 wppm. For specimens oxidised to 7.5% CP-ECR, the ductile-to-brittle transition hydrogen content was determined to be ≈ 375 wppm. For quench at 800ºC, post-quench ductility and ductile-to-brittle transition CP-ECR are therefore highly sensitive to hydrogen content.
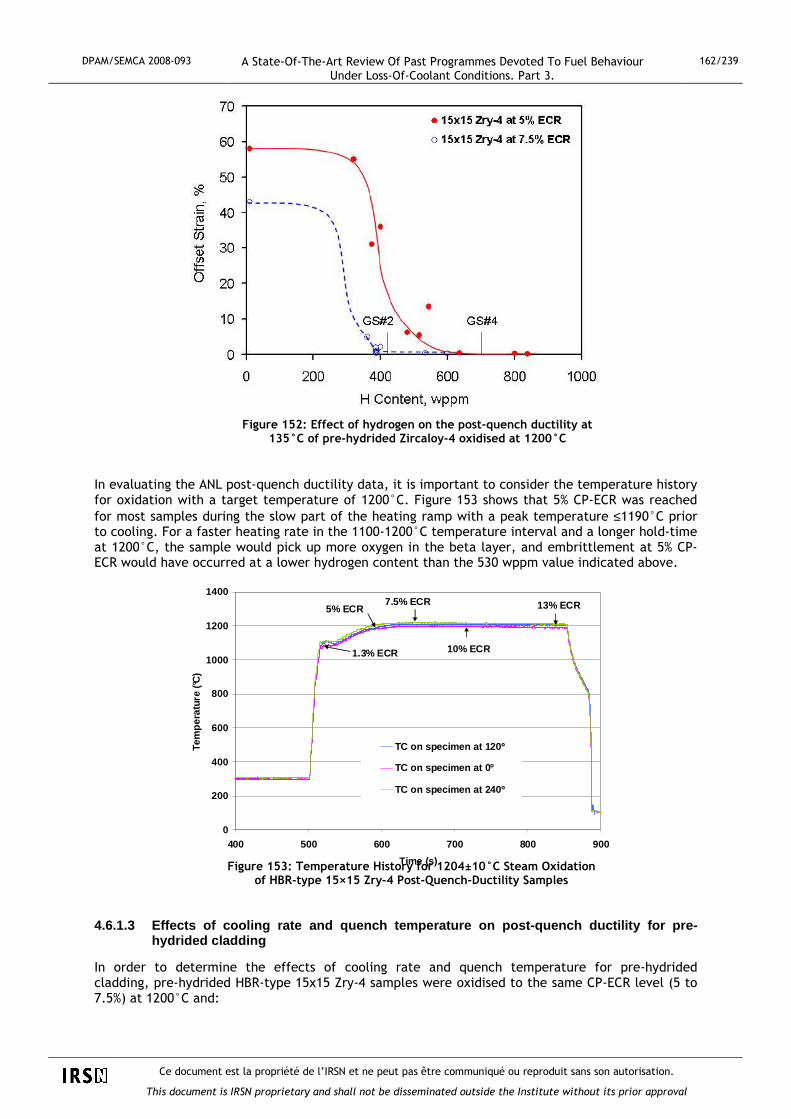
DPAM/SEMCA 2008-093 A State-Of-The-Art Review Of Past Programmes Devoted To Fuel Behaviour Under Loss-Of-Coolant Conditions. Part 3.
162/239
Ce document est la propriété de l’IRSN et ne peut pas être communiqué ou reproduit sans son autorisation.
This document is IRSN proprietary and shall not be disseminated outside the Institute without its prior approval
Figure 152: Effect of hydrogen on the post-quench ductility at
135°C of pre-hydrided Zircaloy-4 oxidised at 1200°C
In evaluating the ANL post-quench ductility data, it is important to consider the temperature history for oxidation with a target temperature of 1200°C. Figure 153 shows that 5% CP-ECR was reached for most samples during the slow part of the heating ramp with a peak temperature ≤1190°C prior to cooling. For a faster heating rate in the 1100-1200°C temperature interval and a longer hold-time at 1200°C, the sample would pick up more oxygen in the beta layer, and embrittlement at 5% CP-ECR would have occurred at a lower hydrogen content than the 530 wppm value indicated above.
Figure 153: Temperature History for 1204±10°C Steam Oxidation of HBR-type 15×15 Zry-4 Post-Quench-Ductility Samples
4.6.1.3 Effects of cooling rate and quench temperat ure on post-quench ductility for pre-hydrided cladding
In order to determine the effects of cooling rate and quench temperature for pre-hydrided cladding, pre-hydrided HBR-type 15x15 Zry-4 samples were oxidised to the same CP-ECR level (5 to 7.5%) at 1200°C and:
0
200
400
600
800
1000
1200
1400
400 500 600 700 800 900
Time (s)
Tem
pera
ture
(°C
)
TC on specimen at 120º
TC on specimen at 0º
TC on specimen at 240º
5% ECR7.5% ECR
10% ECR
13% ECR
1.3% ECR

DPAM/SEMCA 2008-093 A State-Of-The-Art Review Of Past Programmes Devoted To Fuel Behaviour Under Loss-Of-Coolant Conditions. Part 3.
163/239
Ce document est la propriété de l’IRSN et ne peut pas être communiqué ou reproduit sans son autorisation.
This document is IRSN proprietary and shall not be disseminated outside the Institute without its prior approval
- cooled at an average rate of 13°C/s to 800°C and quenched, or
- further cooled at an average rate of 3°C/s from 800 to 700°C and quenched, or
- further cooled at an average rate of 2°C/s from 700 to 600°C, and quenched, or
- further slow cooled at <<2°C/s from 600°C to room temperature.
Although the ductile-to-brittle transition CP-ECR of as-fabricated alloys was found relatively insensitive to slow-cooling to RT vs. quench at 800°C, this was no longer true for pre-hydrided HBR-type 15x15 Zry-4. Slow cooling to room temperature resulted in a small, but significant, enhancement in ductility. Slow cooling without quench increased the hydrogen embrittlement threshold from ≈530 wppm to ≈760 wppm at 5% CP-ECR and from ≈370 wppm to ≈550 wppm at 7.5% CP-ECR. This is illustrated in Figure 154, where cooling without quench appears to shift the ductile-to-brittle transition by about +200 wppm on the hydrogen threshold, or by about +2.5% on the ECR-CP threshold, as compared to the quench limits.
Figure 154: Embrittlement CP-ECR vs. H content for Zry-4 oxidized at
≤1200ºC and cooled with/without 800ºC quench
In two series of tests conducted with pre-hydrided Zry-4 oxidised at 1200°C to 6% and 7.5% CP-ECR for hydrogen contents of 450 wppm and 340 wppm respectively, the quench temperature was lowered from 800°C to 700°C or 600°C. The samples quenched at 600-800°C were all brittle, while the samples that were slow-cooled to RT retained a small level of ductility. These results suggest that the ductility enhancement arises only from slow cooling at <<2°C/s below 600°C. According to Billone et al., oxygen redistribution from 600°C to RT is highly unlikely due to the slow diffusivity of oxygen. Moreover, the phase transformation (β+α)→α is complete by about 750°C, so no further phase change is expected below 600°C. Therefore, the slight ductility enhancement upon slow-cooling to RT was attributed to hydrogen diffusion out of the matrix of prior-β grains and precipitation in very small hydrides during very slow cooling from 600°C to RT.
4.6.1.4 Post-quench ductility for high burn-up clad ding alloys
Tests with two-sided oxidised high burn-up HBR 15x15 zry-4
Two-sided oxidation tests were conducted at a target temperature of 1200°C with defueled cladding samples sectioned from a high burn-up H.B. Robinson (HBR) rod with an average burn-up of 64 GWd/tU. Five oxidation tests were conducted to ≈3-9% CP-ECR followed by slow cooling to room temperature. These samples had a corrosion layer thickness in the range of 70-75 µm and a hydrogen content of 550 wppm. A sixth test was conducted with oxidation at 1200°C to 7.5% CP-ECR and quench at 800°C on a sample having a corrosion-layer thickness of 95 µm and a H content of 740 wppm. The characterisation of the HBR rod also revealed a fuel-cladding bond layer well developed all around the circumference of the cladding inner surface, with a thickness of 11±4 µm.
0
1
2
3
4
5
6
7
8
9
10
11
12
13
14
15
16
17
18
0 100 200 300 400 500 600 700 800
Hydrogen Content (wppm)
Em
britt
lem
ent C
P-E
CR
(%
)
15x15 Zry-4 Quenched at 800ºC
17x17 Zry-4 Quenched at 800ºC
15x15 Zry-4 Cooled witout Quench

DPAM/SEMCA 2008-093 A State-Of-The-Art Review Of Past Programmes Devoted To Fuel Behaviour Under Loss-Of-Coolant Conditions. Part 3.
164/239
Ce document est la propriété de l’IRSN et ne peut pas être communiqué ou reproduit sans son autorisation.
This document is IRSN proprietary and shall not be disseminated outside the Institute without its prior approval
Ring-compression tests were performed at 135°C with ≈8 mm long samples sectioned from the oxidised and slow-cooled (or quenched) samples. Table 13 summarizes the results of the ring-compression tests for high burn-up HBR Zry-4 cladding samples.
Test ID# Hydrogen Content (wppm)
Test Timea
(s) Cooling
CP-ECR
(%)
Maximum Oxidation T (°C)
Offset Strain (%)
Permanent Strain (%)
2 550±100 62 Slow cooled 2.7 1110 >45 <43
1 550±100 93 Slow cooled 4.3 1169 ≈37 ---
3 550±100 132 Slow cooled 6.4 1196 4.0 2.6
5 550±100 155 Slow cooled 7.4 1197 4.0 2.9
6 740±110 155 Quenched 7.5 1197 0.2 0.8
4 550±100 206 Slow cooled 9.3 1198 0.5 0.6 aIncludes time for ramp from 300°C and hold time
Table 13: Results of ring-compression tests for high burn-up HBR Zry-4 cladding samples oxidised (two-sided) at 1110-1198°C and slow cooled to room temperature or quenched at 800°C
Comparison of the post-quench ductility results for pre-hydrided cladding (see Figure 152) with high burn-up results in Table 13 indicates that pre-hydrided samples at 5% CP-ECR have ductility values (≈9% offset strain) between the high- and low-ductility values for high burn-up cladding at 4.3% and 6.4% CP-ECR levels respectively. For 7.4% CP-ECR oxidised samples, slow-cooled high burn-up Zry-4 retains a low ductility while quenched pre-hydrided Zry-4 is highly brittle (0.5% offset strain) and slow-cooled pre-hydrided Zry-4 only just meets the ductile-to-brittle transition (1.1% permanent strain). Based on this limited comparison, high burn-up Zry-4 would appear to embrittle at higher CP-ECR and hydrogen content thresholds than pre-hydrided Zry-4. However, taking account of the higher heating rate for pre-hydrided samples, a more detailed comparison of the data for slow-cooled samples suggests that the ductility of pre-hydrided Zry-4 is comparable (within the data scatter) to the ductility of high burn-up Zry-4.
The comparison for quenched samples is much more limited with only one high burn-up sample having been quenched at 800°C after oxidation to 7.5% CP-ECR. Moreover, the high corrosion thickness (95 µm) and hydrogen content (740±110 wppm) made the comparison only marginal with pre-hydrided Zry-4 samples results. Consistent with pre-hydrided samples (>400 wppm H) oxidised at 1200°C to 7.5% CP-ECR and quenched at 800°C, this high bur-up sample was highly brittle (see Table 13).
Figure 155 shows the post-oxidation and post-quench ductility results as a function of CP-ECR for high burn-up Zry-4. Using interpolation, the ductile-to-brittle transition CP-ECR for these high burn-up samples appears at ≈8% following slow cooling to RT. Two points for quenched, pre-hydrided Zry-4 samples have been added, which may suggest that embrittlement CP-ECR for 550-wppm-H high-burn-up Zry-4 with quench at 800ºC is ≈5.5%. However, one or two more tests are needed with HBR high burn-up Zry-4 oxidised at 1200°C to 5±0.5% CP-ECR and 800°C quench to more accurately determine this ductile-to-brittle transition.

DPAM/SEMCA 2008-093 A State-Of-The-Art Review Of Past Programmes Devoted To Fuel Behaviour Under Loss-Of-Coolant Conditions. Part 3.
165/239
Ce document est la propriété de l’IRSN et ne peut pas être communiqué ou reproduit sans son autorisation.
This document is IRSN proprietary and shall not be disseminated outside the Institute without its prior approval
Figure 155: Ductility results (135ºC) for oxidized (≤1200ºC) high-burn-
up HBR Zry-4 cooled with and without quench
Tests with one-sided oxidised high burn-up HBR 15x15 zry-4
One-sided oxidation tests were also conducted at 1200°C with defueled cladding samples sectioned from another high burn-up HBR rod having a similar burn-up as the rod used to section the two-sided oxidation test samples. One particular characteristic of the one-sided oxidation tests is to involve longer test times at 1200°C, thus minimizing the effects of the ANL heating ramp in comparison with two-sided oxidation tests. Four oxidation tests were conducted at 1200°C to 5-9% CP-ECR with samples characterised by 70 µm corrosion layer thickness and 550 wppm hydrogen; two tests were conducted with samples from lower grid span locations, having ≈40-44µm corrosion layers and ≈360-400 wppm hydrogen. All samples were slow cooled from 1200°C without quench.
Test planning and initial data interpretation were based on CP-ECR calculated for outer-surface steam oxidation of bare cladding with no account for the oxygen source from the fuel-cladding bond. Because of concerns that steam leakage into the sample inner volume may have induced inner-surface oxidation and hydrogen pickup away from the sample mid-plane, only one 8-mm ring was sectioned from the mid-plane region for ring-compression testing at 135°C. Hydrogen analysis was performed on the ring after ring-compression testing.
Table 14 summarizes the pre- and post-oxidation hydrogen contents together with the results of the ring-compression tests for the six high burn-up HBR Zry-4 cladding samples that were one-sided oxidised at 1200°C.
Plastic strain (%) Test ID#
Pre-test H-Content (wppm)
Post-test H-Content (wppm)
Test timea (s)
One-sided CP-ECR(%) Offset Permanent
ID
oxidation
7 550±100 335±31 174 4.9 8.4 6.1 None
11 ≈400 570±70 174 4.8 3.7 2.5 TBEb
8 550±100 190±12 323 7.3 4.4 3.7 None
12 ≈360 570±70 323 7.1 0.9 0.9 TBEb
10 550±100 318±44 419 8.5 3.8 3.1 ≈15% at ends of ring
9 550±100 767±59 534 9.7 0.2 0.1 >80% at ends of ring
a: Includes time for ramp from 300°C and hold time b: To be examined
Table 14: Results of ring-compression tests for high burn-up HBR Zry-4 cladding samples oxidised (two-sided) at 1110-1198°C and slow cooled to room temperature or quenched at 800°C
0
10
20
30
40
50
60
0 2 4 6 8 10 12
CP-Predicted ECR (%)
Offs
et S
trai
n (%
)
High-burnup Zry-4, 550±100wppm H, cooled with no quench
High-Burnup Zry-4, 740±100wppm H, Quench at 800ºC
Pre-H Zry-4, 610±100 wppm H,Quench at 800ºC
Pre-H Zry-4, 510±100 wppm H,Quench at 800ºC

DPAM/SEMCA 2008-093 A State-Of-The-Art Review Of Past Programmes Devoted To Fuel Behaviour Under Loss-Of-Coolant Conditions. Part 3.
166/239
Ce document est la propriété de l’IRSN et ne peut pas être communiqué ou reproduit sans son autorisation.
This document is IRSN proprietary and shall not be disseminated outside the Institute without its prior approval
The ductility data for 1-sided and 2-sided-oxidised high burn-up HBR Zry-4 with ≈550-wppm H after cooling without quench are plotted in Figure 156 in the usual way vs. CP-ECR.
Figure 156: Ductility results (135ºC) for 1-sided and 2-sided high-burn-up HBR Zry-4 oxidised at1200ºC and cooled without quench
When plotted vs. CP-ECR, ductility values for the one-sided tests fall significantly below the data and trend line for the two-sided tests. Three factors have been considered to explain differences:
- the differences in heating rates and test times at 1200°C, more favourable for 2-sided tests;
- the additional oxygen source from a possible slow steam leakage in the sample inner volume during the one-sided tests;
- the effects of the fuel-cladding bond, not discerned in the presence of flowing steam in two-sided tests, but providing a significant source of oxygen in one-sided tests for growth of an alpha layer on the inner side and concurrent diffusion of oxygen into the beta layer.
Of the three factors, the fuel-cladding bond oxygen source - not accounted for in the one-sided CP-ECR calculation – was considered to be the dominant factor in reducing the ductility of the 1-S oxidised samples. It was therefore concluded that the CP-ECR values calculated to determine the ductile-to-brittle threshold for one-sided oxidised samples should be revised to account for additional oxygen sources on the cladding inner side, particularly from fuel-cladding bond and fuel.
At the time this report was compiled, only ductility results for high burn-up HBR Zry-4 cladding had been conducted. Tests with high burn-up ZIRLO and M5 cladding remain also to be conducted.
4.6.2 LOCA integral tests
LOCA integral tests have been conducted at ANL in the Alpha-Gamma Hot Cell Facility (AGHCF) which has been unavailable to programmatic work since July 2005. Four LOCA integral tests (ICL#1-4 series) with high burn-up BWR fuel rod samples from 9x9 Limerick fuel rods at 56 GWd/MTU have been completed. A series of out-of-cell LOCA integral tests (OCL series) was also conducted with unirradiated Zry-2 cladded rods filled with alumina pellets so as to benchmark the testing methods and to provide baseline data for in-cell tests with high burn-up fuel samples.
LOCA integral tests consist in rapidly heating (5°C/s) a 300 mm-long fuel segment under internal pressure in a steam environment, holding it at 1200°C for ≤5 minutes, cooling it (3°C/s) to 800°C and final quenching with water. The ICL#1 specimen was heated to bursting in argon and slowly cooled. The ICL#2 specimen was exposed to the LOCA test sequence with no quench. The ICL#3
0
10
20
30
40
50
60
0 2 4 6 8 10 12
CP-Predicted ECR (%)
Offs
et S
trai
n (%
)Two-Sided Oxidized
One-Sided Oxidized

DPAM/SEMCA 2008-093 A State-Of-The-Art Review Of Past Programmes Devoted To Fuel Behaviour Under Loss-Of-Coolant Conditions. Part 3.
167/239
Ce document est la propriété de l’IRSN et ne peut pas être communiqué ou reproduit sans son autorisation.
This document is IRSN proprietary and shall not be disseminated outside the Institute without its prior approval
specimen achieved partial quench before failure of the quartz chamber that surrounded the specimen; a full LOCA sequence was achieved in ICL#4.
Out-of-cell tests OCL#5 and OCL#11were companion tests to ICL#1 and ICL#2 respectively. The burst temperatures, pressures and maximum diametral strains were close for ICL#1 and OCL#5 as well as for ICL#2 and OCL#11, indicating that the high burn-up operation of the Limerick rods had little effect on cladding burst conditions and strains. This is certainly related to the low hydrogen content in these BWR rods. Maximum burst strains for ICL#1-4 ranged from 36±9% to 43±9%.
One specific result gained from the LOCA integral test concerns secondary hydriding. Hydrogen is released during inner-surface oxidation within the balloon region and a relatively high fraction of this hydrogen remains in the cladding interior while migrating towards the neck regions. For the unirradiated samples, there is little resistance to this migration, and the bare cladding inner surface absorbs a large amount of hydrogen with peaks near the neck regions at about ± 70 mm from the burst centre (see Figure 157).
Figure 157: Axial distribution of ECR (based on LECO and metallographic data)
and hydrogen pickup (based on LECO data) for OCL#11 sample
For the high burn-up samples, the axial extent of hydrogen that could migrate in contact with the cladding would be limited by the presence of the fragmented and possibly relocated fuel in the balloon. The local hydrogen absorption would also be limited by the fuel-cladding bond layer. Hydrogen and oxygen concentrations were measured for ICL#2 and ICL#3 samples at different axial positions below and above the burst centre, the results of which are shown in Figure 158 in terms of ECR and hydrogen pickup.
Figure 158: Axial distribution of ECR (based on LECO and metallographic data) and hydrogen pickup (based on LECO data) for ICL#2 and ICL#3 test samples

DPAM/SEMCA 2008-093 A State-Of-The-Art Review Of Past Programmes Devoted To Fuel Behaviour Under Loss-Of-Coolant Conditions. Part 3.
168/239
Ce document est la propriété de l’IRSN et ne peut pas être communiqué ou reproduit sans son autorisation.
This document is IRSN proprietary and shall not be disseminated outside the Institute without its prior approval
The peaks of the hydrogen pickup in the high burn-up samples have shifted towards the burst centre, compared with the unirradiated samples. However, the maximum hydrogen pickups are at a similar level for both high burn-up (≈3000 wppm) and unirradiated (3500-4000 wppm) samples. This indicates that the fuel-cladding bond layer is poorly protective with respect to hydrogen uptake into the cladding.
With respect to quench and post-quench behaviour, it should be pointed out that all four LOCA integral high burn-up samples remained intact during and following quench. These LOCA test samples were not subjected to the four-point-bend testing that was conducted on several unirradiated OCL samples. The post-quench ductility of high burn-up samples was therefore not determined. During the post-test sample handling, the ICL#3 sample was broken at three axial locations within 25 mm distance from the burst mid-plane. SEM fractography was performed at two of these locations, showing a failure region that appeared nearly brittle even in the prior-beta phase area. Given the combination of ECR and hydrogen pickup at these locations, it is very likely that these locations would have failed in a brittle mode upon ring-compression at 135°C.
At the time this report was compiled, only integral LOCA tests with high burn-up Limerick BWR rod segments had been conducted. Tests with high burn-up Zry-4 and M5 rods are still planned and remain to be conducted.

DPAM/SEMCA 2008-093 A State-Of-The-Art Review Of Past Programmes Devoted To Fuel Behaviour Under Loss-Of-Coolant Conditions. Part 3.
169/239
Ce document est la propriété de l’IRSN et ne peut pas être communiqué ou reproduit sans son autorisation.
This document is IRSN proprietary and shall not be disseminated outside the Institute without its prior approval
4.7 Quench tests by Sawatzky (AECL)
In 1991, Sawatzky et al. [87] published the results of quench resistance tests on CANDU cladding samples.
The experimental device is represented in Figure 159. The tested sample was a 162 mm long cylindrical capsule with an outer diameter of 15.2 mm and a thickness of 0.42 mm, containing a UO2 pellet between two zirconia spacers, sealed and pressurised in helium at 120 kPa. The inner pressure was maintained practically constant during the test owing to the connection with the external buffer tank. Heating was ensured by induction, the input power being controlled by the sample temperature measured by optical pyrometry.
Figure 159: Schematic diagram of the experimental
apparatus
The tests were started by a stabilisation phase in helium at the test temperature between 1250 K and 1800 K before the isothermal oxidation phase in steam was started. The samples were then quenched by water injection from the top of the test tube. In total, 128 capsules were tested. Most ruptures occurred in the central zone next to the measured temperature elevation. The cladding was considered ruptured when the internal overpressure no longer existed at the end of the test.
When the gaseous atmosphere was switched from helium to steam, the start of oxidation at the test temperature induced a fast energy release, which was not compensated by a sufficiently fast enough drop in the HF heating. This resulted in a temperature escalation for about 5 seconds, which could have reached an excess of 200 K for the highest oxidation temperatures. The resulting effect on the sample’s oxidation ratio was taken into account by calculating the equivalent duration teq leading to the same level of oxidation (in mass) under isothermal conditions as that for the escalation period in question; the experimental length of the oxidation phase was then corrected.
Applying the Sawatzky criterion as specified in § 4.3 requires calculating the oxygen concentration at cladding mid-thickness; this generally requires a diffusion calculation or an approximate solution. In order to analyse the results of their tests, the authors used the analytical solution developed by Pawel [74]. However, for temperatures below 1530 K the concentration Cβ/α at the interface remains lower than 0.7% and the remaining Zr-β layer thickness only remains to be determined (by metallography) in order to apply this criterion.
Figure 160 plots the test results in terms of the cladding thickness with less than 0.7 wt.% oxygen (equal to the prior beta layer thickness with less than 0.7 wt.% oxygen) in relation to the oxidation temperature and distinguishing between the intact or failed capsules following quench. The dashed line indicates the criterion limit (e=0.21 mm), which seems to represent a rather good failure at quench boundary seeing that only 3 of the 42 observed failures occurred above this limit.

DPAM/SEMCA 2008-093 A State-Of-The-Art Review Of Past Programmes Devoted To Fuel Behaviour Under Loss-Of-Coolant Conditions. Part 3.
170/239
Ce document est la propriété de l’IRSN et ne peut pas être communiqué ou reproduit sans son autorisation.
This document is IRSN proprietary and shall not be disseminated outside the Institute without its prior approval
Figure 160: Comparison between Sawatzky's failure criterion (dashed line) and experimental data
Figure 161 gives the oxidation time required to reach the criterion limit in relation to the temperature; the two branches of the curve correspond to the following ranges: 1) T<1530 K where e0.7 is determined from the oxide + Zr-α layers and 2) T>1530 K where e0.7 is calculated based on Pawel’s equation. The experimental points were plotted and also show good agreement with the recommended criterion as represented in the figure.
Figure 161: Failure map for Sawatzky's
failure criterion (solid line)

DPAM/SEMCA 2008-093 A State-Of-The-Art Review Of Past Programmes Devoted To Fuel Behaviour Under Loss-Of-Coolant Conditions. Part 3.
171/239
Ce document est la propriété de l’IRSN et ne peut pas être communiqué ou reproduit sans son autorisation.
This document is IRSN proprietary and shall not be disseminated outside the Institute without its prior approval
Figure 162 shows AECL experimental results in relation to the quench resistance criterion proposed by Chung & Kassner (Zr-β layer thickness containing less than 0.9 wt.% oxygen > 0.1 mm). For temperatures below 1600 K, the maximum concentration Cβ/α in the Zr-β layer remained below 0.9 wt.% and the thickness e0.9 of the corresponding experimental points was determined by metallography. The figure shows poor agreement between the experimental results and the Chung & Kassner failure criterion seeing that most of the observed failures occurred above the criterion limit.
Figure 162: Comparison between Chung & Kassner's failure criterion (dotted line) and experimental dataawatzky et al. suggested two possible explanations for such disagreement between their results and those by Chung and Kassner:
� The experimental method used to determine sample failure: loss of internal pressure in the Sawatzky tests, visible fragmentation in the ANL tests. As the first method tends to be more restrictive, a more conservative criterion should be obtained.
� A size-based effect (D=15.2 mm, e=0.42 mm for CANDU cladding, versus D=10.9 mm, e=0.635 mm for LWR cladding in the ANL tests) resulting in different stress fields, in principle more severe for CANDU cladding.
DPAM/SEMCA 2008-093 A State-Of-The-Art Review Of Past Programmes Devoted To Fuel Behaviour Under Loss-Of-Coolant Conditions. Part 3.
172/239
Ce document est la propriété de l’IRSN et ne peut pas être communiqué ou reproduit sans son autorisation.
This document is IRSN proprietary and shall not be disseminated outside the Institute without its prior approval
4.8 JAERI test program
Research at the beginning of the 1980s by Furuta, Uetsuka and Kawasaki in Japan greatly contributed to embrittlement studies on Zircaloy cladding under LOCA conditions with unirradiated material [88]. This work has been continued within the scope of the research program currently underway at JAEA on the behaviour of irradiated material at high burn-ups [89]. A number of different test series were carried out consecutively. A brief description of the experimental characteristics is provided below before we analyse in detail the main elements of the results obtained by the authors.
4.8.1 Experimental characteristics
For the sake of clarity, we have classified the tests into 6 series, noted A to F below; the five series A to E include tests between 1978 to 1983, whereas the F series covers recent tests from the program currently underway.
In tests prior to 1985, PWR 14x14-type Zircaloy-4 cladding with a thickness of 0.7 mm was used in the series A to D, whereas a cladding thickness of 0.62 mm was used in the E series. In tests performed from 1999, PWR 17x17-type Zircaloy-4 low-tin cladding was used with inner and outer diameters of 8.36 mm and 9.50 mm, and a thickness of 0.57 mm.
A Series [29]
These tests were performed on 15 mm-long tube rings that were oxidised in flowing steam under isothermal conditions between 900°C and 1330°C before being subjected to diametral compression at 100°C.
Several samples were pre-oxidised beforehand in pressurised water at 300°C. The short pre-oxidation time (74 h) did not make it possible to reach significant oxidation levels (eox < 1 µm).
B Series [90]
These tests were performed on 200 mm Zircaloy-4 tubes containing alumina pellets that were sealed and pressurised in argon under a pressure of 10 to 50 bar.
These tests included swelling transients up to rupture, followed by isothermal oxidation in a furnace under flowing steam within the 880-1227°C temperature range before cooling in air.
After cooling, the ruptured tube was cut into 15 mm-long segments, with these segments having been subjected to diametral compression tests at 100°C.
C Series [91]
These were demonstrative-based tests on 15 mm-long tube rings (as for the A series), oxidised in a furnace under isothermal conditions at a temperature between 890°C and 1194°C in a stagnant steam atmosphere. This stagnant atmosphere was obtained by evaporating a small quantity of water in a quartz tube that had been closed, vacuum-evacuated and heated beforehand. The steam pressure was about 0.25 bar.
Following oxidation, the samples were cooled in air and subjected to diametral compression tests at 100°C.
These tests were used to compare the ductility of samples oxidised in stagnant steam with the ductility of samples having been subjected to similar oxidation in flowing steam. It was therefore possible to demonstrate the role of hydrogen in the embrittlement process.
D Series [64]
Theses were analytical tests on 15 mm-long rings, oxidised under a flowing mixture of steam + hydrogen under isothermal conditions at temperatures of 950, 1000, 1050 or 1100°C; the volume ratio Vhyd/Vvap varied between 0.05 and 2.
After oxidation, the samples were cooled in air and subjected to diametral compression tests at 100°C.

DPAM/SEMCA 2008-093 A State-Of-The-Art Review Of Past Programmes Devoted To Fuel Behaviour Under Loss-Of-Coolant Conditions. Part 3.
173/239
Ce document est la propriété de l’IRSN et ne peut pas être communiqué ou reproduit sans son autorisation.
This document is IRSN proprietary and shall not be disseminated outside the Institute without its prior approval
Following observations from the previous B and C series, these analytical tests were designed to quantify the effect of hydrogen in a mixture of steam + hydrogen, as found on the rod inner surface after burst.
E Series [92]
These were tests on 500 mm-long rods with alumina pellets that were sealed and pressurised at 50 bar.
Integral-type tests were performed: swelling up to rupture, isothermal oxidation between 920°C and 1330°C in a furnace under flowing steam, followed by reflood from the bottom at either the oxidation temperature or 500°C.
It was possible to test an important option during these tests: the presence or absence of axial constraint during the reflood phase achieved by blocking the rod ends and including the measurement of axial loads.
F Series [89,93]
These tests were performed on 190 to 600 mm-long rods with alumina pellets that were sealed and pressurised at 5 MPa, and were very similar to tests from the E series.
Integral-type tests were performed: swelling up to rupture, isothermal oxidation between 1000°C and 1250°C in a furnace under flowing steam, followed by slow cooling to 800°C and reflood from the bottom.
As-received Zircaloy-4 cladding was used in the reference tests. In order to study the behaviour of irradiated cladding, different types of samples were used in these tests:
- Non-irradiated cladding, thinned to 0.513 mm (∼ 10%) and pre-hydrided at 100 to 1200 wppm H, - Cladding of irradiated rods removed from commercial LWRs (BU ∼ 39 -79 GWd/t).
In this test series, axial constraint during the reflood phase was also applied to the rod either by total blockage of the rod ends (full restraint) or by applying a controlled intermediate load.
4.8.2 Compression tests on non-ballooned rings oxid ised in flowing steam (A Series)
This series was mainly composed of isothermal oxidation tests performed between 900°C and 1330°C in an unlimited flow of steam with the main objective of determining the parabolic rate law constants for weight gain, ZrO2 and ZrO2+α-Zr[O] layers growth. The results of these oxidation tests were discussed in § 3.1.3.
The ductility of oxidised samples was measured by diametral compression tests (up to ∆d = 6 mm) at 100°C. Figure 163 shows the ductility in terms of the parameter d0.8 (pseudo-plastic deflection when the load drops to 80% of the maximum value after having registered it); this deflection is half way between purely plastic deflection d1 and total deflection at maximum load used by Meservey & Graber, Scatena, UKAEA Springfields, and the CEA. Chung & Kassner also tabulated this deflection.
Figure 163: Schematic illustration of typical load vs. deflection curve from diametral compression test on oxidized ring-like Zircaloy specimens

DPAM/SEMCA 2008-093 A State-Of-The-Art Review Of Past Programmes Devoted To Fuel Behaviour Under Loss-Of-Coolant Conditions. Part 3.
174/239
Ce document est la propriété de l’IRSN et ne peut pas être communiqué ou reproduit sans son autorisation.
This document is IRSN proprietary and shall not be disseminated outside the Institute without its prior approval
Figure 164 summarises the ductility measurements in relation to either the oxidation calculated according to the Baker-Just equation (lower x-axis) or the “measured” cladding weight gain (upper x-axis, calculated in reality according to Kawasaki’s best-estimate equation).
Deflection d0.8 at the limits of the Japanese acceptance criteria (T=1473°K, ECR=15% calculated by the Baker-Just equation) is close to 1 mm.
Figure 164: Ductility of steam-reacted Zircaloy tubes as functions of the amount of oxidation calculated by the Baker-Just equation and temperature
It is worth mentioning that Figure 164 – taken from [29] and [88] – contains a scale error of √2 for the upper x-axis, except at 950°C. The upper x-axis is correct in the JAERI-M-6601 report (Figure 165) [94] and the NUREG-TR-014 report (Figure 166) [28]. This is probably the result of confusion between Kp and δ2/2 in the calculation with Kawasaki’s correlation.
Figure 165: id. Figure164
Figure 166: Ductility of steam-reacted Zircaloy tubes
as a function of the weight gain

DPAM/SEMCA 2008-093 A State-Of-The-Art Review Of Past Programmes Devoted To Fuel Behaviour Under Loss-Of-Coolant Conditions. Part 3.
175/239
Ce document est la propriété de l’IRSN et ne peut pas être communiqué ou reproduit sans son autorisation.
This document is IRSN proprietary and shall not be disseminated outside the Institute without its prior approval
The samples retained a certain degree of ductility for temperatures ranging between 1273 K and 1473 K with an oxidation ≤ 17% ECR calculated by the Baker-Just equation, which is consistent with Hobson’s results. Samples oxidised at 1286°C and 1330°C were brittle despite little weight gain, which justified the PCT criterion of 1204°C. However, at the oxidation temperature of 950°C, ductility dropped to zero as early as 10% ECR calculated by the Baker-Just equation or with a measured weight gain of 7 mg/cm² (Figure 167).
Figure 167: Ductilities of steam reacted Zircaloy tubes at 950°C as functions of weight gain and time
However, this weight gain corresponded to an oxidation time of 75 min, which is much longer than the duration of a typical LOCA transient (Hobson’s samples oxidised at 927°C did not exceed 60 min). This seems to be due to the fact that the oxide layer and weight gain increase at a slow cubic rate at 950°C, whereas the α-Zr(O) layer growth and especially the oxidation diffusion in the β-Zr phase both continue at a relatively faster parabolic rate. The following calculation was established to quantify this:
- Based on Tables 5 & 6 in [31], cubic weight gain laws at 905°C and 956°C were established;
- Based on these cubic laws and the parabolic laws at higher temperature from Table 18 of the same report, the oxidation time required to reach 14% ECR (Cathcart-Pawel) for 0.7 mm thick cladding was calculated;
- Lastly, based on the ORNL oxygen diffusion correlation [95], √Dt was calculated at this instant, with D representing the diffusion coefficient and t representing the time.
The results are given in Figure 168: at the instant where 14% ECR-CP is reached, √Dt greatly exceeds half of the thickness at 900°C and 950°C (two-sided oxidation), which means that the cladding is therefore completely brittle well beforehand. The ECR criterion is therefore not suitable for transients below 1000°C for Zircaloy. In such cases, the ECR criterion should be replaced by a criterion based on the duration divided by the square of the metal thickness before oxidation but after ballooning and possible bursting. It is therefore not a question of safety but more so of finding a suitable criterion.

DPAM/SEMCA 2008-093 A State-Of-The-Art Review Of Past Programmes Devoted To Fuel Behaviour Under Loss-Of-Coolant Conditions. Part 3.
176/239
Ce document est la propriété de l’IRSN et ne peut pas être communiqué ou reproduit sans son autorisation.
This document is IRSN proprietary and shall not be disseminated outside the Institute without its prior approval
Figure 168: Square root of Dt at the moment where 14% ECR is reached for JAERI cladding calculated with the ORNL diffusion coefficient and based on Table 18 from ORNL/NUREG-17 for T>956°C and Tables 5 & 6
at 905°C and 956°C (cubic law)
The same problem may be encountered at 1000°C for certain alloys with 1% niobium. Whereas the weight gain kinetics of the M5 alloy were similar to those of Zircaloy at 1100°C and above, the M5 alloy kinetics remained parabolic at 1000°C but significantly slower than the Zircaloy kinetics (Figure 169) [96].
Figure 169: Comparison of measured vs. predicted weight gain from steam oxidation at 1000°C for
machined-and-polished E110 tested at ANL, as-received M5 tested at ANL and M5 tested in the CINOG experiments (Predicted values are based on the integration of the Cathcart-Pawel rate equation over the temperature profile)
0
200
400
600
800
1000
1200
1400
6.5 7 7.5 8 8.5 9
10000/T (K -1)
(Dt_
14%
EC
R)*
*0.5
(µm
)
(Dt_14%ECR)**0.5
Trend for T>1000°C

DPAM/SEMCA 2008-093 A State-Of-The-Art Review Of Past Programmes Devoted To Fuel Behaviour Under Loss-Of-Coolant Conditions. Part 3.
177/239
Ce document est la propriété de l’IRSN et ne peut pas être communiqué ou reproduit sans son autorisation.
This document is IRSN proprietary and shall not be disseminated outside the Institute without its prior approval
A similar Russian alloy, G110, proved to be brittle at 1000°C with a measured ECR of 8.5% but it had been oxidised for 84 min to reach this oxidation ratio (Figure 170) [97].
Figure 170: Residual ductility of E110, G110 and Zry-4 claddings vs. ECR and the oxidation temperature
4.8.3 Compression tests on ballooned, burst and oxi dised rods (B Series)
In this series, the initially pressurised rods were subjected to a transient with a temperature ramp of 15°C to 20°C/s during which the cladding swelled until rupture occurred around 850-950°C. A temperature plateau was then maintained at a higher level (880-1167°C) for 35 to 480 seconds, before final cooling in air. After cooling, the ruptured tube was cut into 15 mm-long segments which were subjected to diametral compression tests at 100°C.
The isothermal oxidation phase was therefore rather representative of a post-rupture LOCA phase with steam ingress in the pellet-cladding gap via the balloon opening resulting in internal oxidation.
The heating was carried out in an infrared furnace that led to an axially homogeneous temperature field, contrary to the ANL tests by Chung and Kassner.
Figure 171 summarises the main observations drawn from this test series with the example of a previously ruptured rod, oxidised at 1059°C for 240 seconds. In relation to the distance from the rupture opening of the different 15 mm-long segments, the figure provides the distributions of:
- Inner oxide layer,
- Absorbed hydrogen content,
- Deflection d0.8 at 100°C.
It appeared that:
• The inner oxide thickness was maximum on the ruptured section, which tended to rapidly decrease with the distance from the rupture before reaching zero at ±60 mm from the opening;
• The absorbed hydrogen distribution produced a W-shape with 2 maximums located at ±30 mm from the rupture opening: pickup exceeded 700 and 1300 wppm for these maximums;
• The deflection d0.8, – representing the residual ductility of the segments – showed an inverse distribution to that of the hydrogen pickup; the minimum ductility corresponded perfectly to the hydrogen pickup maximums.

DPAM/SEMCA 2008-093 A State-Of-The-Art Review Of Past Programmes Devoted To Fuel Behaviour Under Loss-Of-Coolant Conditions. Part 3.
178/239
Ce document est la propriété de l’IRSN et ne peut pas être communiqué ou reproduit sans son autorisation.
This document is IRSN proprietary and shall not be disseminated outside the Institute without its prior approval
Figure 171: Correlation between distributions of inner surface oxide layer
thickness, ring-compression deflection and absorbed hydrogen content
In this two-sided oxidation configuration on ruptured cladding, this correspondence between deflection d0.8 and hydrogen pickup seems to suggest that the absorbed hydrogen may play an important or even decisive role over that of oxygen upon the final embrittlement of Zircaloy, whereas no connection can be clearly established with the distribution of the inner oxide layer thickness.
Figure 172 represents the ductility – expressed by d0.8 – of the different segments from various rods tested at different temperatures for 240 seconds and plotted in relation to the corresponding hydrogen fraction. A very significant reduction (by a factor of > 10) in ductility can be observed for hydrogen concentrations greater than 500 wppm and particularly for oxidation temperatures >1000°C. Furthermore, the authors identified behaviours for 932-972°C and 1000-1167°C temperature intervals. The influence of the Zircaloy microstructure was suggested to explain the more pronounced effect in the >1000°C interval: in two phase α (hexagonal closed-packed) + β (centred cubic) for the 810-980°C temperature range, and β only for the temperature range > 1000°C.
In this figure, the ductile-brittle transition – expressed in terms of d0.8 at 100°C – seems to be located somewhere between 0.5 and 1 mm. This is consistent with the value (1 mm) estimated on the basis of the A series in terms of oxidation embrittlement only.

DPAM/SEMCA 2008-093 A State-Of-The-Art Review Of Past Programmes Devoted To Fuel Behaviour Under Loss-Of-Coolant Conditions. Part 3.
179/239
Ce document est la propriété de l’IRSN et ne peut pas être communiqué ou reproduit sans son autorisation.
This document is IRSN proprietary and shall not be disseminated outside the Institute without its prior approval
Figure 172: Correlation between ring-compression deflection values and absorbed hydrogen
contents measured at various positions on specimens oxidised at various temperatures
The same authors [98] made an interesting comparison between the ductility of tubes that had been oxidised on both sides in flowing steam (series A) and the ductility of segments from the B series that were oxidised on both sides owing to the steam ingress after cladding failure.
Figure 173 shows the load at rupture and the deflection d0.8 in relation to the weight gain calculated with Kawasaki’s equation given in Ref.[29] for tubes (A series) and segments (B series); the minimum value measured on the different sections of the same rod was chosen for the segments. For each rod, these figures clearly show that there are segments with significantly lower ductility than those of tubes with the same calculated oxidation ratio. These segments seemed brittle with a calculated oxidation ratio as low as 3% (1.5% on the outer surface).
Figure 173: Variation of fracture load and deflection obtained from ring compression tests with weight gain for segments of ruptured cladding and tubes oxidized in flowing steam

DPAM/SEMCA 2008-093 A State-Of-The-Art Review Of Past Programmes Devoted To Fuel Behaviour Under Loss-Of-Coolant Conditions. Part 3.
180/239
Ce document est la propriété de l’IRSN et ne peut pas être communiqué ou reproduit sans son autorisation.
This document is IRSN proprietary and shall not be disseminated outside the Institute without its prior approval
Under identical external conditions, the difference in ductility between tubes and segments can only be explained by the contribution related to internal oxidation including the prevailing influence of hydrogen absorbed several centimetres from the rupture.
By metallographic examination and X-ray diffraction on samples having absorbed 700 wppm of hydrogen, the authors were able to reveal the presence of hydride δ-ZrH1.5 near the Zr-β grain boundaries. The precipitation of hydrides during cooling is responsible for the increased embrittlement of the segments in comparison to the tubes, as revealed by the comparison of ductilities at 100°C.
The specificity of this embrittlement remained to be confirmed in relation to the conditions governing the inner surface of the ruptured rods (stagnant atmosphere, steam + hydrogen mixture). Any possible threshold values of parameters governing the process also need to be determined. This was done in the C and D series respectively.
4.8.4 Compression tests on tubes oxidised in a stag nant atmosphere (C Series)
4.8.4.1 Test results
In these tests, 15 mm-long tubes were isothermally oxidised between 890°C and 1194°C in a stagnant steam atmosphere, before being subjected to diametral compression tests at 100°C.
Figure 174 shows the deflection d0.8 in relation to the weight gain. It can be seen that the parameter d0.8 – characteristic of ductility – rapidly drops to a low residual level (<0.5 mm) when the weight gain reaches and exceeds 2 mg/cm2. With such low deflection d0.8, the sample can be considered completely brittle. However, the oxidation ratio corresponding to a weight gain of 2 mg/cm2 is relatively low, about 2.5% ECR, i.e.: well below the threshold values of the most conservative criteria.
Figure 174: Correlation between values of ring-compression deflection and weight gain
measured on specimens oxidised at various temperatures
Figure 175 compares measured deflections d0.8 – plotted in relation to the weight gain – for these tests in stagnant steam and for tests in flowing steam (from the A series) at temperatures of 950°C to 1150°C. Results clearly indicate that the weight gain, and thus the absorbed oxygen, was not the main factor responsible for the embrittlement of Zircaloy oxidised in stagnant atmosphere.

DPAM/SEMCA 2008-093 A State-Of-The-Art Review Of Past Programmes Devoted To Fuel Behaviour Under Loss-Of-Coolant Conditions. Part 3.
181/239
Ce document est la propriété de l’IRSN et ne peut pas être communiqué ou reproduit sans son autorisation.
This document is IRSN proprietary and shall not be disseminated outside the Institute without its prior approval
Figure 175: Difference in correlation between values of ring compression deflection and weight gain of oxidised Zircaloy measured in two different experiments
Figure 176 plots the hydrogen amounts generated and absorbed for 5 tests lasting 4 minutes at temperatures of 904, 939, 991, 1030 and 1072°C respectively. The amount of generated hydrogen is represented as the content in the Zircaloy assuming all of it to be absorbed in the sample. When focusing on the hydrogen absorbed during the oxidation process, this figure shows that the fraction of absorbed hydrogen increases with the temperature to reach 50% to 60% between 1000°C and 1100°C.
The authors pointed out that the amount of non-absorbed hydrogen remaining in the test vessel was generally constant from one test to another. This suggests that the fraction of hydrogen exceeding a certain critical value would be absorbed during oxidation. This interesting observation announced the results of analytical tests performed in a steam + hydrogen mixture from the following D series.
Figure 176: Variations in the amount of generated hydrogen, absorbed hydrogen and hydrogen absorption ratios, with the oxidation temperature as parameter

DPAM/SEMCA 2008-093 A State-Of-The-Art Review Of Past Programmes Devoted To Fuel Behaviour Under Loss-Of-Coolant Conditions. Part 3.
182/239
Ce document est la propriété de l’IRSN et ne peut pas être communiqué ou reproduit sans son autorisation.
This document is IRSN proprietary and shall not be disseminated outside the Institute without its prior approval
Figure 177 shows the variations in the deflection d0.8 in relation to the amount of absorbed hydrogen for various tests; the ductility rapidly decreases when CH increases up to about 500 wppm before stabilising at a residual value of < 0.5 mm. The curve trend is comparable to that of Figure 174 because the hydrogen pickup remains roughly proportional to the weight gain associated with oxidation.
Figure 177: Correlation between ring compression deflection values and absorbed hydrogen contents measured at various positions on specimens oxidised at various temperatures
The effect of hydrogen is nevertheless considered dominant owing to its greater diffusivity: when calculating diffusion lengths (L=√Dt) in the Zr-β layer for an oxidation of 4 minutes at 1000°C, values of 95 µm are estimated for oxygen and 2450 µm for hydrogen, to be compared with the cladding thickness which was 725 µm in these tests. At the same time, hydrogen diffused throughout the cladding thickness when oxygen was only present on the periphery. As commonly agreed, embrittlement would appear during cooling owing to the precipitation of hydrides when the solubility limit of hydrogen in Zircaloy drops below the quantities absorbed at high temperature during oxidation.
The results of these tests are represented in Figure 178 in the form of a ductility map at 100°C in relation to the ECR and the hydrogen content. The two most restrictive points are as follows:
- CH = 535 wppm and ECR = 2.6 %, - CH = 755 wppm and ECR = 2.2 %.
Figure 178: Compression tests on rings oxidised in stagnant steam Ductility map (based on d0,8) in relation to the ECR and the hydrogen content
(according to Table 2 by JAERI/M-8081)
1
10
10 100 1000 10000Hydrogen content (wppm)
EC
R (
%)
d0,8>0,9mmd0,8<0,5mm

DPAM/SEMCA 2008-093 A State-Of-The-Art Review Of Past Programmes Devoted To Fuel Behaviour Under Loss-Of-Coolant Conditions. Part 3.
183/239
Ce document est la propriété de l’IRSN et ne peut pas être communiqué ou reproduit sans son autorisation.
This document is IRSN proprietary and shall not be disseminated outside the Institute without its prior approval
4.8.4.2 Application to high burn-up Zircaloy-4 clad ding
These tests from the C series were the only JAERI tests in which both the weight gain (thus ECR) and the hydrogen content were measured. As Zircaloy-4 cladding also absorbs a significant amount of hydrogen during in-reactor corrosion to high burn-up, these tests provide a preliminary estimate of the ECR criterion for Zircaloy-4 at high burn-up.
♦ Hydrogen content of 535 wppm
Figure 178 indicated a null ductility with this concentration at 100°C for an ECR of 2.6%. As the reference temperature of 135°C is higher than 100°C, 2.6% is therefore a lower bound for the ECR criterion at 535 wppm. To obtain an upper bound, the slope of the zero-ductility-ECR in relation to the ductility test temperature was maximised by assuming zero ductility at 25°C as soon as 0% ECR and linear variation like Hobson. An upper bound of 3.8% was thus obtained for the ECR criterion at 535 wppm. The ECR criterion at 535 wppm therefore ranged between 2.6 and 3.8%, with an approximate value of 3%.
♦ Hydrogen concentration of 755 wppm
Figure 178 indicated a null ductility with this concentration at 100°C for an ECR of 2.2%. As the reference temperature of 135°C is higher than 100°C, 2.2% is therefore a lower bound for the ECR criterion at 755 wppm. To obtain an upper bound, the slope of the zero–ductility-ECR in relation to the ductility test temperature was maximised by assuming zero ductility at 25°C as soon as 0% ECR and linear variation like Hobson. An upper bound of 3.2% was obtained for the ECR criterion at 755 wppm. The ECR criterion at 755 wppm therefore ranged between 2.2 and 3.2%, with an approximate value of 2.5%.
This reduction in the zero ductility limit for hydrided Zircaloy (or at high burn-up) is indirectly and partially taken into account in both French and US safety authority practices, according to which the ECR criterion for an irradiated fuel cladding applies to the sum of initial corrosion plus transient oxidation. This reduces the acceptable ECR transient limit in terms of the quantity of initial corrosion (accompanied by hydrogen absorption). To refine and supplement these values, oxidation tests will need to be performed on pre-hydrided samples followed by ring compression tests, and supplemented by several tests on samples at high burn-up; this is one of the objectives of the ANL tests currently underway.

DPAM/SEMCA 2008-093 A State-Of-The-Art Review Of Past Programmes Devoted To Fuel Behaviour Under Loss-Of-Coolant Conditions. Part 3.
184/239
Ce document est la propriété de l’IRSN et ne peut pas être communiqué ou reproduit sans son autorisation.
This document is IRSN proprietary and shall not be disseminated outside the Institute without its prior approval
4.8.5 Compression tests on tubes oxidised in a flow of steam + hydrogen (D Series)
These tests were designed to quantify the effect of hydrogen within a mixture of steam + hydrogen by studying the ductility of samples oxidised in a gaseous flow of various compositions.
The effect of the hydrogen concentration upon the oxidation kinetics was discussed in § 3.6.4
Figure 179 illustrates the effect of the hydrogen fraction f in the mixture upon ductility (quantified by the deflection d0.8 at 100°C) of samples oxidised at different temperatures and for different times. It was therefore possible to observe at fixed temperatures and times that though deflection was constant for f below the critical fraction fc, it tended to decrease when f exceeded fc, almost dropping to zero with the longest durations. In this case however, the weight gain W – thus the ECR – was lower than at values f < fc (see Figure 88). At 950°C, deflection decreases at a more progressive rate but also ends up dropping to zero with the longest durations.
Figure 179: Variation in the ductility of oxidised specimens with the volume fraction in a steam-hydrogen
mixture
It is therefore obvious that oxidation is not a dominant embrittlement factor for samples that have been oxidised in a mixture of steam + hydrogen with a volume fraction of Vhy/Vvap greater than the critical fraction.
In Figure 180, deflection d0.8 is plotted in relation to the quantity of absorbed hydrogen and seems almost independent from the oxidation time and temperature. This variation is practically identical to that in Figure 172. It shows that the embrittlement of samples oxidised in an atmosphere of steam + hydrogen – obtained either artificially (in the D series), or naturally on the inner surface of ruptured cladding – is mainly determined by the amount of absorbed hydrogen.

DPAM/SEMCA 2008-093 A State-Of-The-Art Review Of Past Programmes Devoted To Fuel Behaviour Under Loss-Of-Coolant Conditions. Part 3.
185/239
Ce document est la propriété de l’IRSN et ne peut pas être communiqué ou reproduit sans son autorisation.
This document is IRSN proprietary and shall not be disseminated outside the Institute without its prior approval
Figure 180: Effect of hydrogen content on the ring-compression deflection of Zircaloy-4 oxidized
in a gaseous mixture of steam and hydrogen
4.8.6 Integral-type tests prior to 1985 (E Series)
This series was performed on simulated fuel rods composed of 500 mm-long Zircaloy-4 tubes containing alumina pellets and pressurised in helium at 30 bar at room temperature.
The test cross section illustrated in Figure 181 is composed of a quartz tube placed in the centre of an infrared furnace. The temperature was measured with 3 Pt-Pt13%Rh thermocouples spot-welded to the outer surface of the rod at mid-height and 60 mm away on each side. The test transient was an integral type: temperature ramp resulting in swelling and rupture, followed by isothermal oxidation between 920°C and 1330°C, and final reflood by water injection from the bottom housing.
Figure 181: Schematic diagram of the experimental apparatus

DPAM/SEMCA 2008-093 A State-Of-The-Art Review Of Past Programmes Devoted To Fuel Behaviour Under Loss-Of-Coolant Conditions. Part 3.
186/239
Ce document est la propriété de l’IRSN et ne peut pas être communiqué ou reproduit sans son autorisation.
This document is IRSN proprietary and shall not be disseminated outside the Institute without its prior approval
An important parameter – tested in this test series – was the presence or absence of axial tensile loads on the rod during reflood. This was achieved by blocking the ends of the rod just at the beginning of the reflood phase, and continuously measuring the corresponding load. This load was susceptible of representing that expected to occur on a rod in a PWR assembly over one grid-span height, owing to differential axial shrinkage between guide tubes and rods. It was assumed that the rods were more or less blocked in the grid just before reflood owing to swelling and any chemical interactions between the respective materials. The axial shrinkage of a test rod was measured and found to range between 1.5 and 2.5 mm. This axial shrinkage was also deemed representative of the differential shrinkage between PWR rods and guide tubes over one grid-span height.
A typical curve illustrating temperature and load variations is given in Figure 182.
Figure 182: Typical temperature-time and load-time curves from a rod-burst / bottom flooding test
For rods having survived quenching, an additional tensile test was carried out at room temperature until fracture.
After testing, a certain number of rods were cut into 15 mm-long segments for metallographic examination to measure the oxide and metal phase thicknesses and for hydrogen analysis.
Figure 183 provides the results of quench tests performed on non-restrained rods oxidised between 970°C and 1330°C for different oxidation times. The figure also shows the iso-values of the Equivalent Cladding Reacted (ECR) at 15, 20 and 40%, calculated with the Baker-Just equation. This made it possible to determine the failure boundary between 35% and 38% oxidation (ECR-BJ) for oxidation temperatures greater than 1050°C; the limit is lower (about 30%) at lower temperature. According to the authors, this difference is likely due to an underestimation of the real oxidation rate by the Baker-Just equation in the temperature range in which the breakaway phenomenon occurs, increasing the oxidation kinetics for relatively long oxidation times.

DPAM/SEMCA 2008-093 A State-Of-The-Art Review Of Past Programmes Devoted To Fuel Behaviour Under Loss-Of-Coolant Conditions. Part 3.
187/239
Ce document est la propriété de l’IRSN et ne peut pas être communiqué ou reproduit sans son autorisation.
This document is IRSN proprietary and shall not be disseminated outside the Institute without its prior approval
Figure 183: Failure map for Zircaloy-4 cladding by thermal shock under no constraint condition relative to duration and temperature of isothermal oxidation after rupture in steam
Figure 184 shows the results of tests on axially-restrained rods during the reflood phase, with the same ECR iso-values at 15, 20 and 40%. This time, the failure boundary appears around 19% to 24% ECR, which is significantly lower than that for axially-unrestrained cladding.
The authors only pointed out that this limit still leaves a suitable safety margin in relation to the ECR ≤15% criterion in Japanese acceptance criteria for ECCS..
Figure 184: Failure map for Zircaloy-4 cladding by thermal shock under constraint condition relative to duration and temperature of isothermal oxidation after rupture in steam
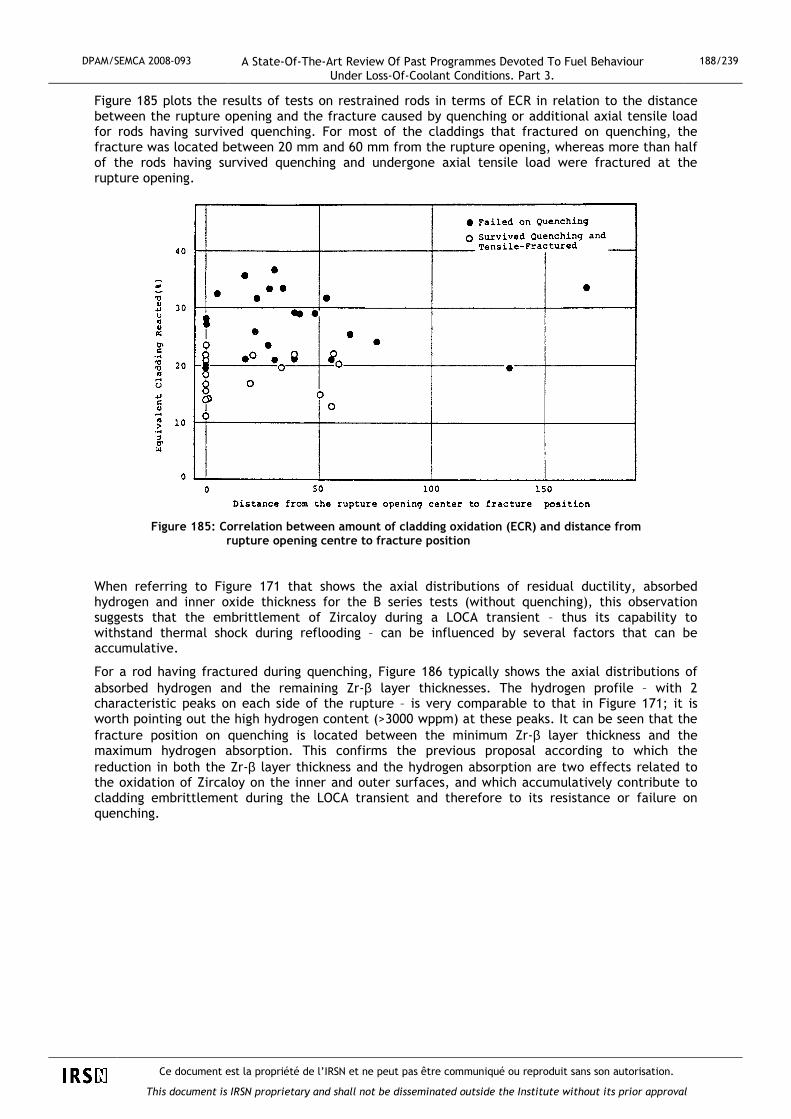
DPAM/SEMCA 2008-093 A State-Of-The-Art Review Of Past Programmes Devoted To Fuel Behaviour Under Loss-Of-Coolant Conditions. Part 3.
188/239
Ce document est la propriété de l’IRSN et ne peut pas être communiqué ou reproduit sans son autorisation.
This document is IRSN proprietary and shall not be disseminated outside the Institute without its prior approval
Figure 185 plots the results of tests on restrained rods in terms of ECR in relation to the distance between the rupture opening and the fracture caused by quenching or additional axial tensile load for rods having survived quenching. For most of the claddings that fractured on quenching, the fracture was located between 20 mm and 60 mm from the rupture opening, whereas more than half of the rods having survived quenching and undergone axial tensile load were fractured at the rupture opening.
Figure 185: Correlation between amount of cladding oxidation (ECR) and distance from
rupture opening centre to fracture position
When referring to Figure 171 that shows the axial distributions of residual ductility, absorbed hydrogen and inner oxide thickness for the B series tests (without quenching), this observation suggests that the embrittlement of Zircaloy during a LOCA transient – thus its capability to withstand thermal shock during reflooding – can be influenced by several factors that can be accumulative.
For a rod having fractured during quenching, Figure 186 typically shows the axial distributions of absorbed hydrogen and the remaining Zr-β layer thicknesses. The hydrogen profile – with 2 characteristic peaks on each side of the rupture – is very comparable to that in Figure 171; it is worth pointing out the high hydrogen content (>3000 wppm) at these peaks. It can be seen that the fracture position on quenching is located between the minimum Zr-β layer thickness and the maximum hydrogen absorption. This confirms the previous proposal according to which the reduction in both the Zr-β layer thickness and the hydrogen absorption are two effects related to the oxidation of Zircaloy on the inner and outer surfaces, and which accumulatively contribute to cladding embrittlement during the LOCA transient and therefore to its resistance or failure on quenching.

DPAM/SEMCA 2008-093 A State-Of-The-Art Review Of Past Programmes Devoted To Fuel Behaviour Under Loss-Of-Coolant Conditions. Part 3.
189/239
Ce document est la propriété de l’IRSN et ne peut pas être communiqué ou reproduit sans son autorisation.
This document is IRSN proprietary and shall not be disseminated outside the Institute without its prior approval
Figure 186: Correlation between distributions of transformed ββββ-phase layer thickness and absorbed hydrogen content along Zircaloy-4 cladding tube oxidised at 1050°C for 30 min after rupture
4.8.7 Integral-type tests in the 1999 – 2007 period (F Series)
As in the E series, this series was performed on simulated fuel rods composed of 190 to 600 mm-long tubes made from Zircaloy-4 (low-tin) with a thickness of 0.57 mm, containing alumina pellets and pressurised in argon at 5 MPa at room temperature. In order to study the behaviour of irradiated cladding, different types of samples were used in these tests:
- Non-irradiated cladding, thinned to 0.513 mm (∼ 10%) and pre-hydrided at 100 to 1200 wppm H, - Cladding of rods irradiated in the JRR-3 experimental reactor belonging to JAERI,
- Cladding of irradiated rods removed from commercial PWRs (BU ∼ 39 -79 GWd/t).
As in past tests, the test device was composed of an Instron-type tensile test machine, a quartz-made reaction tube placed in the centre of an infrared furnace, a steam generator and a water supply system for flooding. The temperature was measured with 3 Pt-Pt13%Rh thermocouples spot-welded onto the outer surface of the rod.
The integral-type test transient consisted in a temperature ramp causing swelling and rupture (about 750-800°C), followed by isothermal oxidation at a temperature between 1000°C and 1250°C for a duration of 120 to 5500 seconds, before slow cooling to 700°C and final reflooding by water injection from the bottom at a rate between 30 to 40 mm/s.

DPAM/SEMCA 2008-093 A State-Of-The-Art Review Of Past Programmes Devoted To Fuel Behaviour Under Loss-Of-Coolant Conditions. Part 3.
190/239
Ce document est la propriété de l’IRSN et ne peut pas être communiqué ou reproduit sans son autorisation.
This document is IRSN proprietary and shall not be disseminated outside the Institute without its prior approval
In this test series, axial constraint during the reflood phase was also applied to the rod , either with total blockage of the rod ends (full restraint) or, contrary to previous tests, with the possibility of applying a controlled intermediate load (390, 539 or 735 N) using the Instron tensile machine.
After testing, a certain number of rods were cut into 15 mm-long segments for measurement of the local deformation and the thicknesses of oxide & metal phases under metallographic examination, and hydrogen analysis (see Figure 187).
Figure 187: Post-test examinations of rods after thermal shock tests
Results
About 200 integral-type tests were performed on unirradiated cladding (as-received or pre-hydrided). Out of all of these tests, 95 ruptures on quenching were observed, most of which occurred at the ballooned and burst zone (type “b”) whereas a few occurred outside this zone (type “a”). Figure 188 shows the distances from rupture opening to failure positions in relation to the oxidation amount ECR while differentiating between tests with or without axial restraint and with as-received or pre-hydrided samples.
Figure 188: Typical failure positions on rods failed under restrained/ unrestrained conditions

DPAM/SEMCA 2008-093 A State-Of-The-Art Review Of Past Programmes Devoted To Fuel Behaviour Under Loss-Of-Coolant Conditions. Part 3.
191/239
Ce document est la propriété de l’IRSN et ne peut pas être communiqué ou reproduit sans son autorisation.
This document is IRSN proprietary and shall not be disseminated outside the Institute without its prior approval
Figure 188 shows that a slight majority of the failures in unrestrained tests were located outside the burst zone, which points to the dominant effect of secondary hydriding developed on the inner surface during internal oxidation in stagnant steam; the impact of pre-hydriding therefore does not seem significant owing to the hydrogen content as compared with secondary hydriding. In axially-restrained tests, the failures were generally found in the burst zone (all failures were located in this zone for pre-hydrided samples), which this time points to the prevailing influence of two-sided oxidation on thinned cladding in this zone, possibly combined with the influence of initial hydriding.
Failure maps for axially-unrestrained tests reveal a high failure limit on the ECR parameter (calculated with the Baker-Just equation on thinned cladding oxidised on both sides) close to 60%, without any significant difference between tests on as-received or pre-hydrided claddings (see Figure 189).
Figure 189: Failure map under unrestrained conditions for as-received and pre-hydrided claddings ECR was calculated with the Baker-Just equation taking account of two-sided oxidation after rupture and increase in circumference by ballooning
The failure maps for tests under the fully restrained condition show a drastic reduction in the ECR failure limit: close to 20% for tests on as-received samples, which fell to 10% for pre-hydrided samples, without any significant influence on the latter of the initial cladding thinning from 0.57 to 0.517 mm (see Figure 190).

DPAM/SEMCA 2008-093 A State-Of-The-Art Review Of Past Programmes Devoted To Fuel Behaviour Under Loss-Of-Coolant Conditions. Part 3.
192/239
Ce document est la propriété de l’IRSN et ne peut pas être communiqué ou reproduit sans son autorisation.
This document is IRSN proprietary and shall not be disseminated outside the Institute without its prior approval
Figure 190: Failure map under restrained conditions for as-received and pre-hydrided claddings
Conscious of the excessive conservatism behind the total rod blockage condition at the start of reflooding, leading to a failure limit below the Japanese acceptance limit (ECR=15%), the realistic character of such conditions having been severely criticised at the OECD Topical Meeting in Aix-en-Provence [99], JAERI wanted to moderate the results of full restraint tests by carrying out tests with an intermediate level of axial restraint.
For tests under fully restrained conditions on thinned and pre-hydrided cladding, the measurement of fracture load produced values between 800 and 1800 N (see Figure 191); it was therefore decided to perform tests with a controlled intermediate level of restraint, based on 3 values: 390, 540 and 735 N.
Figure 191: Fracture loads measured in the tests
under fully-restrained conditions

DPAM/SEMCA 2008-093 A State-Of-The-Art Review Of Past Programmes Devoted To Fuel Behaviour Under Loss-Of-Coolant Conditions. Part 3.
193/239
Ce document est la propriété de l’IRSN et ne peut pas être communiqué ou reproduit sans son autorisation.
This document is IRSN proprietary and shall not be disseminated outside the Institute without its prior approval
Figure 192 shows the failure maps relative to the oxidation amount (calculated ECR) and the axial tensile load at failure (or maximum load for samples having survived quenching) for 3 different hydrogen contents on samples thinned to 0.513 mm. In these maps, tests with loads > 800 N were performed under fully restrained conditions. The figure shows that the failure threshold increases when the hydrogen content or the axial load decreases, thus making it possible to estimate an ECR threshold higher than 20% for restraint below 600N and hydrogen contents below 750 wppm – the maximum H content expected for irradiated Zircaloy-4 cladding at high burn-up.
Figure 192: Failure maps relative to oxidation (ECR) and axial load based on the test result under fully
restrained and controlled load conditions for three hydrogen concentration levels: (a): 100 to 350 wt. ppm; (b): 350 to 750 wt. ppm; (c): 750-1200 wt. ppm
Furthermore, JAERI wanted to supplement the previous study on the quench resistance of cladding under controlled restraint by assessing the maximum tensile load to which a rod totally blocked between 2 grids may be subjected, in relation to the resistance of the guide tubes to the associated compressive load. With the objective to estimate the buckling load of a control-rod guide tube, axial compression tests at ambient temperature were performed on 600 mm-long guide tube sections (outer diameter of 12.2 mm and a thickness of 0.41 mm). Figure 193 gives the load-displacement curves for as-fabricated and oxidised tubes, which show a maximum load below 2 kN for fresh tubes, or a load between 1 and 1.4 kN for oxidised tubes.
���� : Failed
����: Survived
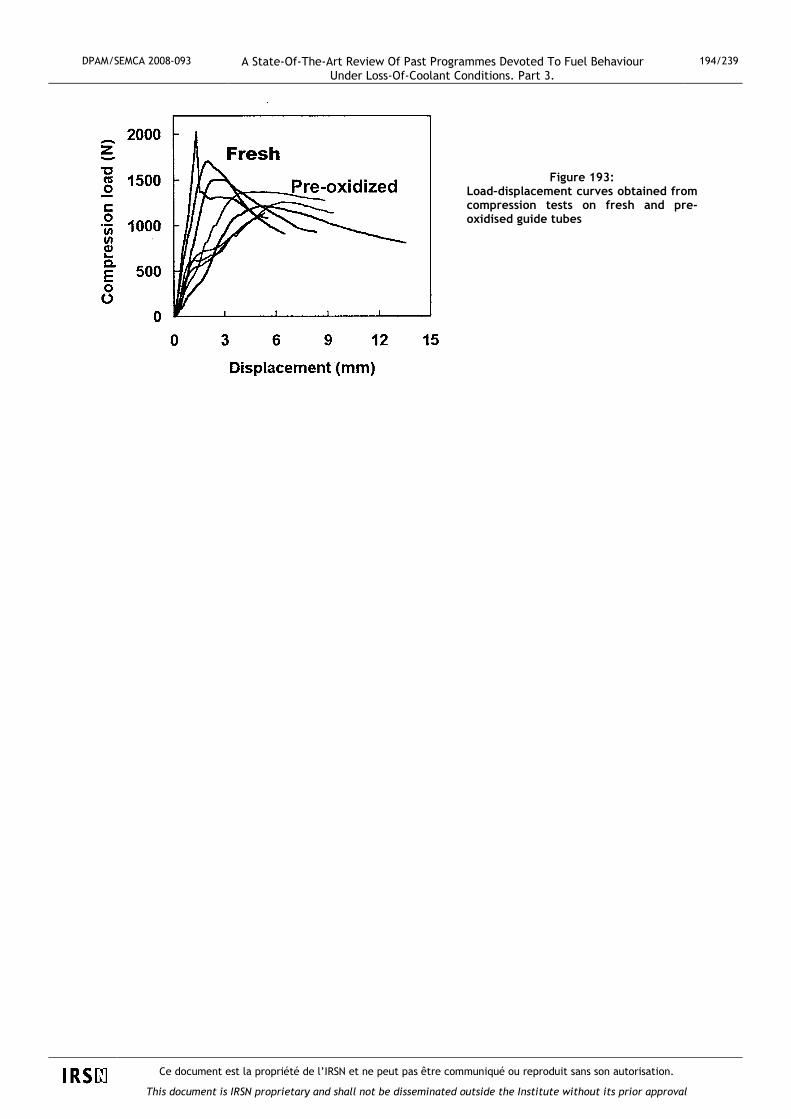
DPAM/SEMCA 2008-093 A State-Of-The-Art Review Of Past Programmes Devoted To Fuel Behaviour Under Loss-Of-Coolant Conditions. Part 3.
194/239
Ce document est la propriété de l’IRSN et ne peut pas être communiqué ou reproduit sans son autorisation.
This document is IRSN proprietary and shall not be disseminated outside the Institute without its prior approval
Figure 193: Load–displacement curves obtained from compression tests on fresh and pre-oxidised guide tubes

DPAM/SEMCA 2008-093 A State-Of-The-Art Review Of Past Programmes Devoted To Fuel Behaviour Under Loss-Of-Coolant Conditions. Part 3.
195/239
Ce document est la propriété de l’IRSN et ne peut pas être communiqué ou reproduit sans son autorisation.
This document is IRSN proprietary and shall not be disseminated outside the Institute without its prior approval
Considering that the ratio between the number of fuel rods and the number of guide tubes is 11 to 1 in a 17x17 PWR fuel assembly, the authors came to the conclusion that in the event of total blockage of all the fuel rods, they should normally not be subjected to loads higher than 2000/ 11∼ 190 N beyond which the guide tubes (even the unoxidised ones) would burst. We can only point out the highly unrealistic hypothesis (all the fuel rods totally blocked between 2 grids!) that is required to obtain this value. It is simply worth remembering the values corresponding to the extreme case of only one fuel rod blocked per guide tube.
The first integral-type tests on irradiated PWR rods with Zircaloy-4 cladding (BU<44 GWd/t) were performed in 2003-2004[100, 101, 102]. Recent tests were performed in the ALPS programme on PWR rods at 66 and 75-79 GWd/t with M5, ZIRLO, and MDA cladding [103, 104]. Additional tests will be performed on BWR rods at 66-73 GWd/t with Zircaloy-2 cladding and with NDA cladding. For all these tests, the 19 cm-long rod sections were defueled before being reloaded with alumina pellets and sealed with welded caps. In the test sequence, the test rod is axially restrained at the end of the isothermal oxidation until the end of cooldown, the maximum tensile load being limited to ∼540 N. This value of 540 N is based on measurement of resistant load between deformed or chemically interacted cladding and spacer grid [105].
For the six tests with fuel rods irradiated at 39 to 44 GWd/tU, the Zircaloy-4 cladding was slightly corroded (eox ≤ 25 µm) and the initial hydrogen content was therefore relatively low, estimated at < 200 wppm. The rupture temperature during ballooning ranges between 750°C to 820°C, which confirms the low impact of the initial hydriding. Among these six tests, two fractured on quenching with a load at fracture of 498 and 385 N respectively after having been oxidised at 1177°C to 29% ECR and 26% ECR respectively (evaluated with Baker-Just equation for two-sided oxidation based on the cladding thickness reduced by ballooning). The four remaining tests survived quenching with an oxidation amount from 16.6% to 22% ECR. Though these test results were limited to intermediate burn-up fuels in terms of cladding corrosion/ hydriding, they nevertheless follow the trend observed in tests on fresh pre-hydrided cladding tubes in terms of failure during quenching under restrained conditions (see Figure 194) and supported the conclusion by JAERI that the failure boundary is not significantly reduced by PWR irradiation in the examined burn-up level.
Figure 194: Failure map relative to ECR (Baker-Just) and hydrogen content for unirradiated and irradiated
Zircaloy-4 rods tested under 540 N axial restraint conditions
The preliminary results of tests with PWR rods at a higher burn-up and with new alloy cladding [104] seem to follow the trend of tests on PWR rods at intermediate BU, therefore confirming the previous conclusion.
The measurement of the axial distribution of absorbed hydrogen in segments that were cut from tested rods led to unclear behaviour on irradiated rods as compared to unirradiated rods. Figure 195 shows the fracture morphology and hydrogen content measured in the vicinity of the fracture on rod

DPAM/SEMCA 2008-093 A State-Of-The-Art Review Of Past Programmes Devoted To Fuel Behaviour Under Loss-Of-Coolant Conditions. Part 3.
196/239
Ce document est la propriété de l’IRSN et ne peut pas être communiqué ou reproduit sans son autorisation.
This document is IRSN proprietary and shall not be disseminated outside the Institute without its prior approval
A3-1 oxidised at 1176°C to 29% ECR, together with a summary of the hydrogen content axial profiles from different tests on unirradiated and irradiated rods.
Figure 195: Fracture morphology, hydrogen content measurements on test rod A3-1 and summary of
hydrogen content axial profiles for unirradiated and irradiated rods
While the axial profiles on unirradiated rods exhibit the W-shape curve as already observed in past tests (see Figure 186) with the maximum located about 30 mm away on each side from the rupture position, the three measurements on rod A3-1 seemed to indicate that the secondary hydriding was located closer to the burst location in this irradiated sample. This observation was consistent with results from ANL integral test ICL#3 on a high burn-up cladding sample. However, the hydrogen axial profiles measured in other JAERI tests with irradiated rods did not show any significant difference with profiles for unirradiated rods, which cast doubt on the observation from test A3-1. It must nevertheless be recalled that the JAERI test rods used alumina pellets that did not fragment much during the transient, unlike ANL rods for which the fuel pellets fragmented and relocated in the ballooned region during the transient.
4.8.8 Conclusions on JAERI tests
The consistent series of separate-effect tests (oxidation tests and mechanical tests at room temperature) and integral-type tests (ballooning & rupture, oxidation, and quenching) on Zircaloy cladding conducted at JAERI made it possible to draw the following conclusions:
♦ The uptake of both oxygen (resulting in the growth of brittle layers of zirconia and α-Zr[O]) and hydrogen (resulting in the precipitation of hydrides during cooling at room temperature) are two embrittlement factors for Zircaloy that can occur simultaneously during cladding oxidation in a LOCA transient.
♦ Hydrogen uptake occurs on the inner surface of the cladding that ruptured during the swelling phase due to the steam ingress through the opening and the inner oxidation in stagnant steam conditions. This uptake shows two peaks on each side of the opening in locations where the hydrogen + steam mixture is optimal and where the absorbed hydrogen content can reach several thousand wppm. Hydrogen uptake and the resulting embrittlement at low temperature occur when the volume fraction of hydrogen in the steam + hydrogen mixture exceeds a certain

DPAM/SEMCA 2008-093 A State-Of-The-Art Review Of Past Programmes Devoted To Fuel Behaviour Under Loss-Of-Coolant Conditions. Part 3.
197/239
Ce document est la propriété de l’IRSN et ne peut pas être communiqué ou reproduit sans son autorisation.
This document is IRSN proprietary and shall not be disseminated outside the Institute without its prior approval
threshold of about 0.4. This also results in a structural change in the zirconia which becomes porous.
♦ The contribution of hydrogen absorbed on the inner surface of the burst rods considerably reduces the post-quench ductility in comparison with two-sided oxidised cladding under the same time-temperature conditions in flowing steam.
♦ The rupture of unconstrained fresh or pre-hydrided samples during quenching mainly occurs outside the balloon, which indicates the predominant effect of secondary hydriding resulting from inner oxidation, with a minor contribution from the initial hydrogen uptake.
♦ The fracture during quenching under unrestrained conditions of burst and oxidised rods occurs at high oxidation rates calculated with the Baker-Just equation for oxidation time-temperature conditions (∼ 38% in the 1983 tests and ∼ 60% in the 1999 tests).
♦ The fully restrained conditions at quench reduce the failure boundary (calculated with the Baker-Just equation) to an ECR ∼ 20%.
♦ Fracture during quenching under restrained conditions mainly occurs on the balloon, which indicates the predominant effect of local oxidation on the thinned cladding, possibly combined with the contribution of initial hydrogen uptake for pre-hydrided samples.
♦ The failure boundary under fully restrained conditions during reflood drops to an ECR of 10% for pre-hydrided cladding (400-700 wppm), but increases to about 20% for controlled axial loads deemed more realistic (< 600 N). This makes it possible to meet the LOCA acceptance criterion of ECR ≤15% (in Japan).
♦ The JAERI tests provided a preliminary estimate of the transient ECR criterion for Zircaloy-4 at high burn-ups: ~3% ECR for a hydrogen concentration of 535 wppm, and ~2.5% ECR for a hydrogen concentration of 755 wppm. These values are being refined and supplemented by the comprehensive results of the ANL test programme currently underway.
4.9 IPSN / EDF research programme (TAGCIS, TAGCIR, HYDRAZIR and CINOG series)
4.9.1 TAGCIS programme
The TAGCISi programme involved a series of quench tests on samples of fresh cladding that had been corroded to simulate the state of PWR rod cladding subjected to a high burn-up. The pre-corrosion state was obtained on electrically heated rods in a water loop under PWR conditions. A considerable number of reference tests on fresh cladding were performed throughout the entire programme.
The tests began in 1991 and ended in July 1993. The thermal transients and post-test metallographic examinations were conducted at CEA-Grenoble. The initial pre-corrosion was achieved in the REGGAE loop at CEA Cadarache. IPSN (now IRSN) was responsible for defining the test conditions, analysing the results and managing all programme tasks.
The two main test parameters were the oxidation plateau temperature and the oxidation amount recorded at the end of the isothermal hold time. The effect of various secondary parameters (quench temperature, temperature ramp rate or cooling rate before quench, initial hydriding and cladding thinning) were examined briefly. A total of 394 samples underwent a test transient that involved a temperature ramp, an oxidation plateau and final quenching, which was sometimes preceded by an intermediary slow cooling phase. Due to various technical problems, successive changes to the experimental procedures, and the elimination of a number of experimentally-incorrect tests, only 141 of the 394 tests were finally retained for test result analysis.
i A French abbreviation for “Trempe en APRP de Gaine de Combustible à Irradiation Simulée” which refers to the LOCA quenching of fuel cladding that has been pre-corroded so as to simulate irradiated cladding
DPAM/SEMCA 2008-093 A State-Of-The-Art Review Of Past Programmes Devoted To Fuel Behaviour Under Loss-Of-Coolant Conditions. Part 3.
198/239
Ce document est la propriété de l’IRSN et ne peut pas être communiqué ou reproduit sans son autorisation.
This document is IRSN proprietary and shall not be disseminated outside the Institute without its prior approval
4.9.2 TAGCIR programme
The TAGCIRi programme was similar to the TAGCIS programme with test samples taken from highly-irradiated cladding removed from an EDF PWR (Gravelines rods subjected to 5 cycles at an average burn-up of 60 GWd/tU). These samples of irradiated cladding were obtained after having chemically removed the pellets from sections taken from different grid spans on the fuel rods removed from the reactor.
The TAGCIR tests began in August 1993 in a facility that was made to resemble the TAGCIS facility as much as possible, but set up in a hot cell in the EDF laboratories in Chinon. A series of exploratory quench tests were first conducted, including tests on fresh cladding and 6 tests on irradiated cladding under comparable conditions. Post-quench ring tensile tests were also performed in addition to the analysis of exploratory tests on fresh cladding.
A first series of 35 quench tests was then performed between August 1993 and January 1995, supplemented by a second series of 8 quench tests performed between February and June 1996.
The detailed results and analysis of the TAGCIS and TAGCIR test series were reported in internal IPSN & EDF reports. Only a limited information has been given in [106, 107, 108, 109].
4.9.3 HYDRAZIR programme
As it proved rather difficult to handle the irradiated samples in the TAGCIR and CODAZIR programmes, and considering the major trend revealed by the results of these programmes concerning the major influence of hydrogen on the behaviour of irradiated Zircaloy under LOCA conditions, it seemed worthwhile replacing the oxidation and quench tests on irradiated Zircaloy with tests of the same nature on fresh samples pre-loaded with hydrogen. These tests formed the HYDRAZIR programme.
Furthermore, in light of the JAERI test results [90,92] confirming that quench shock resistance is greatly influenced by the hydrogen absorbed on the inner cladding surface during the transient, a broad range of hydrogen pre-charging levels were chosen for the samples. In this way, it was possible to cover both 1) hydriding under normal operating conditions (<1000 wppm H), and 2) the high concentrations that can result from inner cladding surface oxidation in a stagnant atmosphere during the transient. The pre-hydrided samples were therefore loaded with 500, 1000, 2000 and 5000 wppm of hydrogen.
The HYDRAZIR programme involved a successive series of oxidation and quench shock resistance tests that were conducted between March 1997 and November 2000. Several final quench tests were performed in early 2001. The detailed results of these tests are given in references 12, 13, 14 and 15 of the summary report [53].
Like in the previous CODAZIR tests, the kinetics in the oxidation tests were characterised by the weight gain per unit of surface, which was calculated by weighing the sample before and after the test, combined with measurements of the sample diameter and length prior to testing. The quench test procedure was similar to that used for the TAGCIS and TAGCIR tests. A major advantage of these different HYDRAZIR tests was the continuous measurement of the sample’s true surface temperature. This was done by using a laser pyrometer and by developing a procedure to prepare the sample surface so that reliable, reproducible emissivity measurements could be obtained. This programme marked the end of the successive changes made to the experimental methodology during the previous programmes that were required to solve the various problems encountered.
4.9.4 CINOG programme
The CINOG programme – outside the cooperative agreement between EDF and IPSN – was mainly intended to characterise the behaviour of the new M4 and M5 alloys developed by FRAMATOME (now AREVA NP) under LOCA conditions. This programme was quite similar to the HYDRAZIR programme and also included a series oxidation kinetics tests and quench tests. Tests on Zircaloy-4 were also conducted to be used as references for comparison with the results of tests on the M4 and M5 alloys.
i A French abbreviation for “Trempe en APRP de Gaine de Combustible IRradié” which refers to the quenching of irradiated fuel cladding under LOCA conditions

DPAM/SEMCA 2008-093 A State-Of-The-Art Review Of Past Programmes Devoted To Fuel Behaviour Under Loss-Of-Coolant Conditions. Part 3.
199/239
Ce document est la propriété de l’IRSN et ne peut pas être communiqué ou reproduit sans son autorisation.
This document is IRSN proprietary and shall not be disseminated outside the Institute without its prior approval
4.9.5 Consistency of quench results between the TAG CIS, TAGCIR, HYDRAZIR & CINOG programmes
The quench tests in the TAGCIS and TAGCIR programmes were restricted to studying the behaviour of Zircaloy-4 cladding bearing an initial high corrosion level which was either simulated in TAGCIS or real in TAGCIR. This means that they can only really be compared with the HYDRAZIR quench tests on pre-hydrided cladding with hydrogen concentrations representative of high burn-up corrosion (< 1000 wppm H). Owing to the poor evaluation of the local oxidation conditions near the rupture in the single-side oxidation tests (as demonstrated by the experimental procedure and which eventually resulted in the invalidation of the TAGCIR and TAGCIS single-side test results), only the two-side oxidation tests from the TAGCIS, TAGCIR and HYDRAZIR programmes could be compared. The CINOG tests on cladding pre-hydrided at 200 and 400 wppm of hydrogen were also included in this comparison.
To begin with, the consistency of the results of tests on fresh cladding was examined for the TAGCIS, HYDRAZIR and CINOG programmes.
4.9.5.1 Test results for fresh cladding
Coming back to the non-failure limits of the two-sided oxidation TAGCIS tests, a detailed examination of the results indicates that the limit of 22.8% ECR – calculated with a best-estimate evaluation – was in fact reached in a test at 1250°C on cladding pre-thinned to 525 µm. For cladding of standard thickness (570 µm), the non-failure limit is 23.6% ECR for a test performed at 1300°C, and 24.1% ECR for tests at temperatures below 1204°C.
The results reveal significant overlapping near the rupture: the difference of 2.6% between the “failed” test with a low ECR and the “intact” test with a higher ECR is based on the bare cladding tests only. This actually increases to more than 4% when all tests are taken into account. This overlapping conveys the various experimental uncertainties related to the test temperature, the initial oxide thickness for pre-oxidised samples, and most probably the location of the crack or its starting point. A conservative non-failure limit was set at 22.8% though the existence of intact tests at 25.4% suggests that the limit could be higher than or equal to this limit if the overlapping interval had been almost zero, like in the HYDRAZIR and CINOG tests.
The impact of having under-estimated the non-failure limits must be evaluated in terms of the ECR or the residual thickness of the β phase if taking into account uncertainty on the temperature of the hot spot where the fracture started. This uncertainty is due to the distance between the turns of the HF coil and may have possibly reached - 47°C with the TAGCIS facility inductor. On the basis of a transient oxidation calculation considered as a succession of permanent regimes, using the parabolic equations by Leistikow:
- A transient with a temperature ramp from 800°C to 1200°C in 20 seconds, followed by a temperature plateau at 1200°C for 780 seconds under two-sided oxidation, results in an oxidation amount of 25.1% ECR and a residual β phase thickness of 230 µm,
- A transient with a temperature ramp from 800°C to 1245°C in 20 seconds, followed by a temperature plateau at 1245°C under two-sided oxidation, results in an oxidation amount of 31% ECR and a residual β phase thickness of 140 µm.
These values are to be compared with the non-failure limits deduced from the HYDRAZIR and CINOG results for fresh cladding, recalled in Table 15 below:
HYDRAZIR CINOG Non-failure limit
1150°C 1250°C 1100°C 1200°C 1300°C
ECR (%) < 31.1 30.3 30.2 29.6 30.7
β thickness (µm) > 120 135
Table 15: Non-failure limits in HYDRAZIR and CINOG tests on fresh cladding

DPAM/SEMCA 2008-093 A State-Of-The-Art Review Of Past Programmes Devoted To Fuel Behaviour Under Loss-Of-Coolant Conditions. Part 3.
200/239
Ce document est la propriété de l’IRSN et ne peut pas être communiqué ou reproduit sans son autorisation.
This document is IRSN proprietary and shall not be disseminated outside the Institute without its prior approval
It therefore appears that the upper values of the failure/ non-failure overlapping region from the TAGCIS tests – when corrected by a temperature difference of +45°C owing to the geometry of the TAGCIS solenoid – would result in non-failure limits similar to those obtained in the HYDRAZIR tests on fresh cladding. The ECR limit resulting from the CINOG tests (about 30% ECR) is also very similar to the previous limits. It can therefore be concluded that by taking into account specific uncertainties on the TAGCIS tests, it is possible to ensure good consistency with the results of HYDRAZIR and CINOG tests.
4.9.5.2 Results of tests on pre-corroded, irradiate d and slightly hydrided cladding
The two-sided oxidation TAGCIS test results show an overall reduction of 1.5% ECR or a total increase of 20 µm in the residual thickness of the Zr-β layer between the non-failure limits (all temperatures included) of bare cladding and those of pre-corroded cladding. Uncertainty on the differences in the limits for bare and pre-corroded cladding is always significant seeing that the ECR difference between the limits of the two groups is about 3% for the temperature of 1200°C alone. In return, a test on pre-corroded cladding with an ECR of 24.2% did survive quenching at 1100°C, which is above the non-failure limit on as-fabricated fresh cladding (24.1%) for the TAGCIS tests at T≤1200°C.
Considering the methodology used to analyse the TAGCIS results, with uncertainty significantly impacting the evaluation of the initial oxide thickness of pre-corroded samples, it was concluded that the pre-corroded cladding results were conservative and that the difference in relation to the as-fabricated cladding results was not representative of increased embrittlement resulting from the initial corrosion. On account of the conclusion that there is little or no protective effect from the initial oxide layer against transient oxidation (a result that could be explained by the laminating during the high temperature transient of oxide layer formed during corrosion), we are also led to believe that this oxide layer has very poor mechanical resistance during a LOCA transient, particularly in terms of quench thermal shock loads. This was demonstrated qualitatively in metallographic examinations of the TAGCIR tests, where it could be seen that the initial oxide – though still identifiable on most samples – showed large areas of deep-seated spalling or a laminated structure via a network of large circumferential cracks. We can therefore conclude that the initial oxide layer does not contribute to mechanical resistance during quenching.
Examination of the results of TAGCIR two-sided oxidation tests made it possible to define the non-failure limits for samples irradiated between 28% and 30% ECR (calculated for transient oxidation alone) and between 150 µm to 190 µm in terms of the residual thickness of the Zr-β layer. In comparison with the limits on fresh material as mentioned above, the ECR limit is slightly lower (or very similar when referring to the tests at T<1200°C) and the limit of the residual Zr-β layer thickness is practically equal or slightly higher. We therefore concluded that cladding irradiation and the associated corrosion do not significantly change the quench resistance limits in comparison with fresh cladding.
The non-failure limits deduced from the results of HYDRAZIR tests with 500 and 1000 wppm of hydrogen are recalled in Table 16 below:
500 wppm 1000 wppm Non-failure limit
1100°C 1150°C 1250°C 1150°C 1250°C
ECR (%) < 34.5 33.4 29.7 33.6 28.7
β layer thickness (µm) > 153 155 103 145 190
Table 16: Non-failure limits of HYDRAZIR tests on cladding pre-hydrided at 500 and 1000 wppm
Comparison of the limits on pre-hydrided cladding with those of fresh cladding for the HYDRAZIR tests (16 /Table 15) reveals:
- An increase of 2 to 2.5% at 1150°C and a decrease of about 0.5 to 1.5% at 1250°C in terms of the ECR limit,

DPAM/SEMCA 2008-093 A State-Of-The-Art Review Of Past Programmes Devoted To Fuel Behaviour Under Loss-Of-Coolant Conditions. Part 3.
201/239
Ce document est la propriété de l’IRSN et ne peut pas être communiqué ou reproduit sans son autorisation.
This document is IRSN proprietary and shall not be disseminated outside the Institute without its prior approval
- An increase of 25 to 35 µm at 1150°C and an increase of 55 µm at 1250°C (disregarding the dubious results at 500 wppm) in terms of the β thickness limit.
The ECR values in Tables 15 and 16 were calculated on the basis of test times and temperatures with the kinetics deduced from oxidation tests. This probably explains the tendency of the ECR limit to decrease with the temperature increase, which particularly appears between 1150°C and 1250°C.
In any case, the non-failure limits specified in Table 16 seem consistent with the limits resulting from the TAGCIR tests recalled above, i.e. 28% to 30% transient ECR and 150 µm to190 µm in terms of the residual thickness of the Zr-β layer.
Concerning the CINOG tests, the limited results obtained at 1200°C on samples pre-hydrided at 200 and 450 wppm (see Figure 196) showed a reduction in the ECR failure limit of about 4% for a hydrogen content of 200 wppm. This reduction is not present with the 450 wppm pre-hydrided samples for which the failure limit is the same as that of hydrogen-free samples. The failure limit, which can be estimated at about 28% ECR within the uncertainty limit of the small number of results, remains consistent with that deduced from the TAGCIR and HYDRAZIR tests. .
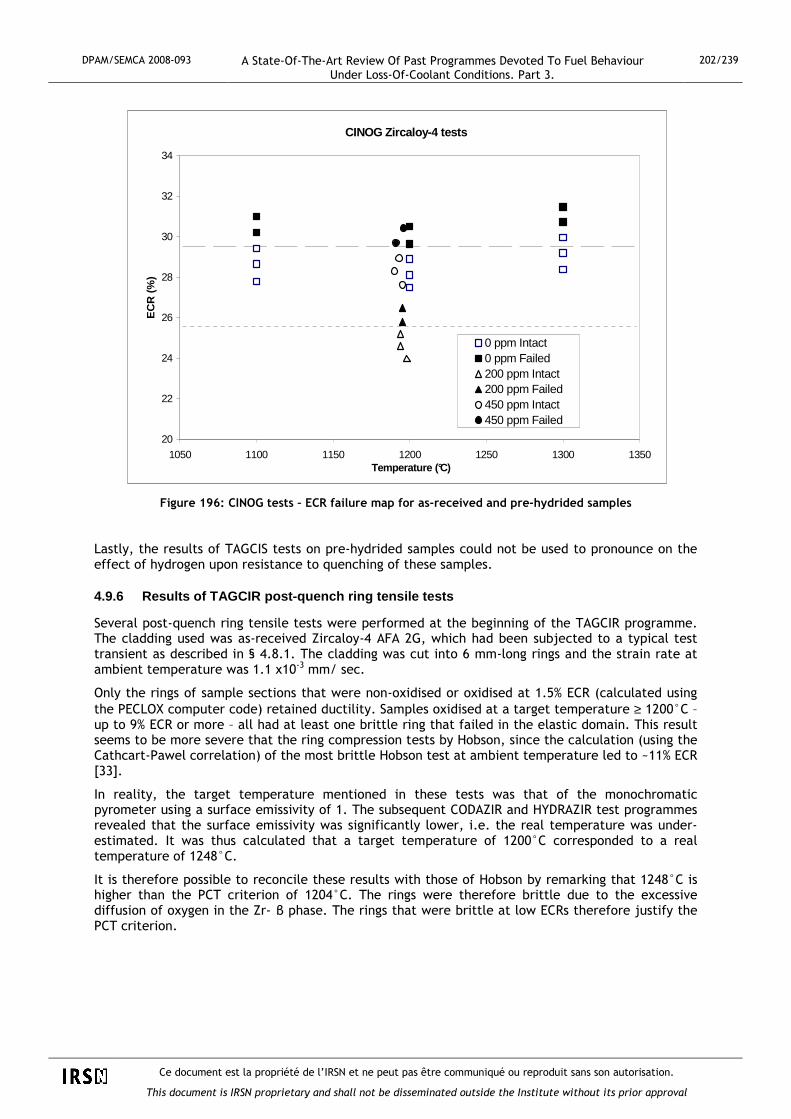
DPAM/SEMCA 2008-093 A State-Of-The-Art Review Of Past Programmes Devoted To Fuel Behaviour Under Loss-Of-Coolant Conditions. Part 3.
202/239
Ce document est la propriété de l’IRSN et ne peut pas être communiqué ou reproduit sans son autorisation.
This document is IRSN proprietary and shall not be disseminated outside the Institute without its prior approval
Figure 196: CINOG tests – ECR failure map for as-received and pre-hydrided samples
Lastly, the results of TAGCIS tests on pre-hydrided samples could not be used to pronounce on the effect of hydrogen upon resistance to quenching of these samples.
4.9.6 Results of TAGCIR post-quench ring tensile te sts
Several post-quench ring tensile tests were performed at the beginning of the TAGCIR programme. The cladding used was as-received Zircaloy-4 AFA 2G, which had been subjected to a typical test transient as described in § 4.8.1. The cladding was cut into 6 mm-long rings and the strain rate at ambient temperature was 1.1 x10⁻³ mm/ sec.
Only the rings of sample sections that were non-oxidised or oxidised at 1.5% ECR (calculated using the PECLOX computer code) retained ductility. Samples oxidised at a target temperature ≥ 1200°C – up to 9% ECR or more – all had at least one brittle ring that failed in the elastic domain. This result seems to be more severe that the ring compression tests by Hobson, since the calculation (using the Cathcart-Pawel correlation) of the most brittle Hobson test at ambient temperature led to ~11% ECR [33].
In reality, the target temperature mentioned in these tests was that of the monochromatic pyrometer using a surface emissivity of 1. The subsequent CODAZIR and HYDRAZIR test programmes revealed that the surface emissivity was significantly lower, i.e. the real temperature was under-estimated. It was thus calculated that a target temperature of 1200°C corresponded to a real temperature of 1248°C.
It is therefore possible to reconcile these results with those of Hobson by remarking that 1248°C is higher than the PCT criterion of 1204°C. The rings were therefore brittle due to the excessive diffusion of oxygen in the Zr- β phase. The rings that were brittle at low ECRs therefore justify the PCT criterion.
CINOG Zircaloy-4 tests
20
22
24
26
28
30
32
34
1050 1100 1150 1200 1250 1300 1350Temperature (°C)
EC
R (
%)
0 ppm Intact0 ppm Failed200 ppm Intact200 ppm Failed450 ppm Intact450 ppm Failed

DPAM/SEMCA 2008-093 A State-Of-The-Art Review Of Past Programmes Devoted To Fuel Behaviour Under Loss-Of-Coolant Conditions. Part 3.
203/239
Ce document est la propriété de l’IRSN et ne peut pas être communiqué ou reproduit sans son autorisation.
This document is IRSN proprietary and shall not be disseminated outside the Institute without its prior approval
4.9.7 Conclusion on the TAGCIS, TAGCIR, HYDRAZIR an d CINOG programmes
Comparative analysis of the results of two-sided oxidation tests on fresh cladding from the TAGCIS, HYDRAZIR and CINOG programmes makes it possible to affirm the good consistency of results obtained from these various programmes, while taking into account specific uncertainties in the TAGCIS tests. The failure limits were around 30% ECR with a residual Zr-β thickness of 140 µm for a conservative case of quench at oxidation temperature.
Considering that there was no protective effect from the initial oxide layer against transient oxidation and following metallographic examination of this initial oxide layer after the TAGCIR tests, it was concluded that the initial oxide layer does not contribute to mechanical resistance during quenching. Comparison of the non-failure limits for fresh and irradiated material led to the conclusion that cladding irradiation and the associated corrosion do not significantly modify thermal shock resistance in comparison with fresh cladding.
Comparative analysis of TAGCIR tests on irradiated cladding and HYDRAZIR tests on cladding pre-hydrided at low concentrations (<1000 wppm) once again shows good consistency between the results of these tests, with the failure limits (for direct quenching at the oxidation temperature) reaching around 28 to 30% transient ECR and 150 to 190 µm in terms of the residual thickness of the Zr-β layer.
The HYDRAZIR programme, which involved tests on highly-hydrided samples (up to 5000 wppm) with quenching either at oxidation temperature or at intermediate temperaturei, also made it possible to confirm the effect of hydrogen on the thermal shock resistance in relation with the cooling rate:
� Concerning fresh or moderately hydrided (<1000 wppm) samples, the cooling rate and the quench temperature have little impact on the mechanical resistance of the cladding because this resistance is borne by the β phase (or the α+β two-phase layer) which contains relatively little oxygen before quenching and whose oxygen concentration changes very little during the cooling, whether slow or fast.
� Concerning highly-hydrided samples (≥2000 wppm), with increased oxygen solubility in the β phase and therefore a higher average oxygen concentration after oxidation, the mechanical resistance differs significantly upon quenching from the maximum or an intermediate temperature:
• Upon quenching from the maximum temperature, the fast β→α transformation results in the growth of a multi-directional network of brittle α needles inside the β layer, without oxygen diffusion.
• Upon quenching from an intermediate temperature, oxygen can migrate from the β phase towards the α phase grains during cooling before quench, leading to the depletion of oxygen in the β phase which then restores sufficient ductility to stop the propagation of any cracks appearing in the α layer and α inclusions.
These observations show just how difficult it is to establish a physical quench resistance criterion that takes into account the cross-influences of oxygen and hydrogen:
• A criterion in terms of the ECR or the β phase thickness is insufficient in the case of initial hydrogen concentrations above 1000 wppm.
• A criterion in terms of the phase thickness or volume fraction with a threshold oxygen concentration would be more representative but this would require a reliable calculation of oxygen diffusion in the different layers with consideration of the cooling temperature history and sufficient knowledge of the hydrogen-enhanced oxygen solubility in the beta layer over the temperature range of interest.
Furthermore, the results of the ring tensile tests performed during the exploratory phase of the TAGCIR programme support the PCT criterion < 1204°C.
i Following intermediary cooling, which is deemed more realistic

DPAM/SEMCA 2008-093 A State-Of-The-Art Review Of Past Programmes Devoted To Fuel Behaviour Under Loss-Of-Coolant Conditions. Part 3.
204/239
Ce document est la propriété de l’IRSN et ne peut pas être communiqué ou reproduit sans son autorisation.
This document is IRSN proprietary and shall not be disseminated outside the Institute without its prior approval
4.10 CEA studies on the thermal-mechanical behaviou r of cladding alloys in LOCA conditions
Within the framework of the CEA/EDF/AREVA-NP R&D cooperative agreement, an extensive experimental programme has been conducted in CEA labs to investigate the influences of the hydrogen content, pre-oxidation and cooling scenario on the post-quench mechanical properties of Zircaloy-4 and M5 cladding alloys after oxidation under LOCA conditions [110,111,112,113,114].
In a first stage of the study focusing on clad ballooning and burst behaviour, uniaxial tensile tests were conducted on as-received, unirradiated pre-hydrided and irradiated materials under fast heating ramps. Results made it possible to conclude that irradiation defects in the cladding are annealed early during the first heating of the LOCA transient and that unirradiated pre-hydrided material is a good surrogate for irradiated corroded material with respect to the creep and ballooning behaviour.
Post-oxidation or post-quench mechanical behaviour has been investigated using specimens after one-sided oxidation in steam at 1000, 1100, 1200 or 1250°C performed in the DEZIROX facility (already described in [115]). The facility consists of a vertical 2-zones resistive furnace allowing a low temperature gradient - <10°C at 1200°C – along the 150 mm sample length, together with a fast heating ramp up to target temperature without significant overshoot. After the oxidation plateau, the sample was either directly quenched by dropping it into a water tank below the furnace tube, or slow-cooled down to an intermediate temperature (600-800°C) and quenched, or slow-cooled down to room temperature (RT). However, due to the high thermal inertia of the furnace, the slow cooling rate could not exceed ∼1°C/s. After quenching or slow cooling, various mechanical tests were conducted:
- ring-compression tests (RCT) at RT or at 135°C on 10 mm long specimens,
- 3 points bending tests (3-PBD) at RT or at 135°C on 90 mm long specimens,
- impact tests at RT on 55 mm long pre-notched samples.
Extensive micro-structural and micro-chemical post-test analysis was performed, using various techniques including optical and Scanning Electron Microscopy (SEM), micro-hardness measurements, Electron Probe Micro-Analysis (EPMA) and Elastic Recoil Detection Analysis (ERDA).
4.10.1 Oxygen concentration profile in the prior- ββββ phase layer
Room temperature impact tests were performed on as-received Zry-4 and M5 samples oxidised at 1250°C and directly water quenched from the oxidation temperature. The impact test results indicated that the mechanical behaviour is nearly brittle for an impact energy lower than ∼0.1 J/mm2.
Micro-hardness and oxygen concentration (EPMA) profiles in the prior-β phase layer were determined and associated to the SEM fractograph obtained using the back scattered electron (BSE) mode. For samples oxidised to ∼6% ECR, the fractograph images show a clear transition from a quasi-brittle aspect to a ductile aspect at a location corresponding to a critical oxygen concentration of ∼0.4 wt%. This observation supports the early proposal by Chung & Kassner [60] to relate the post-quench mechanical behaviour of as-received Zry-4 samples subjected to LOCA-type conditions to a minimum thickness of the prior-β phase containing less than a critical oxygen concentration.
Moreover, a linear correlation was established between the average micro-hardness and oxygen content measured by EPMA (corrected for surface contamination) in the prior-β phase for both Zry-4 and M5 alloys.
4.10.2 Influence of hydrogen
Unirradiated pre-hydrided samples were obtained by gaseous charging up to hydrogen contents ranging respectively from ∼80 to ∼600 wppm for Zry-4 and from ∼40 to ∼300 wppm for M5.
Oxidation kinetics tests at 1000, 1100 and 1200°C clearly demonstrated that there is no significant effect of the hydrogen content on the overall oxidation kinetics at typical LOCA oxidation times within the investigated H-concentration range for each alloy.

DPAM/SEMCA 2008-093 A State-Of-The-Art Review Of Past Programmes Devoted To Fuel Behaviour Under Loss-Of-Coolant Conditions. Part 3.
205/239
Ce document est la propriété de l’IRSN et ne peut pas être communiqué ou reproduit sans son autorisation.
This document is IRSN proprietary and shall not be disseminated outside the Institute without its prior approval
However, post-quench mechanical tests revealed that hydrogen significantly influences the post-quench mechanical properties via two mechanisms: 1) an intrinsic hydrogen embrittlement effect and 2) an enhanced hardening of the prior-β phase due to higher oxygen solubility in the presence of hydrogen.
4.10.2.1 Intrinsic hydrogen effect
This effect was revealed by “flash” oxidation tests consisting of a 50 s oxidation at 1000°C terminated by a direct quench. Due to the low oxidation temperature and time, the oxidation level does not exceed 0.5% ECR which does not induce a significant hardening of the prior-β phase. However, the RT impact tests showed a significant decrease in the impact energy with the increasing hydrogen content, as illustrated in Figure 197. Based on a quasi-brittle threshold impact energy of 0.1 J/mm2, results indicate that a short temperature incursion in the β-range may be sufficient to induce a quasi-brittle behaviour at room temperature after direct quenching of samples with a H content above ∼400 wppm.
0
0,05
0,10
0,15
0,20
0,25
0,30
0,35
0,40
0,45
0 200 400 600 800 wt.ppm H
Impa
ct E
nerg
y (K
CV
, J/m
m²)
)
low-tin Zy-4
M5
Figure 197: Influence of the hydrogen content on the RT impact energy for Zry-4 and M5
oxidised at 1000°C for 50 s ("flash oxidation")
CEA authors suggested that the loss of ductility could be associated with the precipitation of very fine hydrides upon quenching down to RT, these hydrides possibly acting as potential brittle failure nucleation sites.
4.10.2.2 Effect of hydrogen on the prior- ββββ phase oxygen content and on the resulting post-quench mechanical properties
Results from the post-quench mechanical tests conducted at the CEA on as-received and pre-hydrided Zry-4 and M5 samples oxidised at 1000 to 1200°C and directly quenched have been extensively reported in several papers [115, 111, 112].
Results from ring compression tests after oxidation at 1200°C and from impact tests after oxidation at 1100°C are shown in Figures 198 and 199.

DPAM/SEMCA 2008-093 A State-Of-The-Art Review Of Past Programmes Devoted To Fuel Behaviour Under Loss-Of-Coolant Conditions. Part 3.
206/239
Ce document est la propriété de l’IRSN et ne peut pas être communiqué ou reproduit sans son autorisation.
This document is IRSN proprietary and shall not be disseminated outside the Institute without its prior approval
0
5
10
15
20
25
30
35
40
0 10 20 30
measured ECR
Offs
et d
ispl
acem
ent /
dia
met
er
(%)
M5 1200°C as received RT
Zy-4 1200°C as receivedRT
Zy-4 1200°C 600 ppm RT
M5 1200°C 130 ppm RT
M5 1200°C 130 ppm135°C
Zy-4 1200°C 600 ppm135°C
Figure 198: Ring compression tests at RT and 135°C after oxidation at 1200°C on as-received and pre-hydrided for Zry-4 and M5
0,00
0,05
0,10
0,15
0,20
0,25
0,30
0,35
0 5 10 15 20
measured ECR
Impa
ct te
st a
bsor
bed
ener
gy
(J/m
m²)
M5 1100°C as-received - RT
Zy-4 1100°C as-received - RT
Zy-4 1100°C 600 ppm H - RT
M5 1100°C 150 ppm H - RT
Figure 199: Impact tests at RT after oxidation at 1100°C on as-
received and pre-hydrided for Zry-4 and M5
Results indicate that for both as-received and hydrided materials, both the offset displacement and the absorbed impact energy decrease when ECR increase. The higher embrittlement at high ECR values is attributed to the increased diffusion and absorption of oxygen in the prior-β phase layer. The hydrided materials are significantly weaker than the as-received ones upon testing at RT. This enhanced embrittlement is attributed to the combination of 1) the intrinsic hydrogen embrittlement, as revealed by “flash” oxidation tests, and 2) the enhanced oxygen diffusion in the prior-β phase layer due to higher oxygen solubility in the presence of hydrogen, which results in a higher oxygen content up to a critical value promoting an additional hardening and embrittlement.
Increasing the test temperature to 135°C restores some ductility in the ductile-to-brittle transition range for M5 with 130 wppm H, while Zry-4 with 600 wppm H remained brittle for all ECR values investigated.
Moreover, good agreement was observed between the energy to failure in all kinds of mechanical testing (ring compression, 3 point bending and impact) which made it possible to conclude that the energy to failure is a relevant parameter to analyse embrittlement in these various test types.
4.10.3 Influence of an initial corrosion layer
In order to clarify the potential influence of a pre-transient oxide layer, Zry-4 and M5 claddings were corroded in a pressurised water loop at 350°C up to ∼15 µm oxide thickness on the OD. The corresponding hydrogen pickup was about 150-200 wppm. Bare specimens with 150 wppm pre-hydriding were used for comparison. After oxidation at 1200°C for 50 to 60 s and direct quench, the pre-corroded and bare pre-hydrided samples were subjected to RCT at 135°C.
� M5 1200°C as-received RT
���� M5 1200°C 130 ppm RT
���� M5 1200°C 130 ppm 135°C
� Zy-4 1200°C as-received RT
����Zy-4 1200°C 600 ppm RT
����Zy-4 1200°C 600 ppm 135°C O
ffset
dis
plac
emen
t / d
iam
etet
(%
) Im
pact
test
abs
orbe
d en
ergy
(J/
mm
2 )

DPAM/SEMCA 2008-093 A State-Of-The-Art Review Of Past Programmes Devoted To Fuel Behaviour Under Loss-Of-Coolant Conditions. Part 3.
207/239
Ce document est la propriété de l’IRSN et ne peut pas être communiqué ou reproduit sans son autorisation.
This document is IRSN proprietary and shall not be disseminated outside the Institute without its prior approval
Results indicate that despite significantly lower weight gains after oxidation on pre-corroded specimens (by a factor of ∼2 in comparison to bare specimens), the post-quench mechanical behaviour was not improved: offset strains remain very comparable between pre-corroded and bare samples. Moreover, the post-oxidation layer thicknesses measurements revealed that, for both alloys, the measured α[O] thicknesses on specimens with and without pre-oxide are almost identical. This suggests that the overall quantity of oxygen having diffused in the inner metallic part of the cladding is also the same with and without pre-oxide layer. In the latter case, the partial "protective" effect against oxygen diffusion from the outer steam is compensated by early oxygen diffusion from the pre-oxide to the metal substrate. The post-quench mechanical properties, mainly controlled by the oxygen content in the prior-β layer, will therefore remain very comparable in the two situations.
A similar influence of a pre-oxide layer on the ID shall also be considered for irradiated claddings due to fuel-cladding bond (see ANL 1-sided tests results above).
4.10.4 Influence of the cooling scenario
Taking into consideration that the cooling scenario in a postulated LOCA transient may vary significantly from one transient to another, it was then relevant to check the possible influence of the cooling scenario on the post-quench mechanical behaviour.
Previous work by Chung & Kassner [60] had already investigated the influence of the cooling rate through the β→α' transformation range for as-received Zircaloy cladding (see § 4.5.2.2). Specific tests conducted by the CEA focused on highly pre-hydrided Zry-4 (600 wppm), simulating high burn-up material.
As already indicated, the high thermal inertia of the resistive furnace used in the DEZIROX facility limited the cooling rate before final quenching to low values, typically:
- 0.5°C/s to 0.3°C/s from 1200 to 800°C,
- 0.17°C/s from 800 to 600°C,
- 0.05°C/s from 600 to 150°C.
Owing to these slow cooling rates, the oxidation still continues during cooling from 1200 to 800°C, the oxidation level rising from 2.8% ECR after 50 s oxidation at 1200°C to ∼6.2% ECR after subsequent cooling to 800°C or below. The following cooling scenarios were studied: 1) direct quench from the 1200°C oxidation temperature, 2) slow cooling down to 800°C, or 700°C, or 600°C and quench, 3) slow cooling down to RT. For each cooling scenario, ring compression tests (RCT) and 3-points bend tests (3-PBT) at 135°C were performed.
The post-quench mechanical behaviour is illustrated in Figure 200 in terms of offset strain upon RCT or 3-PBT as a function of the quench temperature. The figure shows:
- after a direct quench at 1200°C or after slow cooling down to 800°C and quench, very low offset strains indicative of a brittle behaviour ;
- after slow cooling down to 700 or 600°C and quench, a surprisingly high restoration of the post-quench ductility ;
- after slow cooling down to RT, some ductility restoration but significantly less than for quench at 700 or 600°C.

DPAM/SEMCA 2008-093 A State-Of-The-Art Review Of Past Programmes Devoted To Fuel Behaviour Under Loss-Of-Coolant Conditions. Part 3.
208/239
Ce document est la propriété de l’IRSN et ne peut pas être communiqué ou reproduit sans son autorisation.
This document is IRSN proprietary and shall not be disseminated outside the Institute without its prior approval
Figure 200: Comparison of offset strains upon RCT or 3-PBT for different cooling scenarios
A complementary metallurgical characterization of the tested specimens has shown a complex (and synergetic) partitioning of oxygen, iron, chromium and hydrogen during and after the β→α' transformation. SEM examinations of the prior-β layer in electron back scattered mode have shown:
- after direct quench, a uniform distribution of oxygen;
- after slow cooling down to 800°C and quench, significant oxygen redistribution, but a relative fraction of β-phase transformed into α-phase (enriched in oxygen) no higher than 50%, consistent with the influence of the hydrogen content (600 wppm in the pre-hydrided Zry-4 samples) on the β/α transformation temperature;
- after slow cooling down to 700 or 600°C and quench, the β→α' transformation is completed and oxygen content variations within the microstructure are smoother;
- after slow cooling down to RT, coarse hydrides having precipitated in the oxygen-depleted zones near the sub-grains boundaries.
These microstructural and microchemical variations are likely responsible for the observed post-quench ductility behaviour for the various cooling scenarios being studied. However, these results appear controversial in comparison with those from ANL tests - however conducted with significantly higher cooling rates - (see 4.6.1.3 above). Further work is thus needed to better understand these complex phenomena while taking into account the effect of the pre-quenching cooling rate.

DPAM/SEMCA 2008-093 A State-Of-The-Art Review Of Past Programmes Devoted To Fuel Behaviour Under Loss-Of-Coolant Conditions. Part 3.
209/239
Ce document est la propriété de l’IRSN et ne peut pas être communiqué ou reproduit sans son autorisation.
This document is IRSN proprietary and shall not be disseminated outside the Institute without its prior approval
4.11 UJP investigations on pre-corroded cladding
The UJP in Prague [116,117,118] recently conducted a series of oxidation tests in the 800-1200°C temperature range on pre-oxidised Zr alloy samples, followed by mechanical tests at room temperature to evaluate the residual ductility after cooling.
Pre-oxidation was achieved by long-term exposure in steam at 425°C up to oxide thicknesses of 50 µm. However, the hydrogen content that was obtained on the samples with the highest pre-oxide layer thickness appears significantly higher than the hydrogen pickup after in-reactor operation until high burn-up (∼ 1300 to 1500 ppm for 50 µm of pre-oxide as indicated in [117], and up to 2400 ppm for 35 µm of pre-oxide as indicated in [118]).
Figure 201a shows the residual ductility at room temperature of pre-oxidised Zircaloy-4 samples with various initial oxide thicknesses, after oxidation at 950°C up to increasing ECR-CP values. While the residual ductility of as-received or 2 µm pre-oxidised samples remains above the ductile-to-brittle limit until about 17% ECR-CP, the residual ductility of the 50 µm pre-oxidised samples appears almost zero starting at very low (<1% ECR-CP) oxidation amounts at high temperature. The result is supported by the micro-hardness measurements in the prior β-Zr layer, as illustrated in Figure 201b, where the hardness values for the 50 µm pre-oxidised sample appear significantly higher than the values for as-received or low pre-oxide samples.
Figure 201a: Residual ductility at room temperature of pre-oxidised Zy4 samples after oxidation at 950°C.
Figure 201b: Micro-hardness in the prior β-Zr layer of pre-oxidised Zy4 samples after oxidation at 950°C.
Vrtìlková et al. suggested that the observed behaviour was related to the partial dissolution of the initial oxide layer into the underlying metal, while the oxidation by steam remained much slower at the temperature level of the oxidation test.
Tests on 35 µm pre-oxidised samples that were heated at 100°C/min to 900°C and subsequently quenched (thus involving low oxidation at high temperature) indicated dissolution of about 4 µm of the overall oxide layer when comparing measured thicknesses to theoretical thicknesses derived from weight gain.
Figure 202 illustrates the evaluated thickness of oxide dissolved in relation to the oxidation time at 900°C for samples with pre-oxide thicknesses of 2, 10 or 35 µm. The amount of oxide dissolution appears clearly higher for the highest pre-oxide thickness, which is most likely related to the hydrogen content of the sample. Hydrogen is known to increase the oxygen solubility in the β-Zr, as well as to lower the α→β transformation temperature. This is expected to enhance the oxide dissolution by oxygen diffusion into the underlying metal during the high temperature excursion, then the hardening and embrittlement of the cladding sample.
However, due to the high hydrogen content of the 35 to 50 µm pre-oxidised samples, hydrides that precipitate during cooling may certainly have contributed to the residual ductility of the samples tested under ring compression at room temperature.
Pre-oxidised standard ASTM Zircaloy-4 ( 950°C )
0
5
10
15
20
25
0 5 10 15 20 25
ECRCath-Paw [%]
Res
idua
l duc
tility
at R
T [
%] 0 µm 2 µm 10 µm 50 µm
Pre-oxidised standard ASTM Zircaloy-4 ( 950°C )
0
100
200
300
400
500
0 5 10 15 20 25
ECRCath-Paw [%]
Har
dnes
s H
VM
100
in p
rior
ββ ββ-Z
r
0 µm 2 µm 10 µm 50 µm

DPAM/SEMCA 2008-093 A State-Of-The-Art Review Of Past Programmes Devoted To Fuel Behaviour Under Loss-Of-Coolant Conditions. Part 3.
210/239
Ce document est la propriété de l’IRSN et ne peut pas être communiqué ou reproduit sans son autorisation.
This document is IRSN proprietary and shall not be disseminated outside the Institute without its prior approval
Figure 202: Oxide dissolution estimated in relation to the oxidation time at 900°C for various Zy4 pre-oxidised samples
Based on these test results, Vrtìlková et al. concluded that the current ECR criterion was inappropriate in conditions involving the oxidation of pre-oxidised cladding in the 800-1000°C temperature range. In such conditions, the pre-oxide acts as an oxygen source for redistribution in the underlying metal during the high temperature transient, favoured by influence of the hydrogen content, and without significant variation in the ECR.
Zry-4 (900°C)
0
5
10
15
20
25
0 100 200time [ min. ]
oxid
teor
- ox
ide
xp [
µm]
2 µm (70 ppm H) 10 µm (650 ppm H) 35 µm (2400 ppm H)

DPAM/SEMCA 2008-093 A State-Of-The-Art Review Of Past Programmes Devoted To Fuel Behaviour Under Loss-Of-Coolant Conditions. Part 3.
211/239
Ce document est la propriété de l’IRSN et ne peut pas être communiqué ou reproduit sans son autorisation.
This document is IRSN proprietary and shall not be disseminated outside the Institute without its prior approval
4.12 In-pile test programmes
4.12.1 PBF tests
A series of in-pile tests were conducted in the power burst facility (PBF) at the Idaho National Engineering Laboratory (INEL) in the US. These tests were performed under power-cooling-mismatch conditions (PCM) leading to departure from nucleate boiling (DNB) and film boiling conditions maintained on the tested rods [119,120]. These conditions produced a temperature rise in the cladding without any drop in the external pressure, which resulted in:
- Cladding oxidation by steam on the outer surface,
- Collapse of the cladding onto the fuel owing to a positive external/ internal ∆P. This resulted in a Zr/UO2 interaction and the diffusion of oxygen in the cladding, which contributed to cladding embrittlement before returning to nucleate boiling conditions.
Cladding embrittlement was assessed on the basis of post-test examinations performed on 56 rods selected from 16 different tests.
4.12.1.1 Experimental characteristics
These were single-rod tests that were either tested separately or four at a time, with each rod being contained in a separate coolant flow shroud and subjected to the same nominal power history and thermal-hydraulic conditions. One nine-rod bundle test was also performed. Different fresh/irradiated combinations for fuel and/or cladding were used in these tests, which have been classified into 2 series:
1) Power cooling mismatch (PCM)
These tests were designed to assess the effect of transient thermal-hydraulic parameters (temperature and time in stable film boiling) under power and cooling imbalance conditions upon the behaviour of fresh rods at high temperature.
2) Irradiation effects (IE)
These tests were designed to assess the effects of prior irradiation history (burn-up <16 GWd/tU) and rod design variables on the rod behaviour under PCM conditions.
The rods had the following characteristics:
- Zircaloy-4 cladding, 97 cm long
- Active UO2 length: 91.4 cm (fresh)/ 88 cm (irradiated)
- Outer cladding diameter: 10.72 mm (fresh) / 9.95 mm (irradiated)
- Cladding thickness: 0.59 to 0.62 mm
- Internal cold pressure: 2.5 to 3.8 MPa (except for rod IE-006 pressurised at 0.1 MPa, rods IE-007 to IE-009 pressurised at 1.2 to 1.9 MPa and rod IE-019 pressurised at 8.3 MPa)
The experimental sequence involved the following successive phases:
• Calibration (thermal-hydraulic and power),
• Pre-conditioning to allow for fuel cracking and partial restructuring,
• Experimental phase under film boiling conditions achieved by either reducing the coolant flow rate or increasing the reactor power at low steady coolant flow, with the coolant pressure having been maintained at 15 MPa.
The temperature ramp rate was about 50 K/s and the cooling rate was from 50 to 100 K/s down to the reactor ambient coolant temperature of ∼600 K.
The film boiling conditions lasted several seconds to 15 minutes, depending on the test, with cladding peak temperatures ranging from 1315 K to 2100 K.
Owing to the high external pressure (15 MPa), the cladding collapsed onto the fuel pellet during the high-temperature transient, which triggered an interaction between UO2 and Zr. This resulted in the

DPAM/SEMCA 2008-093 A State-Of-The-Art Review Of Past Programmes Devoted To Fuel Behaviour Under Loss-Of-Coolant Conditions. Part 3.
212/239
Ce document est la propriété de l’IRSN et ne peut pas être communiqué ou reproduit sans son autorisation.
This document is IRSN proprietary and shall not be disseminated outside the Institute without its prior approval
formation of a α-Zr[O] layer of a thickness similar to that formed on the external side of the cladding by steam oxidation(i). The authors therefore considered that embrittlement in these in-pile tests was more or less similar to that obtained by two-sided oxidation in steam in the out-of-pile tests, like those performed by ANL and used for comparison below.
4.12.1.2 Comparison between in-pile and out-of-pile test results: comparison with criteria
A comparative investigation was performed by Haggag at EG&G Idaho[121] between the main embrittlement criteria for Zircaloy-4 and experimental data from both ANL out-of-pile tests (see § 4.5) and in-pile tests performed in the PBF.
The comparison of the test results (ANL out-of-pile isothermal tests and PBF in-pile tests under transients) is faced with the problem of determining the isothermal oxidation conditions that are equivalent to a given transient.
In order to compare the PBF test results with embrittlement criteria developed from out-of-pile isothermal tests, an “effective” isothermal temperature was determined; the effective isothermal temperature is the temperature that would lead to the measured thicknesses of the ZrO2 and α-Zr[O] layers under isothermal oxidation for the film boiling time of the experiment. This temperature was obtained with an estimated uncertainty of ±50 K on the basis of an inverse calculation using Zircaloy oxidation kinetics.
Considering the high sensitivity of the oxygen diffusion rate in Zircaloy for temperatures above 1200 K, the difference between the peak transient temperature and the effective temperature (having possibly reached 350 K) raises the problem of the validity of such comparison between isothermal tests and transient tests.
The duration of the oxidation transient in the PBF tests was also corrected by a factor of (eANL/ePBF)2
to take into account the difference in thickness between the ANL and PBF cladding.
The results for the PBF rods refer to axial positions adjacent to the fracture location (in-pile or during post-test handling) or the location where oxidation was maximum for the intact rods. Table 17 lists the experimental data and the various parameters relative to the criteria used in this comparison for the 47 rods from the 15 PBF tests.
The ANL tests chosen for comparison were those with fast cooling through the β→α' transformation range (see § 4.5.2.2).
i Rod IE-019 underwent ballooning, burst and two-sided oxidation in steam.

DPAM/SEMCA 2008-093 A State-Of-The-Art Review Of Past Programmes Devoted To Fuel Behaviour Under Loss-Of-Coolant Conditions. Part 3.
213/239
Ce document est la propriété de l’IRSN et ne peut pas être communiqué ou reproduit sans son autorisation.
This document is IRSN proprietary and shall not be disseminated outside the Institute without its prior approval
Table 17: Embrittlement parameters of the PBF PCM tests
Rod Number
Clad/Fuel Pre-test Cladding Wall
Thickness (mm)
Exposure Time in Film Boiling (s)
Isothermal Effective Cladding
Temperature (K)
Elevation From Bottom of Fuel Stack
(m)
Fw (%)
ECR (%)
Remaining Prior β Thickness (mm)
Lβ(0.9) (mm) (g)
Lβ(0.7) (mm) (h)
Clad Gas Sample Elevation
From Bottom of Fuel Stack
(m)
Hydrogen Content (wppm H)
Rod failure
UTA-0004 Unirr./Unirr. 0.61 345 1740 0.575 a 3 27 0.020 0.000 --- --- --- In-pile failure 60s after shutdown
UTA-0004 Unirr./Unirr. 0.61 260 1575 0.505 a 54 11 0.317 --- 0.255 --- --- In-pile failure + post-test handling fracture
UTA-0005 Unirr./Unirr. 0.61 39 1410 0.567 93 2 0.570 0.575 0.551 --- --- Intact
UTA-0006 Unirr./Unirr. 0.61 78 1450 0.768 97 2 0.591 0.590 0.569 --- --- Intact
UTA-0007 Unirr./Unirr. 0.61 180 1480 0.663 79 6 0.471 0.523 0.457 --- --- Intact
UTA-0008 Unirr./Unirr. 0.61 101 1600 0.533 71 7 0.430 b 0.422 0.373 --- --- Intact
A-0014 Unirr./Unirr. 0.61 57 1450 0.623 90 3 0.553 c 0.572 0.534 --- --- Intact
A-0015 Unirr./Unirr. 0.61 17 1640 0.483 84 4 0.502 0.517 0.490 --- --- Intact
A-0021 Unirr./Unirr. 0.61 26 1580 0.425 a 88 6 0.509 --- 0.488 0.441 340 In-pile breach + post-test handling fracture
UTA-0014 Unirr./Unirr. 0.61 55 1475 0.600 87 4 0.530 b 0.549 0.519 --- --- Intact
UTA-0015 Unirr./Unirr. 0.61 67 1625 0.606 72 7 0.426 0.446 0.393 --- --- Intact
UTA-0016 Unirr./Unirr. 0.61 136 1490 0.667 78 6 0.460 0.491 0.449 0.667 50 Intact
A-0017 Unirr./Unirr. 0.61 116 1505 0.629 78 5 0.462 0.509 0.456 0.797 180 Intact
IE-001 Unirr./Unirr. 0.59 70 1690 0.482 57 14 0.337 b 0.367 0.311 --- --- Intact
IE-001 Unirr./Unirr. 0.59 288 1630 0.597 a 41 16 0.231 0.069 --- --- --- In-pile failure 80s after shutdown
IE-005 Irrad./Unirr. 0.59 37 1410 0.794 94 2 0.554 0.565 0.565 --- --- Intact
IE-007 Irrad./Irrad. 0.59 48 1860 0.501 a 22 24 0.140 0.000 --- --- --- In-pile failure 180s after shutdown
IE-008 Irrad./Irrad. 0.59 20 1540 0.559 90 3 0.530 --- --- --- --- In-pile breach due to massive hydriding (d)
IE-009 Irrad./Irrad. 0.59 60 1270 0.565 93 2 0.553 0.572 0.572 --- --- Intact
IE-010 Irrad./Irrad. 0.59 79 1640 0.559 56 16 0.332 b 0.407 0.347 --- --- Intact
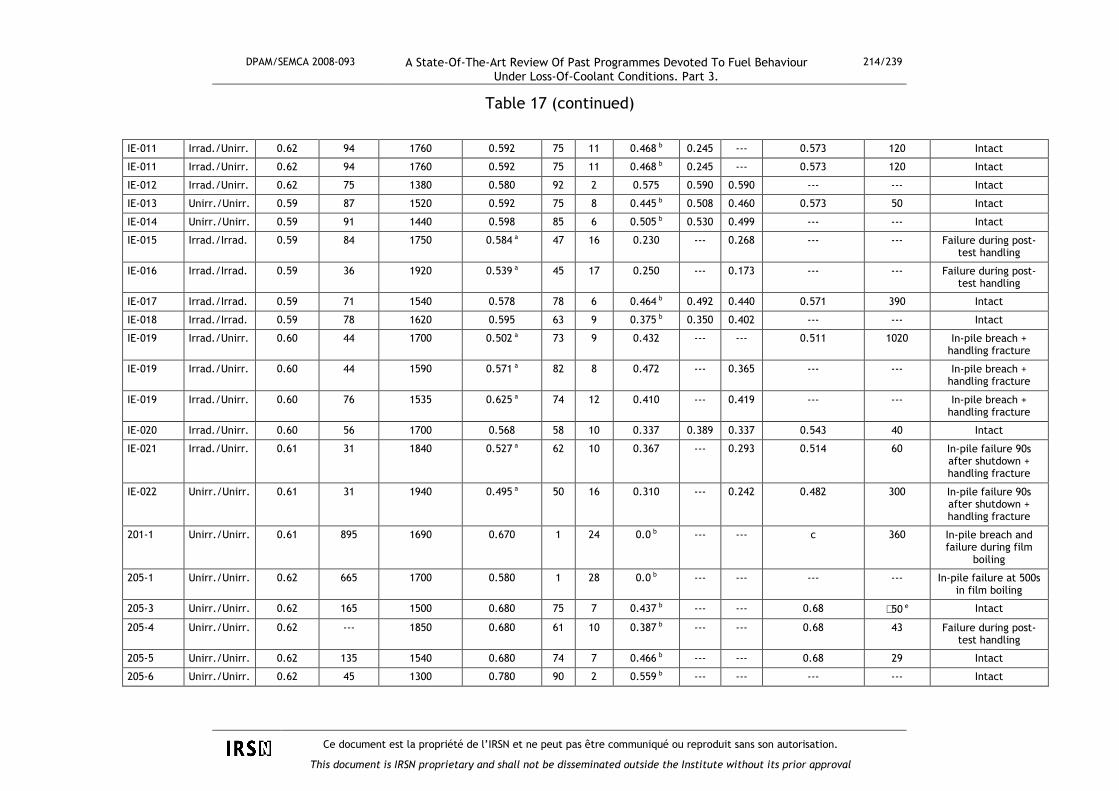
DPAM/SEMCA 2008-093 A State-Of-The-Art Review Of Past Programmes Devoted To Fuel Behaviour Under Loss-Of-Coolant Conditions. Part 3.
214/239
Ce document est la propriété de l’IRSN et ne peut pas être communiqué ou reproduit sans son autorisation.
This document is IRSN proprietary and shall not be disseminated outside the Institute without its prior approval
Table 17 (continued)
IE-011 Irrad./Unirr. 0.62 94 1760 0.592 75 11 0.468 b 0.245 --- 0.573 120 Intact
IE-011 Irrad./Unirr. 0.62 94 1760 0.592 75 11 0.468 b 0.245 --- 0.573 120 Intact
IE-012 Irrad./Unirr. 0.62 75 1380 0.580 92 2 0.575 0.590 0.590 --- --- Intact
IE-013 Unirr./Unirr. 0.59 87 1520 0.592 75 8 0.445 b 0.508 0.460 0.573 50 Intact
IE-014 Unirr./Unirr. 0.59 91 1440 0.598 85 6 0.505 b 0.530 0.499 --- --- Intact
IE-015 Irrad./Irrad. 0.59 84 1750 0.584 a 47 16 0.230 --- 0.268 --- --- Failure during post-test handling
IE-016 Irrad./Irrad. 0.59 36 1920 0.539 a 45 17 0.250 --- 0.173 --- --- Failure during post-test handling
IE-017 Irrad./Irrad. 0.59 71 1540 0.578 78 6 0.464 b 0.492 0.440 0.571 390 Intact
IE-018 Irrad./Irrad. 0.59 78 1620 0.595 63 9 0.375 b 0.350 0.402 --- --- Intact
IE-019 Irrad./Unirr. 0.60 44 1700 0.502 a 73 9 0.432 --- --- 0.511 1020 In-pile breach + handling fracture
IE-019 Irrad./Unirr. 0.60 44 1590 0.571 a 82 8 0.472 --- 0.365 --- --- In-pile breach + handling fracture
IE-019 Irrad./Unirr. 0.60 76 1535 0.625 a 74 12 0.410 --- 0.419 --- --- In-pile breach + handling fracture
IE-020 Irrad./Unirr. 0.60 56 1700 0.568 58 10 0.337 0.389 0.337 0.543 40 Intact
IE-021 Irrad./Unirr. 0.61 31 1840 0.527 a 62 10 0.367 --- 0.293 0.514 60 In-pile failure 90s after shutdown + handling fracture
IE-022 Unirr./Unirr. 0.61 31 1940 0.495 a 50 16 0.310 --- 0.242 0.482 300 In-pile failure 90s after shutdown + handling fracture
201-1 Unirr./Unirr. 0.61 895 1690 0.670 1 24 0.0 b --- --- c 360 In-pile breach and failure during film
boiling
205-1 Unirr./Unirr. 0.62 665 1700 0.580 1 28 0.0 b --- --- --- --- In-pile failure at 500s in film boiling
205-3 Unirr./Unirr. 0.62 165 1500 0.680 75 7 0.437 b --- --- 0.68 ∼50 e Intact
205-4 Unirr./Unirr. 0.62 --- 1850 0.680 61 10 0.387 b --- --- 0.68 43 Failure during post-test handling
205-5 Unirr./Unirr. 0.62 135 1540 0.680 74 7 0.466 b --- --- 0.68 29 Intact
205-6 Unirr./Unirr. 0.62 45 1300 0.780 90 2 0.559 b --- --- --- --- Intact

DPAM/SEMCA 2008-093 A State-Of-The-Art Review Of Past Programmes Devoted To Fuel Behaviour Under Loss-Of-Coolant Conditions. Part 3.
215/239
Ce document est la propriété de l’IRSN et ne peut pas être communiqué ou reproduit sans son autorisation.
This document is IRSN proprietary and shall not be disseminated outside the Institute without its prior approval
Table 17 (continued)
205-8 Unirr./Unirr. 0.62 310 1750 0.68 16 21 0.110 b --- --- --- --- In-pile failure at 250s
in film boiling
207-1 Unirr./Unirr. 0.61 250 1570 0.622 94 5 0.420 0.495 0.438 --- --- Intact
207-2 Unirr./Unirr. 0.61 1600 1600 0.533 a 0 100 0.0 0.0 --- --- --- In-pile failure
207-3 Unirr./Unirr. 0.61 440 1650 0.622 a 0 100 0.0 0.0 --- --- --- In-pile failure
207-4 Unirr./Unirr. 0.61 1400 1600 0.680 a 0 100 0.0 0.0 --- --- --- In-pile failure
207-5 Unirr./Unirr. 0.61 1640 --- f --- f -- f -- f --- f --- f --- f --- --- In-pile failure
207-6 Unirr./Unirr. 0.61 1160 1540 0.554 0 100 0.0 --- --- --- --- In-pile failure
a.: fracture location
b: the width of the remaining β-phase was determined on the basis of the original wall thickness
c: cladding samples analysed were taken from rod fragments within the high-power region of the test rod
d: failure not attributed to PCM conditions
e: value of the content was estimated metallographically
f: failed section of fuel rod broke away from the fuel rod in-pile and was missing during post-test examination
g: Lβ(0.9) = beta-phase thickness containing ≤ 0.9 wt% oxygen
h: Lβ(0.7) = beta-phase thickness containing ≤ 0.7 wt% oxygen

DPAM/SEMCA 2008-093 A State-Of-The-Art Review Of Past Programmes Devoted To Fuel Behaviour Under Loss-Of-Coolant Conditions. Part 3.
216/239
Ce document est la propriété de l’IRSN et ne peut pas être communiqué ou reproduit sans son autorisation.
This document is IRSN proprietary and shall not be disseminated outside the Institute without its prior approval
4.12.1.2.1 Scatena criterion
Figures 203 and 204 respectively show the failure maps for thermal shock failures (or failures during the high temperature transient) and post-test handing failures as a function of the oxidation temperature and the fraction of remaining Zr-β. The limit of Scatena’s criterion (FW ≥ 50%) plotted in these figures bounds the thermal shock failure for both ANL and PBF tests; in particular, the failures occurring during film boiling (201-1, 205-1 and 205-8 in Table 17) occur at FW < 50%. However, the criterion limit is no longer acceptable for handling failures, particularly in the PBF tests for which 7 failures occurred above the 50% limit. This is not surprising since Scatena’s criterion – based on unrestrained thermal shock failure – is unsuitable for resistance to handling or a 0.3 J impact.
Figure 203: Fraction of the remaining beta phase Fw in the oxidised cladding as a function of temperature (thermal shock data)
Figure 204: Fraction of the remaining beta phase Fw in the oxidised cladding as a function of temperature (handling failure data)

DPAM/SEMCA 2008-093 A State-Of-The-Art Review Of Past Programmes Devoted To Fuel Behaviour Under Loss-Of-Coolant Conditions. Part 3.
217/239
Ce document est la propriété de l’IRSN et ne peut pas être communiqué ou reproduit sans son autorisation.
This document is IRSN proprietary and shall not be disseminated outside the Institute without its prior approval
4.12.1.2.2 USNRC acceptance criteria
In the same way, Figures 205 and 206 respectively show the failure maps for thermal shock failures and post-test handling failures as a function of the effective temperature and the equivalent cladding reacted (ECR). The ECR limit ≤ 17 % (current acceptance criterion) covers all thermal shock failures for all in-pile or out-of-pile tests, with a significant margin for T < 1400 K where the failure limit seems to be located above 30% ECR. In particular, the failures occurring during film boiling take place at an ECR > 20%.
Figure205: Equivalent cladding reacted as a function of temperature (thermal shock data)
However, Figure 206 shows that the ECR values of all in-pile handling failures and one out-of-pile handling failure (already indicated in § 4.5.3.4) are located below the limit of 17%. The failure of the PBF rods during handling support the idea that the ECR criterion < 17% must be supplemented by the PCT criterion < 1477 K, which proves to be the only criterion capable of covering these failures, given the fact that it is based on preventing zero ductility at room temperature.
Figure 206: Equivalent cladding reacted as a function of temperature (handling failure data)

DPAM/SEMCA 2008-093 A State-Of-The-Art Review Of Past Programmes Devoted To Fuel Behaviour Under Loss-Of-Coolant Conditions. Part 3.
218/239
Ce document est la propriété de l’IRSN et ne peut pas être communiqué ou reproduit sans son autorisation.
This document is IRSN proprietary and shall not be disseminated outside the Institute without its prior approval
4.12.1.2.3 Pawel criterion
Figure 207 provides a failure map as a function of the oxidation temperature and the oxidation time and also shows the limit of Pawel’s criterion. It must be remembered that this criterion contains the two following limits on the mean oxygen concentration Cβ in the Zr-β layer:
Cβ < 0.7 wt%
or Cβ < 95% of the saturation concentration
Figure 207: Failure map for the in-pile tests (PBF) and the out-of-pile tests (ANL)
This criterion bounds all out-of-pile and in-pile thermal shock failures (or failures during the high temperature transient) as well as handling failures, except one ANL rod oxidised at high temperature (1400°C, 23 s) that failed under an impact of 0.03 J and is located slightly below the limit, and three PBF rods that operated in film boiling during testing with breached cladding and failed during post-test handling:
- For rod A-0021, cracking probably occurred on a pre-existent defect, which is suggested by the presence of an oxide layer on the cladding inner surface that seems to be as thick as the layer on the outer surface.
- For the high-pressure rod IE-019, ballooning and failure at 10 seconds occurred during the film boiling transient (detected by the rod internal pressure sensor), which resulted in steam access to the rod interior during the remaining 60 seconds of the transient.

DPAM/SEMCA 2008-093 A State-Of-The-Art Review Of Past Programmes Devoted To Fuel Behaviour Under Loss-Of-Coolant Conditions. Part 3.
219/239
Ce document est la propriété de l’IRSN et ne peut pas être communiqué ou reproduit sans son autorisation.
This document is IRSN proprietary and shall not be disseminated outside the Institute without its prior approval
Metallographic examination of the PBF rods IE-0019 and A-0021 revealed a specific structure, as shown in Figure 208. It can be seen that the oxygen-stabilised alpha layers formed beneath the oxide layers are rather thin in comparison with the α layers in typically oxidised cladding for similar oxidising conditions, which leaves a thick layer of transformed β phase structure (FW of 0.73 to 0.88) containing an abnormally high precipitation of α phase along the prior β grain boundaries (rim α) and acicular precipitation of alpha martensitic needles within the beta grain.
(a) Rod IE-019, elevation 0.584 m
(b) Rod A-0021, elevation 0.46 m
Figure 208: Microstructure in the fracture region of PBF rods IE-019 and A-0021
The absorbed hydrogen concentration measured in these samples near the fracture locations reached 340 wppm and 1020 wppm, which is significantly higher than that for the other one-sided oxidised samples. Metallographic examinations also revealed the presence of radially-oriented hydrides (see Figure 208) but in a very limited number. This suggests that the significant quantity of absorbed hydrogen could have remained in solution during cooling or precipitated in very fine hydrides unresolved by optical microscopy. This observation is consistent with a similar observation made during examination of HYDRAZIR test samples [53].
Sample A-0021 and IE-019 therefore underwent additional embrittlement owing to two-sided oxidation with stagnant atmosphere in the rod interior, which favoured the absorption of hydrogen and particular features in the prior β layer microstructure with significant α phase precipitation. The ANL out-of-pile test (located slightly below the limit of 0.7 wt% of oxygen in Figure 207 and failed under 0.03 J impact test) also underwent two-sided oxidation with stagnant atmosphere in the rod interior.
These exceptions are not surprising because Pawel’s criterion was based on the Hobson tests, thus on samples that did not absorb hydrogen or oxidise in stagnant atmosphere on the inner side.
Conversely, rods IE-010 and IE-020 – both intact – were located above the limit Cβ < 0.7 % of Pawel’s criterion (not very visible in Figure 207) and should have failed according to the criterion, even though all the other criteria predict that they will remain intact. Diametral compression tests on samples taken from the film boiling zone of these rods revealed almost zero ductility (2% for IE-010 and 0% for IE-020). These results suggest that Pawel’s criterion is suitable for samples that do not absorb hydrogen.

DPAM/SEMCA 2008-093 A State-Of-The-Art Review Of Past Programmes Devoted To Fuel Behaviour Under Loss-Of-Coolant Conditions. Part 3.
220/239
Ce document est la propriété de l’IRSN et ne peut pas être communiqué ou reproduit sans son autorisation.
This document is IRSN proprietary and shall not be disseminated outside the Institute without its prior approval
4.12.1.2.4 Sawatzky criterion
Sawatzky’s criterion joins that of Pawel at high temperature (see Figure 111); it is therefore not met by the same four samples.
4.12.1.2.5 Chung & Kassner criteria
It is worth recalling that Chung & Kassner differentiated between thermal shock failure and handling failure in a dual criterion with two limits on the parameter: thickness of the Zr-β layer containing less than 0.9 or 0.7 wt% oxygen (L0.9 or L0.7) respectively.
Figures 209 and 210 show failure maps of the ANL and PBF tests by thermal shock and handling respectively, with the dashed line corresponding to criterion limit of Chung & Kassner.
Figure 209: Failure map of Zry-4 cladding by thermal shock relative to wall thickness with ≤≤≤≤ 0.9 wt% oxygen
Figure 210: Failure map of Zry-4 cladding due to handling relative to wall thickness with ≤≤≤≤ 0.9 wt% oxygen

DPAM/SEMCA 2008-093 A State-Of-The-Art Review Of Past Programmes Devoted To Fuel Behaviour Under Loss-Of-Coolant Conditions. Part 3.
221/239
Ce document est la propriété de l’IRSN et ne peut pas être communiqué ou reproduit sans son autorisation.
This document is IRSN proprietary and shall not be disseminated outside the Institute without its prior approval
The limit L0.9 < 0.1 mm predicts all thermal shock failures observed excepting one for an out-of-pile test.
The limit L0.7 < 0.3 mm predicts all handling failures for all out-of-pile tests but 3 in-pile handling failures were not covered by the prediction: these were the same three previously-mentioned PBF samples that operated with breached cladding during film boiling testing and also proved to be an exception for Pawel’s criterion.
The COBILD computer code that was used to determine the thicknesses L0.9 and L0.7 calculates the oxygen concentration profile by assuming one-sided oxidation only in a semi-infinite medium, therefore over-estimating the L0.7 values for cladding that could have undergone two-sided oxidation via the existing opening. A simple conservative approach was tested to investigate the applicability of Chung & Kassner’s criterion for handling failures to these rods that operated with breached cladding during film boiling testing. This approach considers an inner surface oxidation that is symmetrical to that on the outer surface and approximates the two-sided oxidation profile by the summation of the two inner and outer oxygen profiles. However, this two-sided oxidation calculation overestimates the oxygen concentration profile and therefore under-estimates the L0,7 values because the oxygen diffusion on one side is not hindered by the oxygen diffusion on the other side. Calculations based on this approach indicated that the handling failures of the two IE-019 samples were predictable by Chung & Kassner’s criterion, while the handling failure of Rod A-0021 was still not predicted, despite the under-estimation of the L0,7 value.
The discrepancy lies in the fact that the PBF tests underwent fast cooling through the β→α’ transformation range, whereas Chung & Kassner’s criterion for handling failure is based on rods that were cooled slowly through the β→α’ transformation; such a difference was already remarked in § 4.5.4.
4.12.1.3 Conclusions on the PBF in-pile tests
Though comparison of the PBF in-pile transient test results with the ANL out-of-pile isothermal test results proves to be complex because an effective isothermal temperature must be calculated for the transient tests, there was nevertheless rather good consistency between the two types of tests.
Generally speaking, thermal shock failures were all predicted by all the criteria. These predictions tended to be all the more conservative, the lower the oxidation temperature.
Post-test handling failures were correctly predicted only by the USNRC acceptance criterion of PCT <1477 K and, to a lesser extent, by Pawel’s criterion and Chung & Kassner’s criterion for handling.
Three PBF samples proved to be an exception to Pawel’s criterion and Chung & Kassner’s criterion for handling due to several different reasons:
- The samples were taken from rods that failed during the oxidation transient and were therefore oxidised on the inner surface via a small opening, with hydrogen absorption and precipitation of α-Zr and hydrides during cooling.
- The samples underwent fast cooling through the β→α' transformation range.
Last of all, the results presented by Haggag [121] made no reference to any specific observation related to irradiated cladding that possibly indicated some kind of influence of the initial cladding state (pre-corrosion or irradiation). It can be argued that the small number of tests on irradiated cladding and the relatively low burn-up (< 16 GWd/tU) made it impossible to define the behaviour of previously-irradiated cladding.

DPAM/SEMCA 2008-093 A State-Of-The-Art Review Of Past Programmes Devoted To Fuel Behaviour Under Loss-Of-Coolant Conditions. Part 3.
222/239
Ce document est la propriété de l’IRSN et ne peut pas être communiqué ou reproduit sans son autorisation.
This document is IRSN proprietary and shall not be disseminated outside the Institute without its prior approval
4.12.2 PHEBUS-LOCA tests
The PHEBUS-LOCA programme conducted by IPSN between 1980 and 1984 is in fact the only in-pile LOCA programme with integral tests on a bundle of fuel rods. Starting from an initial state representative of nominal PWR conditions, the test transient aimed at reproducing a hypothetical large-break LOCA transient, from initial blowdown up to the final reflooding of the test train.
The PHEBUS-LOCA programme was designed so as to allow the coupling of the main thermal-hydraulic and thermomechanical phenomena occurring during a LOCA, in view of meeting the following general objectives:
� Assessing the phenomenology of fuel rod behaviour under conservative LOCA conditions, including rod bursting and a subsequent temperature plateau for cladding oxidation up to the acceptance limit, before ending with slow cooling or a prototypical reflood.
� Assessing the validity of the safety criteria with respect to the rod bundle coolability and cladding embrittlement with assessment of safety margins.
� Providing an experimental database for the validation of computer codes used in the simulation of the thermal-hydraulics and especially thermomechanics in large-break LOCA, such as the CATHACOMB module of the CATHARE computer code.
The key findings on the LOCA thermomechanical behaviour were published in [122]. The analysis of the ballooning/burst behaviour, resulting flow blockage, and test interpretation are detailed in the State-of-the Art Review/ Part 1 [1].
The PHEBUS-LOCA programme included 3 single-rod tests and 22 tests on bundles of 25 fresh UO2 rods with an active length of 0.8 m. Among the bundle tests, 7 tests were performed with pressurised rods, whereas the other tests with all non-pressurised rods were mainly used to study the thermal-hydraulic behaviour from blowdown to reflood.
Among the tests performed with pressurised rods, only the 3 last tests (Nos 216, 218 and 219) could be used to evaluate the oxidation behaviour and the thermal shock resistance of the rod cladding in the fuel rod assembly.
Comparative oxidation calculations were performed for the temperature transients of tests 218 and 219 using the computer codes PRECIP2 (with a diffusion model) and FRAP-T (with Cathcart’s parabolic correlation). Table 18 compares experimental information with the calculations for PHEBUS test 218 at 400 s near the different thermocouples locations at mid-height on the rods. This table shows that the oxide thicknesses are correctly predicted by the two calculations but the thickness of the α-Zr layer (not calculated by FRAP) is rather over-estimated by PRECIP.
Oxide thickness (µm) Thickness of α-Zr layer (µm)
Rod /TC Experiment PRECIP 2 FRAP Experiment PRECIP 2
CR19/TC32 25 31.3 30.3 27 43.6
CR3/TC15 35 37.8 36.1 42 52.1
CR3/TC16 19 19.4 18.5 23 21.3
CR18/TC19 54 56.4 55.2 47 96.4
CR9/TC59 37 38.2 36.5 52 52.1
CR12/TC27 44 48.0 46.4 54 71.5
Table 18: Comparison of oxidation calculation predictions with measurements from the Phebus test 218

DPAM/SEMCA 2008-093 A State-Of-The-Art Review Of Past Programmes Devoted To Fuel Behaviour Under Loss-Of-Coolant Conditions. Part 3.
223/239
Ce document est la propriété de l’IRSN et ne peut pas être communiqué ou reproduit sans son autorisation.
This document is IRSN proprietary and shall not be disseminated outside the Institute without its prior approval
Thermal shock behaviour is only very briefly compared with embrittlement criteria; we will merely report the following observations from tests 216 and 218:
- In test 216, rod No 7 did not fail with a calculated ECR of 30.4% and showed a calculated metal thickness of 263 µm with an oxygen concentration of < 0.9%. The acceptance criterion of 17% ECR appears to be very conservative in this case, whereas Chung & Kassner’s criterion for thermal shock failure was not proved wrong.
- In test 219, rod No 18 – whose maximum transient temperature was evaluated at ∼ 1330°C as measured on a rod in a similar position – appeared fragmented during post-test examinations (see Figure 211), with significant loss of cladding fragments at certain axial levels. The ECR on this rod cladding was nevertheless estimated at 16.2% even though the oxygen concentration in the metal was > 0.9% (indicating failure according to Chung & Kassner’s criteria). This observation confirms that the acceptance criterion of ECR<17% is to be associated with the temperature criterion of T<1204°C for high temperature transients resulting in the significant diffusion of oxygen into the Zr-β layer.
Figure 211: Cross-section of a portion of the fuel assembly from the PHEBUS LOCA test 219 showing cladding fragmentation on rod No 18
Fragmentation of rod No 18 from the PHEBUS test 219 occurred with a moderate ECR. This can be linked to the observation – during post-test examination – of significant transversal displacements in the bundle at mid-height on the rods (see Figure 212), and cracking over half the circumference detected in one of the bundle’s tie rods (ensuring the mechanical connection between top and bottom plates). These observations point strongly to the bowing of the rods during the test transient, which must have generated sufficient axial loads to cause the failure of rod No 18 at a significantly reduced ECR as compared to the limit expected for unrestrained rods.
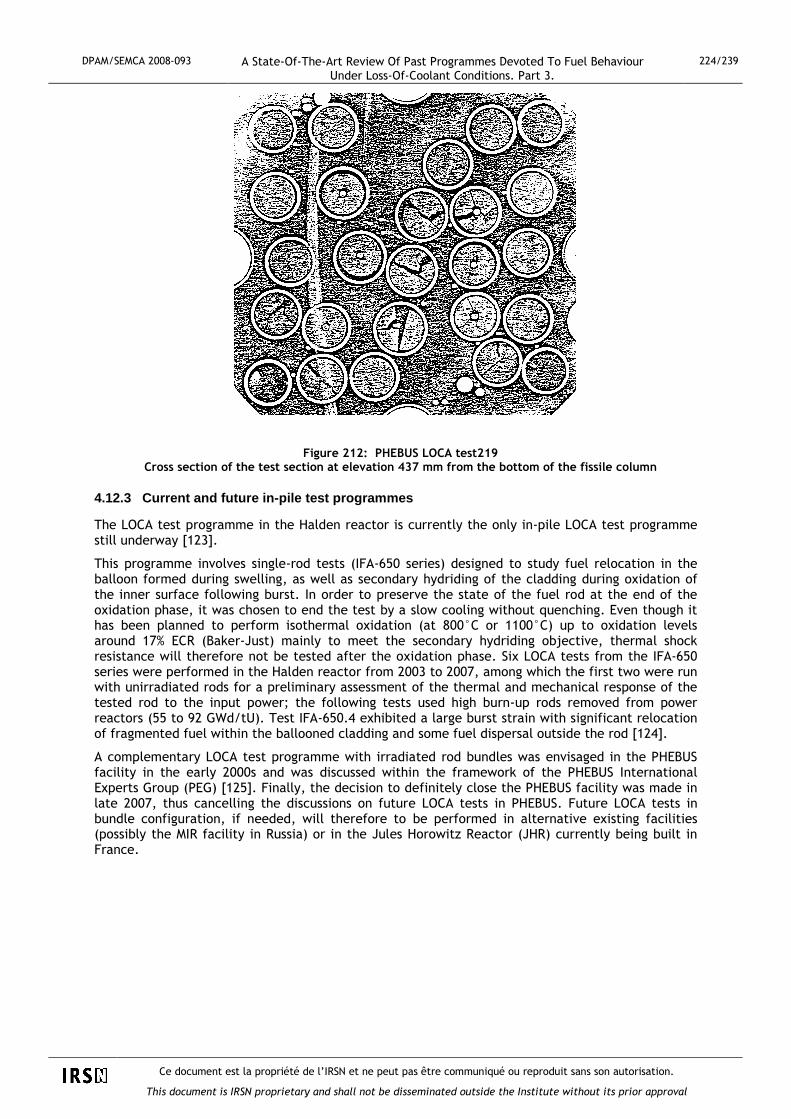
DPAM/SEMCA 2008-093 A State-Of-The-Art Review Of Past Programmes Devoted To Fuel Behaviour Under Loss-Of-Coolant Conditions. Part 3.
224/239
Ce document est la propriété de l’IRSN et ne peut pas être communiqué ou reproduit sans son autorisation.
This document is IRSN proprietary and shall not be disseminated outside the Institute without its prior approval
Figure 212: PHEBUS LOCA test219 Cross section of the test section at elevation 437 mm from the bottom of the fissile column
4.12.3 Current and future in-pile test programmes
The LOCA test programme in the Halden reactor is currently the only in-pile LOCA test programme still underway [123].
This programme involves single-rod tests (IFA-650 series) designed to study fuel relocation in the balloon formed during swelling, as well as secondary hydriding of the cladding during oxidation of the inner surface following burst. In order to preserve the state of the fuel rod at the end of the oxidation phase, it was chosen to end the test by a slow cooling without quenching. Even though it has been planned to perform isothermal oxidation (at 800°C or 1100°C) up to oxidation levels around 17% ECR (Baker-Just) mainly to meet the secondary hydriding objective, thermal shock resistance will therefore not be tested after the oxidation phase. Six LOCA tests from the IFA-650 series were performed in the Halden reactor from 2003 to 2007, among which the first two were run with unirradiated rods for a preliminary assessment of the thermal and mechanical response of the tested rod to the input power; the following tests used high burn-up rods removed from power reactors (55 to 92 GWd/tU). Test IFA-650.4 exhibited a large burst strain with significant relocation of fragmented fuel within the ballooned cladding and some fuel dispersal outside the rod [124].
A complementary LOCA test programme with irradiated rod bundles was envisaged in the PHEBUS facility in the early 2000s and was discussed within the framework of the PHEBUS International Experts Group (PEG) [125]. Finally, the decision to definitely close the PHEBUS facility was made in late 2007, thus cancelling the discussions on future LOCA tests in PHEBUS. Future LOCA tests in bundle configuration, if needed, will therefore to be performed in alternative existing facilities (possibly the MIR facility in Russia) or in the Jules Horowitz Reactor (JHR) currently being built in France.

DPAM/SEMCA 2008-093 A State-Of-The-Art Review Of Past Programmes Devoted To Fuel Behaviour Under Loss-Of-Coolant Conditions. Part 3.
225/239
Ce document est la propriété de l’IRSN et ne peut pas être communiqué ou reproduit sans son autorisation.
This document is IRSN proprietary and shall not be disseminated outside the Institute without its prior approval
5 CONCLUSIONS
5.1 Zircaloy oxidation under LOCA conditions
Since the publication of the Baker-Just equation in 1962, the oxidation of Zircaloy at high temperature by steam has been thoroughly investigated, making it possible to compile a comprehensive database on the various aspects of this phenomenon.
5.1.1 Isothermal oxidation kinetics
Isothermal oxidation kinetics are correctly represented by parabolic rate equations, with the reaction rate Kp depending on the temperature according to an Arrhenius law, and by differentiating between the different phase domains of zirconia (monoclinic, tetragonal and cubic). In the LOCA temperature range, the scatter of results from various investigations can be reduced by classifying the results according to how the samples were heated (internal or external heating).
5.1.2 Effect of the finite-size of samples
For long oxidations at high temperature, the finite-size of the sample leads to the oxygen saturation of the internal metallic layer, which results in a significant deviation from the parabolic kinetics on the growth of the alpha layer. To correctly predict oxidation under time-temperature conditions where the finite-size effect of the sample is no longer insignificant, an oxygen diffusion model based on the application of Fick’s laws in a multiphase system with moving boundaries is required.
5.1.3 Transient oxidation
Transient oxidation tests representative of a LOCA (1st peak, subsequent cooling, and temperature ramp up to an oxidation plateau) revealed the possibility of significantly less oxidation than that predicted by the isothermal kinetic laws. This “abnormal” oxidation can be explained by the effect of the partial transformation of zirconia from the initially formed tetragonal phase into the monoclinic phase, as well as the persistence of this monoclinic phase where oxygen diffuses at a slower rate than in the tetragonal phase via a temperature hysteresis in the inverse transformation during the second ramp up to the temperature plateau.
5.1.4 Effect of initial oxidation
Tests performed at KfK showed that an initial oxide layer – formed in steam between 350°C and 800°C – has a protective effect against oxidation at 1000°C but that this effect disappeared with oxidation at 1200°C. TAGCIS tests on pre-corroded cladding under PWR conditions, and TAGCIR tests on cladding irradiated at high burn-up revealed the poor protective effect of the initial oxide layer during high temperature oxidation (between 1050°C and 1300°C) which falls within the uncertainty on the measurement of the oxide thicknesses. Tests performed at JAERI indicated a slight protective effect of the corrosion layer pre-formed in reactor for oxidations in the low temperature and time ranges, but decreasing as temperature and time increase to vanish at T=1200°C and ECR>15%.
5.1.5 Effect of irradiation or initial hydrogen con centration
Irradiation (or initial corrosion) had an effect on the high-temperature oxidation kinetics in the TAGCIR tests, which was explained by the hydrogen uptake in the Zircaloy cladding during the corrosion process. This minor effect (<15% in relation to the kinetics of as-received material) was not validated in tests on irradiated cladding performed in Japan. Though it cannot be disregarded entirely owing to the HYDRAZIR test results, an intrinsic effect of hydrogen was not clearly explained insofar as the effect observed in HYDRAZIR tests remained restricted to low concentrations. If such an effect exists, the influence upon the oxidation kinetics is small (typically <15% on the weight gain kinetics), and falls within the experimental uncertainties for this type of test.
Results from recent investigations at UJP, involving steam oxidation in the 800-1000°C temperature range of pre-oxidised cladding samples, suggested that the initial oxide layer may partially dissolve

DPAM/SEMCA 2008-093 A State-Of-The-Art Review Of Past Programmes Devoted To Fuel Behaviour Under Loss-Of-Coolant Conditions. Part 3.
226/239
Ce document est la propriété de l’IRSN et ne peut pas être communiqué ou reproduit sans son autorisation.
This document is IRSN proprietary and shall not be disseminated outside the Institute without its prior approval
in the underlying metal while oxygen diffusion from steam remains slow through the oxide scale. This may lead to high cladding embrtittlement from very low transient ECRs.
5.1.6 Influence of dilution of the steam oxidising atmosphere
The various investigations focusing on oxidation in a diluted steam atmosphere helped reach the following main conclusions:
- The dilution of steam in a mixture of steam + hydrogen or in a mixture of steam + neutral gas only reduces the oxidation kinetics when the dilution levels are significant, typically for steam mole fractions below 10%. This reduction mainly appears as a result of a limited quantity of steam on the sample surface during the gaseous diffusion from the bulk mixture towards the cladding wall and during the chemisorption and dissociation processes of the water molecules on the wall.
- The presence of a significant quantity of hydrogen in the oxidising atmosphere does not result in a “blanketing” effect specific to hydrogen, thereby reducing the oxidation kinetics for a lower steam mole fraction than in the case of a neutral gas. However, a hydrogen fraction around VH2/VH2O ∼ 0.3 to 0.5 leads to a fluctuation in the oxidation process, which in turn results in the significant absorption of hydrogen in the sample, associated with the appearance of a porous oxide composed of a mixture of monoclinic and tetragonal phases. It seems this process could be explained by the stabilisation of the faulty tetragonal phase in the presence of hydrogen.
5.1.7 Oxidation at high pressure
The results of oxidation experiments at high pressure have revealed the accelerating effect of pressure upon the oxidation kinetics in steam at temperatures ranging between 750°C and 1000°C.
The increase in the kinetics is associated with the partial pressure of steam and not the total pressure. It seems that this kinetic increase can be tied to the appearance of cracks and porosities in the outer oxide layer, related to the tetragonal-to-monoclinic transformation of zirconia, which could be favoured by the steam pressure. The physical phenomenon responsible for this accelerating effect at high steam pressure remains to be clarified.
In the 35-50 bar range (the possible pressure range covered during a small-break LOCA), the kinetic enhancement factor remains moderate (<2) and the pressure effect should not raise any additional safety problems for as-received Zircaloy-4 cladding. However, it must be checked that significant hydrogen absorption does not occur, and complementary tests for residual ductility (ring compression tests) should be performed if hydrogen is present. At higher pressure (>120 bar), the enhancement factor is more pronounced (∼ 3 à 5), with a relative maximum at around 750-800°C, which could question the correct evaluation of oxidation in certain types of accident transients at high pressure (ATWS, etc.).
However, the available results of oxidation tests at high pressure only concern those on as-received or non-hydrided material. In view of the hypothetical role of hydrogen in the zirconia phase transformation, as well as effects observed in the TAGCIR and HYDRAZIR oxidation tests, the behaviour of irradiated material during oxidation at high pressure remains to be checked. Tests on fresh pre-hydrided cladding should represent the first necessary stage in exploring this issue, followed by verification tests on irradiated cladding. Furthermore, considering the effect of the inner oxide layer formed during irradiation upon the absorption of hydrogen near the balloon opening observed on rod IE-19 in the PBF/IE-5 test, it would be important to perform tests involving ballooning and oxidation at high pressure on irradiated cladding that may have been defuelled but while keeping the internal oxide layer intact.
5.2 Capability of cladding to withstand thermal sho ck and post-quench loads
Since the publication of test results in the early 1970s on the resistance of oxidised cladding to thermal shock and post-quench loads (particularly the ANL tests by Hesson and the ORNL tests by Hobson), new test results from major programmes have enriched our knowledge of the failure-bearing capability of oxidised cladding under simulated LOCA conditions.

DPAM/SEMCA 2008-093 A State-Of-The-Art Review Of Past Programmes Devoted To Fuel Behaviour Under Loss-Of-Coolant Conditions. Part 3.
227/239
Ce document est la propriété de l’IRSN et ne peut pas être communiqué ou reproduit sans son autorisation.
This document is IRSN proprietary and shall not be disseminated outside the Institute without its prior approval
5.2.1 Capability to withstand thermal shock upon qu enching from oxidation temperature
The ANL integral-type tests by Chung & Kassner, with quenching at oxidation temperature, indicated a thermal shock resistance limit above 33% ECR (best-estimate evaluation) for temperatures ≤ 1300°C, with this limit increasing at the lowest temperatures. JAERI unconstrained integral-type test results indicated a thermal-shock failure limit of about 38% ECR (evaluated using the Baker-Just correlation) in the 1983 tests, which increased to 60% in the 1999 tests. Comparative analysis of two-sided oxidation tests on as-received cladding from the TAGCIS, HYDRAZIR and CINOG programmes showed the good consistency of these results, with failure limits around 30% ECR (best-estimate evaluation) for quenching at oxidation temperature. These different results reveal the existence of a noticeable margin of conservatism in relation to the regulatory limit of 17% ECR (evaluated using the Baker-Just equation) for thermal shock resistance under LOCA conditions, even under penalising quench conditions at oxidation temperature (direct flooding).
5.2.2 Influence of axial/ radial loads on thermal s hock resistance
During the 1973 ECCS Hearing discussions, the Regulatory Staff and the AEC Commissioners were clearly reserved about disregarding the effects of mechanical constraints – particularly assembly restraints and rod-to-rod interactions– in relation to thermal shock loads during quenching. Results from unconstrained quench tests were considered only corroborative and reassuring but their use for regulatory purposes was deemed unacceptable.
The results of the JAERI integral-type tests – constrained or unconstrained during reflood – demonstrated the significant effect of axial loads on the mechanical resistance of cladding during a LOCA:
Fully restraint conditions at quench reduce the ECR failure limit (calculated with Baker-Just) to about 20%, so by a factor of 2 to 3 in comparison with unrestrained conditions.
The failure limit under fully restrained conditions during reflood drops to an ECR of 10% for pre-hydrided cladding (400-700 wppm), but is still around 20% for controlled axial loads deemed more realistic (< 600 N).
Quench failure on unrestrained as-received or pre-hydrided samples mainly occurs outside the balloon, which indicates the prevalent influence of secondary hydriding resulting from inner oxidation, with a minor contribution from the initial hydrogen uptake. However, quench failure under restrained conditions mainly occurs on the balloon, which indicates the prevalent influence of local oxidation on the thinned cladding, possibly combined with the initial hydrogen uptake for pre-hydrided samples.
The PHEBUS 219 test showed that bundle restraint loads and/or rod-to-rod interactions cannot be disregarded, and that a temperature criterion is therefore fully justified.
5.2.3 Effect of irradiation or initial corrosion an d hydriding
The TAGCIR test results on irradiated cladding suggest that the initial oxide layer does not contribute to the mechanical resistance to thermal shock. Comparison of failure limits for as-received and irradiated cladding led to the conclusion that irradiation and the associated cladding corrosion do not significantly change the thermal shock resistance limits – under axially unrestrained conditions– in comparison with as-received cladding. Comparative analysis of the TAGCIR tests on irradiated cladding and HYDRAZIR tests on cladding pre-hydrided at low hydrogen contents (<1000 wppm) showed good consistency between the results, with similar failure limits upon direct quenching from the oxidation temperature, of about 28% to 30% transient ECR.
The integral-type tests performed at JAEA on irradiated PWR rods with Zircaloy-4 cladding (BU<44 GWd/t) – supplemented by more recent tests in the ALPS programme on PWR rods with advanced cladding alloys irradiated at BU from 66 to 79 GWd/t – follow the trend observed in tests on fresh pre-hydrided cladding tubes in terms of failure during quenching under restrained conditions. These tests also supported the conclusion by JAEA that the failure boundary is not significantly reduced by PWR irradiation in the intermediate and high burn-up level.
However, research performed by JAERI in the 1980s showed that hydrogen significantly reduced the post-quench ductility in comparison to fresh cladding oxidised under the same time-temperature conditions. These JAERI tests provided a preliminary estimate of the transient ECR criterion for

DPAM/SEMCA 2008-093 A State-Of-The-Art Review Of Past Programmes Devoted To Fuel Behaviour Under Loss-Of-Coolant Conditions. Part 3.
228/239
Ce document est la propriété de l’IRSN et ne peut pas être communiqué ou reproduit sans son autorisation.
This document is IRSN proprietary and shall not be disseminated outside the Institute without its prior approval
Zircaloy-4 at high burn-ups: ~3% ECR for a hydrogen concentration of 535 wppm, and ~2.5% ECR for a hydrogen concentration of 755 wppm. These values are being refined and supplemented by the comprehensive results of the test programme underway at ANL since the mid-90s.
In recent investigations by CEA, post-quench mechanical tests revealed that hydrogen significantly influences the post-quench mechanical properties via two mechanisms: 1) an intrinsic hydrogen embrittlement effect and 2) an enhanced hardening of the prior-β phase due to higher oxygen solubility in the presence of hydrogen.
The results of recent ANL ring compression tests at 135°C on pre-hydrided cladding oxidised at 1200°C and quenched at 800°C show a significant reduction in post-quench ductility. For 15x15 Zry-4 oxidised to 5% CP-ECR at ≈1190°C maximum oxidation temperature, the ductile-to-brittle transition hydrogen content was determined to be ≈530 wppm. For quench at 800ºC, post-quench ductility and ductile-to-brittle transition CP-ECR are therefore highly sensitive to the hydrogen content. A limited comparison of the data for slow-cooled samples suggests that the ductility of pre-hydrided Zry-4 is comparable (within the data scatter) to the ductility of high burn-up Zry-4.
5.2.4 Hydriding at the ends of ballooned and burst rods
Hydrogen uptake occurs on the inner surface of the cladding that has ruptured during the swelling phase due to steam ingress through the opening and inner oxidation in stagnant steam conditions. This uptake shows two peaks on each side of the opening in locations where the hydrogen + steam mixture is optimal and where the absorbed hydrogen content can reach several thousand wppm. The hydrogen uptake at these locations leads to a strong reduction in ductility despite oxidation rates well below 17% ECR calculated with the Baker-Just correlation.
Further results on this secondary hydriding phenomenon were recently obtained in ANL and JAEA integral-type tests on irradiated rods. For the high burn-up samples, the axial extent of hydrogen that could migrate in contact with the cladding would be limited by the presence of the fragmented and possibly relocated fuel in the balloon. Results of the ANL integral-type tests showed that the peaks of the hydrogen pickup in the high burn-up samples have shifted towards the burst centre, compared with the unirradiated samples. However, the maximum hydrogen pickups are at a similar level for both high burn-up (≈3000 wppm) and unirradiated (3500-4000 wppm) samples; this indicates that the fuel-cladding bond layer is poorly protective with respect to hydrogen uptake into the cladding.
5.2.5 Influence of the cooling scenario
During the slow cooling of Zircaloy in the β→α' transformation range, part of the oxygen found at high temperature in the β phase precipitates into oxygen-rich α incursions, which leaves a β matrix with oxygen-depleted regions, therefore more ductile than during fast cooling. This effect particularly results in better resistance to thermal shock or to a 0.3 J impact test at higher oxidation levels. The ANL integral-type tests by Chung & Kassner, which included a large body of direct quench tests or tests with slow cooling in the β→α' transformation range, revealed an increase in the oxidation time by a factor of 2 at the same temperature before the quench failure limit is reached. This effect is not expected for tin-free alloys with 1% Nb.
Recent investigations at ANL indicated that although the ductile-to-brittle transition CP-ECR of as-fabricated alloys was relatively insensitive to slow-cooling to RT vs. quench at 800°C, this was no longer true for pre-hydrided HBR-type 15x15 Zry-4. Slow cooling to room temperature without quench resulted in a small, but significant, enhancement in ductility.
However, these results from ANL tests appear controversial in comparison with those recently obtained from investigations at CEA. Though these tests were conducted with significantly lower cooling rates, they nevertheless indicated 1) a surprisingly high restoration of the post-quench ductility after slow cooling down to 700 or 600°C and quench, and 2) some ductility restoration after slow cooling down to room temperature without quench, but significantly less than for quench at 700 or 600°C.
Further work is thus needed to better understand these complex phenomena while taking into account the effect of the pre-quenching cooling rate.

DPAM/SEMCA 2008-093 A State-Of-The-Art Review Of Past Programmes Devoted To Fuel Behaviour Under Loss-Of-Coolant Conditions. Part 3.
229/239
Ce document est la propriété de l’IRSN et ne peut pas être communiqué ou reproduit sans son autorisation.
This document is IRSN proprietary and shall not be disseminated outside the Institute without its prior approval
5.2.6 Resistance to failure under different kind of mechanical testing
ANL impact tests at 0.3 J on ballooned and burst rods by Chung & Kassner showed that the 17% ECR criterion guaranteed resistance to a 0.3 J impact, even at the ends of balloons having picked up a lot of hydrogen (see 5.2.4 above). In these tests, the effect of the hydrogen content seems to compensate for the thinning that resulted from ballooning.
However, recent investigations at CEA showed good agreement between the energy to failure in all kinds of mechanical testing (ring compression, 3-point bending and impact), which made it possible to conclude that the energy-to-failure is a relevant parameter for analysing embrittlement in these various test types.
5.2.7 Thermal-shock and handling failures in the PB F in-pile tests
Though comparison of the PBF in-pile transient test results with out-of-pile isothermal test results proved to be complex because an effective isothermal temperature must be evaluated for the transient tests, there was nevertheless rather good consistency between the two types of tests:
- Generally speaking, thermal shock failures were all predicted by all the embrittlement criteria. These predictions tended to be all the more conservative, the lower the oxidation temperature.
- Post-test handling failures were correctly predicted only by the USNRC acceptance criterion of PCT <1477 K and, to a lesser extent, by Pawel’s criterion and Chung & Kassner’s criterion for handling.

DPAM/SEMCA 2008-093 A State-Of-The-Art Review Of Past Programmes Devoted To Fuel Behaviour Under Loss-Of-Coolant Conditions. Part 3.
230/239
Ce document est la propriété de l’IRSN et ne peut pas être communiqué ou reproduit sans son autorisation.
This document is IRSN proprietary and shall not be disseminated outside the Institute without its prior approval
REFERENCES 1. C. GRANDJEAN,
A State-of-the-Art Review of past programs devoted to fuel behavior under LOCA conditions – Part one. Clad swelling and rupture – Assembly flow blockage. Technical report IRSN SEMCA 2005/313, December 2005.
2. C. GRANDJEAN,
A State-of-the-Art Review of past programs devoted to fuel behavior under LOCA conditions – Part two. Impact of clad swelling upon assembly cooling. Technical report IRSN SEMCA 2006/183, June 2006.
3. PARSONS P.D., HINDLE E.D, MANN C.A. The Deformation, Oxidation and Embrittlement of PWR Fuel Cladding in a Loss-of-Coolant
Accident. A State-of-the-Art Report. NEA/OECD-CSNI Report 129, December 1986. 4. L. BAKER, L.C. JUST, Studies ofMetal-Water Reactions at High Temperatures ; III. Experimental and Theoretical
Studies of the Zirconium-Water Reaction. ANL-6548, Argonne National Laboratory, May 1962. 5. W. A. BOSTROM, The High Temperature Oxidation of Ziracloy in Water, WAPD-104, March 1954. 6. A.W. LEMMON, Jr., Studies Relating to the Reaction between Zirconium and Water at High Temperatures. BMI-1154 January 1957. 7. Reported in NEDO-10674, G.J. Scatena, (Référence [8]) 8. G.J. SCATENA, Fuel Cladding Embrittlement During a Loss-of-Coolant-Accident. NEDO-10674, General Electric Company, October 1972. 9. D.O. HOBSON, P.L. RITTENHOUSE, Embrittlement of Zircaloy-Clad Fuel Rods by Steam During LOCA Transients ORNL-4758, Oak Ridge National Laboratory, January 1972. 10. R.E. PAWEL, Oxygen Diffusion in Beta Zircaloy During Steam Oxidation J. of Nucl. Mat. 50 (1974), pp 247-258. 11. J. C. HESSON et al. Laboratory Simulations of Cladding-Steam Reactions following Loss-of-Coolant Accidents in
Water-Cooled Power Reactors. ANL-7609, January 1970. 12. M.L. RUSSELL,
TMI-2 Core Cavity Sides and Floor Examinations GEND/INF-074, February 1987.
13. P. HOFMANN et al.,
Chemical Interactions between Al2O3, which is Used in Burnable Poison Rods, and Zry-4 up to 1500°C Journal of Nuclear Materials 166(1989), p287-299.

DPAM/SEMCA 2008-093 A State-Of-The-Art Review Of Past Programmes Devoted To Fuel Behaviour Under Loss-Of-Coolant Conditions. Part 3.
231/239
Ce document est la propriété de l’IRSN et ne peut pas être communiqué ou reproduit sans son autorisation.
This document is IRSN proprietary and shall not be disseminated outside the Institute without its prior approval
14. J.D. DUNCAN, J.E. LEONARD, Thermal Response and Cladding Performance of Zircaloy-Clad Simulated Fuel Bundles
under High Temperature Loss-of-Coolant Conditions GEAP-13174, May 1971. 15. R.H. MESERVEY and R. HERZEL,
Brittle Behavior of Zry in an Emergency Core Cooling Environment IN-1389, September 1970.
16. E.F. JUENKE and J.F. WHITE,
Physical-Chemical Studies of Clad UO2 under Reactor Accident Conditions GEMP-731, April 1970
17. K.L. KOMAREK and M. SILVER,
Thermodynamic Properties of Zr-O, Ti-O and Hf-O Alloys IAEA Symposium on Thermodynamics of Nuclear Materials, Vienna, 21-25 May 1962.
18. M.J. GRABER et al.,
A Metallurgical Evaluation of Simulated BWR Emergency Core Cooling Tests IN-1453, March 1971
19. M.J. GRABER and W.F. ZELEZNY,
Metallurgical Evaluation of Zry Exposed to Emergency-Core-Cooling Conditions Transactions of ANS 12(1969), p356-357.
20. R.A. LORENZ et al.,
Fuel Rod Failure under Loss-of-Coolant Conditions in TREAT Nuclear Technology 11(August 1971), p502-520.
21. R.A. LORENZ and G.W. PARKER,
Final Report on the FRF-2 Transient Test of a Zry-Clad Fuel Rod Cluster in TREAT ORNL-4710, January 1972.
22. D.O.HOBSON, Ductile-Brittle Behavior of Zry Fuel Cladding Topical Meeting on Water Reactor Safety, Salt Lake City, USA, 26 March 1973.
23. P. D. PARSONS, W.N. MILLER, The oxidation kinetics of zirconium alloys applicable to loss-of-coolant accidents. A review
of published data. UKEA Report ND-R-7(S), October 1977. 24. R.G. BALLINGER, W.G. DOBSON, R.R. BIEDERMAN, Oxidation reaction kinetics of Zircaloy-4 in an unlimited steam environment. J. of Nucl. Mat. 62 (1976), pp 213-220. 25. R.R. BIEDERMAN, R.G. BALLINGER, W.G. DOBSON, A study of Zircaloy-4 steam oxidation reaction kinetics. EPRI NP-225 Final Report, September 1976. 26. R.R. BIEDERMAN, R.D. SISSON, J.K. JONES, W.G. DOBSON, A study of Zircaloy-4 steam oxidation reaction kinetics. EPRI NP-734, Part 2. Final Report, April 1978. 27. R.E. WESTERMAN, G.M. HESSON, Zircaloy Cladding ID/OD Oxidation Studies. EPRI NP-525, Final Report, November 1977.

DPAM/SEMCA 2008-093 A State-Of-The-Art Review Of Past Programmes Devoted To Fuel Behaviour Under Loss-Of-Coolant Conditions. Part 3.
232/239
Ce document est la propriété de l’IRSN et ne peut pas être communiqué ou reproduit sans son autorisation.
This document is IRSN proprietary and shall not be disseminated outside the Institute without its prior approval
28. M. SUZUKI, S. KAWASAKI, T. FURUTA, Zircaloy Steam Reaction and Embrittlement of the Oxidized Zircaloy Tube under
Postulated Loss of Coolant Accident Conditions. JAERI-M 6879, NUREG-TR-0014, January 1977. 29. S. KAWASAKI, T. FURUTA, M. SUZUKI, Oxidation of Zircaloy-4 under High Temperature Steam Atmosphere and its Effect on
Ductility of Cladding. J. of Nucl. Sc. And Tech., 15(8), pp. 589-596, August 1978. 30. R.E. PAWEL, R.A. PERKINS, R.A. McKEE, J.V. CATHCART, G.J. YUREK, and R.E. DRUSCHEL, Diffusion of Oxygen in Beta-Zircaloy and the High Tempearature Zircaloy-Steam Reaction 3rd Int. Symp. "Zirconium in the Nuclear Industry" ASTM STP 633, pp. 119-133, 1977. 31. J.V. CATHCART, R.E. PAWEL, R.A. McKEE, R.E. DRUSCHEL, G.J. YUREK, J.J. CAMPBELL and
S.H. JURY, Zirconium Metal-Water Oxidation Kinetics IV. Reaction Rate Studies. ORNL/NUREG-17, August 1977. 32. R.E. PAWEL, J.V. CATHCART, R.A. McKEE, The Kinetics of Oxidation of Zircaloy-4 in Steam at High Tempearatures J. of Electrochemical Society, Vol. 126 (1979), pp. 1105-1111. 33. G. HACHE
Oxidation of Zr Alloys in High Pressure Steam and some Results under Atmospheric Pressure Nuclear Safety Research Conference, Washington (USA), 28-30 October 2002, NUREG/CP-0180, pp. 169-189
34. S. YAMANAKA, M. KURODA, D. SETOYAMA, F. NAGASE, H. UETSUKA, Influence of Hydrogen on the Integrity of Zircaloy Cladding under Accidental Conditions. Fuel Safety Research Specialists' Meeting, Tokai-Mura, Japan, March 4-5, 2002. 35. A.F. BROWN, T. HEALEY, The Kinetics of Total Oxygen Uptake in Steam-Oxidized Zircaloy-2 in the Range 1273-
1673°K. Journal of Nuclear Materials 88 (1980), pp. 1-6. 36. V.F. URBANIC, T.R. HEIDRICK, High Tempetature Oxidation of Zircaloy-2 and Zircaloy-4 in Steam. Journal of Nuclear Materials 75 (1978), pp. 251-261. 37. V.F. URBANIC, Oxidation of Zirconium Alloys in Steam at 1000 to 1850°C. 3rd Int. Symp. "Zirconium in the Nuclear Industry" ASTM STP 633, pp. 168-181, 1977. 38. S. LEISTIKOW, H.V.BERG, D. JENNERT, Comparative Studies of Zircaloy 4 /High Temperature Steam Oxidation under Isothermal
and Temperature Transient Conditions. Specilists' Meeting on the Behaviour of Water Reactor Fuel Elements under Accidental
Conditions. Spätind, Norway, 12-17 September 1976. 39. S. LEISTIKOW, G. SCHANZ, H.V.BERG, A.E. ALY, Comprehensive Presentation of Extended Zircaloy-4 Steam Oxidation Results (600-1600°C). OECD-NEA-CSNI/IAEA Specialists' Meeting on Water Reactor Fuel Safety and Fission Product
Release in Off-Normal and Accident Conditions. Risø National Laboratory, Denmark, 16-20 May 1983

DPAM/SEMCA 2008-093 A State-Of-The-Art Review Of Past Programmes Devoted To Fuel Behaviour Under Loss-Of-Coolant Conditions. Part 3.
233/239
Ce document est la propriété de l’IRSN et ne peut pas être communiqué ou reproduit sans son autorisation.
This document is IRSN proprietary and shall not be disseminated outside the Institute without its prior approval
40. S. LEISTIKOW, G. SCHANZ, High Temperature Oxidation of Zircaloy-4 Cladding Tubes in Steam (600-1600°C). 9th International Meeting on Metallic Corrosion. Toronto, Canada, 3-7 June 1984 41. S. LEISTIKOW, G. SCHANZ, H.v.BERG, Kinetik und Morphologie der isothermen Dampf-Oxidation von Zircaloy 4 bei 700-1300°C. Kfk 2587, Mars 1978. 42. G. SCHANZ, S. LEISTIKOW Microstructural Reasons for Mechanical Oxide Degradation (Breakaway Effect) and
Resulting Kinetical Anomalies of Zircaloy-4 /Steam High Temperature Oxidation . 8th International Congress on Metallic Corrosion. Mainz, Federal Republic of Germany, 6-11 September 1981, Vol II, pp. 1712-1717. 43. H. OCKEN, R.R. BIEDERMAN, C.R. HANN and R.E. WESTERMAN, Evaluation Models of Zircaloy Oxidation in Light of Recent Experiments. 4th Int. Symp. "Zirconium in the Nuclear Industry" ASTM STP 681, pp. 514-536, 1979. 44. H. OCKEN, An Improved Evaluation Model for Zircaloy Oxidation. Nuclear Technology, Vol. 47, pp. 343-357, Feb. 1980. 45. J.T. PRATER, E.L. COURTRIGHT Oxidation of Zircaloy-4 in Steam at 1300 to 2400°C 7th Int. Symp. "Zirconium in the Nuclear Industry" ASTM STP 939, pp. 489-503, 1987. 46. J.T. PRATER, E.L. COURTRIGHT Zircaloy-4 Oxidation at 1300 to 2400°C NUREG/CR-4889, PNL-6166, April 1987. 47. A.V. BERDYSHEV, L.V. MATVEEV, M.S. VESHCHUNOV, Development of the Data Base for the Kinetic Model of the Zircaloy 4/ Steam Oxidation at
High Temperatures (1000°C ≤ T ≤ 1825°C) IBRAE697-05, March1997. 48. M. MOALEM, D.R OLANDER, Oxidation of Zircaloy-by Steam. Journal of Nuclear Materials 182 (1991), pp. 170-194. 49. R.E. PAWEL and J.J. CAMPBELL, The Observation of Effects of Finite Specimen Geometry on the Oxidation Kinetics of
Zircaloy-4. Journal of the Electrochemical Society, Vol 127, No 10, pp. 2188-2194, October 1980. 50. A. SAWATZKY, G.A. LEDOUX and S. JONES, Oxidation of Zirconium During a High Temperature Transient. 3th Int. Symp. "Zirconium in the Nuclear Industry", ASTM STP 633, pp. 135-149, 1977. 51. R.R. BIEDERMAN, R.G. BALLINGER, W.G. DOBSON, A study of Zircaloy-4 steam oxidation reaction kinetics. 3rd Int. Symp. "Zirconium in the Nuclear Industry", ASTM STP 633, pp. 150-167, 1977. 52. S. LEISTIKOW, G. SCHANZ, H.v.BERG, Untersuchungen zur temperatur-transienten Dampfoxidation von Zircaloy 4 Hüllmaterial
unter hypothetischen DWR-Kühlmittelverlust-Störfallbedingungen. Kfk 2810, April 1979 (in German).

DPAM/SEMCA 2008-093 A State-Of-The-Art Review Of Past Programmes Devoted To Fuel Behaviour Under Loss-Of-Coolant Conditions. Part 3.
234/239
Ce document est la propriété de l’IRSN et ne peut pas être communiqué ou reproduit sans son autorisation.
This document is IRSN proprietary and shall not be disseminated outside the Institute without its prior approval
53. C. GRANDJEAN, Synthèse des programmes TAGCIS, TAGCIR, CODAZIR et HYDRAZIR. Note Technique IRSN/DRS/SEMAR 2002/29, Juin 2002 (in French). 54. H.J. NEITZEL, PECLOX : A Computer Model for the Calculation of the Internal and External Zircaloy
Cladding Oxidation. KfK 4422, CNEA NT-36/87 Pat II, July 1988. 55. F. NAGASE, T. OTOMO, M. TANIMOTO, H. UETSUKA, Experiments on High Burnup Fuel Behavior under LOCA Conditions at JAERI. ANS Topical Meeting on LWR Fuel Performance, April 10-13, 2000, Park City, USA. 56. Y. YAN, R.V. STRAIN, T.S. BRAY, M.C. BILLONE, High temperature Oxidation of Irradiated Limerick BWR Cladding. Proc.of the 29th Nucl. Safety Research Conf., 22-24 October 2001, Washington, USA,
NUREG/CP-0176, pp. 353-372. 57. Y. YAN, R.V. STRAIN, M.C. BILLONE,
LOCA Research Results for High Burnup BWR Fuel. 30th Nucl. Safety Research Conf., 28-30 October 2002, Washington, USA. 58. M. OZAWA, T. TAKAHASHI, T. HOMMA, K. GOTO, Behavior of Irradiated Ziracloy-4 Fuel Cladding under Simulated LOCA Conditions. Zirc. in the Nucl. Ind. :12th Int. Symp., ASTM STP 1354, pp.279-299. 59. M. AOMI, M. NAKATSUKA, S. KOMURA, T. HIROSE, T. ANAGAWA, Behavior of Irradiated BWR Fuel Cladding Tubes under Simulated LOCA Conditions. ANS Topical Meeting on LWR Fuel Performance, April 10-13, 2000, Park City, USA. 60. H.M. CHUNG, T.F. KASSNER, Embrittlement Criteria for Zircaloy Fuel Cladding Applicable to Accident Situations in
Light-Water Reactors. Summary Report. NUREG/CR-1344, ANL-7948, January 1980. 61. H.M. CHUNG and G.R. THOMAS, Rate-Limiting Effects of Gaseous Hydrogen on Zircaloy Oxidation. NRC Workshop on the Impact of Hydrogen on Water Reactor Safety. Albuquerque, NM, USA, January 26-28, 1981. 62. H.M. CHUNG and G.R. THOMAS, High Temperature Oxidation of Zircaloy in Hydrogen-Steam Mixtures. 6th Int. Symp. "Zirconium in the Nuclear Industry" ASTM STP 824, pp. 793-809, 1984. 63. H. UETSUKA, Oxidation of Ziraloy-4 under Limited Steam Supply at 1000 and 1300°C. KfK 3848, December 1984. 64. T. FURUTA, S. KAWASAKI, Reaction Behavior of Zircaloy-4 in Steam-Hydrogen Mixtures at High Temperatures. J. Nucl. Mat. 105 (1982), pp. 119-131. 65. H. UETSUKA and T. OTOMO,
High Temperature Oxidation of Ziraloy-4 in Diluted Steam. J. Nucl. Sci. and Techn., 26(2), pp. 240-248 (February 1989). 66. B. COX,
Accelerated Oxidation of Ziraloy-2 in Supercritical Steam. AECL-4448, April 1973.

DPAM/SEMCA 2008-093 A State-Of-The-Art Review Of Past Programmes Devoted To Fuel Behaviour Under Loss-Of-Coolant Conditions. Part 3.
235/239
Ce document est la propriété de l’IRSN et ne peut pas être communiqué ou reproduit sans son autorisation.
This document is IRSN proprietary and shall not be disseminated outside the Institute without its prior approval
67. R.E. PAWEL, J.V. CATHCART and J.J. CAMPBELL, The Oxidation of Zircaloy-4 at 900 and 1100°C in High Pressure Steam. J. Nucl. Mat., Vol. 82 (1979), pp. 129-139. 68. I. BRAMWELL, T.J. HASTE, D. WORSWICK and P.D. PARSONS,
An Experimental Investigation into the Oxidation of Zircaloy-4 at Elevated Pressures in the 750 to 1000°C Temperature Range..
10th Int. Symp. "Zirconium in the Nuclear Industry", ASTM STP 1245, pp. 450-465, 1994. 69. K. PARK, K.KIM, J. WHANG, Pressure Effects on High Temperature Zircaloy-4 Oxidation in Steam. ANS Topical Meeting on LWR Fuel Performance, Park City, Utah (USA), April 10-13, 2000. 70. F. GARZAROLLI, H. SEIDEL, R. TRICOT and J.P. GROS,
Oxide Growth Mechanism on Zirconium Alloys, 9th Int. Symp. "Zirconium in the Nuclear Industry", ASTM STP 1132, pp. 395-415, 1991. 71. V. VRTILKOVA et al.,
Oxiding and hydriding properties of Zr-1Nb cladding material in comparison with zircaloys, Technical Committee Meeting on Influence of Water Chemistry on Fuel Cladding Behaviour, Rez (Czech Republic), 4-8 Oct 1993, IAEA-TECDOC—927, pp 227-251.
72. M.J. BENTLEY and J.A.S. MOWAT,
Oxidation of Zry-2 under Simulated Loss-of-Coolant Accident Conditions and its Effect on Room-Temperature Ductility of SGHWR Cladding Nuclear Fuel Performance Conference, London (UK), 15 October 1973, pp. 82.1-82.5.
73. M.J. BENTLEY and F.W. TROWSE,
The Embrittlement of Zry Fuel Cladding by Corrosion in LOCA Conditions TRG Report 2498(S), October 1973.
74. R.E. PAWEL, Diffusion in a Finite System with a Moving Boundary J. Nucl. Mater. 49, pp. 281-290 (1974) 75. A. SAWATZKY, A Proposed Criterion for the Oxygen Embrittlement of Zircaloy-4 Fuel Cladding Zirconium in the Nuclear Industry (Fourth Conference), ASTM STP 681 (1979), pp. 479-496. 76. A.M. GARDE and T.F. KASSNER, Instrumented Impact Properties of Zircaloy-Oxygen and Zircaloy-Hydrogen Alloys ANL-80-14, NUREG/CR-1408 (April 1980). 77. Y. YAN, T. BURTSEVA, M.C. BILLONE,
LOCA Results for Advanced-Alloy and High-Burnup Zircaloy Cladding. 31st Nucl. Safety Research Conf., October 20-22, 2003, Washington DC, USA. 78. J. BÖHMERT, M. DIETRICH and J. LINEK,
Comparative Studies on High-temperature Corrosion of ZrNB1 and Zircaloy-4. Nuclear Engineering and Design 147 (1993), pp. 53-62.
79. J.C. BRACHET, J. PELCHAT, D. HAMON, R. MAURY, P. JAQUES, J.P. MARDON,
Mechanical Behaviour at Room Temperature and Metallurgical Study of Low-tin Zy-4 and M5TM (Zr-NbO) Alloys After Oxidation at 1100°C and Quenching.
IAEA Technical Committee Meeting on Fuel Behaviour under transient and LOCA Conditions, Halden, Norway, 10-14 September 2001.

DPAM/SEMCA 2008-093 A State-Of-The-Art Review Of Past Programmes Devoted To Fuel Behaviour Under Loss-Of-Coolant Conditions. Part 3.
236/239
Ce document est la propriété de l’IRSN et ne peut pas être communiqué ou reproduit sans son autorisation.
This document is IRSN proprietary and shall not be disseminated outside the Institute without its prior approval
80. J.C. BRACHET, et al., Thermocalc/Zircobase Calculations Applied to Zircaloys ; Influence of Oxygen and Hydrogen Concentrations on the Equilibrium α/β phases at High Temperature, CALPHAD XXXI, Stockholm (Sweden), 5-11 May 2002.
81. M.C. BILLONE, Y. YAN, T. BURTSEVA, Post-Quench Ductility of Ziracaloy, E110, ZIRLO and M5. SEGFSM Topical Meeting on LOCA Fuel Issues, Argonne National Laboratory, USA, May 25-26, 2004.
82. Y. YAN, M.C. BILLONE, T. BURTSEVA, LOCA Integral Tests on High-Burnup Ziracaloy. SEGFSM Topical Meeting on LOCA Fuel Issues, Argonne National Laboratory, USA, May 25-26, 2004.
83. M.C. BILLONE, Y. YAN, T. BURTSEVA and H. CHUNG, ANL LOCA Research Results for Cladding Alloys. Fuel Safety Reserch Meeting (FSRM-2005), Tokyo, Japan, March 2-3, 2005.
84. M.C. BILLONE, Y. YAN, T. BURTSEVA and R. DAUM, Overview of H.B. Robinson High-Burnup PWR Oxidation and Post-Quench Ductility. Technical Advisory Group Review of ANL Cladding Performance Program, Argonne National Laboratory, USA, May 10, 2005.
85. M.C. BILLONE, T. BURTSEVA, R. DAUM, W SOPPET, H. TSAI and Y. YAN, ANL LOCA Program Overview. ANL LOCA Program Review Meeting, Argonne National Laboratory, USA, June 8-9, 2006.
86. M.C. BILLONE, Y. YAN and T. BURTSEVA, Overview of ANL LOCA Program. ANL LOCA Program Review Meeting, Argonne National Laboratory, USA, October 5-6, 2007.
87. A.J. WHITE, A. SAWATZKY, S. JONES and G.A. LEDOUX, A Failure Criterion for CANDU Fuel Cladding Subjected to Thermal-Quench Loads Proc. Int. Topical Meeting : "Safety of Thermal Reactors", Portland,USA, July 21-25, 1991. 88. T. FURUTA, H. UETSUKA, S. KAWASAKI, Estimation of Conservatism of Present Embrittlement Criteria for Zircaloy Fuel Cladding
Under LOCA Zirc. in the Nucl. Ind. (Sixth Int. Symp.), ASTM STP 824, pp. 734-746 (1984). 89. F. NAGASE, M. TANIMOTO, H. UETSUKA, Study on High Burnup Fuel Behaviour under a LOCA condition at JAERI. IAEA Technical Committee Meeting on Fuel Behaviour under transient and LOCA
Conditions Halden, Norway, 10-14 September 2001. 90. H. UETSUKA, T. FURUTA, and S. KAWASAKI, Zircaloy-4 Cladding Embrittlement due to Inner Surface Oxidation under Simulated Loss-of-
Coolant Condition J. Nucl. Sci. and Techn., 18(9), pp. 705-717 (Sept 1981). 91. H. UETSUKA, T. FURUTA and S. KAWASAKI, Embrittlement of Zircaloy-4 due to Oxidation in Environment of Stagnant Steam J. Nucl. Sci. and Techn., 19(2), pp. 158-165 (Febr 1982). 92. H. UETSUKA, T. FURUTA and S. KAWASAKI, Failure-Bearing Capability of Oxidized Zircaloy-4 Cladding under Simulated Loss-of-Coolant
Condition J. Nucl. Sci. and Techn., 20(11), pp. 941-950 (Nov. 1983).

DPAM/SEMCA 2008-093 A State-Of-The-Art Review Of Past Programmes Devoted To Fuel Behaviour Under Loss-Of-Coolant Conditions. Part 3.
237/239
Ce document est la propriété de l’IRSN et ne peut pas être communiqué ou reproduit sans son autorisation.
This document is IRSN proprietary and shall not be disseminated outside the Institute without its prior approval
93. F. NAGASE, H. UETSUKA, Study on High Burnup Fuel Behaviour under a LOCA condition at JAERI : Hydrogen Effects
on the Failure-bearing Capability of Cladding Tubes Proceedings of the Nuclear Safety Research Conference held in Washington DC, USA,
October 22-24, 2001. NUREG/CP-0176, pp. 335-342. 94. T. FURUTA et al.,
Zry-Steam Reaction and Embrittlement of the Oxidized Zry Cladding Tube in a Simulated Loss-of-Coolant Accident JAERI-M-6601, June 1976
95. R.A. PERKINS,
Oxygen diffusion in beta-Zry Journal of Nuclear Materials 68 (1977) pp. 148-160
96. Y. YAN et al.,
Progress Report on E110 Post-Quench Ductility Test Program 31 May 2003
97. L. YEGOROVA and K. LIOUTOV,
Summary of Russian Results on LOCA-Related Testing of Nb-Containing Cladding Alloys Review Meeting of ANL High-Burnup Cladding Performance Program, Argonne (USA), 16-17 July 2003.
98. T. FURUTA, H. UETSUKA, and S. KAWASAKI,
Ductility Loss of Zircaloy Cladding by Inner-Surface Oxidation During High Temperature Transient
J. Nucl. Sci. and Techn., 18(10), pp. 802-810 (Oct. 1981). 99. N. WAECKEL, R. YANG, R. MONTGOMERY, P. JACQUES,
Analysis of Fuel Rod Axial Forces During LOCA Quench Proceedings of the OECD/NEA Topical Meeting on LOCA Fuel Safety Criteria Aix-en-Provence, France, 22-23 March 2001, pp.209-229, (Dec. 2001). 100. F. NAGASE and T. FUKETA,
Thermal shock resistance of irradiated claddings SEGFSM Topical Meeting on LOCA Fuel Issues, Argonne National Laboratory, USA, May 25-26, 2004.
101. F. NAGASE and T. FUKETA, Results from Studies on High Burn-up Fuel Behavior under LOCA Conditions Nuclear Safety Research Conference (NSRC-2004) Washington DC, USA, October 25-27, 2004.
102. F. NAGASE, High Burnup Fuel Behavior under LOCA Conditions Fuel Safety Research Meeting (FSRM-2005), Tokyo, Japan, March 2-3, 2005.
103. F. NAGASE, Recent results from LOCA study at JAEA Fuel Safety Research Meeting (FSRM-2006), Tokai, Japan, April 20-21, 2006.
104. F. NAGASE, Behavior of High Burnup Fuel Cladding under Simulated LOCA Conditions Fuel Safety Research Meeting (FSRM-2007), Tokai, Japan, May 16-17, 2007.
DPAM/SEMCA 2008-093 A State-Of-The-Art Review Of Past Programmes Devoted To Fuel Behaviour Under Loss-Of-Coolant Conditions. Part 3.
238/239
Ce document est la propriété de l’IRSN et ne peut pas être communiqué ou reproduit sans son autorisation.
This document is IRSN proprietary and shall not be disseminated outside the Institute without its prior approval
105. K. HOMMA et al., Thermal-Shock Behavior of PWR High-Burnup Fuel Cladding under Simulated LOCA Conditions ANS Annual Meeting, Milwaukee, Wisconsin, USA, June 17-21, 2001.
106. C. GRANDJEAN, C. LEBUFFE, High Burnup Fuel Cladding Embrittlement under Loss-of-Coolant-Accident Conditions. ANS International Meeting Safety of Operating Reactors, Seattle, September 17-20, 1995.
107. C. GRANDJEAN, R. CAUVIN, C. LEBUFFE, N. WAECKEL,
French Investigations of High Burnup Effect on LOCA Thermomecanical Behavior. Part Two: Oxidation and Quenching Experiments under Simulated LOCA conditions with High Burnup Clad Material. 24th Water Reactor Safety Information Meeting, Bethesda, Md, USA, October 21-23, 1996.
108. R. CAUVIN, C. GRANDJEAN,
Oxidation and Quenching Experiments on High Burnup Fuel Cladding under Simulated LOCA Conditions. 3rd International QUENCH Workshop, Forschungszentrum Karlsruhe, December 2-4, 1997.
109. C. GRANDJEAN, R. CAUVIN, P. JACQUES,
Oxidation and Quenching Experiments with High Burnup Cladding under LOCA conditions. Revision of Previous Data and Main Trends of Recent Tests. 26th Water Reactor Safety Information Meeting, Bethesda, Md, USA, October 26-28, 1998.
110. J.C. BRACHET, L. PORTIER, et al.,
Influence of hydrogen content on the αβ phase transformation temperatures and on the thermal-mechanical behavior of Zy-4, M4 (ZrSnFeV) and M5™ (ZrNbO) alloys during the first phase of LOCA transient. Zr in the Nuclear Industry: 13th. Int. Symp., June 10-14 2001, Annecy, France, ASTM STP 1423, (2002), pp. 673-701
111. L. PORTIER, T. BREDEL, J.C. BRACHET, V. MAILLOT, J.P. MARDON, A. LESBROS,
Influence of Long Service Exposures on the Thermal-Mechanical Behavior of Zy-4 and M5™ Alloys in LOCA Conditions. Zr in the Nuclear Industry: 14th. Int. Symp., June 13-17 2004, Stockholm, Sweden, ASTM-STP 1467, (2005), pp. 896-920,
112. JP MARDON, JC BRACHET, L. PORTIER, V. MAILLOT, T. FORGERON, A. LESBROS, N.
WAECKEL, Influence of hydrogen simulating BU effects on the metallurgical and thermal-mechanical behavior of M5™ and Zircaloy-4 alloys under LOCA conditions. 13th Int. Conf. on Nucl. Eng. Beijing (Pékin), China, May 16-20, 2005, ICONE13-50457
113. J.-C. BRACHET, V. MAILLOT, L. PORTIER, T. FORGERON, D. GILBON, J.-P. MARDON, A.
LESBROS AND N. WAECKEL, Overview of CEA Analytical Studies on the cladding behavior during and after prototypical LOCA transients. OECD Ad-Hoc LOCA Meeting”, Paris – Issy-les-Moulineaux, 27th - 28th of June 2006.
114. J.C. BRACHET, V. MAILLOT, L. PORTIER, D. GILBON, A. LESBROS, N. WAECKEL, J.P. MARDON, Hydrogen Content, Pre-Oxidation and Cooling Scenario Influences on Post-Quench Mechanical Properties of Zy-4 and M5™ Alloys in LOCA Conditions – Relationship with the Post-Quench Microstructure. Zr in the Nuclear Industry: 15th. Int. Symp., June 25-28, 2007, Sun River, Oregon, USA.
DPAM/SEMCA 2008-093 A State-Of-The-Art Review Of Past Programmes Devoted To Fuel Behaviour Under Loss-Of-Coolant Conditions. Part 3.
239/239
Ce document est la propriété de l’IRSN et ne peut pas être communiqué ou reproduit sans son autorisation.
This document is IRSN proprietary and shall not be disseminated outside the Institute without its prior approval
115. J.C. BRACHET, J. PELCHAT, D. HAMON, R. MAURY, P. JACQUES, J.-P. MARDON, Mechanical behavior at room temperature and metallurgical study of Low-tin Zy-4 and M5TM (Zr-NbO) alloys after oxidation at 1100°C and quenching, Proceeding of TCM on “Fuel behavior under transient and LOCA conditions”, Sept. 10-14, 2001, IAEA, Halden, Norway
116. V. VRTÍLKOVÁ et al.,
Review of Recent Work at UJP PRAHA on the LOCA Embrittlement Criterion, Paper submitted to the 6th Plenary Meeting of the OECD/CSNI/SEGFSM, April 25-26, 2005, OECD Headquarters, Paris, France
117. V. VRTÍLKOVÁ et al., Practical Illustration of the Traditional versus Alternative LOCA Embrittlement Criteria, International Conference Nuclear Energy for New Europe 2005, September 5-8, 2005, Bled, Slovenia
118. V. VRTÍLKOVÁ, L. NOVOTNY, J. KOLENČÍK, T. CHMELA, S. ŠTECH, Analysis of revised 17% ECR-CP criterion using oxidation database UJP, Paper presented at the 7th Plenary Meeting and Ad-hoc Meeting on Status of LOCA tests for burn-up dependent LOCA criteria, Junel 27-28, 2006, Paris, France
119. R.R. HOBBINS, S.L. SEIFFERT, S.A. PLOGER, A.S. MEHNER, P.E. MacDONALD, Embrittlement of Zircaloy-Clad Fuel Rods Irradiated Under Film Boiling Conditions 4th Int. Symp. "Zirconium in the Nuclear Industry" ASTM STP 681, pp. 586-599, 1979. 120. P.E. MacDONALD, W.J. QUAPP, A.S. MEHNER, Z.R. MARTINSON and R.K. McCARDELL, Response of Unirradiated and Irradiated PWR Fuel Rods Tested Under Power-Cooling
Mismatch Conditions Nuclear Safety, Vol 19(4), 1978, pp. 440-464. 121. F. M. HAGGAG, Zircaloy Cladding Embrittlement Criteria : Comparison of In-pile and Out-of-pile Results NUREG/CR-2757, EGG-2123, July 1982. 122. M. REOCREUX, E. SCOTT DE MARTINVILLE,
A Study of Fuel Behavior in PWR Design Basis Accident : An Analysis of Results from the PHEBUS and EDGAR experiments. Nucl. Eng. and Design 124 (1990), pp 363-378.
123. W. WIESENACK, LOCA Test Series. Status and Plans.
Enlarged HPG Meeting on High Burn-Up Fuel Performance, Safety and Reliability and Degradation of In-Core Materials and Water Chemistry Effects and Man-Machine Systems Research. Storefjell, Norway, 8-13th September 2002. HPR-359/36.
124. E. KOLSTAD, W. WIESENACK, B. OBERLÄNDER, L. KEKKONEN,
LOCA Testing at HALDEN. Recent tests and plans. ANL LOCA Program Review Meeting, Argonne National Laboratory, USA, October 5-6, 2007.
125. G. YADIGAROGLU,
Phebus Experts Group. Final Summary Report and Recommendations. Mail IRSN/DPAM/DIR-2007-0399, September 17th, 2007.