city of compton state of california comprehensive …
TRANSCRIPT

CITY OF COMPTON STATE OF CALIFORNIA
Comprehensive Annual Financial Report
Fiscal Year Ended June 30, 2009
CITY OF COMPTON Comprehensive Annual Financial Report
June 30, 2009
Table of Contents
Page(s) Independent Auditor’s Report....................................................................................................................... 1 Management’s Discussion and Analysis (Required Supplementary Information - Unaudited) ................... 3 Basic Financial Statements:
Government-wide Financial Statements: Statement of Net Assets ................................................................................................................. 19 Statement of Activities................................................................................................................... 20
Fund Financial Statements: Balance Sheet – Governmental Funds .......................................................................................... 22 Reconciliation of the Balance Sheet of Governmental Funds to the Statement of Net Assets ...... 24 Statement of Revenues, Expenditures, and Changes in Fund Balances – Governmental Funds ... 26 Reconciliation of the Statement of Revenues, Expenditures, and Changes in Fund Balances of Governmental Funds to the Statement of Activities ............................................ 28 Statement of Net Assets – Proprietary Funds ................................................................................ 30 Statement of Revenues, Expenses, and Changes in Fund Net Assets – Proprietary Funds ........... 32 Statement of Cash Flows – Proprietary Funds............................................................................... 34 Statement of Fiduciary Assets and Liabilities – Agency Funds .................................................... 38 Notes to the Financial Statements ........................................................................................................ 39 Other Required Supplementary Information (Unaudited): Schedules of Funding Progress—Pension and OPEB Plans ................................................................ 79 Budgetary Comparison Schedule: General Fund.................................................................................................................................. 80 Federal Grants Special Revenue Fund........................................................................................... 81 Retirement Special Revenue Fund................................................................................................. 82 Note to Required Supplementary Information ..................................................................................... 83 Combining and Individual Fund Financial Statements and Schedules (Supplementary Information): Other Major Funds - Budgetary Comparison Schedule: Redevelopment Debt Service Fund ............................................................................................... 85 Public Financing Authority Debt Service Fund............................................................................. 86 Redevelopment Capital Projects Fund........................................................................................... 87 Low/Moderate Income Housing Capital Projects Fund................................................................. 88

CITY OF COMPTON Comprehensive Annual Financial Report
June 30, 2009
Table of Contents (Continued)
Page(s)
Nonmajor Governmental Funds: Combining Balance Sheet.............................................................................................................. 92 Combining Statement of Revenues, Expenditures and Changes in Fund Balances....................... 94 Budgetary Comparison Schedule: County Transportation Fund ................................................................................................... 96 Gasoline Tax Fund .................................................................................................................. 97 California Department of Transportation Grant Fund............................................................. 98 Department of Health Service Grant Fund.............................................................................. 99 California Department of Parks and Recreation Fund........................................................... 100 Special Assessments Fund..................................................................................................... 101 Other Special Revenue Fund................................................................................................. 102 COP Debt Service Fund ........................................................................................................ 103 Public Financing Authority Capital Project Fund ................................................................. 104 Other Capital Projects Fund .................................................................................................. 105 Nonmajor Enterprise Funds: Combining Statement of Net Assets ............................................................................................ 108 Combining Statement of Revenues, Expenses and Changes in Fund Net Assets........................ 109 Combining Statement of Cash Flows .......................................................................................... 110 Internal Service Funds: Combining Statement of Net Assets ............................................................................................ 112 Combining Statement of Revenues, Expenses and Changes in Fund Net Assets........................ 113 Combining Statement of Cash Flows .......................................................................................... 114 Statement of Changes in Assets and Liabilities – Agency Funds................................................ 115 Budget and Actual Schedules – Other Funds ..................................................................................... 116 Statistical Section (Unaudited): Assessed and Estimated Actual Values of Taxable Property Last Seven Fiscal Years ........................................................................................................ 119 Assessed Value of Property by Use Code .......................................................................................... 122 Direct and Overlapping Property Tax Rates – Last Ten Fiscal Years................................................ 124 Demographic and Economic Statistics – Last Nine Fiscal years ....................................................... 125 Principal Property Tax Payers – Current Fiscal Year and Nine Years Ago....................................... 126 Principal Sales Tax Producers – Current Fiscal Year and Nine Years Ago....................................... 127

The Honorable City Council of the City of Compton, California
INDEPENDENT AUDITOR’S REPORT
We have audited the accompanying financial statements of the governmental activities, the business-type activities, each major fund, and the aggregate remaining fund information of the City of Compton, California, (City) as of and for the year ended June 30, 2009, which collectively comprise the City’s basic financial statements as listed in the table of contents. These financial statements are the responsibility of the City’s management. Our responsibility is to express opinions on these financial statements based on our audit. We conducted our audit in accordance with auditing standards generally accepted in the United States of America and the standards applicable to financial audits contained in Government Auditing Standards issued by the Comptroller General of the United States. Those standards require that we plan and perform the audit to obtain reasonable assurance about whether the financial statements are free of material misstatement. An audit includes consideration of internal control over financial reporting as a basis for designing audit procedures that are appropriate in the circumstances, but not for the purpose of expressing an opinion on the effectiveness of the City’s internal control over financial reporting. Accordingly, we express no such opinion. An audit also includes examining, on a test basis, evidence supporting the amounts and disclosures in the financial statements, assessing the accounting principles used and significant estimates made by management, as well as evaluating the overall financial statement presentation. We believe that our audit provides a reasonable basis for our opinions. In our opinion, the financial statements referred to above present fairly, in all material respects, the respective financial position of the governmental activities, the business-type activities, each major fund, and the aggregate remaining fund information of the City of Compton, California, as of June 30, 2009, and the respective changes in financial position and, where applicable, cash flows thereof for the year then ended in conformity with accounting principles generally accepted in the United States of America. In accordance with Government Auditing Standards, we have also issued our report dated May 19, 2010 on our consideration of the City's internal control over financial reporting and on our tests of its compliance with certain provisions of laws, regulations, contracts, and grant agreements and other matters. The purpose of that report is to describe the scope of our testing of internal control over financial reporting and compliance and the results of that testing, and not to provide an opinion on the internal control over financial reporting or on compliance. That report is an integral part of an audit performed in accordance with Government Auditing Standards and should be considered in assessing the results of our audit.

2
The management’s discussion and analysis and other required supplementary information identified in the accompanying table of contents are not a required part of the basic financial statements but are supplementary information required by the Governmental Accounting Standards Board. We have applied certain limited procedures, which consisted principally of inquiries of management regarding the methods of measurement and presentation of the required supplementary information. However, we did not audit the information and express no opinion on it. Our audit was conducted for the purpose of forming opinions on the financial statements that collectively comprise the City’s basic financial statements. The accompanying combining and individual fund financial statements and schedules listed as supplementary information in the table of contents and the statistical section are presented for purposes of additional analysis and are not a required part of the basic financial statements. The supplementary information has been subjected to the auditing procedures applied in the audit of the basic financial statements and, in our opinion, are fairly stated in all material respects in relation to the basic financial statements taken as a whole. The statistical section has not been subjected to the auditing procedures applied in the audit of the basic financial statements, and accordingly, we express no opinion on it. Certified Public Accountants Los Angeles, California May 19, 2010
Management’s Discussion and Analysis June 30, 2009 (Unaudited)
3
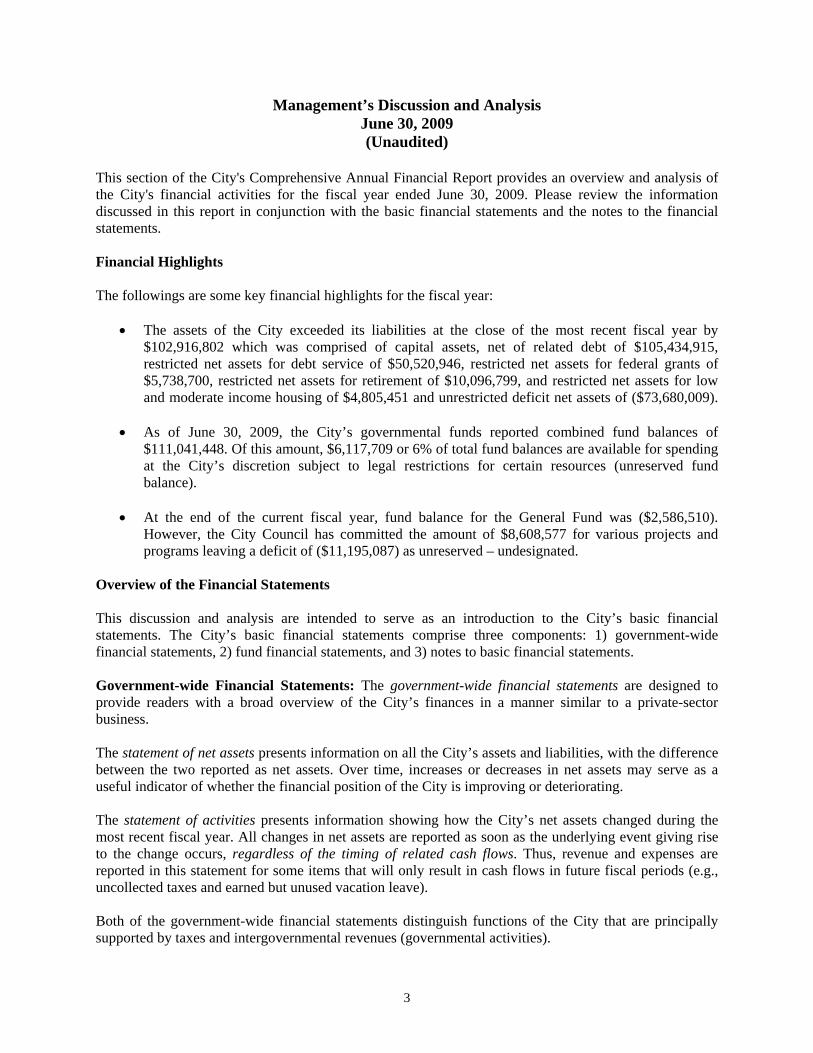
This section of the City's Comprehensive Annual Financial Report provides an overview and analysis of the City's financial activities for the fiscal year ended June 30, 2009. Please review the information discussed in this report in conjunction with the basic financial statements and the notes to the financial statements. Financial Highlights The followings are some key financial highlights for the fiscal year:
• The assets of the City exceeded its liabilities at the close of the most recent fiscal year by $102,916,802 which was comprised of capital assets, net of related debt of $105,434,915, restricted net assets for debt service of $50,520,946, restricted net assets for federal grants of $5,738,700, restricted net assets for retirement of $10,096,799, and restricted net assets for low and moderate income housing of $4,805,451 and unrestricted deficit net assets of ($73,680,009).
• As of June 30, 2009, the City’s governmental funds reported combined fund balances of $111,041,448. Of this amount, $6,117,709 or 6% of total fund balances are available for spending at the City’s discretion subject to legal restrictions for certain resources (unreserved fund balance).
• At the end of the current fiscal year, fund balance for the General Fund was ($2,586,510).
However, the City Council has committed the amount of $8,608,577 for various projects and programs leaving a deficit of ($11,195,087) as unreserved – undesignated.
Overview of the Financial Statements This discussion and analysis are intended to serve as an introduction to the City’s basic financial statements. The City’s basic financial statements comprise three components: 1) government-wide financial statements, 2) fund financial statements, and 3) notes to basic financial statements. Government-wide Financial Statements: The government-wide financial statements are designed to provide readers with a broad overview of the City’s finances in a manner similar to a private-sector business. The statement of net assets presents information on all the City’s assets and liabilities, with the difference between the two reported as net assets. Over time, increases or decreases in net assets may serve as a useful indicator of whether the financial position of the City is improving or deteriorating. The statement of activities presents information showing how the City’s net assets changed during the most recent fiscal year. All changes in net assets are reported as soon as the underlying event giving rise to the change occurs, regardless of the timing of related cash flows. Thus, revenue and expenses are reported in this statement for some items that will only result in cash flows in future fiscal periods (e.g., uncollected taxes and earned but unused vacation leave). Both of the government-wide financial statements distinguish functions of the City that are principally supported by taxes and intergovernmental revenues (governmental activities).

Management’s Discussion and Analysis (Continued) June 30, 2009 (Unaudited)
4
The governmental activities of the City include general government, professional services, pass-through payments, public safety, public works, management services, environmental and human services, and interest on long-term debt. The business-type activities of the City include its water, sewer, rubbish, golf course and recreational operations. The government-wide financial statements include not only the City itself (known as the primary government), but also the legally separate Community Redevelopment Agency, Public Finance Authority and Housing Authority of the City of Compton. These component units function as integral parts of the primary government and have been included in these financial statements. The government-wide financial statements can be found on page 19 through 21 of this report. Fund Financial Statements: A fund is a grouping of related accounts used to maintain control over resources that have been segregated for specific activities or objectives. The City, like other state and local governments, uses fund accounting to ensure and demonstrate compliance with finance-related legal requirements. All of the funds of the City can be divided into three categories: governmental funds, proprietary funds and fiduciary funds. Governmental Funds: Governmental funds are used to account for essentially the same functions reported as governmental activities in the government-wide financial statements. However, unlike the government-wide financial statements, governmental fund financial statements focus on near-term inflows and outflows of spendable resources, as well as on balances of spendable resources available at the end of this fiscal year. Such information may be useful in evaluating the City’s near-term financial requirements. Because the focus of governmental funds is narrower than that of the government-wide financial statements, it is useful to compare the information presented for governmental funds with similar information presented for governmental activities in the government-wide financial statements. By doing so, readers may better understand the long-term impact of the City’s near-term financial decisions. Both the governmental funds balance sheet and the governmental funds statement of revenues, expenditures, and changes in fund balances provide a reconciliation to facilitate this comparison between governmental funds and governmental activities. The City maintains seven major governmental funds. Information is presented separately in the governmental funds balance sheet and in the governmental funds statement of revenues, expenditures and changes in fund balances for the General Fund, the Federal Grants Fund, the Retirement Fund, the Redevelopment Debt Service Fund, the Public Finance Authority Debt Service Fund, the Redevelopment Capital Projects Fund and the Low/Moderate Income Housing Fund. Data from the other nonmajor governmental funds are combined into a single, aggregated presentation. Individual fund data for each of these nonmajor governmental funds is provided in the form of combining statements in the nonmajor governmental funds section of this report. The City adopts an annual appropriated budget for all of its funds. A budgetary comparison schedule provided for all funds with an annually adopted budget. The budgetary comparison schedule for the General Fund, the Federal Grants Fund, and the Retirement Fund, are located in the required supplementary information to the financial statements. Budgetary comparison schedules for the remaining

Management’s Discussion and Analysis (Continued) June 30, 2009 (Unaudited)
5
funds are located in the supplementary information to the financial statements. The governmental fund financial statements can be found on pages 22 through 28 of this report. Proprietary Funds: The City maintains two different types of proprietary funds. Enterprise funds are used to report the same functions presented as business-type activities in the governmental-wide financial statements. The City uses enterprise funds to account for its water, sewer, rubbish, golf course and recreational operations. Internal Service funds are an accounting device used to accumulate and allocate costs internally among the City’s various functions. The City uses internal service funds to account for self-insurance (including general claims liability and workers’ compensation insurance), equipment rental, and central duplicating. Because these services predominantly benefit governmental functions, the services have been included within the governmental activities in the government-wide financial statements.
Proprietary funds provide the same type of information as the government-wide financial statements, only in more details. The proprietary fund financial statements provide separate information for water, sewer and rubbish operations, all of which are considered major funds of the City. Conversely, the internal service funds are combined into a single, aggregated presentation in the proprietary fund financial statements. Individual fund data for the internal service funds is provided in the form of combining statements elsewhere in this report. The basic proprietary fund financial statements can be found on page 30 through page 37 of this report. Fiduciary Funds: Fiduciary funds are used to account for resources held for the benefit of parties outside government. Fiduciary funds are not reflected in the government-wide financial statements because the resources of those funds are not available to support the City’s own programs. The accounting used for fiduciary funds is much like that used for proprietary funds. The statement of fiduciary assets and liabilities can be found on page 38 of this report. Notes to the Basic Financial Statements: The notes to the basic financial statements provide additional information that is essential to a full understanding of the data provided in the government-wide and fund financial statements. The notes to the basic financial statements can be found on pages 39 through 77 of this report. Other information: In addition to the basic financial statements and the accompanying notes, this report also presents certain required supplementary information concerning the City’s progress in funding its obligations to provide pension and other postemployment benefits to its employees as well as schedules that show actual fund transactions compared to the City’s budgets. Required supplementary information can be found on pages 79 through 83 of this report. The combining statements referred to earlier in connection with nonmajor governmental funds and internal service funds are presented immediately following the required supplementary information on pensions and other postemployment benefits.
Management’s Discussion and Analysis (Continued) June 30, 2009 (Unaudited)
6
Combining and individual fund statements and schedules can be found on pages 92 through 117 of this report. Government-wide Financial Analysis As noted earlier, net assets may serve over time as a useful indicator of a government’s financial position. Below is a summary schedule of the City’s net assets at June 30, 2009.
June 30, June 30, Amount Increase % IncreaseGovernmental Activities 2009 2008 (Decrease) (Decrease)Assets: Current and other assets 130,719,984$ 130,527,478$ 192,506$ 0.1% Capital assets 132,577,491 134,586,510 (2,009,019) -1.5%
Total assets 263,297,475 265,113,988 (1,816,513) -0.7%
Liabilities: Current and other liabilities 18,580,461 14,204,549 4,375,912 30.8% Long-term liabilities 141,800,212 138,063,057 3,737,155 2.7%
Total liabilities 160,380,673 152,267,606 8,113,067 5.3%
Net assets (deficit): Invested in capital assets, net of related debt 105,434,915 103,263,431 2,171,484 2.1% Restricted 71,161,896 25,708,266 45,453,630 176.8% Unrestricted (deficit) (73,680,009) (16,125,315) (57,554,694) 356.9%
Total net assets 102,916,802$ 112,846,382$ (9,929,580)$ -8.8%
June 30, June 30, Amount Increase % IncreaseBusiness Activities 2009 2008 (Decrease) (Decrease)Assets: Current and other assets 76,815,332$ 15,230,397$ 61,584,935$ 404.4% Capital assets 4,364,524 5,404,251 (1,039,727) -19.2%
Total assets 81,179,856 20,634,648 60,545,208 293.4%
Liabilities: Current and other liabilities 29,957,562 3,191,712 26,765,850 838.6% Long-term liabilities 70,933,674 9,379,752 61,553,922 656.2%
Total liabilities 100,891,236 12,571,464 88,319,772 702.5%
Net assets (deficit): Invested in capital assets, net of related debt (3,303,471) (2,452,431) (851,040) 34.7% Unrestricted (deficit) 10,592,091 10,515,615 76,476 0.7%
Total net assets 7,288,620$ 8,063,184$ (774,564)$ -9.6%
Below is a summary schedule of the City's statements of activities for the year ended June 30, 2009.

Management’s Discussion and Analysis (Continued) June 30, 2009 (Unaudited)
7
June 30, June 30, Amount Increase % Increase2009 2008 (Decrease) (Decrease)
Revenues: Program revenues: Charges for services 28,649,770$ 22,755,605$ 5,894,165$ 25.9% Operating grants and contributions 16,842,297 21,258,234 (4,415,937) -20.8% Capital grants and contributions 3,448,042 6,181,629 (2,733,587) -44.2% General revenues: Taxes:
Property tax 38,725,002 26,763,000 11,962,002 44.7%Sales and use tax 6,727,145 6,243,608 483,537 7.7%Utility user tax 14,934,144 14,244,579 689,565 4.8%Franchise tax 1,011,967 1,106,504 (94,537) -8.5%Transient occupancy taxes 194,220 256,218 (61,998) -24.2%Motor vehicle in-lieu of taxes 8,680,210 8,352,461 327,749 3.9%
Investment earnings 332,863 2,584,664 (2,251,802) -87.1% Gain on sale of land 119,651 3,764,243 (3,644,592) -96.8% Other 13,243,388 13,668,511 (425,123) -3.1% Transfers 433,316 (170,353) 603,669 -354.4%
Total revenue 133,342,015 127,008,903 6,333,112 5.0%
Expenses: General Government 38,272,613 23,443,830 14,828,783 63.3% Professional Services 7,022,038 2,949,881 4,072,157 138.0% Public Safety 22,303,016 35,581,399 (13,278,383) -37.3% Public Works 8,599,347 11,441,949 (2,842,602) -24.8% Management Services 39,865,098 18,243,546 21,621,552 118.5% Environmental and Human Services 20,382,744 23,928,671 (3,545,927) -14.8% Interest on long-term debt 6,524,030 4,639,493 1,884,537 40.6% Pass Through Payments 302,709 291,514 11,195 3.8%
Total expenditures 143,271,595 120,520,283 22,751,312 18.9%
Increase (decrease) in net assets (9,929,580) 6,488,620 (16,418,200) -253.0%
Net assets, Beginning of Year 112,846,382 106,357,762 6,488,620 6.1%Net assets, End of Year 102,916,802$ 112,846,382$ (9,929,580)$ -8.8%
June 30, June 30, Amount Increase % Increase2009 2008 (Decrease) (Decrease)
Revenues: Program revenues: Charges for services 20,087,047$ 19,421,443$ 665,604$ 3.4% General revenues 50,917 343,707 (292,790) -85.2%
Transfers (433,316) - - N/ATotal revenues 19,704,648 19,765,150 (60,502) -0.3%
Expenses: Water 8,676,522 7,728,075 948,447 12.3% Rubbish 10,108,895 9,860,413 248,482 2.5% Sewer 1,634,418 1,635,760 (1,342) -0.1% Golf course 49,014 25,255 23,759 94.1% Recreational 10,363 7,625 2,738 35.9%
Total expenditures 20,479,212 19,257,128 1,222,084 6.3%Increase (decrease) in net assets (774,564) 508,021 (1,549,128) -304.9%
Net assets, Beginning of Year 8,063,184 7,555,162 774,564 10.3%Net assets, End of Year 7,288,620$ 8,063,184$ (774,564)$ -9.6%
Statements of ActivitiesGovernmental Activities
Business-Type Activities
In the case of the City, assets exceeded liabilities by $102,916,802 at June 30, 2009.

Management’s Discussion and Analysis (Continued) June 30, 2009 (Unaudited)
8
The largest portion of the City’s net assets $105,434,915 reflects its investment in capital assets (land, construction in progress, buildings, land improvements, machinery and equipment and infrastructure); less any related debt used to acquire those assets that are still outstanding. The City uses these capital assets to provide services to citizens; consequently, these assets are not available for future spending. Although the City’s investment in its capital assets is reported net of related debt, it should be noted that the resources needed to repay this debt must be provided from other sources, since the capital assets themselves cannot be used to liquidate these liabilities. The second largest portion of the City’s net assets represents resources that are subject to external restriction on how they may be used. Of the restricted net assets, $5,738,700 is for federal grants, $10,096,799 is for retirement, $50,520,946 is for repayment of long-term debt, and $4,805,451 is for low/moderate income. The current and other liabilities of the governmental activities increased by 30.8% due mainly to accrual for liabilities relating to construction, maintenance and other services obtained by the City before the year-end but for which invoices were submitted and payments made after the year-end. The amount of the increase reflects the general increase in total expenditures during the year compared to the previous year. The restricted net assets grew by 177% because of the increase in the debt service fund, which was restricted based on the provision of the debt agreements. Governmental Activities: Governmental activities decreased the City’s net assets by $9,929,580, 8.8% decrease from prior year’s net assets. Key elements of this decrease are as follows:
• As of the close of the fiscal year, overall revenues and transfers increased by $6,333,112 (5%). Charges for services increased by 25.9% because of increased revenues for licenses and permits, rents and concessions, emergency medical services and other charges the City collected during the year. There were reductions of 21% and 44% in operating and capital grants/contributions received from other agencies as well as reduction in interest income because of decline in the amount of interest yielding investments held during the period but these reductions were offset by increased in property taxes which arose from new homes built in the City and a new shopping mall recently constructed.
• Overall expenses increased by $22,751,312, 19% as compared to last year due mainly to increase
in expenditures relating to professional services (138%) rendered to the City by various vendors related to the various City projects; cost of management services (119%) related to maintaining the current level of City operations and infrastructure; interest expense related to the City’s bond obligations; and expenditures increased related to general government by 63%. Included in the general government expenditures is the amount of $9.3 million for postemployment benefits other than pension (OPEB) costs of the City’s employees which was accrued for under provisions of GASB 45 to recognize the City’s OPEB liability for present and retired City employees.

Management’s Discussion and Analysis (Continued) June 30, 2009 (Unaudited)
9
Expenses – Governmental Activities
Public Safety 16%
Interest on Long Term Debt
5% Pass Through Payments
0%
General Government
26%
Professional Services
5%
Environmental and Human Services
14% Public Works
6%
Management Services
28%

Management’s Discussion and Analysis (Continued) June 30, 2009 (Unaudited)
10
Business-type Activities: Business-type activities decreased the City’s net assets overall by $774,564. Key elements of this decrease are as follows:
• Water Fund’s net assets decreased by $15,873 due to increase in operating expenses inclusive of transfers out. The water rate was increased during the second half of the year to offset the increase in maintenance cost of the City’s relatively old water wells and pipelines. However, the revenue from the half-year rate increase was not adequate to cover the total expenses. The impact of the water rate increase will be felt in the next fiscal year as it is expected that the full year revenue for the next fiscal year will be adequate to offset the total costs of the water operation. .
• Sewer Fund’s net assets decreased by $647,371 due to the fact that the Fund’s total expenses exceeded the revenue from taxes and special assessments.
• Rubbish Fund’s net assets decreased by $117,105 also due to increase in operating expenses. The Fund had a 2% increase in revenue during the year but the increase was not enough to cover the 11% ($899,548) increase in the contract costs of the rubbish operations.
General Revenue and Transfers
63%
Charges for Services 21% Operating Grants and
Contributions 13%
Capital Grants and Contributions 3%
Program Revenue - Government Activities

Management’s Discussion and Analysis (Continued) June 30, 2009 (Unaudited)
11
The overall current and other assets of business-type activities increased by 404.4% because of the proceeds of new bonds issued towards the end of the year, which were invested in restricted investments pending when the monies are used to finance the relevant projects. The long-term liabilities increased by 656.2% primarily due to the new bonds.
*Transfer out is not included in calculation of general revenue above.
Expenses – Business-Type Activities
Sewer 8%
Rubbish 49.4%
Golf Course 0.2%
Recreation 0%
Water 42.4%
Program Revenues – Business- Type Activities
Charges for services 99.75%
General Revenues*
0.25%
Management’s Discussion and Analysis (Continued) June 30, 2009 (Unaudited)
12
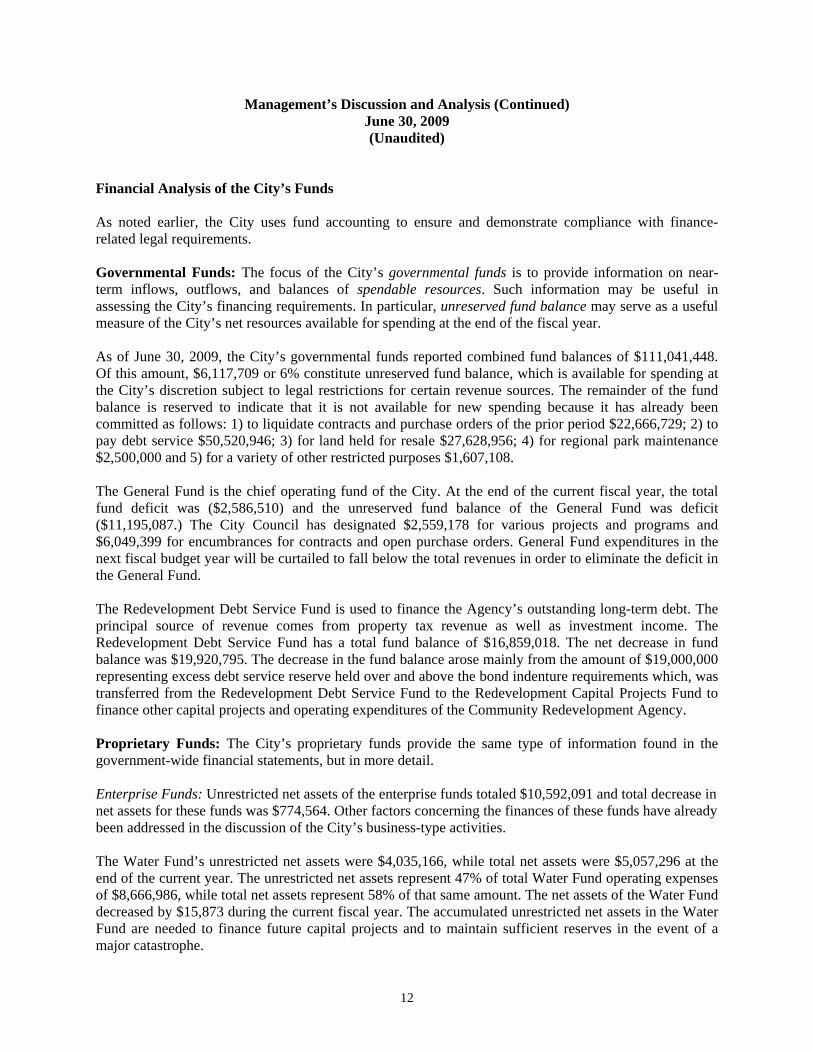
Financial Analysis of the City’s Funds As noted earlier, the City uses fund accounting to ensure and demonstrate compliance with finance-related legal requirements. Governmental Funds: The focus of the City’s governmental funds is to provide information on near-term inflows, outflows, and balances of spendable resources. Such information may be useful in assessing the City’s financing requirements. In particular, unreserved fund balance may serve as a useful measure of the City’s net resources available for spending at the end of the fiscal year. As of June 30, 2009, the City’s governmental funds reported combined fund balances of $111,041,448. Of this amount, $6,117,709 or 6% constitute unreserved fund balance, which is available for spending at the City’s discretion subject to legal restrictions for certain revenue sources. The remainder of the fund balance is reserved to indicate that it is not available for new spending because it has already been committed as follows: 1) to liquidate contracts and purchase orders of the prior period $22,666,729; 2) to pay debt service $50,520,946; 3) for land held for resale $27,628,956; 4) for regional park maintenance $2,500,000 and 5) for a variety of other restricted purposes $1,607,108. The General Fund is the chief operating fund of the City. At the end of the current fiscal year, the total fund deficit was ($2,586,510) and the unreserved fund balance of the General Fund was deficit ($11,195,087.) The City Council has designated $2,559,178 for various projects and programs and $6,049,399 for encumbrances for contracts and open purchase orders. General Fund expenditures in the next fiscal budget year will be curtailed to fall below the total revenues in order to eliminate the deficit in the General Fund. The Redevelopment Debt Service Fund is used to finance the Agency’s outstanding long-term debt. The principal source of revenue comes from property tax revenue as well as investment income. The Redevelopment Debt Service Fund has a total fund balance of $16,859,018. The net decrease in fund balance was $19,920,795. The decrease in the fund balance arose mainly from the amount of $19,000,000 representing excess debt service reserve held over and above the bond indenture requirements which, was transferred from the Redevelopment Debt Service Fund to the Redevelopment Capital Projects Fund to finance other capital projects and operating expenditures of the Community Redevelopment Agency. Proprietary Funds: The City’s proprietary funds provide the same type of information found in the government-wide financial statements, but in more detail. Enterprise Funds: Unrestricted net assets of the enterprise funds totaled $10,592,091 and total decrease in net assets for these funds was $774,564. Other factors concerning the finances of these funds have already been addressed in the discussion of the City’s business-type activities. The Water Fund’s unrestricted net assets were $4,035,166, while total net assets were $5,057,296 at the end of the current year. The unrestricted net assets represent 47% of total Water Fund operating expenses of $8,666,986, while total net assets represent 58% of that same amount. The net assets of the Water Fund decreased by $15,873 during the current fiscal year. The accumulated unrestricted net assets in the Water Fund are needed to finance future capital projects and to maintain sufficient reserves in the event of a major catastrophe.

Management’s Discussion and Analysis (Continued) June 30, 2009 (Unaudited)
13
The Rubbish Fund’s unrestricted net assets were $479,431 at the end of the current fiscal year, while total net assets were $30,833. The unrestricted net assets represent 5% of the Rubbish Fund total operating expenses of $10,015,210. The net assets of the Rubbish Fund decreased by $117,105 during the fiscal year. This decrease is attributable mainly to interest expense exceeding investment income for the fiscal year. The Sewer Fund’s unrestricted net assets were $6,099,979 while total net assets were $2,222,976 at the end of the fiscal year. The unrestricted net assets represent 485% of total Sewer Fund operating expenses of $1,256,828 while total net assets represent 177% of the same amount. The net assets of the Sewer Fund decreased by $647,371 during the fiscal year. The accumulated unrestricted net assets in the Sewer Fund are needed to fund future sewer and storm drain capital projects and to maintain sufficient reserves in the event of a major catastrophe. Internal Service Funds: The City‘s internal service funds are an accounting device used to accumulate and allocate costs internally among the City’s functions. The City uses internal service funds to account for its self-insurance activities, including liability insurance and workers’ compensation insurance, equipment rental, and central duplicating. As of June 30, 2009, net assets of the internal service funds were a deficit $25,257,219 and total increase in net assets for these funds were $1,496,381. The services provided by the internal service funds have been allocated to governmental functions in the government-wide financial statements. The Self-Insurance Fund possesses the largest deficit in this fund group totaling $23,815,126. The City will increase charges to other City funds to eliminate this deficit over a period of years. General Fund Budgetary Highlights The differences in the original budget as compared to the final budget represented a net increase of $1,524,509 for revenue and $6,108,689 for expenditures. Throughout the year, resolutions and budget modifications were approved for many line items in all departments, which created various increases and / or decreases to the beginning budget. In total, the General Fund actual revenues as compared to budget represented a shortfall of $16,967,169. Contributing to the shortfall is the fact that actual revenues from “Taxes and Special Assessments” decreased compared to budget by $4,041,412 due to decline in the assessed value of the property on which the tax assessment was based; revenues from “Use of Money and Property” recorded a shortfall of $4,517,282 compared to budget mainly due to reduction in the City’s income yielding investments, and City budgeted to receive $6 million advertisement revenue from a new advertisement franchise issued during the year but which did not materialize before the ended of the fiscal year. This advertisement revenue represented ”Other Revenue” source for which there was no actual receipt thereby reducing the General Fund’s total revenues. The total General Fund actual expenditures as compared to budget recorded a decrease of $3.8 million. This decrease is mainly due to reduction in management services because of cuts in contract payments below the amount budgeted. Although there was an increase in general government expenditures of $2.9 million compared to budget, this increase was offset by $6.4 million reduction in management services expenditures. Minor increases in other categories of General Fund expenditures were about equal to decrease in other expenditures categories.
Management’s Discussion and Analysis (Continued) June 30, 2009 (Unaudited)
14
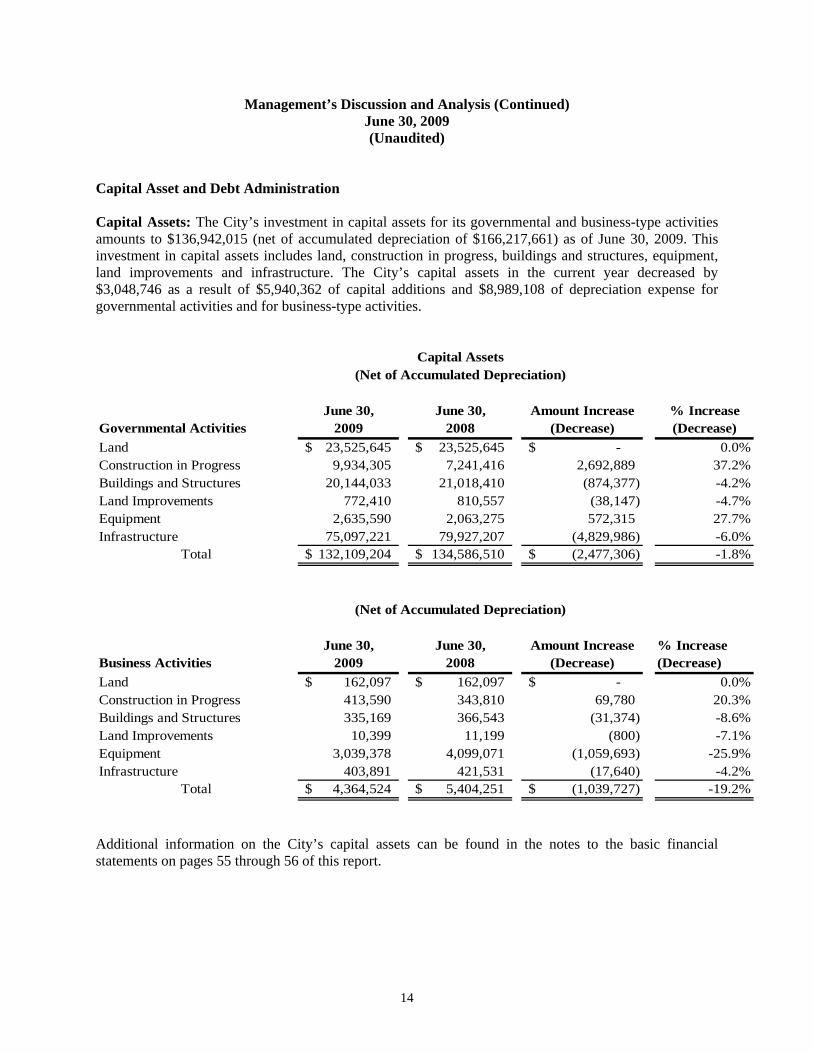
Capital Asset and Debt Administration Capital Assets: The City’s investment in capital assets for its governmental and business-type activities amounts to $136,942,015 (net of accumulated depreciation of $166,217,661) as of June 30, 2009. This investment in capital assets includes land, construction in progress, buildings and structures, equipment, land improvements and infrastructure. The City’s capital assets in the current year decreased by $3,048,746 as a result of $5,940,362 of capital additions and $8,989,108 of depreciation expense for governmental activities and for business-type activities.
Capital Assets(Net of Accumulated Depreciation)
June 30, June 30, Amount Increase % IncreaseGovernmental Activities 2009 2008 (Decrease) (Decrease)Land 23,525,645$ 23,525,645$ -$ 0.0%Construction in Progress 9,934,305 7,241,416 2,692,889 37.2%Buildings and Structures 20,144,033 21,018,410 (874,377) -4.2%Land Improvements 772,410 810,557 (38,147) -4.7%Equipment 2,635,590 2,063,275 572,315 27.7%Infrastructure 75,097,221 79,927,207 (4,829,986) -6.0%
Total 132,109,204$ 134,586,510$ (2,477,306)$ -1.8%
(Net of Accumulated Depreciation)
June 30, June 30, Amount Increase % IncreaseBusiness Activities 2009 2008 (Decrease) (Decrease)Land 162,097$ 162,097$ -$ 0.0%Construction in Progress 413,590 343,810 69,780 20.3%Buildings and Structures 335,169 366,543 (31,374) -8.6%Land Improvements 10,399 11,199 (800) -7.1%Equipment 3,039,378 4,099,071 (1,059,693) -25.9%Infrastructure 403,891 421,531 (17,640) -4.2%
Total 4,364,524$ 5,404,251$ (1,039,727)$ -19.2%
Additional information on the City’s capital assets can be found in the notes to the basic financial statements on pages 55 through 56 of this report.
Management’s Discussion and Analysis (Continued) June 30, 2009 (Unaudited)
15
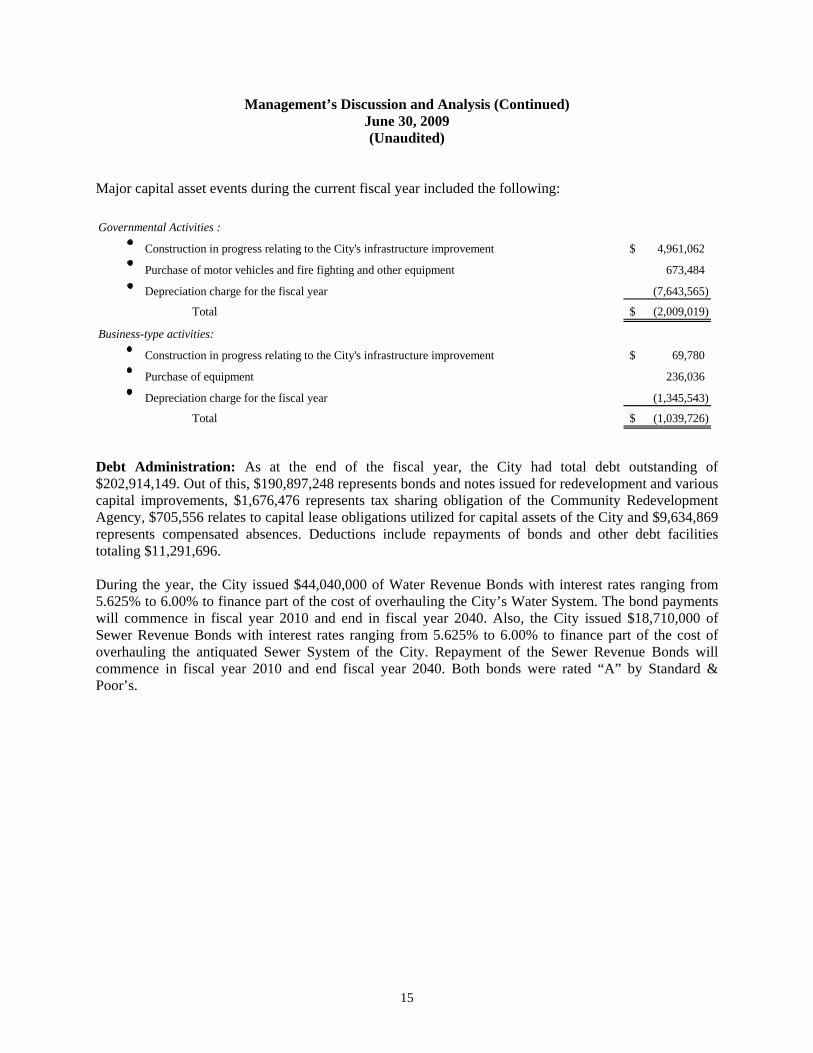
Major capital asset events during the current fiscal year included the following: Governmental Activities :
Construction in progress relating to the City's infrastructure improvement 4,961,062$
Purchase of motor vehicles and fire fighting and other equipment 673,484
Depreciation charge for the fiscal year (7,643,565)
Total (2,009,019)$
Business-type activities:
Construction in progress relating to the City's infrastructure improvement 69,780$
Purchase of equipment 236,036
Depreciation charge for the fiscal year (1,345,543)
Total (1,039,726)$
Debt Administration: As at the end of the fiscal year, the City had total debt outstanding of $202,914,149. Out of this, $190,897,248 represents bonds and notes issued for redevelopment and various capital improvements, $1,676,476 represents tax sharing obligation of the Community Redevelopment Agency, $705,556 relates to capital lease obligations utilized for capital assets of the City and $9,634,869 represents compensated absences. Deductions include repayments of bonds and other debt facilities totaling $11,291,696. During the year, the City issued $44,040,000 of Water Revenue Bonds with interest rates ranging from 5.625% to 6.00% to finance part of the cost of overhauling the City’s Water System. The bond payments will commence in fiscal year 2010 and end in fiscal year 2040. Also, the City issued $18,710,000 of Sewer Revenue Bonds with interest rates ranging from 5.625% to 6.00% to finance part of the cost of overhauling the antiquated Sewer System of the City. Repayment of the Sewer Revenue Bonds will commence in fiscal year 2010 and end fiscal year 2040. Both bonds were rated “A” by Standard & Poor’s.

Management’s Discussion and Analysis (Continued) June 30, 2009 (Unaudited)
16
Outstanding Debt
July 1, June 30,Governmental Activities 2008 Additions Retirements 2009Bonded indebtedness: Tax allocation and refunding bonds 118,675,244$ 2,232,157$ (7,641,524)$ 113,265,877$ Other long-term debt: Tax sharing obligation - 1,676,476 - 1,676,476 Compensated absences 8,009,977 2,755,055 (1,937,307) 8,827,725 Capital leases 244,876 515,104 (168,724) 591,256 Notes and loans payable 5,092,213 - (292,379) 4,799,834 Mortgage loan 3,549,039 - (234,987) 3,314,052
135,571,349$ 7,178,792$ (10,274,921)$ 132,475,220$
Business Activities July 1, June 30,2008 Additions Retirements 2009
Bonded indebtedness: Water revenue bonds -$ 43,001,179$ -$ 43,001,179$ Sewer revenue bonds 6,475,000 18,267,629 (270,000) 24,472,629 Solid waste revenue bonds 2,500,000 - (680,000) 1,820,000 Other long-term debt: Notes and loans payable 256,320 - (32,643) 223,677 Capital leases 148,432 - (34,132) 114,300 Compensated absences - 807,144 - 807,144
Total 9,379,752$ 61,268,808$ (1,016,775)$ 70,438,929$
Next Year’s Budget The budget for fiscal year 2009-2010 grew 6.4% from previous year. In the development of next year’s budget, the City produced a budget to meet all contractual obligations without layoffs or reductions in the City’s services. Areas of concern in formulating the fiscal year 2010 budget were a sluggish economy, increased costs for retirement fund contributions and health insurance and an obligation to maintain the highest possible level of public safety and health. The City believes that it has met all of those concerns in the final adopted fiscal year 2010 budget. Request for Information This financial report is designed to provide a general overview of the City’s finances for readers of the financial statements. Questions concerning any information in this report or request for additional information should be addressed to the City Controller, 205 Willowbrook Avenue, Compton, CA 90220.
17
BASIC FINANCIAL STATEMENTS

18
This page is left blank intentionally.

Governmental Business-TypeActivities Activities Total
Assets:Cash and investments 8,328,493$ 506,289$ 8,834,782$ Restricted investments 67,199,487 61,557,000 128,756,487 Receivables, net 35,144,184 2,420,240 37,564,424 Internal balances (10,629,602) 10,629,602 - Inventories, at cost 15,572 282,749 298,321 Prepaid expenses 1,278,892 - 1,278,892 Land held for resale 27,628,956 - 27,628,956 Capital assets : Nondepreciable 33,459,950 575,688 34,035,638 Depreciable 99,117,541 3,788,836 102,906,377 Deferred bond issuance costs 1,754,002 1,419,452 3,173,454
Total Assets 263,297,475 81,179,856 344,477,331
Liabilities:Accounts payable 2,585,540 4,386 2,589,926 Accrued liabilities 8,915,903 1,730,072 10,645,975 Accrued interest payable 802,917 175,484 978,401 Deposits 426,278 1,047,620 1,473,898 Self-insurance claims 1,027,877 - 1,027,877 Due to external parties 436,168 - 436,168 Due to other governmental agencies 232,590 - 232,590 Unearned revenue 28,303 - 28,303 Other 6,834 - 6,834 Long-term liabilities:
Self-insurance claims 4,118,051 - 4,118,051 Postemployment benefit obligation 9,324,992 494,745 9,819,737 Due within one year 9,452,250 1,389,144 10,841,394 Due in more than one year 123,022,970 69,049,785 192,072,755
Total Liabilities 160,380,673 73,891,236 234,271,909
Net Assets:Invested in capital assets, net of related debt 105,434,915 (3,303,471) 102,131,444 Restricted for: Federal grants 5,738,700 - 5,738,700 Retirement 10,096,799 - 10,096,799 Debt service 50,520,946 - 50,520,946 Low/Moderate income housing 4,805,451 - 4,805,451 Unrestricted (deficit) (73,680,009) 10,592,091 (63,087,918)
Total net assets 102,916,802$ 7,288,620$ 110,205,422$
CITY OF COMPTONStatement of Net Assets
June 30, 2009
See Accompanying Notes to Financial Statements.
19

CITY OF COMPTONStatement of Activities
For the Year Ended June 30, 2009
Program RevenueOperating Capital
Charges for Grants and Grants and Functions/Programs Expenses Services Contributions Contribution Governmental Activities:
General government 38,272,613$ 19,934,692$ -$ -$ Professional services 7,022,038 - - - Pass-through payments 302,709 - - - Public safety 22,303,016 - 161,199 - Public works 8,599,347 4,315,571 1,640,675 3,448,042Management services 39,865,098 1,828,782 1,039,923 - Environmental and human services 20,382,744 2,570,725 14,000,500 - Interest on long-term debt 6,524,030 - - -
Total governmental activities 143,271,595 28,649,770 16,842,297 3,448,042
Business-type Activities:Water 8,676,522 9,085,575 - - Rubbish 10,108,895 9,988,931 - - Sewer 1,634,418 949,914 - - Golf course 49,014 47,488 - - Recreational 10,363 15,139 - -
Total business-type activities 20,479,212 20,087,047 - -
Total 163,750,807 48,736,817 16,842,297 3,448,042
General revenue: Taxes: Property taxes Sales and use taxes Utility user taxes Franchise taxes Transient occupancy taxes Motor vehicle in-lieu of taxes Investment earnings Gain on sale of land Other Transfers
Total general revenue and transfers
Change in net assets
Net assets, beginning
Net assets, ending
See Accompanying Notes to Financial Statements. 20

Governmental Business-typeActivities Activities Total
(18,337,921)$ -$ (18,337,921)$ (7,022,038) - (7,022,038)
(302,709) - (302,709) (22,141,817) - (22,141,817)
804,941 - 804,941 (36,996,393) - (36,996,393)
(3,811,519) - (3,811,519) (6,524,030) - (6,524,030)
(94,331,486) - (94,331,486)
- 409,053 409,053- (119,964) (119,964)- (684,504) (684,504)- (1,526) (1,526)- 4,776 4,776
- (392,165) (392,165)
(94,331,486) (392,165) (94,723,651)
38,725,002 - 38,725,0026,727,145 - 6,727,145
14,934,144 - 14,934,1441,011,967 - 1,011,967
194,220 - 194,2208,680,210 - 8,680,210
332,863 48,382 381,245119,651 - 119,651
13,243,388 2,535 13,245,923433,316 (433,316) -
84,401,906 (382,399) 84,019,507
(9,929,580) (774,564) (10,704,144)
112,846,382 8,063,184 120,909,566
102,916,802$ 7,288,620$ 110,205,422$
Net (Expense) Revenue andChanges in Net Assets
21

CITY OF COMPTONBalance Sheet
Governmental FundsJune 30, 2009
Special Revenue
Federal General Grants Retirement
Assets:Cash and investments 405,576$ 5,045,309$ -$ Restricted investments - - - Property taxes receivable 2,111,512 - 825,822 Accounts receivable 460,744 588,927 88,554 Grants receivable - 150,384 - Due from other funds 25,722,431 738,797 9,218,088 Prepaid items 58,934 859,831 360,127 Inventories 244 - - Notes receivable, net - - - Loans receivable - 4,899,333 - Land held for resale - - -
Total Assets 28,759,441$ 12,282,581$ 10,492,591$ Liabilities and Fund Balances:Liabilities: Accounts payable 112,352$ 68,147$ -$ Accrued liabilities 4,401,471 182,080 395,792 Due to other funds 26,777,522 1,305,955 - Due to other governmental agencies - 53,233 - Deposits 54,606 - - Deferred revenue - 4,927,636 - Other - 6,830 -
Total Liabilities 31,345,951 6,543,881 395,792
Fund Balances:Reserved:
Prepaid items 58,934 859,831 360,127 Inventories 244 - - Notes receivable - - - Land held for resale - - - Debt service - - - Regional park 2,500,000 - - Encumbrances 6,049,399 1,543,184 -
Unreserved-undesignated, reported in:General fund (11,195,087) - -
Special revenue funds - 3,335,685 9,736,672 Capital projects funds - - -
Total Fund Balances (2,586,510) 5,738,700 10,096,799 Total Liabilities and Fund Balances 28,759,441$ 12,282,581$ 10,492,591$
See Accompanying Notes to Financial Statements.
22

Debt Service Capital ProjectsPublic Finance Low/Moderate Nonmajor Total
Redevelopment Authority Redevelopment Income Governmental GovernmentalDebt Service Debt Service Capital Projects Housing Funds Funds
-$ -$ 627,722$ 220,351$ 1,519,945$ 7,818,903$ 33,782,689 33,416,798 - - - 67,199,487
2,456,328 - - - 212,616 5,606,278 903,604 1,434 1,586,324 342,635 330,869 4,303,091
- - - - 478,239 628,623 - 449,984 27,779,504 8,801 3,866,100 67,783,705 - - - - - 1,278,892 - - - - - 244 - - 327,972 - - 327,972 - - - 19,378,887 - 24,278,220 - - 22,300,956 5,328,000 - 27,628,956
37,142,621$ 33,868,216$ 52,622,478$ 25,278,674$ 6,407,769$ 206,854,371$
1,586,324$ 4,361$ 330,565$ -$ 483,790$ 2,585,539$ - 201,927 1,048,585 117,083 1,673,995 8,020,933
17,592,155 - 6,556,101 977,253 5,920,116 59,129,102 - - - - 179,357 232,590 - - 371,672 - - 426,278
1,105,124 - - 19,378,887 - 25,411,647 - - - - 4 6,834
20,283,603 206,288 8,306,923 20,473,223 8,257,262 95,812,923
- - - - - 1,278,892 - - - - - 244 - - 327,972 - - 327,972 - - 22,300,956 5,328,000 - 27,628,956
16,859,018 33,661,928 - - - 50,520,946 - - - - - 2,500,000 - - 5,209,738 1,431,298 8,433,110 22,666,729
- - - - - (11,195,087) - - - - (10,305,325) 2,767,032 - 16,476,889 (1,953,847) 22,722 14,545,764
16,859,018 33,661,928 44,315,555 4,805,451 (1,849,493) 111,041,448 37,142,621$ 33,868,216$ 52,622,478$ 25,278,674$ 6,407,769$ 206,854,371$
23

CITY OF COMPTONReconciliation of the Balance Sheet of Governmental Funds
to the Statement of Net AssetsJune 30, 2009
Fund balances - total governmental funds $ 111,041,448
Amounts reported for governmental activities in the statement of net assets are different because:
Capital assets used in governmental activities are not current financial resources and, therefore are not reported in the governmental funds. 132,109,204
Long-term liabilities, including bonds payable, are not due and payable in the current period and therefore are not reported in the governmental funds. (139,557,058)
Accrued interest payable that is not due and payable is not reported in governmental funds. (802,917)
Internal service funds are used by management to charge the cost of certain activities such as equipment, printing, and risk management to individual funds. Since internal service funds predominantly service government activities, their assets and liabilities are included as governmental activities in the statement of net assets (25,257,219)
Loans receivable are initially reported as an expenditure in governmental funds and then reported as a receivable and deferred revenue at fiscal year-end. The deferred revenue is eliminated in the statement of net assets. 24,278,220
Property tax receivable collectible 60 days of year-end are not available to pay current period expenditures and, are shown as deferred revenue in the governmental funds. 1,105,124
Net assets of governmental activities $ 102,916,802
See Accompanying Notes to Financial Statements.
24

25
This page is left blank intentionally.

CITY OF COMPTONStatement of Revenues, Expenditures, and Changes in
Fund Balances - Governmental FundsFor the Year Ended June 30, 2009
Special Revenue
Federal General Grants Retirement
Revenue: Taxes and special assessments 26,450,609$ -$ 16,108,729$ Licenses and permits 3,817,856 - - Intergovernmental revenues 8,747,907 10,792,825 328,663 Fines, forfeitures, and penalties 1,983,459 - - Use of money and property 3,991,806 2,857,703 11,000 Charges for services 3,502,274 922,781 - Gain on sale of land held for resale - - - Other - 407,217 128,192
Total Revenue 48,493,911 14,980,526 16,576,584
Expenditures: Current: General government 9,394,659 44,781 652,936 Professional services - - - Pass-through payments - - - Public safety 17,319,774 178,508 4,831,841 Public works 1,565,979 15,558 73,436 Management services 29,249,649 102,963 6,928,901 Environmental and human services 4,047,431 13,712,940 996,720 Debt service: Principal 203,362 200,000 - Interest 86,517 288,020 - Bond issuance costs - - -
Total expenditures 61,867,371 14,542,770 13,483,834 Excess (Deficiency) of Revenues Over Expenditures (13,373,460) 437,756 3,092,750
Other Financing Sources (Uses): Transfers in 3,114,721 1,157,451 - Transfers out (4,107,813) (1,929,976) - Total Other Financing Sources (Uses) (993,092) (772,525) - Net Change in Fund Balance (14,366,552) (334,769) 3,092,750 Fund Balances, Beginning 11,780,042 6,073,469 7,004,049 Fund Balances, Ending (2,586,510)$ 5,738,700$ 10,096,799$
See Accompanying Notes to Financial Statements.
26

Debt Service Capital ProjectsPublic Finance Low/Moderate Nonmajor Total
Redevelopment Authority Redevelopment Income Governmental GovernmentalDebt Service Debt Service Capital Projects Housing Funds Funds
8,386,487$ -$ 19,178,504$ -$ 4,315,571$ 74,439,900$ - - - - - 3,817,856 - - 40,169 - 8,354,819 28,264,383 - - - - - 1,983,459
135,337 197,525 214,796 13,923 193,742 7,615,832 - 1,918,363 - - 3,422 6,346,840 - - 119,651 - - 119,651 - - 50,590 184,110 52,616 822,725
8,521,824 2,115,888 19,603,710 198,033 12,920,170 123,410,646
- 403,543 3,973,994 7,347,347 70,310 21,887,570 463,285 - 1,460,647 588,309 1,239,638 3,751,879 302,709 - - - - 302,709
- - - - 252,228 22,582,351 - - - - 11,905,436 13,560,409 - 213,296 - - 750,851 37,245,660 - - 2,362,389 - 964,959 22,084,439
6,585,000 1,130,000 - - 92,379 8,210,741 2,091,625 1,948,306 - - 14,592 4,429,060
- 23,461 - - - 23,461 9,442,619 3,718,606 7,797,030 7,935,656 15,290,393 134,078,279
(920,795) (1,602,718) 11,806,680 (7,737,623) (2,370,223) (10,667,633)
- 273,024 20,210,000 3,835,696 1,856,860 30,447,752 (19,000,000) (94,982) (5,045,696) - (1,762,282) (31,940,749) (19,000,000) 178,042 15,164,304 3,835,696 94,578 (1,492,997) (19,920,795) (1,424,676) 26,970,984 (3,901,927) (2,275,645) (12,160,630) 36,779,813 35,086,604 17,344,571 8,707,378 426,152 123,202,078 16,859,018$ 33,661,928$ 44,315,555$ 4,805,451$ (1,849,493)$ 111,041,448$
27
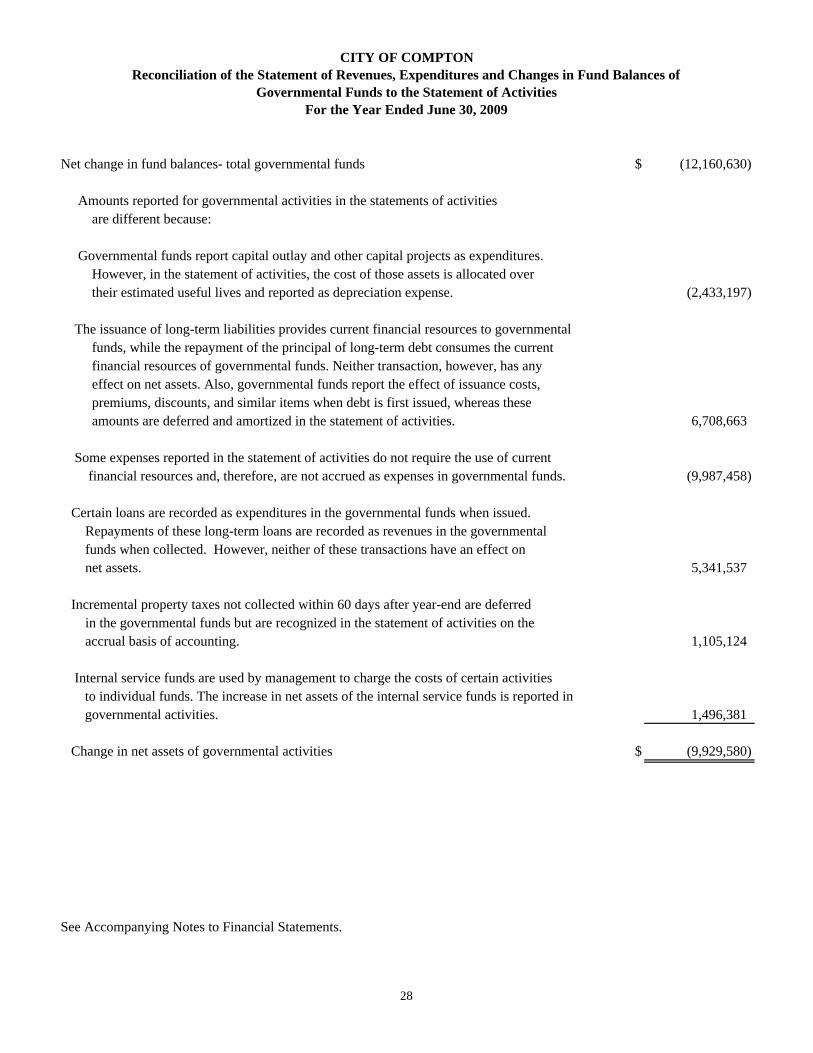
Net change in fund balances- total governmental funds $ (12,160,630)
Amounts reported for governmental activities in the statements of activities are different because:
Governmental funds report capital outlay and other capital projects as expenditures. However, in the statement of activities, the cost of those assets is allocated over their estimated useful lives and reported as depreciation expense. (2,433,197)
The issuance of long-term liabilities provides current financial resources to governmental funds, while the repayment of the principal of long-term debt consumes the current financial resources of governmental funds. Neither transaction, however, has any effect on net assets. Also, governmental funds report the effect of issuance costs, premiums, discounts, and similar items when debt is first issued, whereas these amounts are deferred and amortized in the statement of activities. 6,708,663
Some expenses reported in the statement of activities do not require the use of current financial resources and, therefore, are not accrued as expenses in governmental funds. (9,987,458)
Certain loans are recorded as expenditures in the governmental funds when issued. Repayments of these long-term loans are recorded as revenues in the governmental funds when collected. However, neither of these transactions have an effect on net assets. 5,341,537
Incremental property taxes not collected within 60 days after year-end are deferred in the governmental funds but are recognized in the statement of activities on the accrual basis of accounting. 1,105,124
Internal service funds are used by management to charge the costs of certain activities to individual funds. The increase in net assets of the internal service funds is reported in governmental activities. 1,496,381
Change in net assets of governmental activities $ (9,929,580)
See Accompanying Notes to Financial Statements.
CITY OF COMPTONReconciliation of the Statement of Revenues, Expenditures and Changes in Fund Balances of
Governmental Funds to the Statement of ActivitiesFor the Year Ended June 30, 2009
28

29
This page is left blank intentionally.

CITY OF COMPTONStatement of Net Assets
Proprietary FundsJune 30, 2009
Business-Type Activities - Enterprise Funds
Water Rubbish SewerAssets:Current assets: Cash and cash equivalents 200$ -$ 506,089$ Restricted investments 42,336,583 694,982 18,525,435 Property taxes receivable - - 46,549 Accounts receivable 1,564,943 808,549 199 Due from other funds 5,128,254 766,311 4,706,851 Inventories, at cost 282,749 - -
Total current assets 49,312,729 2,269,842 23,785,123
Noncurrent assets: Capital assets : Nondepreciable 428,288 - 147,400 Depreciable, net 817,519 676,420 2,294,897 Deferred bond issuance costs 664,596 - 754,856
Total noncurrent assets 1,910,403 676,420 3,197,153 Total assets 51,223,132 2,946,262 26,982,276
Liabilities:Current liabilities: Accounts payable 2,000 - 2,386 Due to other funds 651 - - Accrued liabilities 679,451 1,022,181 28,312 Accrued interest payable 24,715 36,400 114,369 Deposits 997,830 - - Self-insurance claims - - - Notes payable 65,804 - - Bonds payable - 715,000 285,000 Capital lease - - 36,044 Compensated absences 287,296 - -
Total current liabilities 2,057,747 1,773,581 466,111Noncurrent liabilities: Postemployment benefit obligation 429,189 36,848 27,304 Notes payable 157,873 - - Bonds payable 43,001,179 1,105,000 24,187,629 Capital lease - - 78,256 Compensated absences 519,848 - - Self-insurance claims - - -
Total noncurrent liabilities 44,108,089 1,141,848 24,293,189 Total liabilities 46,165,836 2,915,429 24,759,300
Net assets:Invested in capital assets, net of related debt 1,022,130 (448,598) (3,877,003)Unrestricted (deficit) 4,035,166 479,431 6,099,979
Total net assets (deficit) 5,057,296$ 30,833$ 2,222,976$
See Accompanying Notes to Financial Statements.
30

GovernmentalActivities
Nonmajor InternalEnterprise Service
Funds Total Funds
-$ 506,289$ 509,590$ - 61,557,000 - - 46,549 - - 2,373,691 -
103,281 10,704,697 1,127,406 - 282,749 15,328
103,281 75,470,975 1,652,324
- 575,688 44,109 - 3,788,836 424,178 - 1,419,452 - - 5,783,976 468,287
103,281 81,254,951 2,120,611
- 4,386 - 74,444 75,095 20,847,779
128 1,730,072 894,970 - 175,484 -
49,790 1,047,620 - - - 1,027,877 - 65,804 - - 1,000,000 - - 36,044 106,389 - 287,296 -
124,362 4,421,801 22,877,015
1,404 494,745 - - 157,873 - - 68,293,808 - - 78,256 382,764 - 519,848 - - - 4,118,051
1,404 69,544,530 4,500,815125,766 73,966,331 27,377,830
- (3,303,471) (20,866)
(22,485) 10,592,091 (25,236,353)
(22,485)$ 7,288,620$ (25,257,219)$
Business-Type Activities - Enterprise Funds
31
CITY OF COMPTONStatement of Revenues, Expenses, and Changes in Fund Net Assets
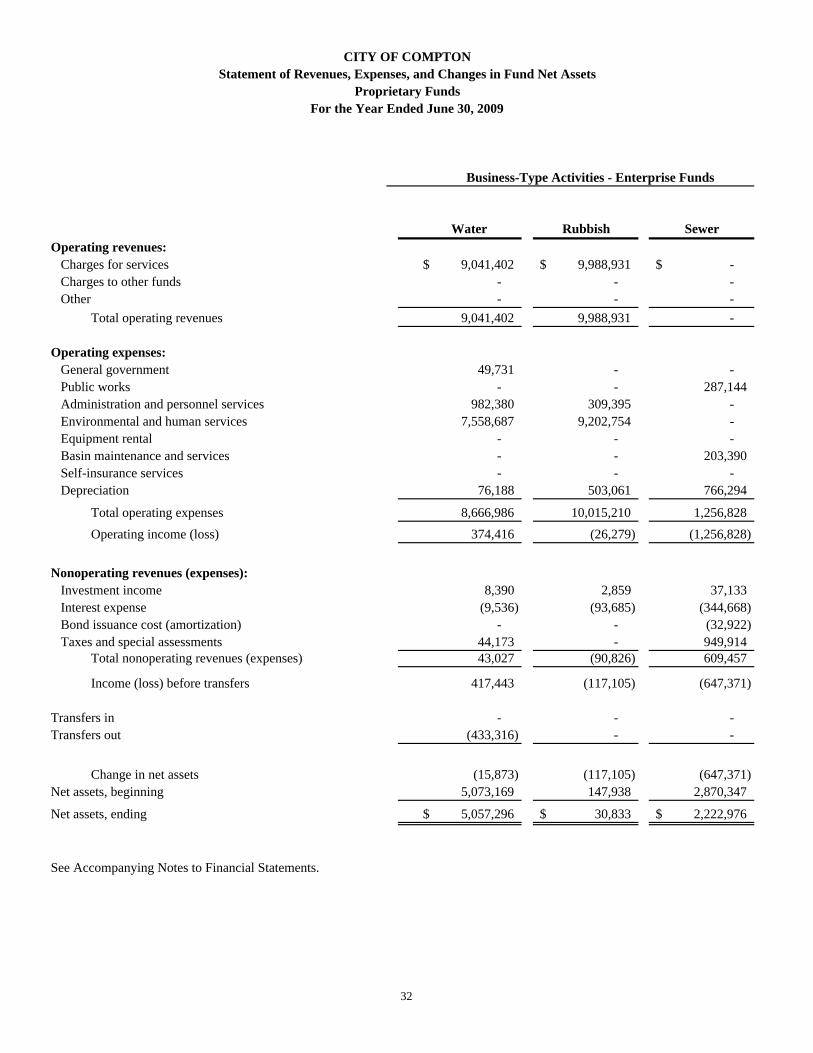
Proprietary FundsFor the Year Ended June 30, 2009
Water Rubbish SewerOperating revenues: Charges for services 9,041,402$ 9,988,931$ -$ Charges to other funds - - - Other - - -
Total operating revenues 9,041,402 9,988,931 -
Operating expenses: General government 49,731 - - Public works - - 287,144 Administration and personnel services 982,380 309,395 - Environmental and human services 7,558,687 9,202,754 - Equipment rental - - - Basin maintenance and services - - 203,390 Self-insurance services - - - Depreciation 76,188 503,061 766,294
Total operating expenses 8,666,986 10,015,210 1,256,828 Operating income (loss) 374,416 (26,279) (1,256,828)
Nonoperating revenues (expenses): Investment income 8,390 2,859 37,133 Interest expense (9,536) (93,685) (344,668) Bond issuance cost (amortization) - - (32,922) Taxes and special assessments 44,173 - 949,914
Total nonoperating revenues (expenses) 43,027 (90,826) 609,457
Income (loss) before transfers 417,443 (117,105) (647,371)
Transfers in - - - Transfers out (433,316) - -
Change in net assets (15,873) (117,105) (647,371) Net assets, beginning 5,073,169 147,938 2,870,347
Net assets, ending 5,057,296$ 30,833$ 2,222,976$
See Accompanying Notes to Financial Statements.
Business-Type Activities - Enterprise Funds
32

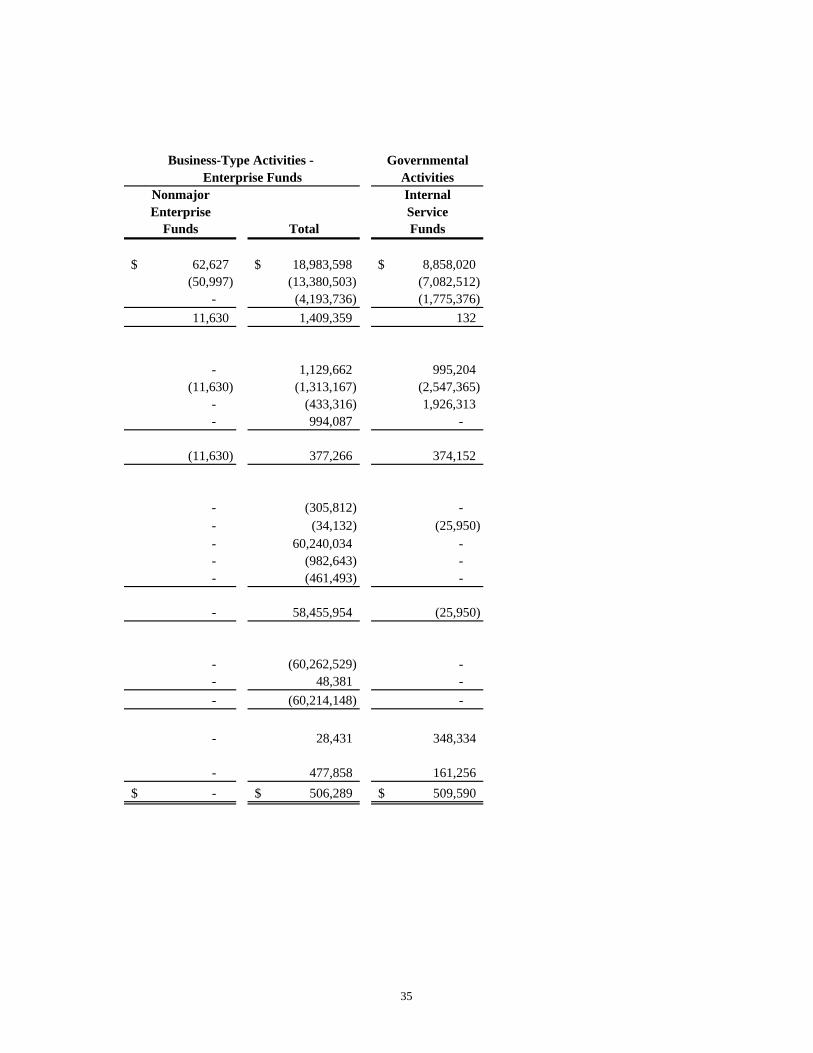
GovernmentalActivities
Nonmajor InternalEnterprise Service
Funds Total Funds
62,627$ 19,092,960$ -$ - - 8,466,405
2,535 2,535 - 65,162 19,095,495 8,466,405
- 49,731 - 48,452 335,596 -
- 1,291,775 2,595,977 10,925 16,772,366 -
- - 370,150 - 203,390 - - - 5,839,284 - 1,345,543 90,926
59,377 19,998,401 8,896,337 5,785 (902,906) (429,932)
- 48,382 - - (447,889) - - (32,922) - - 994,087 - - 561,658 -
5,785 (341,248) (429,932)
- - 1,926,313 - (433,316) -
5,785 (774,564) 1,496,381 (28,270) 8,063,184 (26,753,600)
(22,485)$ 7,288,620$ (25,257,219)$
Business-Type Activities - Enterprise Funds
33

CITY OF COMPTONStatement of Cash Flows
Proprietary FundsFor the Year Ended June 30, 2009
Water Rubbish SewerCash flows from operating activities: Cash received from customers 8,953,679$ 9,967,292$ -$ Cash payments to suppliers for goods and services (4,128,331) (8,771,670) (429,505) Cash payment to employees for services (3,905,106) (272,547) (16,083)
Net cash provided by (used in) operating activities 920,242 923,075 (445,588)
Cash flows from non-capital financing activities: Loan repayments from other funds 985,920 - 143,742 Loans to other funds (1,177,418) (124,119) - Transfers (to) from other funds (433,316) - - Taxes and special assessments 44,173 - 949,914
Net cash provided by (used in) non-capital financing Activities (580,641) (124,119) 1,093,656
Cash flows from capital and related financing activities: Acquisition and construction of capital assets (305,812) - - Net capital lease payment - - (34,132) Bond financing (net of deferred bond issuance costs) 42,336,583 - 17,903,451 Principal paid on bonds and notes payable (32,643) (680,000) (270,000) Interest paid on long-term debt (9,536) (107,289) (344,668)
Net cash provided by (used in) capital and related financing activities 41,988,592 (787,289) 17,254,651
Cash flows from investing activities: Increase in restricted investments (42,336,583) (14,526) (17,911,420) Interest received on investments 8,390 2,859 37,132
Net cash used in investing activities (42,328,193) (11,667) (17,874,288) Net increase in cash and cash equivalents - - 28,431
Cash and cash equivalents, beginning 200 - 477,658 Cash and cash equivalents, ending 200$ -$ 506,089$
See Accompanying Notes to Financial Statements.
Business-Type Activities - Enterprise Funds
34
GovernmentalActivities
Nonmajor InternalEnterprise Service
Funds Total Funds
62,627$ 18,983,598$ 8,858,020$ (50,997) (13,380,503) (7,082,512)
- (4,193,736) (1,775,376) 11,630 1,409,359 132
- 1,129,662 995,204 (11,630) (1,313,167) (2,547,365)
- (433,316) 1,926,313 - 994,087 -
(11,630) 377,266 374,152
- (305,812) - - (34,132) (25,950) - 60,240,034 - - (982,643) - - (461,493) -
- 58,455,954 (25,950)
- (60,262,529) - - 48,381 - - (60,214,148) -
- 28,431 348,334
- 477,858 161,256 -$ 506,289$ 509,590$
Business-Type Activities - Enterprise Funds
35

CITY OF COMPTONStatement of Cash Flows
Proprietary FundsFor the Year Ended June 30, 2009
Water Rubbish SewerReconciliation of operating income (loss) to net Cash provided by (used in) operating activities: Operating income (loss) 374,416$ (26,279)$ (1,256,828)$ Adjustments to reconcile operating income (loss) to net cash provided by (used in) operating activities:
Depreciation expense 76,188 503,061 766,294 Changes in operating assets and liabilities: Decrease (increase) in: Taxes receivable - - (5,396) Accounts receivable (87,723) 58,364 1,997 Inventories (81,865) - - Increase (decrease) in: Accounts payable (261) - - Accrued liabilities (655,548) 351,081 21,041
Compensated absences 807,144 - - Postemployment benefit obligation 429,189 36,848 27,304
Deposits payable 58,702 - - Self-insurance claims - - -
Net cash provided by (used in) operating activities 920,242$ 923,075$ (445,588)$
See Accompanying Notes to Financial Statements.
Business-Type Activities - Enterprise Funds
36

GovernmentalActivities
Nonmajor InternalEnterprise Service
Funds Total Funds
5,785$ (902,906)$ (429,932)$
- 1,345,543 90,926
- (5,396) - - (27,362) - - (81,865) 19,176
- (261) - 128 (283,298) 848,974 - 807,144 -
1,404 494,745 - 4,313 63,015 -
- - (529,012)
11,630$ 1,409,359$ 132$
Business-Type Activities - Enterprise Funds
37

CITY OF COMPTONStatement of Fiduciary Assets and Liabilities
Agency FundsJune 30, 2009
Assets:Cash and investments 362,493$ Accounts receivable 92,115 Due from other funds 436,168 Total assets 890,776$
Liabilities:Accrued liabilities 2,988$ Deposits 711,885 Agency obligations 175,903 Total liabilities 890,776$
See Accompanying Notes to Financial Statements.
38

CITY OF COMPTON Notes to Financial Statements
June 30, 2009
39
(1) Summary of Significant Accounting Policies
(a) Description of the Reporting Entity
The City of Compton (City) was incorporated on May 11, 1888, under the laws of the State of California and enjoys all the rights and privileges applicable to a charter city. It is governed by an elected city council. As required by accounting principles generally in the United States of America, these financial statements present the City of Compton (the primary government) and its component units.
Blended Component Units:
Blended component units, although legally separate entities, are, in substance, part of the primary government’s operations and so data from these units is combined with data of the primary government. Component units should be included in the reporting entity financial statements using the blended method if either of the following criteria is met:
i. The component unit’s governing body is substantially the same as the governing body of the
primary government (the City). ii. The component unit provides services entirely, or almost entirely, to the primary government
or otherwise exclusively, or almost exclusively, benefits the primary government even though it does not provide services directly to it.
The component units discussed below are included in the reporting unit because of their operational or financial relationships with the City of Compton.
The Community Redevelopment Agency (Agency) of the City of Compton was created by the City Council of the City in 1967. The Agency was established pursuant to the California Community Redevelopment Law, as codified in Part 1 of Division 24 of the State of California Health and Safety code. Through the creation of designated project areas, the Agency is broadly empowered to engage in the general acquisition and development of property in those areas of the City determined to be in a declining state. The City Council members are designated as Commissioners of the Agency, and thus, the City has a continuing accountability for fiscal matters of the Agency.
The Public Finance Authority (PFA) was organized in 1987 under a joint exercise of power agreement to provide financing for public capital improvements for the City and the Compton Redevelopment Agency. The Authority’s financial activity is reported in a separate capital projects fund.
The Housing Authority of the City of Compton (Housing Authority) was established in 1969 pursuant to State legislation. On December 1, 1976, the Housing Authority entered into an Annual Contributions Contract with HUD and received allocation of Section 8 Certificate units. The Housing Authority operates two programs: the Housing Choice Voucher Program, which provides monthly rental assistance to participants who want to rent from private landlords, but cannot afford the full monthly rental payment; and the Family Self-Sufficiency (FSS) Program, which assists families in creating plans that will lead to economic independence. The City Council also acts as the Housing Authority’s governing body. As such, the City Council establishes policy, appoints management, and exercises budgetary control.

CITY OF COMPTON Notes to Financial Statements (Continued)
June 30, 2009
40
Copies of reports of financial statements for the Agency can be obtained at the City Controller, 205 South Willowbrook Avenue, Compton, CA 90220. Separate financial statements are not prepared for the PFA or Housing Authority. (b) Government-Wide and Fund Financial Statements
The government-wide financial statements (i.e., the statement of net assets and the statement of activities) report information on all of the non-fiduciary activities of the government. Governmental activities, which normally are supported by taxes and intergovernmental revenue, are reported separately from business-type activities, which rely to a significant extent on fees and charges for support.
The statement of activities demonstrates the degree to which the direct expenses of a given function or segment is offset by program revenues. Direct expenses are those that are clearly identifiable with a specific function or segment. Program revenues include 1) charges to customers or applicants who purchase, use or directly benefit from goods, services or privileges provided by a given function or segment, and 2) grants and contributions that are restricted to meeting the operational or capital requirements of a particular function or segment. Taxes and other items not properly included among program revenues are reported instead as general revenues.
Separate financial statements are provided for government funds, proprietary funds, and fiduciary funds, even though the latter are excluded from the government-wide financial statements. Major individual governmental funds and the major individual enterprise funds are reported as separate columns in the fund financial statements. (c) Measurement Focus, Basis of Accounting, and Financial Statement Presentation The government-wide financial statements are reported using the economic resources measurement focus and the accrual basis of accounting, as are proprietary fund and fiduciary fund financial statements. Revenues are recorded when earned and expenses are recorded when a liability is incurred, regardless of the timing of related cash flows. Property taxes are recognized as revenues in the year for which they are levied. Grants and similar items are recognized as revenue as soon as all eligibility requirements have been met.
Governmental fund financial statements are reported using the current financial resources measurement focus and the modified accrual basis of accounting. Revenues are recognized as soon as they are both measurable and available. Revenues are considered to be available when they are collectible within the current period or soon enough thereafter to pay liabilities of the current period. For this purpose, the City considers revenues to be available if they are collected within 60 days of the end of the current fiscal period. Expenditures generally are recorded when the related fund liability is incurred, except for debt service expenditures as well as expenditures related to compensated absences and claims and judgments, which are recorded only when payment is due.
Property taxes, special assessments, franchise taxes, licenses, other taxes, grants, charges for services, and investment earnings associated with the current fiscal period are all considered to be susceptible to accrual and so have been recognized as revenues of the current fiscal period to the extent measurable and available. All other revenue items are considered measurable and available only when cash is received by the City.

CITY OF COMPTON Notes to Financial Statements (Continued)
June 30, 2009
41
The City reports the following major governmental funds:
• General Fund – This fund is used to account for resources traditionally associated with governments, which are not required to be accounted for in another fund.
• Federal Grants Special Revenue Fund – This fund is used to account for various grants
received from the agencies of the Federal government.
• Retirement Special Revenue Fund – This fund accounts for the contributions made by the City to its public employees’ retirement system. The activity is financed from a special tax levy.
• Redevelopment Debt Service Fund – This fund was established to finance and account for
the payment of interest and principal on the Agency’s outstanding long-term indebtedness. The principal sources of revenue of this fund are tax increments and investment income.
• The Public Finance Authority Debt Service Fund – This fund was set up to finance and
account for the payment of interest and principal on the outstanding long-term indebtedness issued by the Public Finance Authority. The principal source of revenue of this fund is the base rental payments made by the City to the Authority.
• Redevelopment Capital Projects Fund – This fund is used to account for all revenues and
costs of implementing various projects in accordance with the California Community Redevelopment Law and Public Financing, including acquisition of properties, cost of site improvements, and other costs of benefits to the project areas as well as administrative expenses incurred in sustaining project activities.
• Low/Moderate Income Housing Capital Projects Fund – This fund was established to
provide, improve, and preserve low and moderate-income housing. Funding for this activity is from tax increment funds designated for such purpose by State Law (Health and Safety Code, Section 33334.2).
The City reports the following major proprietary funds:
• Water Fund – This fund is used to account for the provision of water to residents of the City.
All activities necessary to provide such services are accounted for in this fund, including, but not limited to, administration, operations, maintenance, financing, billing, and collection.
• Rubbish Fund – This fund is used to account for the provision of rubbish collection services
to residents and businesses within the City.
• Sewer Fund – This fund is used to account for the costs of replacing and upgrading portions of the City’s sewer system and its operations.

CITY OF COMPTON Notes to Financial Statements (Continued)
June 30, 2009
42
Additionally, the City reports the following fund types:
Governmental Funds:
Special Revenue Funds – Special Revenue Funds are used to account for the proceeds of specific revenue sources that are legally restricted to expenditures for specified purposes.
Debt Service Funds – Debt Service Funds are used to account for the accumulation of resources for, and the payment of, general long-term debt principal and interest.
Capital Projects Funds – Capital Projects Funds are used to account for financial resources used for the acquisition or construction of major capital facilities and equipment (other than those financed by proprietary funds).
Proprietary Funds:
Enterprise Funds – Enterprise Funds are used to account for activities financed by user fees.
Internal Service Funds – Internal Service Funds are used to account for the financing of goods or services provided by one department to other departments of the City on a cost reimbursement basis. These services include equipment rental fund, central duplicating fund, and self-insurance fund.
Fiduciary Funds:
Agency Funds – Agency Funds are used to account for funds in which the City is acting as an agent for another agency.
Private-sector standards of accounting and financial reporting issued prior to December 1989, generally are followed in both the government-wide and fund financial statements to the extent that the private-sector standards do not conflict with or contradict guidance of the Government Accounting Standards Board. Governments also have the option of following subsequent private-sector guidance for their business-type activities and enterprise funds, subject to this same limitation. The City has elected not to follow subsequent private-sector guidance.
As a general rule, the effect of interfund activity has been eliminated from the government-wide financial statements. Exceptions to this general rule are internal service fund charges to business-type activities and other charges to business-type activities and various other functions of the City. Elimination of these charges would distort the direct costs and program revenues reported for the various functions concerned. Amounts reported as program revenues include: 1) charges to customers or applicants for goods, services or privileges provided, 2) operating grants and contributions, 3) capital grants and contributions, including special assessments. Internally dedicated resources are reported as general revenues rather than as program revenues. Likewise, general revenues include all taxes.
Proprietary funds distinguish operating revenues and expenses from nonoperating items. Operating revenues and expenses generally result from providing goods and services and producing and delivering goods in connection with a proprietary fund’s principal ongoing operations. The principal

CITY OF COMPTON Notes to Financial Statements (Continued)
June 30, 2009
43
operating revenues of the enterprise and internal service funds are charges for sales and services. Operating expenses for enterprise and internal service funds included cost of sales and service, operations and maintenance of systems and facilities, administrative expenses and depreciation on capital assets. All revenues and expenses not meeting this definition are reported as nonoperating revenues and expenses. When both restricted and unrestricted resources are available for use, it is the City’s policy to use restricted resources first, and then use unrestricted resources as needed.
(d) Assets, Liabilities, and Net Assets
1. Cash and Investments
Cash and cash equivalents include amounts in demand deposits as well as short-term investments with an original maturity of three months or less. Investments are stated at fair value, generally based on quoted market prices. The City’s investment in the Local Agency Investment Fund (LAIF) is part of the State Treasurer’s Investment Pool operated in accordance with the California Government Code Section 16429. The reported value of the pool is the same as the fair value of the pool shares. Investments in money market mutual funds are stated at fair value which as of the year end equals the cost of the investments in the money market mutual funds. 2. Inventories
Enterprise Fund inventories include various accessories used for water service repair and maintenance. Inventories in the Internal Service Funds consist principally of office supplies, recreational activity supplies, and other miscellaneous materials and supplies. Inventories are valued at the lower of average cost or market. 3. Land Held for Resale
Land acquired by the Community Redevelopment Agency and held for resale is accounted for as an asset and recorded at the lower of cost or estimated realizable value. Estimated realizable value is determined upon the execution of a disposition and development agreement. If resale of the land is not anticipated in the near future, a corresponding portion of the fund balance, which is not available for current expenditure, is reserved in the governmental fund financial statements. 4. Capital Assets
Capital Assets, which include land, land improvements, buildings, structures, equipment (including furniture), and infrastructure assets are reported in the applicable governmental activities columns in the accompanying government-wide financial statements and the proprietary fund financial statements. Capital assets are defined using guidelines established by the City. Such guidelines assert that assets with an initial individual cost of more than $5,000 ($50,000 for infrastructure) and an estimated useful life in excess of one year are to be considered capital assets. Such capital assets are recorded at historical cost or estimated
CITY OF COMPTON Notes to Financial Statements (Continued)
June 30, 2009
44
historical cost if purchased or constructed. Donated capital assets are recorded at estimated fair value at the date of donation. The cost of normal maintenance and repairs that do not add to the value of the asset or materially extend assets lives are not capitalized. Major outlays for capital assets and improvements are capitalized as projects are constructed. Depreciation on capital assets is computed on a straight-line method using these estimated useful lives:
Buildings and Structures 40 years Land Improvements 20 years Equipment 5 – 10 years Infrastructure 25 – 60 years 5. Compensated Absences
All compensated balances are accrued when earned in the government-wide financial statements and in the proprietary fund financial statements. Compensated absences are recorded as a liability and expenditures in the governmental funds when due and payable. 6. Claims and Judgments Material claims and judgments are recorded as a liability when it is probable that a claim has been incurred and the amount of the loss can be reasonably estimated. The City records the estimated loss including those incurred but not reported, net of any insurance coverage, in an internal service fund under its self-insurance program. In the opinion of the City Attorney, at June 30, 2009 the City had no material outstanding claims, in addition to amount disclosed in the statement of net assets.
7. Property Tax Revenues The County of Los Angeles is responsible for assessing, collecting, and distributing property taxes to the City. The following property tax calendar is used: Lien date January 1 Levy date 4th Monday of September Due dates November 1 and February 1 Delinquency date December 11 and April 11
The City considers property taxes as available and records revenues if they are collected within 60 days after year end. Property tax receivables are adjusted to their net realizable values by deducting any estimated uncollectible amounts reported to the City.

CITY OF COMPTON Notes to Financial Statements (Continued)
June 30, 2009
45
8. Net Assets and Fund Balances In the government-wide financial statements and proprietary fund financial statements net assets are reported in three categories: net assets invested in capital assets, net of related debt; restricted net assets and unrestricted net assets.
• Invested in Capital Assets, Net of Related Debt – This category groups all capital assets, including infrastructure, into one component of net assets. Accumulated depreciation and the outstanding balances of debt that are attributable to the acquisition, construction or improvement of these assets reduce the balance in this category.
• Restricted Net Assets – This category presents external restrictions imposed by creditors,
grantors, contributors or law or regulations of other governments and restrictions imposed by law through constitutional provisions or enabling legislation. At June 30, 2009, the restricted net assets balance was $71,161,896 for governmental activities, of which, $10,096,799 was restricted by enabling legislation.
• Unrestricted Net Assets – This category represents net assets of the City, not restricted
for any project or other purpose.
In the fund financial statements, governmental funds report reservations of fund balances for amounts that are not available for appropriation or are legally restricted by outside parties for use for a specific purpose. Designations of fund balance represent tentative management plans that are subject to change.
9. Use of Estimates
The preparation of the accompanying basic financial statements in conformity with generally accepted accounting principles in the United States of America requires management to make estimates and assumptions that affect the reported amounts of certain assets, liabilities, revenues, and expenditures/expenses, as well as disclosures of contingent assets and liabilities at the date of the financial statements. Actual results could differ from those estimates.
(2) Reconciliation of Government-Wide and Fund Financial Statements
(a) Explanation of certain differences between the governmental funds balance sheet and the government-wide statement of net assets
The governmental funds balance sheet includes a reconciliation between fund balances-total governmental funds and net assets-governmental activities as reported in the government-wide statement of net assets. One element of that reconciliation states that, “Capital assets used in governmental activities are not financial resources and, therefore, are not reported in the governmental funds.” The capital assets reported in the statement of net assets for governmental funds (excludes internal service funds) are as follows:

CITY OF COMPTON Notes to Financial Statements (Continued)
June 30, 2009
46
Land 23,525,645$ Construction in progress 9,934,305 Depreciable building and structures, net 20,144,033 Depreciable land improvement, net 772,410 Depreciable equipment, net 2,635,590 Depreciable infractsructure, net 75,097,221
132,109,204$
One element of that reconciliation explains that “long-term liabilities, including bonds payable, are not due and payable in the current period and therefore are not reported in the governmental funds.” The details of this $139,557,058 adjustment are as follows:
Bonds payable (114,067,303)$ Mortgage loan payable (3,314,052) Notes payable (4,799,834) Tax sharing obligation (1,676,476) Capital lease obligation (102,104) Compensated absences (8,827,725) Deferred charge on refunding (amortized as interest expense) 1,753,271 Deferred bond issuance costs (amortized over life of debt) 1,754,002 Unamortized bond discount 161,084 Unamortized bond premium (1,112,929) Postemployment benefit obligation (9,324,992)
(139,557,058)$
(b) Explanation of certain differences between the governmental funds statement of revenues, expenditures and changes in fund balances and the government-wide statement of activities
The governmental funds statement of revenues, expenditures and changes in fund balances includes a reconciliation between net change in fund balances - total governmental funds and changes in net assets of governmental activities as reported in the government-wide statement of activities. One element of that reconciliation explains that “Governmental funds report capital outlay as expenditures. However, in the statement of activities the cost of those assets is allocated over their estimated useful lives and reported as depreciation expense.” The details of this difference are as follows:
Capital outlay $ 5,119,442 Depreciation expense (7,552,639)
$ (2,433,197)

CITY OF COMPTON Notes to Financial Statements (Continued)
June 30, 2009
47
One element of that reconciliation states that “The issuance of long-term liabilities provides current financial resources to governmental funds, while the repayment of the principal of long-term debt consumes the current financial resources of governmental funds. Neither transaction, however, has any effect on net assets. The details of this adjustment are as follows:
Debt principal repayment:Bond payable 7,715,000$ Mortgage loan payable 234,987 Capital lease obligation 142,773 Notes payable 292,379
Debt issuance:Property tax sharing obligation (1,676,476)
6,708,663$
Another element of that reconciliation states that “Some expenses reported in the statement of activities do not require the use of current financial resources and therefore are not accrued as expenses in governmental funds.” The details of this adjustment are as follows:
Accrued interest 137,187$ Current year interest accretion (2,232,157) Amortization of bond premium 278,233 Amortization of bond discount (6,712) Amortization of deferred on refunding (344,997) Amortization of issuance cost (167,980) Change in compensated absences (817,748) Change in postemployment benefit obligation (6,833,284)
(9,987,458)$
Another element of that reconciliation states that “Certain loans are recorded as expenditures in the governmental funds when issued. Repayments of these long-term loans are recorded as revenues in the governmental funds when collected. However, neither of these transactions have an effect on net assets.” The details of this adjustment are as follows:
Loans granted 5,875,511$ Loan repayments received (362,340) Loans written-off (171,634) Change in loans receivable 5,341,537$

CITY OF COMPTON Notes to Financial Statements (Continued)
June 30, 2009
48
(3) Stewardship, Compliance and Accountability Individual Department and Fund Disclosures
For the year ended June 30, 2009, the following departments of the City had expendituresin the General Fund that exceeded the budget appropriations by the indicated amounts:
Fire Department $ 1,987,918 City Council 171,980 City Attorney 125,943 City Manager 54,146 Public Works (Engineering) 5,403 Public Works (Street Maintenance) 21,614
Nondepartmental 6,882,565
At June 30, 2009, the following funds had accumulated deficits:
General Fund $ 2,586,510
Nonmajor Governmental Funds: California Department of Transportation Grant $ 444,584 Department of Health Service Grant 325,468 California Department of Parks and Recreation Grant 375,171 Special Assessment Special Revenue Fund 3,178,017
Nonmajor Enterprise Funds: Golf Course $ 75,976
Internal Service Funds: Equipment Rental $ 1,669,496 Self-Insurance 23,815,126
These deficits are anticipated to be funded from future management spending control policies, grant revenues, operating transfers from the various City departments, and future user charges. The Self-Insurance Fund possesses the largest deficit in this group totaling $23,815,126. This amount represents an improvement of $2,013,970 over the previous year deficit of $25,829,096 due mainly to reduction in self-insurance expenses and reduction in general liability estimate resulting from a more efficient management of the general liability and worker’s compensation operations during the year.
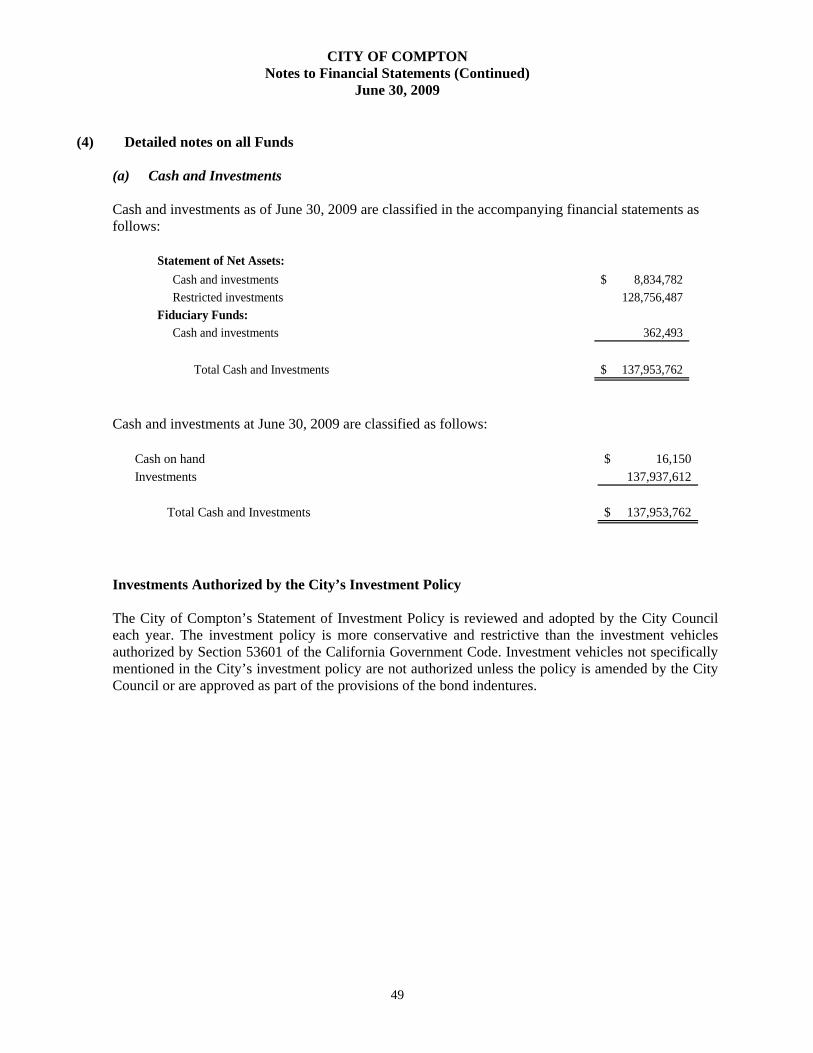
CITY OF COMPTON Notes to Financial Statements (Continued)
June 30, 2009
49
(4) Detailed notes on all Funds
(a) Cash and Investments
Cash and investments as of June 30, 2009 are classified in the accompanying financial statements as follows:
Statement of Net Assets: Cash and investments 8,834,782$ Restricted investments 128,756,487 Fiduciary Funds: Cash and investments 362,493
Total Cash and Investments 137,953,762$
Cash and investments at June 30, 2009 are classified as follows:
Cash on hand 16,150$ Investments 137,937,612
Total Cash and Investments 137,953,762$
Investments Authorized by the City’s Investment Policy
The City of Compton’s Statement of Investment Policy is reviewed and adopted by the City Council each year. The investment policy is more conservative and restrictive than the investment vehicles authorized by Section 53601 of the California Government Code. Investment vehicles not specifically mentioned in the City’s investment policy are not authorized unless the policy is amended by the City Council or are approved as part of the provisions of the bond indentures.
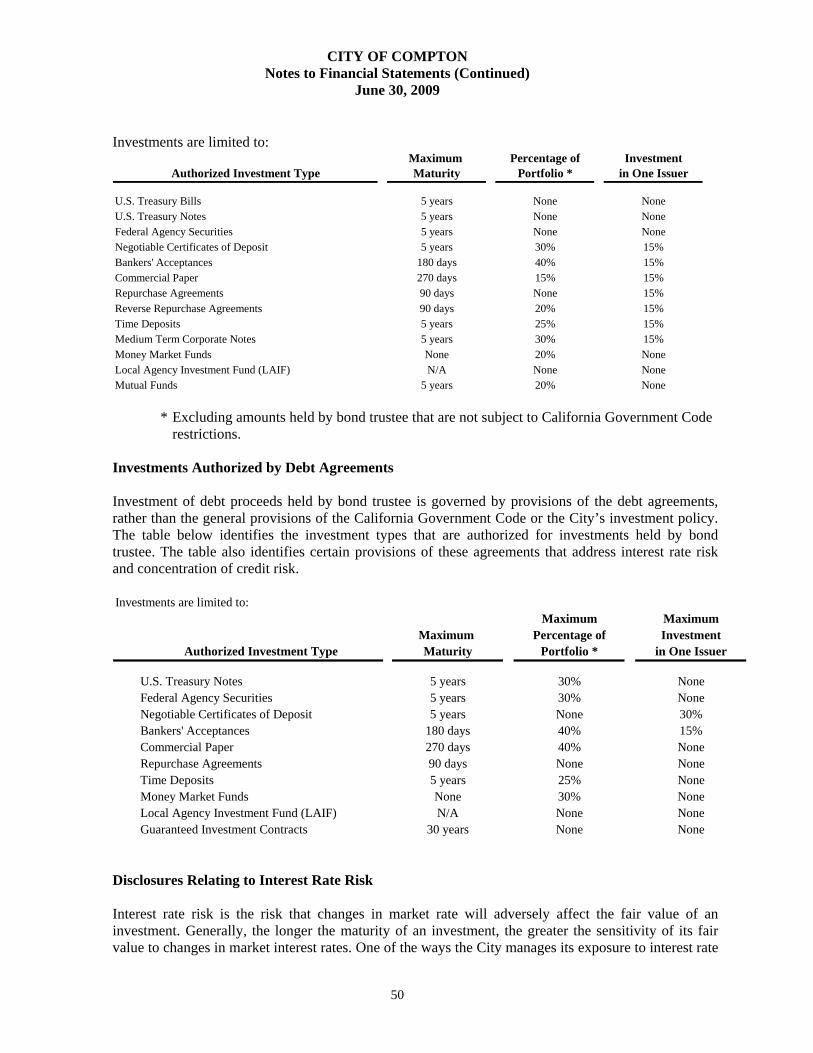
CITY OF COMPTON Notes to Financial Statements (Continued)
June 30, 2009
50
Investments are limited to: Maximum Percentage of Investment
Authorized Investment Type Maturity Portfolio * in One Issuer
U.S. Treasury Bills 5 years None NoneU.S. Treasury Notes 5 years None NoneFederal Agency Securities 5 years None NoneNegotiable Certificates of Deposit 5 years 30% 15%Bankers' Acceptances 180 days 40% 15%Commercial Paper 270 days 15% 15%Repurchase Agreements 90 days None 15%Reverse Repurchase Agreements 90 days 20% 15%Time Deposits 5 years 25% 15%Medium Term Corporate Notes 5 years 30% 15%Money Market Funds None 20% NoneLocal Agency Investment Fund (LAIF) N/A None NoneMutual Funds 5 years 20% None
* Excluding amounts held by bond trustee that are not subject to California Government Code
restrictions.
Investments Authorized by Debt Agreements
Investment of debt proceeds held by bond trustee is governed by provisions of the debt agreements, rather than the general provisions of the California Government Code or the City’s investment policy. The table below identifies the investment types that are authorized for investments held by bond trustee. The table also identifies certain provisions of these agreements that address interest rate risk and concentration of credit risk. Investments are limited to:
Maximum MaximumMaximum Percentage of Investment
Authorized Investment Type Maturity Portfolio * in One Issuer
U.S. Treasury Notes 5 years 30% NoneFederal Agency Securities 5 years 30% NoneNegotiable Certificates of Deposit 5 years None 30%Bankers' Acceptances 180 days 40% 15%Commercial Paper 270 days 40% NoneRepurchase Agreements 90 days None NoneTime Deposits 5 years 25% NoneMoney Market Funds None 30% NoneLocal Agency Investment Fund (LAIF) N/A None NoneGuaranteed Investment Contracts 30 years None None
Disclosures Relating to Interest Rate Risk
Interest rate risk is the risk that changes in market rate will adversely affect the fair value of an investment. Generally, the longer the maturity of an investment, the greater the sensitivity of its fair value to changes in market interest rates. One of the ways the City manages its exposure to interest rate

CITY OF COMPTON Notes to Financial Statements (Continued)
June 30, 2009
51
risk is by purchasing a combination of shorter term and longer term investments and by timing cash flows maturities so that a portion of the portfolio is maturing or close to maturity evenly over time as necessary to provide the cash flow and liquidity needed for operations.
Information about the sensitivity of the fair values of the City’s investments (including investments held by bond trustee) to market interest rate fluctuations is provided by the following table that shows the distribution of the City’s investments by maturity.
Remaining Maturity (in
Months)12 Months
Investment Type Amounts or Less
Money Market Funds 1,607,695$ 1,607,695$ Held by Fiscal Agent: Money Market Funds 128,756,487 128,756,487 State Investment Pool (LAIF) 7,573,430 7,573,430
137,937,612$ 137,937,612$
Disclosures Relating to Credit Risk
Generally, credit risk is the risk that an issuer of an investment will not fulfill its obligation to the holder of the investment. This is measured by the assignment of a rating by a nationally recognized statistical rating organization. Presented below is the minimum rating required by (where applicable) the California Government Code, the City investment policy, or debt agreements and the actual rating as of year end for each investment type.
Minimum Legal
Investment Type Amounts Rating AAA Not Rated
Money Market Funds 1,607,695$ AAA 177,984$ 1,429,711$ Held by Fiscal Agent: Money Market Funds 128,756,487 AAA 128,756,487 - State Investment Pool 7,573,430 N/A - 7,573,430
137,937,612$ 128,934,471$ 9,003,141$
Custodial Credit Risk
Custodial credit risk for deposits is the risk that, in the event of the failure of a depository financial institution, a government will not be able to recover its deposits or will not be able to recover collateral securities that are in the possession of an outside party. The custodial credit risk for investments is the risk that, in the event of failure of the counterparty (e.g. broker-dealer) to transaction, a government will not be able to recover the value of its investment or collateral securities that are in the possession

CITY OF COMPTON Notes to Financial Statements (Continued)
June 30, 2009
52
of another party. The California Government Code and the City investment policy do not contain legal or policy requirements that would limit the exposure to custodial credit risk for deposits or investments, other than the following provision for deposits: The California Government Code requires that a financial institution secure deposits made by state or local government units by pledging securities in an undivided collateral pool held by a depository regulated under state law (unless so waived by the government unit). The market value of the pledged securities in the collateral pool must equal 110% of the total amount deposited by the public agencies. California law also allows financial institutions to secure City deposits by pledging first trust deed mortgage notes having a value of 150% of the secured public deposits.
Investment in State Investment Pool
The City is a voluntary participant in the Local Agency Investment Fund (LAIF) that is regulated by the California Government Code under the oversight of the Treasurer of the State of California. The fair value of the City’s investments in the pool is reported in the accompanying financial statements at amounts based upon the City’s pro-rata share of the fair value provided by LAIF for the entire LAIF portfolio (in relation to the amortized cost of the portfolio). The balance available for withdrawal is based on the accounting records maintained by LAIF, which are recorded on an amortized cost basis.
The total amount invested by all public agencies in LAIF as of June 30, 2009 was $25.2 billion. LAIF is part of the California Pooled Money Investment Account (PMIA), which at June 30, 2009 had a balance of $50.7 billion, of that amount, 14.71% was invested in medium-term and short-term structured notes and asset-backed securities. The average maturity of PMIA investments was 235 days as of June 30, 2009.
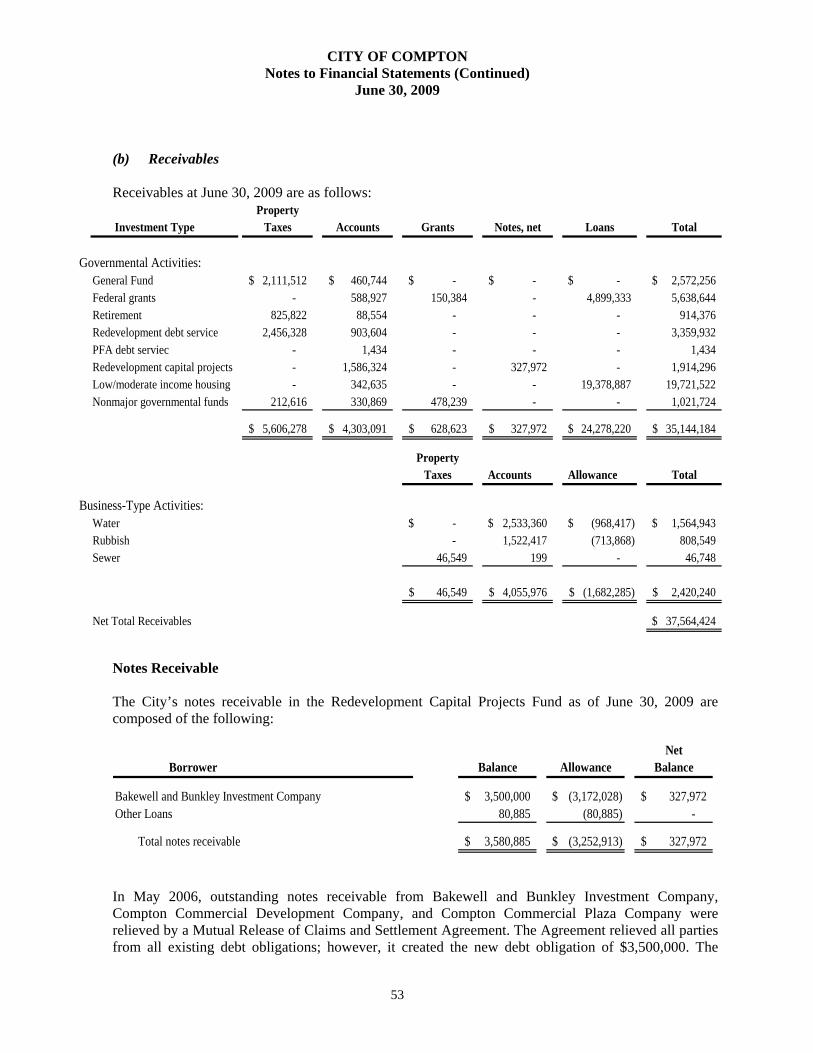
CITY OF COMPTON Notes to Financial Statements (Continued)
June 30, 2009
53
(b) Receivables
Receivables at June 30, 2009 are as follows:
PropertyInvestment Type Taxes Accounts Grants Notes, net Loans Total
Governmental Activities:General Fund 2,111,512$ 460,744$ -$ -$ -$ 2,572,256$ Federal grants - 588,927 150,384 - 4,899,333 5,638,644 Retirement 825,822 88,554 - - - 914,376 Redevelopment debt service 2,456,328 903,604 - - - 3,359,932 PFA debt serviec - 1,434 - - - 1,434 Redevelopment capital projects - 1,586,324 - 327,972 - 1,914,296 Low/moderate income housing - 342,635 - - 19,378,887 19,721,522 Nonmajor governmental funds 212,616 330,869 478,239 - - 1,021,724
5,606,278$ 4,303,091$ 628,623$ 327,972$ 24,278,220$ 35,144,184$
PropertyTaxes Accounts Allowance Total
Business-Type Activities:Water -$ 2,533,360$ (968,417)$ 1,564,943$ Rubbish - 1,522,417 (713,868) 808,549 Sewer 46,549 199 - 46,748
46,549$ 4,055,976$ (1,682,285)$ 2,420,240$
Net Total Receivables 37,564,424$
Notes Receivable
The City’s notes receivable in the Redevelopment Capital Projects Fund as of June 30, 2009 are composed of the following:
Net
Borrower Balance Allowance Balance
Bakewell and Bunkley Investment Company 3,500,000$ (3,172,028)$ 327,972$ Other Loans 80,885 (80,885) -
Total notes receivable 3,580,885$ (3,252,913)$ 327,972$
In May 2006, outstanding notes receivable from Bakewell and Bunkley Investment Company, Compton Commercial Development Company, and Compton Commercial Plaza Company were relieved by a Mutual Release of Claims and Settlement Agreement. The Agreement relieved all parties from all existing debt obligations; however, it created the new debt obligation of $3,500,000. The

CITY OF COMPTON Notes to Financial Statements (Continued)
June 30, 2009
54
Agency expected to receive only the difference between the new and old loans. Therefore, the difference was transferred into an allowance for doubtful accounts. Loans Receivable Community Redevelopment Agency’s First Time Home Buyers Assistance, Residential Rehabilitation Assistance, and Loans to qualified Community Housing Development Organization (CHDO):
The City's Community Redevelopment Agency (CRA) provides assistance to residents and home owners of the community. This assistance is in the form of first time home buyers assistance and residential rehabilitation assistance programs. In addition, CRA also provides assistance to qualified Community Housing Development Organization (CHDO) for low and moderate housing developments. This assistance is funded through Low /Moderate Income Housing and Federal Grants - Home Investment Partnerships Program (HOME) funds. First Time Home Buyers Assistance Program: The First Time Home Buyers program consists of a second mortgage or mortgage subsidy, which reduces the price of a home to an affordable level, thus enabling a first time home buyer to qualify for the purchase of a home. The second mortgage is in the form of a silent second trust deed loan. The maximum loan amount is $100,000 for moderate income borrowers and $150,000 for low income borrowers. The loan is interest-free and does not require monthly repayment. After five years, the loan is reduced 10% annually. Ultimately, if the borrower lives in the property for 15 years consecutively, the loan is forgiven and treated as a grant to the borrower. Both the property and the applicant must meet certain criteria in order to be eligible to participate in the program. The total amount of the first time home buyers’ assistance granted during the year was $5,875,511, the amount collected as loan repayment was $362,340 and the amount treated as grant (written-off) was $171,634. The loans receivable balance as of the year end was $22,305,192.
Loans to Community Housing Development Organization (CHDO): Also, the City provided funds to the Community Housing Development Organization (CHDO) to boost construction of new homes in the City. At June 30, 2009, the loans receivable balance was $1,589,403 for the Federal Grants fund. Residential Rehabilitation Assistance Program: This program comprises the Fit-it Repair Grant, Emergency Assistance Grant and Deferred Equity Loan. The Fix-it grant provides up to $7,000 to assist low to moderate income, owner occupied households with minor repairs in their homes. No repayment or lien is required for this program as it is strictly a grant. The Emergency Assistance Grant is designed to assist low income, owner occupied households of single family homes within the City limits with extreme emergency repairs subject to a maximum of $10,000. The beneficiary is required to repay the grant to the City only upon the sale, refinance, transfer, and foreclosure of the property or the death or relocation of the home owner from the property. The Deferred Equity Loan is provided to low / moderate-income home owners who meet the eligibility criteria subject to a maximum of $25,000. The beneficiary is required to repay the loan only upon the sale, refinance, transfer or foreclosure of the property within 10 years of the loan. After

CITY OF COMPTON Notes to Financial Statements (Continued)
June 30, 2009
55
10 years, the loan is forgiven and treated as a grant. The total amount of the residential rehabilitation assistance granted during the year was $735,167. This amount has been reported as an expenditure in the financial statements as it is improbable that any of the grants or the deferred equity loans will become receivable. Planning Department’s Commercial Revolving Loan The City’s Planning Department provided commercial revolving loans to companies to finance their operations and enhance their capability to contribute to the economic development of the City. The loans were funded through the US Department of Commerce, Economic Development Administration. At June 30, 2009, the total loans receivable was $383,625.
(c) Capital Assets
A summary of changes in capital assets for the year ended June 30, 2009 is as follows:
Governmental Activities:
Governmental Activities:Balance BalanceJuly 1, June 30,2008 Addition Transfer 2009
Capital Assets, Not Being Depreciated: Land 23,525,645$ -$ -$ 23,525,645$ Construction in progress 7,241,416 4,961,062 (2,268,173) 9,934,305 Total Capital Assets, not Being Depreciated 30,767,061 4,961,062 (2,268,173) 33,459,950
Capital Assets, Being Depreciated: Building and structures 36,049,346 - - 36,049,346 Land improvements 6,625,204 - 293,411 6,918,615 Equipment 41,664,973 673,484 1,579,000 43,917,457 Infrastructure 159,385,088 - 395,762 159,780,850 Total Capital Assets, Being Depreciated 243,724,611 673,484 2,268,173 246,666,268
Less Accumulated Depreciation for: Building and structures (15,030,936) (874,377) - (15,905,313) Land improvements (5,814,647) (331,558) - (6,146,205) Equipment (39,601,698) (1,211,882) - (40,813,580) Infrastructure (79,457,881) (5,225,748) - (84,683,629)
Total Accumulated Depreciation (139,905,162) (7,643,565) - (147,548,727)
Total Capital Assets, Being Depreciated, Net 103,819,449 (6,970,081) 2,268,173 99,117,541
Governmental Activities Capital Assets, Net 134,586,510$ (2,009,019)$ -$ 132,577,491$

CITY OF COMPTON Notes to Financial Statements (Continued)
June 30, 2009
56
Depreciation expense was charged to functions/programs of the primary government as follows:
General government 2,037,520$ Public safety 579,324 Public works 5,026,721
Total Depreciation 7,643,565$
Business-type Activities: Balance BalanceJuly 1, June 30,2008 Addition 2009
Capital Assets, Not Being Depreciated: Land 162,097$ -$ 162,097$ Construction in progress 343,810 69,780 413,590
505,907 69,780 575,687
Capital Assets, Being Depreciated:
Building and structures 1,254,963 - 1,254,963 Land improvements 157,044 - 157,044 Equipment 20,368,717 236,036 20,604,753 Infrastructure 441,011 - 441,011 Total Capital Assets, Being Depreciated 22,221,735 236,036 22,457,771
Less Accumulated Depreciation for: Building and structures (888,420) (31,374) (919,794) Land improvements (145,845) (800) (146,645) Equipment (16,269,646) (1,295,729) (17,565,375) Infrastructure (19,480) (17,640) (37,120)
Total Accumulated Depreciation (17,323,391) (1,345,543) (18,668,934)
Total Capital Assets, Being Depreciated, Net 4,898,344 (1,109,507) 3,788,837
Business-type Activities Capital Assets, Net 5,404,251$ (1,039,727)$ 4,364,524$

CITY OF COMPTON Notes to Financial Statements (Continued)
June 30, 2009
57
Depreciation expense was charged to Business-type Activities as follows:
Water $ 76,188Rubbish 503,061Sewer 766,294
Total Depreciation $ 1,345,543
(d) Interfund Transactions
The following table summarizes interfund receivables and payables at June 30, 2009:
Due From Due To Other Funds Other Funds
Governmental Funds :General Fund 25,722,431$ 26,777,522$ Federal Grants Special Revenue Fund 738,797 1,305,955 Retirement Fund 9,218,088 - Redevelopment Debt Service Fund - 17,592,155 Public Finance Authority Debt Service Fund 449,984 - Redevelopment Capital Projects Fund 27,779,504 6,556,101 Low/Moderate Income Housing Capital Projects Fund 8,801 977,253 Nonmajor Governmental Funds 3,866,100 5,920,116
67,783,705 59,129,102 Internal Service Funds 1,127,406 20,847,779
68,911,111 79,976,881 Enterprise Funds :Water 5,128,254 651 Rubbish 766,311 - Sewer 4,706,851 - Nonmajor Enterprise Funds 103,281 74,444 Agency Funds 436,168 -
80,051,976$ 80,051,976$
These interfund balances result from the time lag between the dates that 1) interfund goods and services are provided or reimbursable expenditures occur, 2) interfund loans, and 3) payments between funds are made.

CITY OF COMPTON Notes to Financial Statements (Continued)
June 30, 2009
58
Transfers Transfers In
Public Finance General Federal Authority Redevelopment Low/Moderate Nonmajor Internal
Transfers Out Fund Grants Debt Service Capital Projects Income Housing Funds Service TotalGovernmental activities: General Fund -$ 1,157,451$ 273,024$ -$ -$ 951,026$ 1,726,312$ 4,107,813$
Federal Grants 1,929,976 - - - - - - 1,929,976
Public Finance Authorty Debt Service - - - - - 94,982 - 94,982
Redevelopment Capital Projects - - - 1,210,000 3,835,696 - - 5,045,696
Redevelopment Debt Service - - - 19,000,000 - - - 19,000,000
Nonmajor Funds 1,184,745 - - - - 377,536 200,001 1,762,282
Business-Type activities: Water Fund - - - - - 433,316 - 433,316
3,114,721$ 1,157,451$ 273,024$ 20,210,000$ 3,835,696$ 1,856,860$ 1,926,313$ 32,374,065$
Interfund transfers were primarily used to fund capital improvements, and debt service payments.
CITY OF COMPTON Notes to Financial Statements (Continued)
June 30, 2009
59
(e) Long-term Debt 1. Indebtedness As of June 30, 2009, the City’s long-term indebtedness consisted of the following:
Date of Date of Interest Amount of OutstandingGovernmental Activities Issue Maturity Rate Issue June 30, 2009
Debt long-term Liabilities: Bonds Payable: 1995 Series "C" refunding tax allocation bonds - taxable (The balance of $27,565,146 includes $19,659,773 of accreted value) 7/1/1995 8/1/2024 7.94% 10,137,530$ 29,797,303$
2006 Series "A" refunding tax allocation capital appreciation bonds - tax exempt 7/6/2006 8/1/2013 5.00% 51,215,000 38,540,000
2008 Series Compton Public Finance Authority refunding and various capital projects bonds 5/1/2008 9/1/2032 4.00%-5.25% 46,860,000 45,730,000
114,067,303 Less : Deferral on refunding 2006 Series A refunding tax allocation bonds (1,305,332) 2008 Series Compton Public Finance Authority (447,939) Less : Discount on Issue of 2008 Series Compton PFA refunding and various capital projects bonds (161,084) Add: Bond Premium on issue of 2006 Series "A" refunding tax allocation capital appreciation bonds - tax exempt 1,112,929
Total bonds payable 113,265,877 Mortgage Loan Payable: Energy Retrofit / Revenue Enhancement 7/31/2006 7/31/2022 4.52% 4,012,184 3,314,052
Notes Payable: Housing Section 108 Notes 8/9/2001 8/1/2020 6.00% 5,000,000 4,500,000 Energy Conservation Assistance Loan 10/21/2004 6/22/2012 3.95% 635,087 299,834 Total notes payable 4,799,834
Tax Sharing obligations 1,676,476
Capital lease obligations Tree Trimming and Other Equipment 591,256
Compensated absences 8,827,725
Total Governmental Activities - Long-term Liabilities 132,475,220$
CITY OF COMPTON Notes to Financial Statements (Continued)
June 30, 2009
60
Date of Date of Interest Amount of OutstandingBusiness-Type Activities Issue Maturity Rate Issue June 30, 2009
Debt Long-Term Liabilities: Bonds payable: 1998 Sewer Revenue Refunding Bonds 6/1/1998 9/1/2023 4.200 - 5.375% 8,310,000$ 6,205,000$
2000 Solid Waste Revenue Bonds 6/29/2000 8/1/2020 4.800% 6,000,000 1,820,000
Water Revenue Bonds, Series 2009 5/20/2009 8/1/2039 5.625 - 6.000% 44,040,000 44,040,000
Sewer Revenue Bonds, Series 2009 5/20/2009 9/1/2039 5.625 - 6.000% 18,710,000 18,710,000
70,775,000
Less: Discount on issue Water Revenue Bonds, Series 2009 (1,038,821) Sewer Revenue Bonds, Series 2009 (442,371)
Total Bonds Payable 69,293,808
Notes payable: Water Utility Note 12/15/1994 6/13/2013 8.10% 818,071 223,677
Capital Lease obligations 114,300
Compensated absences 807,144
Total Business-type Activities - Long-term Liabilities 70,438,929$
Long-Term Debt – Governmental Activities: Compton Public Finance Authority Lease Revenue Bonds (Refunding and Various Projects) Series 2008 On May 1, 2008, the City issued $46,860,000 of Lease Revenue Bonds with an interest rate of 4.0% - 5.25% to advance refund $14,700,000 outstanding 1997 “A” Certificates of Participation with an interest rate of 7.5% and to finance various capital projects amounting to $29,201,947. The City defeased the old bonds by placing a portion of the proceeds of the new bonds in an irrevocable trust to provide for all future debt service payments on the old bonds. Accordingly, the trust account assets and liability for the defeased bonds are not included in the City’s financial statements. On June 30, 2009, $13 million of the bonds outstanding are considered defeased. The 2008 Lease Revenue Bonds are secured by the Public Finance Authority’s (Authority) pledge of certain base rental payments made by the City to the Authority pursuant to a facility lease, dated May 1, 2008 between the Authority and the City. Total principal and interest remaining on the bonds is $84,647,751, payable through September 2032. Principal and interest paid for the current year which also represents the rental payments made by the City to the Authority was $3,078,306.

CITY OF COMPTON Notes to Financial Statements (Continued)
June 30, 2009
61
Compton Redevelopment Project Refunding Tax Allocation Bonds, Series 2006A On July 6, 2006, the City issued $51.2 million in Tax Allocation Bonds to advance refund $32 million of outstanding 1995A Series Bonds, $14.7 million of 1995B Series Bonds and $19.3 million of outstanding 1995-1 Series bonds. In prior years, the City defeased certain bonds by placing the proceeds of new bonds in an irrevocable trust to provide for all future debt service payments on the old bonds. Accordingly, the trust account assets and liability for the defeased bonds are not included in the City’s financial statements. On June 30, 2009, $49 million of the bonds outstanding are considered defeased. The Series 2006 A Tax Allocation Bonds are special obligations of the Community Redevelopment Agency, which are secured by an irrevocable pledge of the tax revenues payable to the Agency. Total principal and interest remaining on the bonds is $44,518,750, payable through August 2013. For the current year, principal and interest paid and total incremental property tax revenues, were $8,676,625 and $27,564,991, respectively. 1995 Series “C” Refunding Tax Allocation Capital Appreciation Bonds The 1995 Series “C” Refunding Tax Allocation Capital Appreciation bonds were issued in 1995 but repayment of the liability will commence in 2014 and end in 2024. During the grace period before the bonds payments commence, the interest on the bonds is added as an accretion to the bond balance. The amount of the bonds is $10,137,530 while total accretion as of June 30, 2009 is $19,659,773. The 1995 Series “C” Refunding Tax Allocation Capital Appreciation bonds are special obligations of the Agency, which are secured by an irrevocable pledge of the tax revenues payable to the Agency. Total principal and interest remaining on the bonds is $63,800,011, payable through August 2024. There were no principal and interest payments made during the year. For the current year, the total incremental property tax revenues were $27,564,991. Energy Retrofit / Revenue Enhancement Mortgage Loan On July 31, 2006, the City entered into a mortgage loan agreement of $4,012,184 with Citi Mortgage Inc. to finance the development and installation of Citywide Energy Retrofit / Revenue Enhancement program. The mortgage has an interest rate of 4.52%. The proceeds of the mortgage arrangement was invested in a money market and deposited in an irrevocable trust with an escrow agent to provide for the payment of the vendor of the energy retrofit / revenue enhancement program. As of year end, full payment has been made to the vendor. The total principal and interest remaining on the mortgage loan is $4,543,887, payable through July 2022. Principal and interest paid during the year was $389,151. Housing Section 108 Note Housing Section 108 note in the amount of $5,000,000 is a note payable to HUD, which was issued in August 2001. Section 108 is the loan guarantee provision of the Community Development Block Grant (CDBG) program. Section 108 provides the City with a source of financing for economic development, housing rehabilitation, public facilities, and large-scale physical development projects. This note payable is guaranteed by the City’s current and future CDBG allocations.

CITY OF COMPTON Notes to Financial Statements (Continued)
June 30, 2009
62
The total principal and interest remaining on the note is $6,522,705, payable through August 2020. Principal and interest paid during the year was $488,020. Energy Conservation Assistance Loan In October 2004, the City obtained $635,087 of Energy Conservation Assistance Loan from the California Energy Commission to finance energy efficient improvements for the City’s streetlights and traffic signals. The City utilized the loan to change the traffic signal lighting to the light-emitting diode (LED) type which, consume less electricity than the incandescent bulbs. The interest rate on the loan is 3.95%. The total principal and interest remaining on the loan is $320,912, payable through June 2012. Principal and interest paid during the year was $106,971. The annual requirements to amortize all bonds outstanding, including mortgage note payable, other notes payable, and interest payments are as follows:
Year Ending Bonds PayableJune 30 Principal Interest
2010 6,935,000$ 4,246,888$ 2011 7,305,000 3,900,138 2012 7,690,000 3,534,888 2013 8,090,000 3,150,388 2014 9,839,895 7,173,002
2015-2019 12,271,375 28,725,557 2020-2024 14,491,260 20,750,909 2025-2029 14,055,000 5,682,689 2030-2033 13,730,000 1,734,750
Total Debt Service 94,407,530 78,899,209$ Cumulative Accretion 19,659,773 Total Principal, June 30, 2009 114,067,303$

CITY OF COMPTON Notes to Financial Statements (Continued)
June 30, 2009
63
Year EndingJune 30 Principal Interest
2010 115,122$ 147,873$ 2011 131,737 142,394 2012 149,587 136,143 2013 168,749 129,064 2014 189,303 121,095
2015-2019 1,309,774 450,097 2020-2023 1,249,780 103,169
3,314,052$ 1,229,835$
Notes PayableYear Ending Housing Section 108 Notes Energy Conservation Asst. Loan
June 30 Principal Interest Interest2010 200,000$ 276,820$ 96,064$ 10,907$ 2011 200,000 265,400 99,896 7,075 2012 300,000 250,950 103,874 3,096 2013 300,000 233,250 - - 2014 300,000 215,130 - -
2015-2019 2,200,000 715,105 - - 2020-2021 1,000,000 66,050 - -
4,500,000$ 2,022,705$ 299,834$ 21,078$
Mortgage Loan Payable
Principal
The City has entered into lease agreements for tree trimming truck, film processor/ speedsetter equipment, and printing press machine. The future minimum lease obligations are:
Year Ending Capital Lease Payable
June 30 Principal Interest2010 168,757$ 18,411$ 2011 112,727 25,841 2012 119,547 19,141 2013 105,120 12,026 2014 85,105 5,634
591,256$ 81,053$
Property Tax Sharing Obligation The Community Redevelopment Agency of the City received revenues from property taxes collected on its behalf by Los Angeles County. A portion of the property tax revenue is to be deposited in a trust fund to be established by and administered for the Compton Unified School District unless the amount is spent on a mutually beneficial and agreed project between Community Redevelopment Agency of the City and the Compton Unified School District. As of the year end the amount of the property tax share which has not been

CITY OF COMPTON Notes to Financial Statements (Continued)
June 30, 2009
64
spent on a mutually agreed project and which may be payable to Compton Unified School District was $1,676,476. The Community Redevelopment Agency of the City has an agreement with the Los Angeles County regarding the County’s share of property taxes relating to a portion of the Agency’s redevelopment areas. The agreement indicated that this tax share (amounting to $20.6 million as of the year-end) shall be utilized and will not be payable to the County if the Agency executes mutually agreed projects. The agreement also indicated that the amount shall be deferred and shall be subordinated to the indebtedness of the Agency. The amount has not been included as indebtedness in these financial statements. Long-Term Debt - Enterprise Funds Bond Indebtedness: Water Revenue Bonds, Series 2009
On May 20, 2009, the City issued $44,040,000 of Water Revenue Bonds with an interest rate of 5.625% - 6.00% to finance part of the cost of overhauling the City’s Water System. The net proceeds of $42,336,583 (after deduction of $1,038,821 relating to discount on the bond issue, and payment of $664,596 in underwriting fees, insurance, and other issuance costs) was deposited with an escrow agent as follows: $34,876,156 to finance the Water System project, $3,339,000 to Reserve account, $4,100,623 to Interest account, and $20,804 represents the unspent allocation for cost of issue. The 2009 Water Revenue Bonds are secured by the net revenues of the City’s Water operations. Total principal and interest remaining on the bond is $96,620,148. There were no principal and interest payments made during the year. For the current year, the net revenues of the Water operations of the City were $9,351,129. The annual requirements to amortize all bonds outstanding, including interest payments, are listed below.
Year Ending June 30 Principal Interest
2010 -$ 1,627,886$ 2011 - 2,472,737 2012 - 2,472,737 2013 - 2,472,737 2014 765,000 2,461,263
2015-2019 4,315,000 11,846,869 2020-2024 5,515,000 10,716,828 2025-2029 7,295,000 8,944,491 2030-2034 9,785,000 6,447,750 2035-2039 13,215,000 3,022,350
2040 3,150,000 94,500
44,040,000$ 52,580,148$

CITY OF COMPTON Notes to Financial Statements (Continued)
June 30, 2009
65
Sewer Revenue Bonds, Series 2009 On May 20, 2009, the City issued $18,710,000 of Sewer Revenue Bonds with an interest rate of 5.625% - 6.00% to finance part of the cost of overhauling the antiquated Sewer System of the City. The net proceeds of $17,908,134 (after deduction of $442,371 relating to discount on the bond issue, and payment of $359,495 in underwriting fees, insurance, and other issuance costs) was deposited with an escrow agent as follows: $14,646,416 to finance the Sewer System project, $1,415,700 to Reserve account, $1,828,413 to Interest account, and $17,605 represents the unspent allocation for cost of issue. The 2009 Sewer Revenue Bonds are secured by all of the sewer service charges imposed by the City upon its property owners for the use of the sewer system excluding operation and maintenance expenses payable from the sewer service charges. Total principal and interest remaining on the bond is $41,095,921. There were no principal and interest payments made during the year. For the current year, the total of the sewer service charges (reported as taxes and special assessments) was $949,914. The annual requirements to amortize all bonds outstanding, including interest payments, are listed below.
Year Ending June 30 Principal Interest
2010 -$ 778,606$ 2011 - 1,049,806 2012 - 1,049,806 2013 - 1,049,806 2014 335,000 1,044,781
2015-2019 1,865,000 5,026,538 2020-2024 2,335,000 4,542,047 2025-2029 3,090,000 3,791,081 2030-2034 4,150,000 2,732,400 2035-2039 5,600,000 1,281,000
2040 1,335,000 40,050
18,710,000$ 22,385,921$
Sewer Refunding Bonds: In June 1998, the City issued $8.3 million in Sewer Revenue Refunding Bonds with an average interest rate of 5.2% to advance refund $7.285 million of outstanding Series 1993 Sewer Revenue Bonds. The old bonds were defeased by placing proceeds of the new bonds in an irrevocable trust to provide for all future debt service payments on the old bonds. Accordingly, the trust accounts assets and liabilities for the defeased bonds are not included in the City’s financial statements. On June 30, 2009 $2.0 million of the bonds outstanding are considered defeased. The Sewer Refunding bonds are secured by the City’s pledge of certain revenues, which consist of sewer service charge imposed by the City upon its property owners for the use of the sewer system for each year minus certain operation and maintenance expenses incurred by the City in connection with the operation of the sewer system. The total principal and interest remaining to be paid on the bonds is $9,013,885. Principal

CITY OF COMPTON Notes to Financial Statements (Continued)
June 30, 2009
66
and interest paid for the current year and total taxes and special assessments revenues were $606,356 and $949,914, respectively. Interest on the bonds is payable semiannually on March 1 and September 1. Principal maturity occurs on September 1 of each year starting in 1999 through 2023. As of June 30, 2009, the outstanding bond balance is $6,205,000. The annual requirements to amortize all bonds outstanding, including interest payments, are listed below.
Year EndingJune 30 Principal Interest
2010 285,000$ 322,303$ 2011 295,000 307,441 2012 310,000 291,938 2013 330,000 275,537 2014 345,000 258,241
2015-2019 2,020,000 986,581 2020-2024 2,620,000 366,844
Total 6,205,000$ 2,808,885$
Solid Waste Management Facilities Bonds:
In March 2006, the City converted $3,775,000 in Solid Waste Management Facilities Variable Rate Revenue Bonds, Series 2000, from a variable rate (the Bonds) to a fixed rate (the Convertible Bonds) maturing in August 2020. The Bonds were issued in June 2000 to finance the acquisition of land, vehicles, and other equipment for the City’s Solid Waste Management Program. The Convertible Bonds bear a fixed rate of 4.8%. The Bonds are secured by a pledge of the net revenues received by the City for the Solid Waste Management Program. Total total principal and interest remaining to be paid on the bonds is $2,207,120. Principal and interest paid for the current year and total customer net revenues were $783,680 and $10,248,835, respectively. Interest on the bonds is payable on February 1st and August 1st of each year until maturity, redemption, or purchase thereof. As of June 30, 2009 the outstanding bond balance is $1,820,000. The annual requirements to amortize all bonds outstanding, including interest payments, are as follows:

CITY OF COMPTON Notes to Financial Statements (Continued)
June 30, 2009
67
Year EndingJune 30 Principal Interest
2010 715,000$ 70,200$ 2011 80,000 51,1202012 80,000 47,2802013 85,000 43,3202014 90,000 39,120
2015-2019 525,000 124,2002020-2021 245,000 11,880
Total 1,820,000$ 387,120$
Notes Payable – Water Utility:
The City’s Water Utility Enterprise Fund borrowed $818,071 for utility improvements under provisions of the State of California Safe Drinking Water contract. As of June 30, 2009, the outstanding note payable balance is $223,677. Payments on the note are due semiannually. The term of the note is for 19.5 years at an interest rate of 8.10%. The total annual payments required to amortize the note as of June 30, 2009, including interest payments, are as follows:
Year EndingJune 30 Principal Interest
2010 65,804$ 17,418$ 2011 70,763 12,459 2012 76,097 7,125 2013 11,013 2,563
Total 223,677$ 39,565$
The City had lease agreements for financing heavy equipment. The future minimum lease obligations are as follows:
Year EndingJune 30 Principal Interest
2010 36,044$ 6,401$ 2011 38,062 4,382 2012 40,194 2,251
Total 114,300$ 13,034$

CITY OF COMPTON Notes to Financial Statements (Continued)
June 30, 2009
68
Changes in Long-term Debt:
The following is a summary of long-term debt transactions for the year ended June 30, 2009:
Balance Balance Amount dueJuly 1, June 30, Within One
Governmental Activities 2008 Additions Retirements 2009 Year
Debt Long-Term Liabilities: Bonds Payable: 1995 Series "C" refunding tax allocation bonds - taxable (The total balance of $29,797,303 includes $19,659,773 of accreted value) 10,137,530$ - - 10,137,530$ -$ Add: Interest accretion 17,427,616 2,232,157 - 19,659,773 -
2006 Series "A" refunding tax allocation capital appreciation bonds - tax exempt 45,125,000 - (6,585,000) 38,540,000 6,935,000 Less: Deferred on refunding (1,631,665) - 326,333 (1,305,332) - Add: Bond premium 1,391,162 - (278,233) 1,112,929 -
2008 Series Compton Public Finance Authority refunding and various capital projects 46,860,000 - (1,130,000) 45,730,000 - Less: Discount on issue (167,796) - 6,712 (161,084) - Less: Deferred on refunding of 1997 "A" Certificates of participation (466,603) - 18,664 (447,939) -
118,675,244 2,232,157 (7,641,524) 113,265,877 6,935,000 Mortgage Loan Payable: Energy Retrofit / Revenue Enhancement 3,549,039 - (234,987) 3,314,052 115,122
Capital lease obligations: Tree Trimming and Other Equipment 244,876 515,104 (168,724) 591,256 168,757
Notes Payable: Housing Section 108 note 4,700,000 - (200,000) 4,500,000 200,000 Energy Conservation Assistance Loan 392,213 - (92,379) 299,834 96,064 Total notes payable 5,092,213 - (292,379) 4,799,834 296,064
Tax Sharing obligations Tax share indebtedness - 1,676,476 - 1,676,476 -
- 1,676,476 - 1,676,476 - Other Long-term liabilities: Compensated absences 8,009,977 2,755,055 (1,937,307) 8,827,725 1,937,307
Total Governmental Activities Long-term Liabilities 135,571,349$ 7,178,792$ (10,274,921)$ 132,475,220$ 9,452,250$
The City's General Fund has typically been used to liquidate the City's compensated absences liabilities.
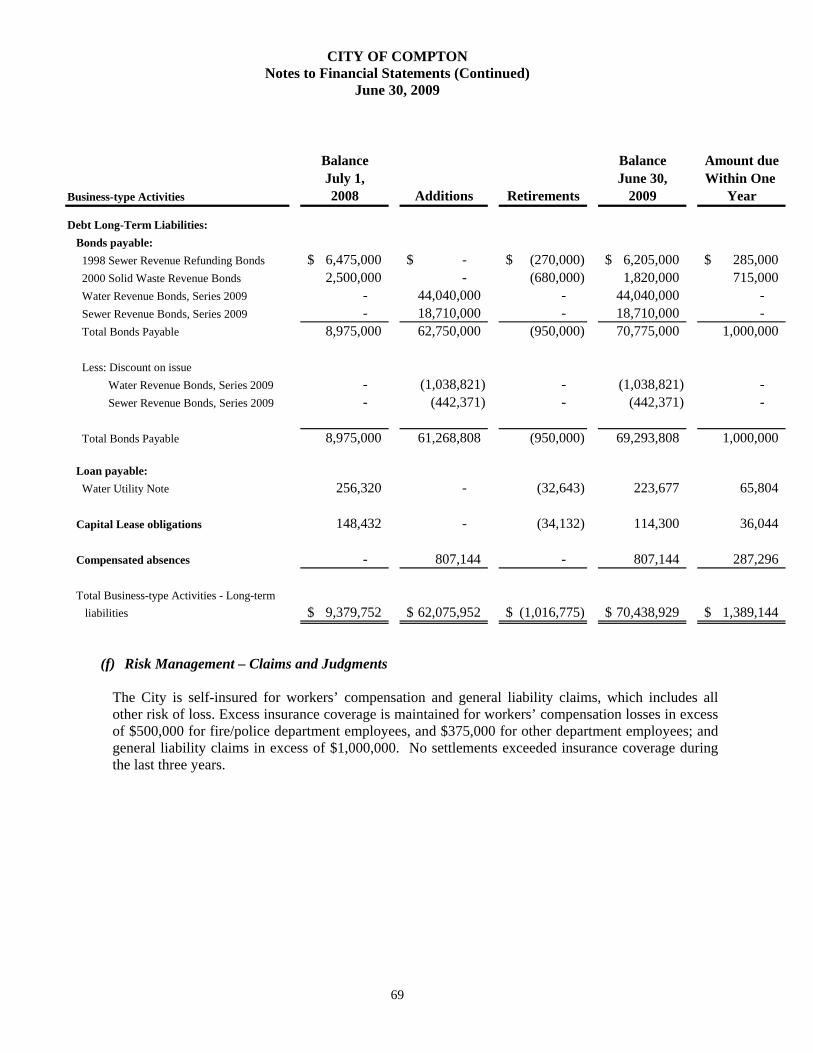
CITY OF COMPTON Notes to Financial Statements (Continued)
June 30, 2009
69
Balance Balance Amount dueJuly 1, June 30, Within One
Business-type Activities 2008 Additions Retirements 2009 Year
Debt Long-Term Liabilities: Bonds payable: 1998 Sewer Revenue Refunding Bonds 6,475,000$ -$ (270,000)$ 6,205,000$ 285,000$ 2000 Solid Waste Revenue Bonds 2,500,000 - (680,000) 1,820,000 715,000 Water Revenue Bonds, Series 2009 - 44,040,000 - 44,040,000 - Sewer Revenue Bonds, Series 2009 - 18,710,000 - 18,710,000 - Total Bonds Payable 8,975,000 62,750,000 (950,000) 70,775,000 1,000,000
Less: Discount on issue Water Revenue Bonds, Series 2009 - (1,038,821) - (1,038,821) - Sewer Revenue Bonds, Series 2009 - (442,371) - (442,371) -
Total Bonds Payable 8,975,000 61,268,808 (950,000) 69,293,808 1,000,000
Loan payable: Water Utility Note 256,320 - (32,643) 223,677 65,804
Capital Lease obligations 148,432 - (34,132) 114,300 36,044
Compensated absences - 807,144 - 807,144 287,296
Total Business-type Activities - Long-term liabilities 9,379,752$ 62,075,952$ (1,016,775)$ 70,438,929$ 1,389,144$
(f) Risk Management – Claims and Judgments
The City is self-insured for workers’ compensation and general liability claims, which includes all other risk of loss. Excess insurance coverage is maintained for workers’ compensation losses in excess of $500,000 for fire/police department employees, and $375,000 for other department employees; and general liability claims in excess of $1,000,000. No settlements exceeded insurance coverage during the last three years.

CITY OF COMPTON Notes to Financial Statements (Continued)
June 30, 2009
70
The City records an estimated liability at the time of an incident based on the internal estimates performed by the City Attorney’s Office of probable loss. A summary of the City’s estimated liability calculation at June 30, 2009 is as follows:
Workers General Compensation Liability Total
Claims liabilities, July 1, 2007 $ 3,219,733 $ 6,793,389 $ 10,013,122
Adjustment-additional liability/ (write-off) 711,029 (3,121,682) (2,410,653)
Incurred claims, representing the total of a provision for events of the current fiscal year and any change in the provision for events of prior fiscal years 1,810,808 - 1,810,808
Payments on claims attributable to events of both the current fiscal year and prior fiscal years (1,954,380) (1,783,957) (3,738,337)
Claims liabilities, June 30, 2008 3,787,190 1,887,750 5,674,940
Incurred claims representing the toal of a provision for events of the current fiscal year and any changes in the provision for events of prior fiscal year 1,620,734 295,641 1,916,375
Payments on claims attibutable to events of both the current fiscal year and prior fiscal year (1,652,913) (792,474) (2,445,387)
Claims liabilities, June 30, 2009 $ 3,755,011 $ 1,390,917 $ 5,145,928
(5) Other Information
(a) Pension Plan Description
The City maintains three separate defined benefit pension plans for miscellaneous, safety-fire, and safety-police employees, which provides retirement and disability benefits, annual cost-of-living adjustments, and death benefits to plan members and beneficiaries. The plan for miscellaneous employees is an agent multi-employer public employee defined benefit plan, while the plan for safety-fire and safety-police employees is a cost-sharing multi-employer public employee defined benefit plan. The Plans are part of the Public Agency portion of the California Public Employees Retirement System (CalPERS), which acts as a common investment and administrative agent for the participating public employers within the State of California. A menu of benefit provisions as well as other requirements is established by State statutes within the Public Employees’ Retirement law. The City selects optional benefit provisions from the benefit menu by contract with CalPERS and adopts those benefits through local ordinance. CalPERS issues a separate comprehensive annual financial report.

CITY OF COMPTON Notes to Financial Statements (Continued)
June 30, 2009
71
Copies of the CalPERS' annual financial report may be obtained from the CalPERS Executive Office, 400 P Street, Sacramento, California 95814. Funding Policy:
Active plan members are required to contribute 8% for miscellaneous employees and 9% for safety-fire employees for their annual covered salary. There is no active plan member for safety-police plan. The City is required to contribute the actuarially determined remaining amounts necessary to fund the benefits for its members. The required contribution rate for fiscal year 2009 was 19.116% for miscellaneous employees and 47.024% for firefighters of annual covered payroll. The fiscal year annual required contribution was based on an actuarial valuation performed as of June 30, 2006. The contribution requirements of the Plan members are established by State statutes and the employer contribution rate is established and may be amended by CalPERS.
Plan Funding Status:
The funded status of the miscellaneous plan based on the June 30, 2008 actuarial valuation is as follows:
Actuarial Accrued Liability
Actuarial Value of Assets
Unfunded Actuarial Accrued Liability (UAAL)
Funded Ratio
Annual Covered Payroll
UAAL as a % of
Covered Payroll
$136,746,394 $115,068,267 $21,678,267 84% $15,453,499 140%
The Schedule of Funding Progress presented as Required Supplementary Information following the Notes to the Financial Statements, presents multiyear trend information about whether the actuarial value of the plan assets is increasing or decreasing over time relative to the actuarial accrued liability for benefits.

CITY OF COMPTON Notes to Financial Statements (Continued)
June 30, 2009
72
For fiscal year 2008-2009, the City’s annual pension costs of $3,370,048 for miscellaneous, $2,452,688 for safety-police, and $2,912,263 for safety-fire for PERS was equal to the City’s required and actual contributions. The summary of principal assumptions and methods used to determine the annual required contribution (June 30, 2006 valuation) and the funded status of the plan (June 30, 2008 valuation) is shown as follows for the miscellaneous plan:
Valuation date June 30, 2006 and June 30 2008
Actuarial cost method Entry age actuarial cost method
Amortization method Level percent of payroll
Average remaining period 27 years and 26 years as of the valuation date
Asset valuation method 15 year smoothed market Investment rate of return 7.75% (net of administrative expenses)
Projected salary increases 3.25% to 14.45% depending on age, service and type of employment
Inflation 3.00%
Payroll growth 3.25%
Individual salary growth A merit scale varying by duration of employment coupled with an assumed annual inflation component of 3.00% and an annual production growth of 0.25%

CITY OF COMPTON Notes to Financial Statements (Continued)
June 30, 2009
73
The following is a summary of information for PERS for a three-year period ended each June 30:
Fiscal Year Annual Percentage ofEnded Pension Cost APC Net PensionJune 30 (APC) Contributed Obligation
2009 3,370,048$ 100% -$ 2008 2,895,656 100% - 2007 2,238,055 100% -
Fiscal Year Annual Percentage ofEnded Pension Cost APC Net PensionJune 30 (APC) Contributed Obligation
2009 2,452,688$ 100% -$ 2008 2,474,283 100% - 2007 2,559,900 100% -
Fiscal Year Annual Percentage ofEnded Pension Cost APC Net PensionJune 30 (APC) Contributed Obligation
2009 2,912,263$ 100% -$ 2008 2,740,432 100% - 2007 2,313,273 100% -
Three-Year Trend Information for the Miscellaneous Plan
Three-Year Trend Information for the Safety Police Plan
Three-Year Trend Information for the Safety Fire Plan
Initial unfunded liabilities are amortized over a closed period that depends on the plan’s date of entry into CalPERS. Subsequent plan amendments are amortized as a level percentage of pay over a closed 20-year period. Gain and losses that occur in the operation of the plan are amortized over a 30 year rolling period, which results in an amortization of about 6% of unamortized gain and losses each year. If the plan’s accrued liability exceeds the actuarial value of plan assets, then the amortization payment on the total unfunded liability may not be lower than the payment calculated over 30 year amortization period.
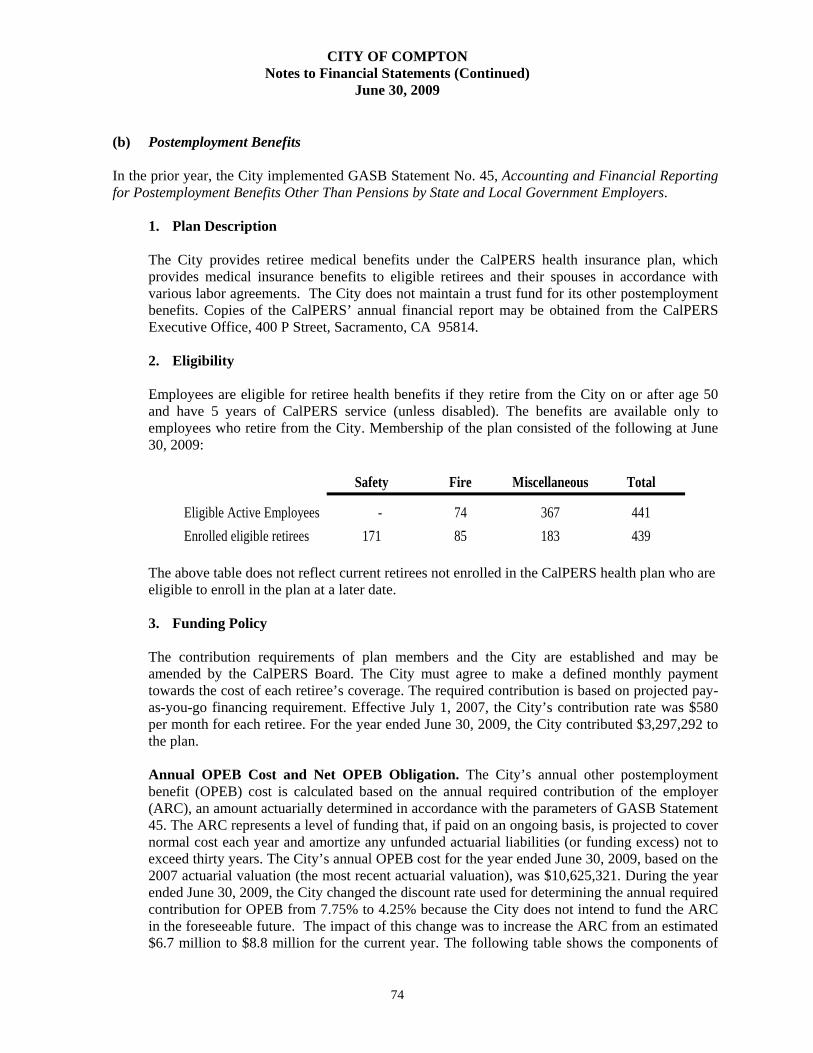
CITY OF COMPTON Notes to Financial Statements (Continued)
June 30, 2009
74
(b) Postemployment Benefits
In the prior year, the City implemented GASB Statement No. 45, Accounting and Financial Reporting for Postemployment Benefits Other Than Pensions by State and Local Government Employers.
1. Plan Description
The City provides retiree medical benefits under the CalPERS health insurance plan, which provides medical insurance benefits to eligible retirees and their spouses in accordance with various labor agreements. The City does not maintain a trust fund for its other postemployment benefits. Copies of the CalPERS’ annual financial report may be obtained from the CalPERS Executive Office, 400 P Street, Sacramento, CA 95814. 2. Eligibility
Employees are eligible for retiree health benefits if they retire from the City on or after age 50 and have 5 years of CalPERS service (unless disabled). The benefits are available only to employees who retire from the City. Membership of the plan consisted of the following at June 30, 2009:
Safety Fire Miscellaneous Total
Eligible Active Employees - 74 367 441 Enrolled eligible retirees 171 85 183 439
The above table does not reflect current retirees not enrolled in the CalPERS health plan who are eligible to enroll in the plan at a later date.
3. Funding Policy The contribution requirements of plan members and the City are established and may be amended by the CalPERS Board. The City must agree to make a defined monthly payment towards the cost of each retiree’s coverage. The required contribution is based on projected pay-as-you-go financing requirement. Effective July 1, 2007, the City’s contribution rate was $580 per month for each retiree. For the year ended June 30, 2009, the City contributed $3,297,292 to the plan. Annual OPEB Cost and Net OPEB Obligation. The City’s annual other postemployment benefit (OPEB) cost is calculated based on the annual required contribution of the employer (ARC), an amount actuarially determined in accordance with the parameters of GASB Statement 45. The ARC represents a level of funding that, if paid on an ongoing basis, is projected to cover normal cost each year and amortize any unfunded actuarial liabilities (or funding excess) not to exceed thirty years. The City’s annual OPEB cost for the year ended June 30, 2009, based on the 2007 actuarial valuation (the most recent actuarial valuation), was $10,625,321. During the year ended June 30, 2009, the City changed the discount rate used for determining the annual required contribution for OPEB from 7.75% to 4.25% because the City does not intend to fund the ARC in the foreseeable future. The impact of this change was to increase the ARC from an estimated $6.7 million to $8.8 million for the current year. The following table shows the components of

CITY OF COMPTON Notes to Financial Statements (Continued)
June 30, 2009
75
the City’s annual OPEB cost for the year, the amount actually contributed to the plan, and changes in the City’s net OPEB obligation:
Annual Required Contribution (ARC) 8,847,539$ Interest on net OPEB obligation 180,995 Adjustment to ARC 1,596,787 Annual pension cost 10,625,321 Contribution made (3,297,292) Increase in net OPEB obligation 7,328,029 Net OPEB obligation - beginning 2,491,708 Net OPEB obligation - ending 9,819,737$
OPEB Cost and Obligation
The City’s annual OPEB cost for the year ended June 30, 2009 was $10,625,321. The City’s annual OPEB cost, the percentage of annual OPEB cost contributed to the plan, and the net OPEB obligation for 2009 and the two preceding years were as follows:
Percentage of
Fiscal Year Annual Annual OPEB Net OPEBEnded OPEB Cost Cost Contributed Obligation
6/30/2009 $10,625,321 31% $9,819,7376/30/2008 $5,668,000 56% $2,491,7086/30/2007 N/A N/A N/A (1)
(1) The City of Compton implemented GASB 45 for the fiscal year ended June 30, 2008. Information prior to FY 2008 is not available. The City’s annual OPEB contribution paid is significantly lower than the annual required contribution because the City currently operates a Pay-As-You-Go plan. The City makes payment on an actual invoice basis representing the actual health expenses incurred by the covered retired employees during the year. Further, because the plan is not prefunded, there are no plan assets. The City does not intend to prefund the OPEB plan in the foreseeable future.
4. Funding Status and Progress The funded status based on the June 30, 2007 actuarial valuation is as follows:
Actuarial Accrued Liability
Actuarial Value of Assets
Unfunded Actuarial Accrued Liability (UAAL)
Funded Ratio
Annual Covered Payroll
UAAL as a %
of Covered Payroll
$113,725,000 $0 $113,725,000 N/A $19,855,000 572.78%

CITY OF COMPTON Notes to Financial Statements (Continued)
June 30, 2009
76
Actuarial valuations of an ongoing plan involved estimates of the value of reported amounts and assumptions about the probability of occurrence of events far into the future. Examples include assumptions about future employment, morality, and the healthcare cost trend. Amounts determined regarding the funded status of the plan and the annual required contributions of the employer are subject to continual revision as actual results are compared with past expectations and new estimates are made about the future. The schedule of funding progress, presented as required supplementary information following the notes to financial statements, will present multi-year trend information about whether the actuarial value of plan assets is increasing or decreasing over time relative to the actuarial accrued liabilities for the benefits as additional valuations are performed. During the year ended June 30, 2009, the City changed the discount rate used to determine the plan’s accrued actuarial liability (AAL) from 7.75% to 4.25%, which resulted in an increase of the AAL from $69,979,000 to $113,725,000 as of June 30, 2007. 5. Actuarial Methods and Assumptions
Projections of benefits for financial reporting purposes are based on the substantive plan (the plan as understood by the employer and the plan members) and include the types of benefits provided at the time of each valuation and the historical pattern of sharing of the benefit costs between employer and plan members to that point. The actuarial methods and assumptions used include techniques that are designed to reduce the effects of short-term volatility in actuarial accrued liabilities and the actuarial assets, consistent with the long-term perspective of the calculations. The June 30, 2007 actuarial valuation was used to determine the ARC for fiscal year 2009 and disclose the funded status of the plan. The actuarial cost method used for determining the benefit obligations is the Projected Unit Credit Cost Method. The actuarial assumptions include a 4.25% investment rate of return, which is based on assumed long-term investment returns on plan assets and on the City’s assets, as appropriate, and an annual healthcare cost trend rate of 4.5% Both rates included a 3% inflation assumption. The UAAL is being amortized as a level percentage of projected payroll over 30 years. It is assumed the City’s payroll will increase 3.25% per year.
(c) Contingency The City participates in a number of federally assisted grant programs, which are subject to program compliance audits by the grantors or their representative. The City’s grant programs have also been audited in accordance with the provisions of the Single Audit Act Amendments of 1996, which have disclosed instances of noncompliance with certain federal program compliance requirements, and depending on the resolution of the identified findings and questioned costs, the City may be required to repay a portion of grants to the federal granting agency. Subsequent to year end, the U.S Department of Housing and Urban Development (HUD) commenced an audit of the Housing Section 8 program for years ended June 30, 2005 to June 30, 2007. As of time of this report, the amount of questioned or disallowed costs for which the City may be liable could not be determined.
(d) Subsequent event – SERAF
On July 24, 2009, the State Legislature passed Assembly Bill (AB) 26 4x, which requires redevelopment agencies statewide to deposit a total of $2.05 billion of property tax increment in county “Supplemental” Educational Revenue Augmentation Funds (SERAF) to be distributed to meet the State’s Proposition 98 obligations to schools. The SERAF revenue shift of $2.05 billion will be

CITY OF COMPTON Notes to Financial Statements (Continued)
June 30, 2009
77
made over two years, $1.7 billion in fiscal year 2009-2010 and $350 million in fiscal year 2010-2011. The SERAF would then be paid to school districts and the county offices of education, which have students residing in redevelopment project areas, or residing in affordable housing projects financially assisted by a redevelopment agency, thereby relieving the State of payments to those schools. The Agency’s share of this revenue shift is approximately $8.3 million in fiscal year 2009-2010 and $1.7 million in fiscal year 2010-2011. Payment is to be made on or before May 10 of the applicable years. In response to AB 26 4x, the Agency will fund this SERAF payment from its property tax revenues for the fiscal years 2009-2010 and 2010-2011. The California Redevelopment Association (CRA) is the lead petitioner on a lawsuit to invalidate AB 26 4x, similar to last year’s successful lawsuit challenging the constitutionality of AB 1389. CRA filed its lawsuit in October 2009. The lawsuit will assert that the transfer of property tax increment to the SERAF is not permitted under Article XVI, Section 16 of the California Constitution. The complaint will also assert impairment of contract and gift of public funds arguments. On May 4, 2010, the Sacramento Superior Court issued a decision denying the petition as well as rejecting the California Redevelopment Association's request for a stay of the SERAF transfers required by Health and Safety Code section 33690. The Agency made its required $8.3 million payment on May 10, 2010, as required by AB 26 4x. CRA will continue to pursue an appeal of the adverse decision.

78
REQUIRED SUPPLEMENTAL INFORMATION

PERS - Miscellaneous Plan
Entry Age UnfundedNormal Actuarial UAAL as
Actuarial Actuarial Accrued Annual a % ofValuation Accrued Value of Liability Funded Covered Covered
Date Liability Assets (UAAL) Ratio Payroll Payroll(A) (B) (A-B) (B/A) (C) [(A-B)/C]
6/30/2006 122,975,578$ 102,506,156$ 20,469,422$ 88.6% 12,174,711$ 168.1%6/30/2007 130,255,772$ 109,385,522$ 20,870,250$ 84.0% 13,975,341$ 149.3%6/30/2008 136,746,394$ 115,068,267$ 21,678,127$ 84.1% 15,453,499$ 140.3%
OPEB
UnfundedActuarial UAAL as
Actuarial Actuarial Accrued Annual a % ofValuation Accrued Value of Liability Funded Covered Covered
Date Liability Assets (UAAL) Ratio Payroll Payroll(A) (B) (A-B) (B/A) (C) [(A-B)/C]
6/30/2007 113,725,000$ -$ 113,725,000$ N/A 19,855,000$ 572.8%
See Accompanying Note to Required Supplementary Information.
CITY OF COMPTONRequired Supplementary Information
Schedule of Funding ProgressJune 30, 2009
79

Variance withFinal Budget
Actual PositiveOriginal Final Amount (Negative)
Revenues: Taxes and special assessments 30,492,021$ 30,492,021$ 26,450,609$ (4,041,412)$ Licenses and permits 4,301,503 4,301,503 3,817,856 (483,647) Intergovernmental revenues 7,804,750 7,804,750 8,747,907 943,157 Fines, forfeitures, and penalties 2,451,851 2,451,851 1,983,459 (468,392) Use of money and property 8,509,388 8,509,388 3,991,806 (4,517,582) Charges for services 3,590,050 3,590,050 3,502,274 (87,776) Other 6,787,008 8,311,517 - (8,311,517)
Total revenues 63,936,571 65,461,080 48,493,911 (16,967,169)
Expenditures: Current: General government 6,062,125 6,486,133 9,394,659 (2,908,526) Public safety 16,727,092 16,630,400 17,319,774 (689,374) Public works 1,344,138 1,416,358 1,565,979 (149,621) Management services 29,346,283 35,614,022 29,249,649 6,364,373 Environmental and human services 6,047,753 5,176,355 4,047,431 1,128,924 Debt Service: - Principal - 234,812 203,362 31,450 Interest - 78,000 86,517 (8,517)
Total expenditures 59,527,391 65,636,080 61,867,371 3,768,709
Excess (deficiency) of revenues over (under) expenditures 4,409,180 (175,000) (13,373,460) (13,198,460) Other financing sources (uses): Transfers in 4,130,079 - 3,114,721 (3,114,721) Transfers out (55,228) - (4,107,813) 4,107,813
Total other financing sources (uses) 4,074,851 - (993,092) (993,092)
Net change in fund balance 8,484,031 (175,000) (14,366,552) (14,191,552) Fund balance, beginning 11,780,042 11,780,042 11,780,042 -
Fund balance, ending 20,264,073$ 11,605,042$ (2,586,510)$ (14,191,552)$
Budgeted Amounts
For the Year Ended June 30, 2009
General FundCITY OF COMPTON
Budgetary Comparison Schedule
80
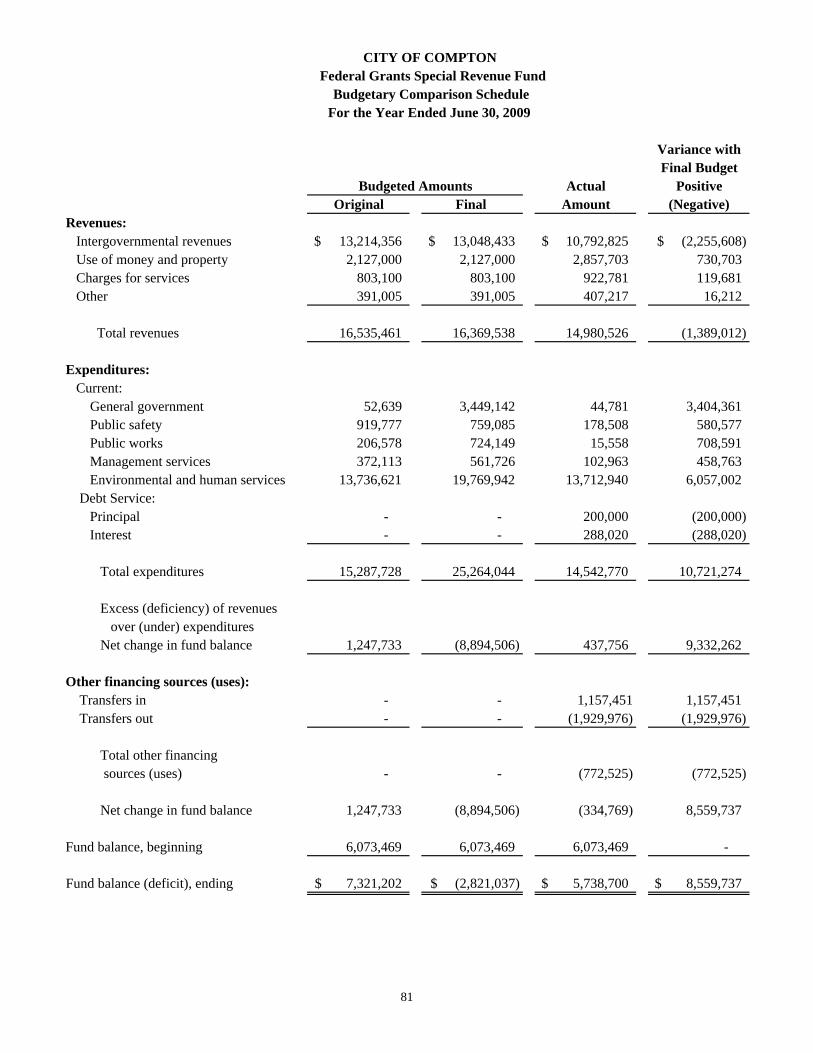
Federal Grants Special Revenue Fund Budgetary Comparison Schedule For the Year Ended June 30, 2009
Variance withFinal Budget
Actual PositiveOriginal Final Amount (Negative)
Revenues: Intergovernmental revenues 13,214,356$ 13,048,433$ 10,792,825$ (2,255,608)$ Use of money and property 2,127,000 2,127,000 2,857,703 730,703 Charges for services 803,100 803,100 922,781 119,681 Other 391,005 391,005 407,217 16,212
Total revenues 16,535,461 16,369,538 14,980,526 (1,389,012)
Expenditures: Current: General government 52,639 3,449,142 44,781 3,404,361 Public safety 919,777 759,085 178,508 580,577 Public works 206,578 724,149 15,558 708,591 Management services 372,113 561,726 102,963 458,763 Environmental and human services 13,736,621 19,769,942 13,712,940 6,057,002 Debt Service: Principal - - 200,000 (200,000) Interest - - 288,020 (288,020)
Total expenditures 15,287,728 25,264,044 14,542,770 10,721,274
Excess (deficiency) of revenues over (under) expenditures Net change in fund balance 1,247,733 (8,894,506) 437,756 9,332,262
Other financing sources (uses): Transfers in - - 1,157,451 1,157,451 Transfers out - - (1,929,976) (1,929,976)
Total other financing sources (uses) - - (772,525) (772,525)
Net change in fund balance 1,247,733 (8,894,506) (334,769) 8,559,737
Fund balance, beginning 6,073,469 6,073,469 6,073,469 -
Fund balance (deficit), ending 7,321,202$ (2,821,037)$ 5,738,700$ 8,559,737$
CITY OF COMPTON
Budgeted Amounts
81
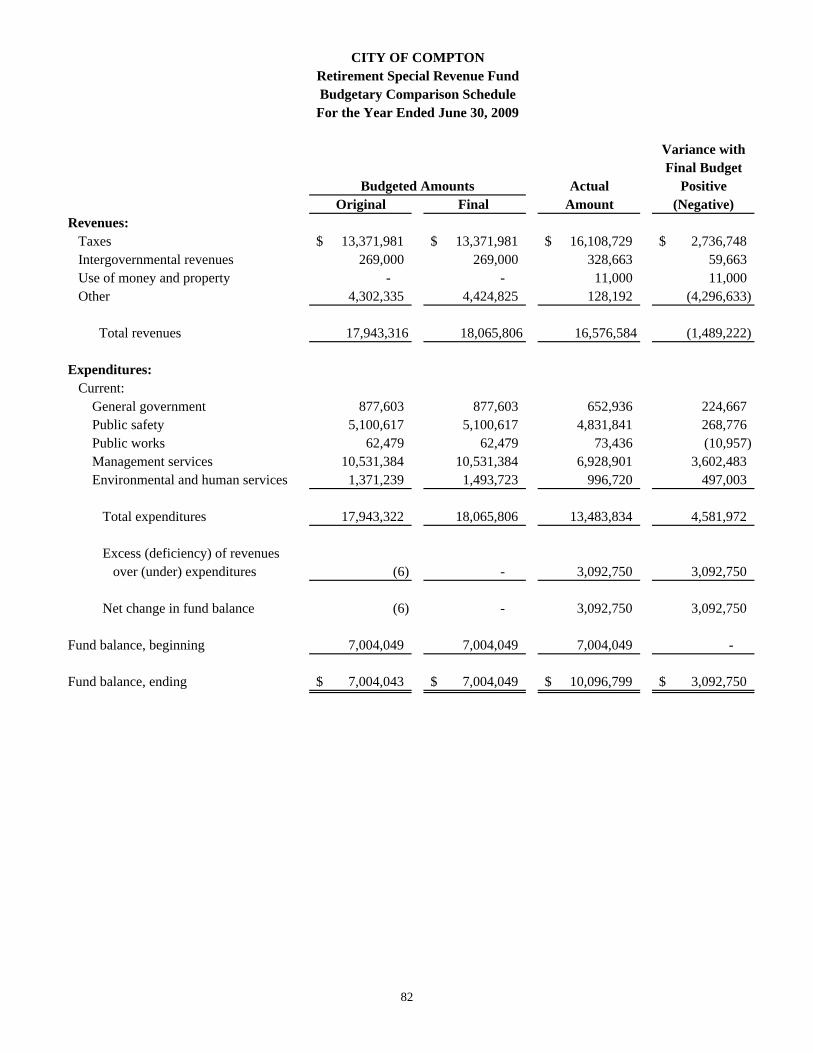
CITY OF COMPTONRetirement Special Revenue FundBudgetary Comparison Schedule
For the Year Ended June 30, 2009
Variance withFinal Budget
Budgeted Amounts Actual PositiveOriginal Final Amount (Negative)
Revenues: Taxes 13,371,981$ 13,371,981$ 16,108,729$ 2,736,748$ Intergovernmental revenues 269,000 269,000 328,663 59,663 Use of money and property - - 11,000 11,000 Other 4,302,335 4,424,825 128,192 (4,296,633)
Total revenues 17,943,316 18,065,806 16,576,584 (1,489,222)
Expenditures: Current: General government 877,603 877,603 652,936 224,667 Public safety 5,100,617 5,100,617 4,831,841 268,776 Public works 62,479 62,479 73,436 (10,957) Management services 10,531,384 10,531,384 6,928,901 3,602,483 Environmental and human services 1,371,239 1,493,723 996,720 497,003
Total expenditures 17,943,322 18,065,806 13,483,834 4,581,972
Excess (deficiency) of revenues over (under) expenditures (6) - 3,092,750 3,092,750
Net change in fund balance (6) - 3,092,750 3,092,750 Fund balance, beginning 7,004,049 7,004,049 7,004,049 -
Fund balance, ending 7,004,043$ 7,004,049$ 10,096,799$ 3,092,750$
82

CITY OF COMPTON Note to Required Supplementary Information
June 30, 2009
83
(1) Budgetary Information
(a) Budgetary Information
The Annual Budget adopted by the City Council provides for the City’s general operations. The budget includes proposed expenditures and estimated revenues for all Governmental funds. No budgetary comparisons are prepared for Proprietary and Agency Funds, as the City is not legally required to adopt a budget for these types of funds.
The City Manager is authorized to make the necessary changes to the budget to assure adequate and proper standards of service. Actual expenditures may not exceed budgeted appropriations at the department level for the General Fund and at the fund level for all other budgeted funds.
A budget Supplement (Supplement) is published which reconciles revenues and expenditures at the legal level of control to the summarized amounts presented in the annual financial statements. This supplement can be obtained from the City Controller. The budget is formally integrated into the accounting system and employed as a management control device during the year for all funds. Budgets for the Governmental Funds are adopted on a basis consistent with accounting principles generally accepted in the United States of America. The modified-accrual basis of accounting is employed in the preparation of the budget.
At fiscal year-end operating budget appropriations lapse; however, incomplete capital improvement appropriations may be carried over to the following fiscal year. Encumbrance accounting, under which purchase orders, contracts, and other commitments for the expenditure of funds are recorded in order to reserve that portion of the applicable appropriation, is employed in the General, Special Revenue, and Capital Projects Funds. Encumbrances outstanding at year-end are reported as reservations of fund balances since they do not constitute expenditures or liabilities and the commitments will be honored during the subsequent year.

84
SUPPLEMENTARY INFORMATION

VarianceFinal Actual Positive
Budget Amount (Negative)Revenues: Taxes and special assessment 10,036,617$ 8,386,487$ (1,650,130)$ Use of money and property 285,650 135,337 (150,313)
Total revenues 10,322,267 8,521,824 (1,800,443)
Expenditures: Current: Professional services 426,800 463,285 (36,485) Pass through payments - 302,709 (302,709) Debt service: Principal 7,803,843 6,585,000 1,218,843 Interest 2,091,625 2,091,625 -
Total expenditures 10,322,268 9,442,619 879,649 Deficiency of revenues under expenditures (1) (920,795) (920,794)
Other financing sources (uses): Transfer out - (19,000,000) (19,000,000)
Net change in fund balance (1) (19,920,795) 19,920,794 Fund balance, beginning 36,779,813 36,779,813 -
Fund balance, ending 36,779,812$ 16,859,018$ 19,920,794$
CITY OF COMPTONRedevelopment Debt Service FundBudgetary Comparison ScheduleFor the Year Ended June 30, 2009
85
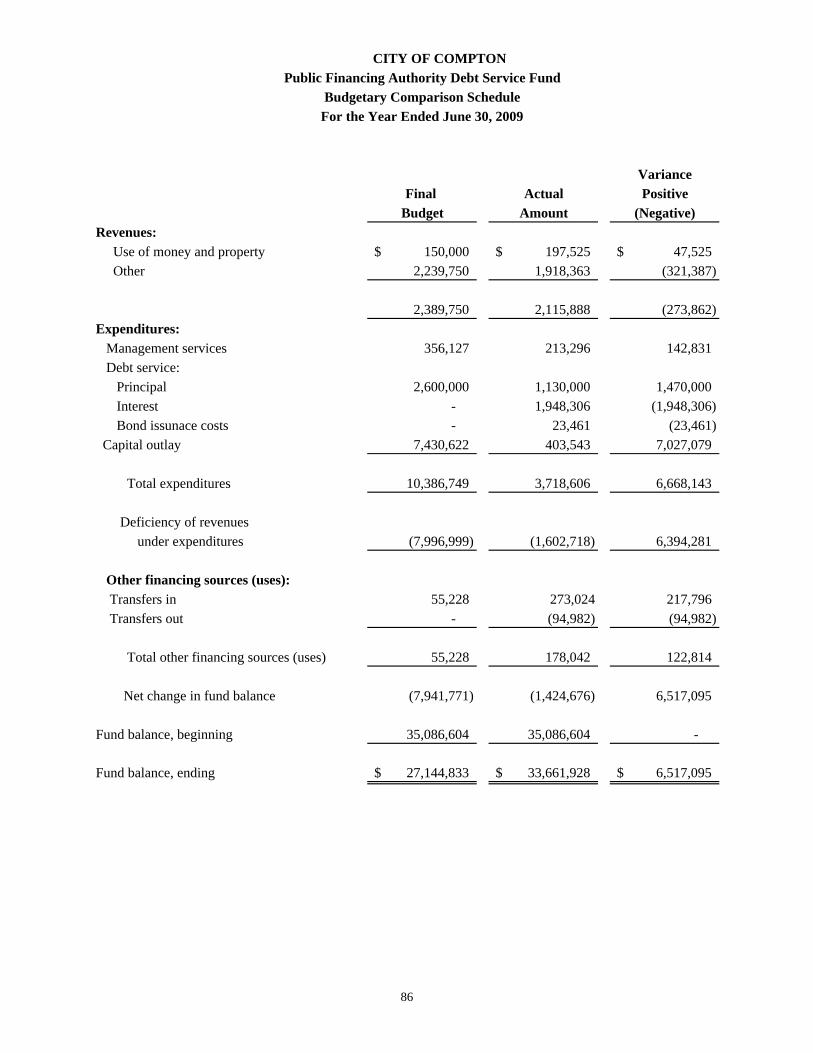
Public Financing Authority Debt Service FundBudgetary Comparison Schedule
For the Year Ended June 30, 2009
VarianceFinal Actual Positive
Budget Amount (Negative)Revenues: Use of money and property 150,000$ 197,525$ 47,525$ Other 2,239,750 1,918,363 (321,387)
2,389,750 2,115,888 (273,862) Expenditures: Management services 356,127 213,296 142,831 Debt service: Principal 2,600,000 1,130,000 1,470,000 Interest - 1,948,306 (1,948,306) Bond issunace costs - 23,461 (23,461) Capital outlay 7,430,622 403,543 7,027,079
Total expenditures 10,386,749 3,718,606 6,668,143
Deficiency of revenues under expenditures (7,996,999) (1,602,718) 6,394,281
Other financing sources (uses): Transfers in 55,228 273,024 217,796 Transfers out - (94,982) (94,982)
Total other financing sources (uses) 55,228 178,042 122,814
Net change in fund balance (7,941,771) (1,424,676) 6,517,095
Fund balance, beginning 35,086,604 35,086,604 -
Fund balance, ending 27,144,833$ 33,661,928$ 6,517,095$
CITY OF COMPTON
86
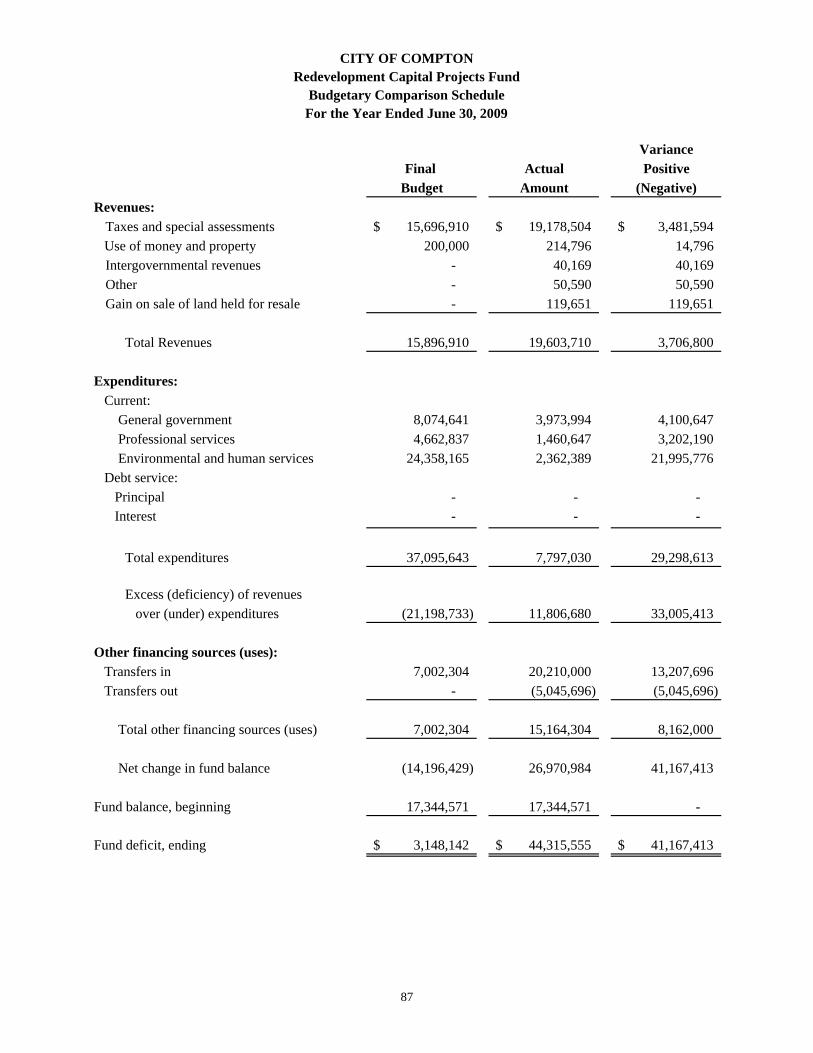
VarianceFinal Actual Positive
Budget Amount (Negative)Revenues: Taxes and special assessments 15,696,910$ 19,178,504$ 3,481,594$
Use of money and property 200,000 214,796 14,796 Intergovernmental revenues - 40,169 40,169 Other - 50,590 50,590 Gain on sale of land held for resale - 119,651 119,651
Total Revenues 15,896,910 19,603,710 3,706,800
Expenditures: Current: General government 8,074,641 3,973,994 4,100,647 Professional services 4,662,837 1,460,647 3,202,190 Environmental and human services 24,358,165 2,362,389 21,995,776 Debt service: Principal - - - Interest - - -
Total expenditures 37,095,643 7,797,030 29,298,613
Excess (deficiency) of revenues over (under) expenditures (21,198,733) 11,806,680 33,005,413
Other financing sources (uses): Transfers in 7,002,304 20,210,000 13,207,696 Transfers out - (5,045,696) (5,045,696)
Total other financing sources (uses) 7,002,304 15,164,304 8,162,000
Net change in fund balance (14,196,429) 26,970,984 41,167,413 Fund balance, beginning 17,344,571 17,344,571 -
Fund deficit, ending 3,148,142$ 44,315,555$ 41,167,413$
Redevelopment Capital Projects FundBudgetary Comparison Schedule
For the Year Ended June 30, 2009
CITY OF COMPTON
87

CITY OF COMPTONLow/Moderate Income Housing Capital Projects Fund
Budgetary Comparison ScheduleFor the Year Ended June 30, 2009
VarianceFinal Actual Positive
Budget Amount (Negative)Revenues: Use of money and property 165,000$ 13,923$ (151,077)$ Other 75,000 184,110 109,110
Total revenues 240,000 198,033 (41,967)
Expenditures: Current: General government 9,708,675 7,347,347 2,361,328 Professional services 722,171 588,309 133,862
Total expenditures 10,430,846 7,935,656 2,495,190 Deficiency of revenues under expenditures (10,190,846) (7,737,623) 2,453,223
Other financing sources: Transfers in 2,665,692 3,835,696 1,170,004
Net change in fund balance (7,525,154) (3,901,927) 3,623,227 Fund balance, beginning 8,707,378 8,707,378 -
Fund balance, ending 1,182,224$ 4,805,451$ 3,623,227$
88

89
This page is left blank intentionally.
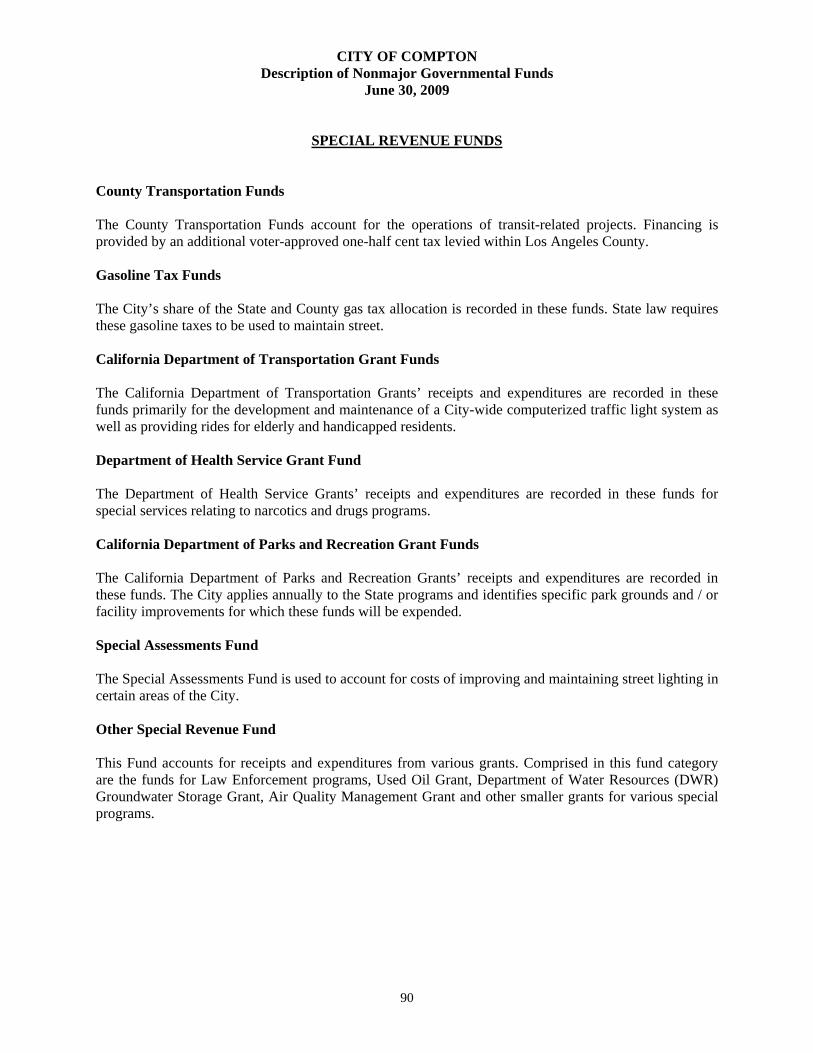
CITY OF COMPTON Description of Nonmajor Governmental Funds
June 30, 2009
90
SPECIAL REVENUE FUNDS
County Transportation Funds The County Transportation Funds account for the operations of transit-related projects. Financing is provided by an additional voter-approved one-half cent tax levied within Los Angeles County. Gasoline Tax Funds The City’s share of the State and County gas tax allocation is recorded in these funds. State law requires these gasoline taxes to be used to maintain street. California Department of Transportation Grant Funds The California Department of Transportation Grants’ receipts and expenditures are recorded in these funds primarily for the development and maintenance of a City-wide computerized traffic light system as well as providing rides for elderly and handicapped residents. Department of Health Service Grant Fund The Department of Health Service Grants’ receipts and expenditures are recorded in these funds for special services relating to narcotics and drugs programs. California Department of Parks and Recreation Grant Funds The California Department of Parks and Recreation Grants’ receipts and expenditures are recorded in these funds. The City applies annually to the State programs and identifies specific park grounds and / or facility improvements for which these funds will be expended. Special Assessments Fund The Special Assessments Fund is used to account for costs of improving and maintaining street lighting in certain areas of the City. Other Special Revenue Fund This Fund accounts for receipts and expenditures from various grants. Comprised in this fund category are the funds for Law Enforcement programs, Used Oil Grant, Department of Water Resources (DWR) Groundwater Storage Grant, Air Quality Management Grant and other smaller grants for various special programs.

CITY OF COMPTON Description of Nonmajor Governmental Funds
June 30, 2009
91
DEBT SERVICE FUND Certificates of Participation (COP) Fund The Certificate of Participation Fund is used to account for the accumulation of resources for, and the payment for, interest and principal on the City’s 1997 Series A refunding issues of $26.585 million.
CAPITAL PROJECT FUNDS Public Finance Authority Fund The Public Financing Authority Fund (Authority) is used to account for the lease from and leaseback to the City, certain property under the lease agreement dated September 1, 1997. Other Capital Projects Fund This fund is used to account for financial resources expended for capital assets.
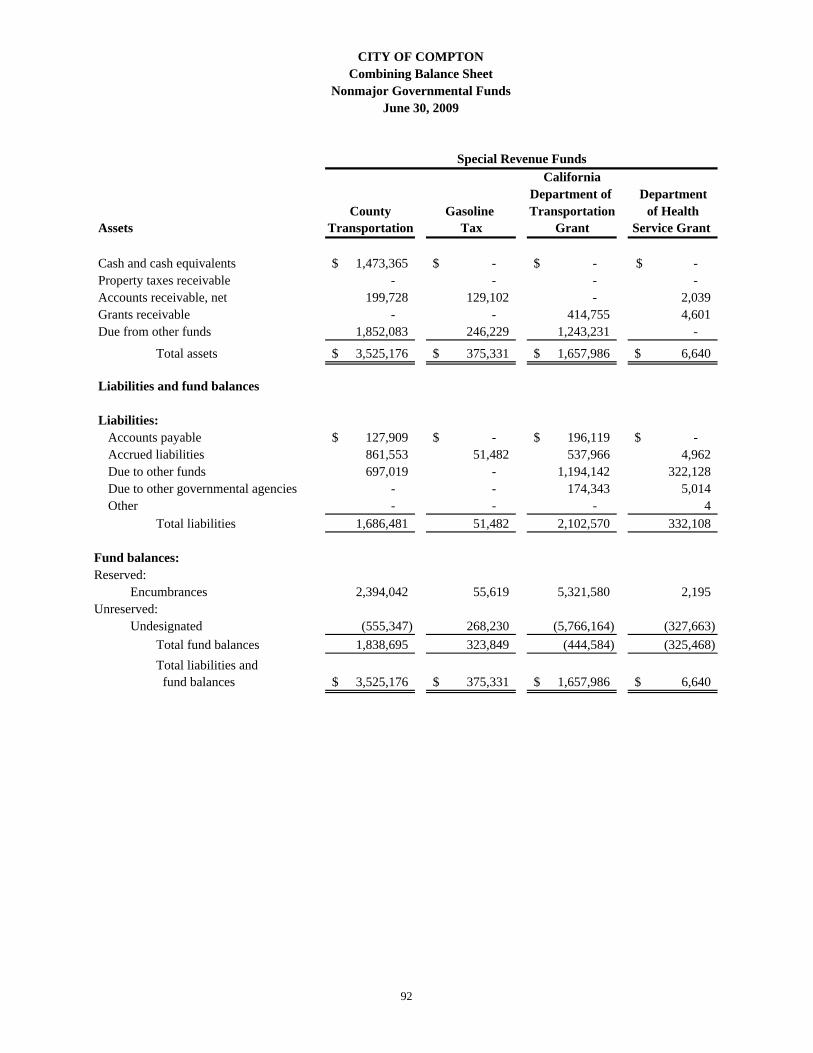
CITY OF COMPTONCombining Balance Sheet
Nonmajor Governmental FundsJune 30, 2009
CaliforniaDepartment of Department
County Gasoline Transportation of HealthAssets Transportation Tax Grant Service Grant
Cash and cash equivalents 1,473,365$ -$ -$ -$ Property taxes receivable - - - - Accounts receivable, net 199,728 129,102 - 2,039 Grants receivable - - 414,755 4,601 Due from other funds 1,852,083 246,229 1,243,231 -
Total assets 3,525,176$ 375,331$ 1,657,986$ 6,640$
Liabilities and fund balances
Liabilities: Accounts payable 127,909$ -$ 196,119$ -$ Accrued liabilities 861,553 51,482 537,966 4,962 Due to other funds 697,019 - 1,194,142 322,128 Due to other governmental agencies - - 174,343 5,014 Other - - - 4
Total liabilities 1,686,481 51,482 2,102,570 332,108
Fund balances:Reserved: Encumbrances 2,394,042 55,619 5,321,580 2,195 Unreserved:
Undesignated (555,347) 268,230 (5,766,164) (327,663) Total fund balances 1,838,695 323,849 (444,584) (325,468) Total liabilities and fund balances 3,525,176$ 375,331$ 1,657,986$ 6,640$
Special Revenue Funds
92

Debt ServiceSpecial Revenue Funds Fund Capital Projects Funds
CaliforniaDepartment of Public
Parks and Special FinancingRecreation Grant Assessments Other COP Authority Other Total
11,471$ -$ 10,853$ -$ 24,256$ -$ 1,519,945$ - 212,616 - - - - 212,616 - - - - - - 330,869 - - 58,883 - - - 478,239 - - 524,557 - - - 3,866,100
11,471$ 212,616$ 594,293$ -$ 24,256$ -$ 6,407,769$
31,203$ -$ 128,559$ -$ -$ -$ 483,790$ - 171,320 46,712 - - - 1,673,995
355,438 3,219,315 130,540 - 1,534 - 5,920,116 - - - - - - 179,357 - - - - - - 4
386,641 3,390,635 305,811 - 1,534 - 8,257,262
- 572,206 87,468 - - - 8,433,110
(375,170) (3,750,225) 201,014 - 22,722 - (10,282,603) (375,170) (3,178,019) 288,482 - 22,722 - (1,849,493)
11,471$ 212,616$ 594,293$ -$ 24,256$ -$ 6,407,769$
93
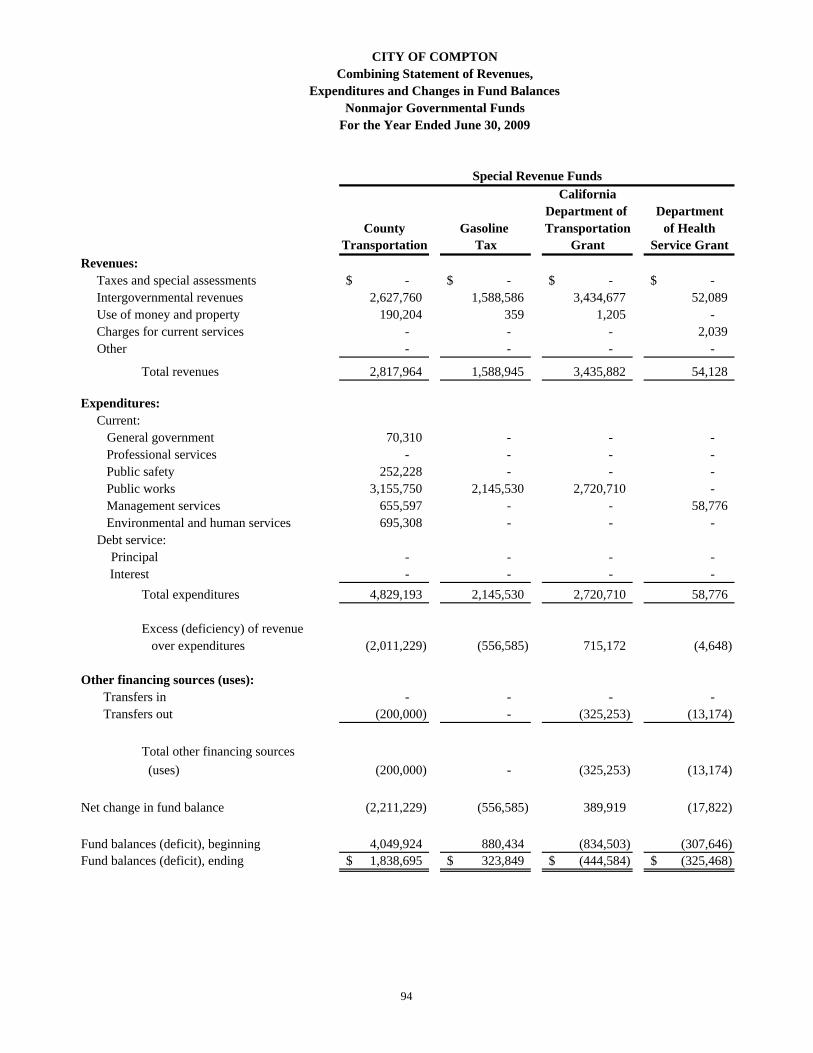
CITY OF COMPTONCombining Statement of Revenues,
Expenditures and Changes in Fund BalancesNonmajor Governmental Funds
For the Year Ended June 30, 2009
CaliforniaDepartment of Department
County Gasoline Transportation of HealthTransportation Tax Grant Service Grant
Revenues:Taxes and special assessments -$ -$ -$ -$ Intergovernmental revenues 2,627,760 1,588,586 3,434,677 52,089Use of money and property 190,204 359 1,205 - Charges for current services - - - 2,039
- - - -
Total revenues 2,817,964 1,588,945 3,435,882 54,128
Expenditures:Current:
70,310 - - - Professional services - - - - Public safety 252,228 - - - Public works 3,155,750 2,145,530 2,720,710 - Management services 655,597 - - 58,776 Environmental and human services 695,308 - - - Debt service: Principal - - - -
Interest - - - - Total expenditures 4,829,193 2,145,530 2,720,710 58,776
Excess (deficiency) of revenue over expenditures (2,011,229) (556,585) 715,172 (4,648)
Other financing sources (uses): Transfers in - - - - Transfers out (200,000) - (325,253) (13,174)
Total other financing sources (uses) (200,000) - (325,253) (13,174)
Net change in fund balance (2,211,229) (556,585) 389,919 (17,822)
Fund balances (deficit), beginning 4,049,924 880,434 (834,503) (307,646)Fund balances (deficit), ending 1,838,695$ 323,849$ (444,584)$ (325,468)$
General government
Other
Special Revenue Funds
94

Debt Service Capital ProjectsSpecial Revenue Funds Fund Funds
CaliforniaDepartment of Public
Parks and Special FinancingRecreation Grant Assessments Other COP Authority Other Total
-$ 4,315,571$ -$ -$ -$ -$ 4,315,571$ 126,000 - 525,707 - - - 8,354,819
346 - 987 - 641 - 193,742 - - 1,383 - - - 3,422
1 - 52,615 - - - 52,616
126,347 4,315,571 580,692 - 641 - 12,920,170
- - - - - - 70,310 - - 1,239,638 - - - 1,239,638 - - - - - - 252,228 - 3,883,446 - - - - 11,905,436 - - - - 36,478 - 750,851
157,503 - 112,148 - - - 964,959
- 92,379 - - - - 92,379 - 14,592 - - - - 14,592
157,503 3,990,417 1,351,786 - 36,478 - 15,290,393
(31,156) 325,154 (771,094) - (35,837) - (2,370,223)
85,951 377,536 1,243,183 94,982 55,208 - 1,856,860 (270) (377,536) (415,299) - - (430,750) (1,762,282)
85,681 - 827,884 94,982 55,208 (430,750) 94,578
54,525 325,154 56,790 94,982 19,371 (430,750) (2,275,645)
(429,696) (3,503,171) 231,691 (94,982) 3,351 430,750 426,152 (375,171)$ (3,178,017)$ 288,481$ -$ 22,722$ -$ (1,849,493)$
95

VarianceFinal Actual Positive
Budget Amount (Negative)Revenues: Intergovernmental revenues 2,800,000$ 2,627,760$ (172,240)$ Use of money and property - 190,204 190,204
Total revenues 2,800,000 2,817,964 17,964
Expenditures: Current:
General government 96,792 70,310 26,482 Public safety 361,148 252,228 108,920 Public works 6,908,696 3,155,750 3,752,946 Management services 1,184,473 655,597 528,876 Environmental and human services 889,802 695,308 194,494
Total expenditures 9,440,911 4,829,193 4,611,718
Deficiency of revenues under expenditures (6,640,911) (2,011,229) 4,629,682
Other financing uses: Transfers out - (200,000) (200,000)
Net change in fund balance (6,640,911) (2,211,229) 4,429,682 Fund balance, beginning 4,049,924 4,049,924 -
Fund balance (deficit), ending (2,590,987)$ 1,838,695$ 4,429,682$
CITY OF COMPTON Nonmajor County Transportation Special Revenue Fund
Budgetary Comparison ScheduleFor the Year Ended June 30, 2009
96

VarianceFinal Actual Positive
Budget Amount (Negative)Revenues: Intergovernmental revenues 2,169,554$ 1,588,586$ (580,968)$ Use of money and property 2,700 359 (2,341)
Total revenues 2,172,254 1,588,945 (583,309)
Expenditures: Current: Public works 2,258,275 2,145,530 112,745
Deficiency of revenues under expenditures (86,021) (556,585) (470,564)
Net change in fund balance (86,021) (556,585) (470,564)
Fund balance, beginning 880,434 880,434 -
Fund balance, ending 794,413$ 323,849$ (470,564)$
Nonmajor Gasoline Tax Special Revenue FundBudgetary Comparison ScheduleFor the Year Ended June 30, 2009
CITY OF COMPTON
97

VarianceFinal Actual Positive
Budget Amount (Negative)Revenues: Intergovernmental revenues 1,272,633$ 3,434,677$ 2,162,044$ Use of money and property - 1,205 1,205
Total revenues 1,272,633 3,435,882 2,163,249
Expenditures: Current: Public works 12,819,315 2,720,710 10,098,605
Excess (deficiency) of revenues over (under) expenditures (11,546,682) 715,172 12,261,854
Other financing uses: Transfers out - (325,253) (325,253)
Net change in fund balance (11,546,682) 389,919 11,936,601
Fund deficit, beginning (834,503) (834,503) -
Fund deficit, ending (12,381,185)$ (444,584)$ 11,936,601$
Budgetary Comparison ScheduleFor the Year Ended June 30, 2009
CITY OF COMPTON Nonmajor California Department of Transportation Grant Special Revenue Fund
98

VarianceFinal Actual Positive
Budget Amount (Negative)Revenues: Intergovernmental revenues 71,490$ 52,089$ (19,401)$ Charges for current services - 2,039 2,039
Total revenues 71,490 54,128 (17,362)
Expenditures: Current: Management services 71,836 58,776 13,060
Deficiency of revenues under expenditures (346) (4,648) (4,302)
Other financing uses: Transfers out - (13,174) (13,174)
Net change in fund balance (346) (17,822) (17,476)
Fund deficit, beginning (307,646) (307,646) -
Fund deficit, ending (307,992)$ (325,468)$ (17,476)$
CITY OF COMPTON Nonmajor Department of Health Service Grant Special Revenue Fund
Budgetary Comparison ScheduleFor the Year Ended June 30, 2009
99

VarianceFinal Actual Positive
Budget Amount (Negative)Revenues: Intergovernmental revenues 157,500$ 126,000$ (31,500)$ Use of money and property 400 346 (54) Other - 1 1
Total revenues 157,900 126,347 (31,553)
Expenditures: Current:
Public works 572 - 572 Environmental and human services 157,500 157,503 (3)
Total expenditures 158,072 157,503 569
Deficiency of revenues under expenditures (172) (31,156) (30,984)
Other financing sources (uses): Transfers in - 85,951 85,951 Transfers out - (270) (270)
Total other financing sources (uses) - 85,681 85,681
Net change in fund balance (172) 54,525 54,697
Fund deficit, beginning (429,696) (429,696) -
Fund deficit, ending (429,868)$ (375,171)$ 54,697$
CITY OF COMPTON Nonmajor California Department of Parks and Recreation Service Special Revenue Fund
Budgetary Comparison ScheduleFor the Year Ended June 30, 2009
100

VarianceFinal Actual Positive
Budget Amount (Negative)Revenues: Taxes and special assessments 4,234,041$ 4,315,571$ 81,530$
Expenditures: Current: Public works 4,849,655 3,883,446 966,209 Debt Service: Principal - 92,379 (92,379) Interest - 14,592 (14,592)
Total expenditures 4,849,655 3,990,417 859,238
Excess (deficiency) of revenues over (under) expenditures (615,614) 325,154 940,768
Other financing sources (uses): Transfers in - 377,536 377,536 Transfers out - (377,536) (377,536)
Total other financing sources (uses) - - -
Net change in fund balance (615,614) 325,154 940,768
Fund deficit, beginning (3,503,171) (3,503,171) -
Fund deficit, ending (4,118,785)$ (3,178,017)$ 940,768$
CITY OF COMPTONNonmajor Special Assessments Special Revenue Fund
Budgetary Comparison ScheduleFor the Year Ended June 30, 2009
101
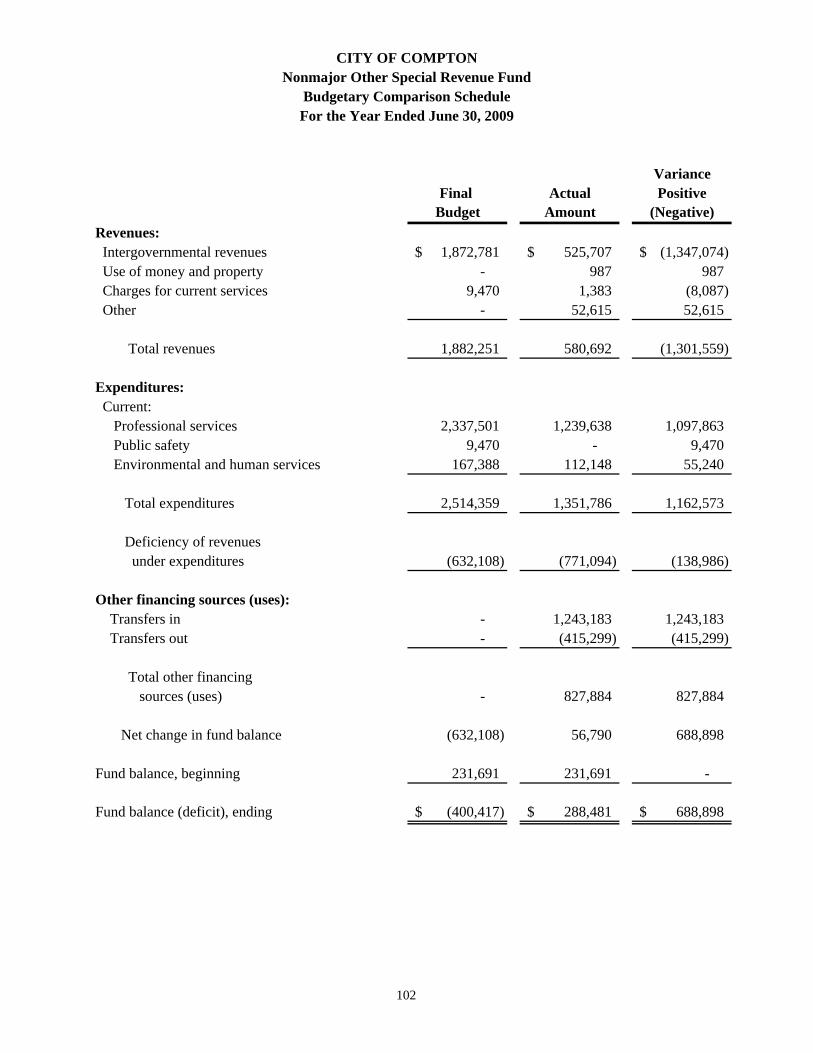
VarianceFinal Actual Positive
Budget Amount (Negative)Revenues:
Intergovernmental revenues 1,872,781$ 525,707$ (1,347,074)$ Use of money and property - 987 987
Charges for current services 9,470 1,383 (8,087) Other - 52,615 52,615
Total revenues 1,882,251 580,692 (1,301,559)
Expenditures: Current: Professional services 2,337,501 1,239,638 1,097,863 Public safety 9,470 - 9,470
Environmental and human services 167,388 112,148 55,240
Total expenditures 2,514,359 1,351,786 1,162,573
Deficiency of revenues under expenditures (632,108) (771,094) (138,986)
Other financing sources (uses): Transfers in - 1,243,183 1,243,183 Transfers out - (415,299) (415,299)
Total other financing sources (uses) - 827,884 827,884
Net change in fund balance (632,108) 56,790 688,898
Fund balance, beginning 231,691 231,691 -
Fund balance (deficit), ending (400,417)$ 288,481$ 688,898$
CITY OF COMPTONNonmajor Other Special Revenue Fund
Budgetary Comparison ScheduleFor the Year Ended June 30, 2009
102
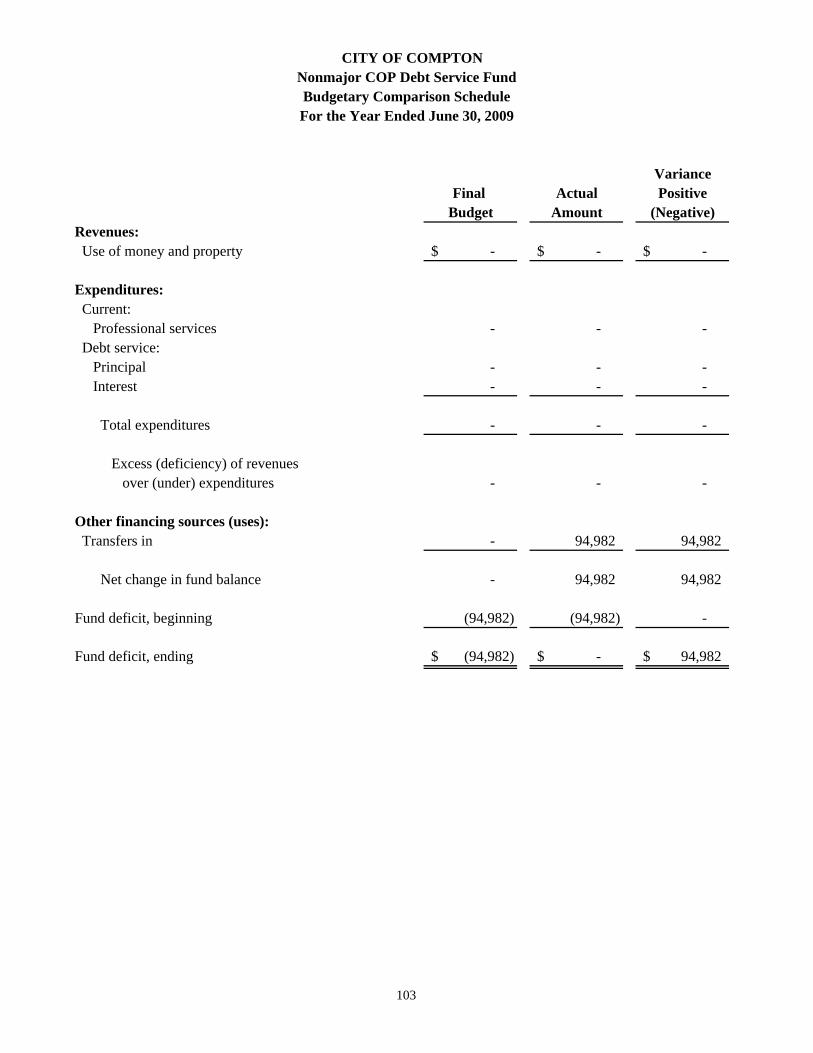
VarianceFinal Actual Positive
Budget Amount (Negative)Revenues: Use of money and property -$ -$ -$
Expenditures: Current: Professional services - - - Debt service: Principal - - - Interest - - -
Total expenditures - - -
Excess (deficiency) of revenues over (under) expenditures - - -
Other financing sources (uses): Transfers in - 94,982 94,982
Net change in fund balance - 94,982 94,982
Fund deficit, beginning (94,982) (94,982) -
Fund deficit, ending (94,982)$ -$ 94,982$
Nonmajor COP Debt Service FundBudgetary Comparison ScheduleFor the Year Ended June 30, 2009
CITY OF COMPTON
103
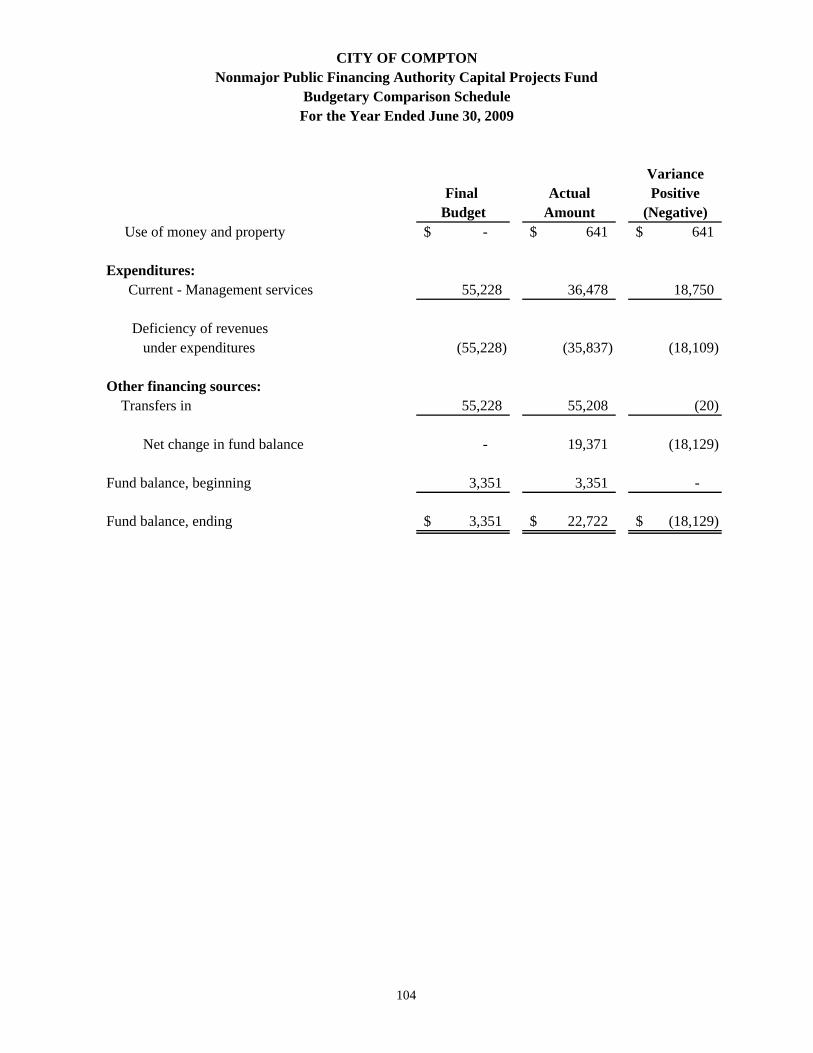
VarianceFinal Actual Positive
Budget Amount (Negative) Use of money and property -$ 641$ 641$
Expenditures: Current - Management services 55,228 36,478 18,750
Deficiency of revenues under expenditures (55,228) (35,837) (18,109)
Other financing sources: Transfers in 55,228 55,208 (20)
Net change in fund balance - 19,371 (18,129)
Fund balance, beginning 3,351 3,351 -
Fund balance, ending 3,351$ 22,722$ (18,129)$
For the Year Ended June 30, 2009Budgetary Comparison Schedule
Nonmajor Public Financing Authority Capital Projects FundCITY OF COMPTON
104

VarianceFinal Actual Positive
Budget Amount (Negative)Revenues: Other -$ -$ -$
Expenditures: Capital outlay - - -
Excess (deficiency) of revenues over (under) expenditures - - -
Other financing uses: Transfers out - (430,750) (430,750)
Net change in fund balance - (430,750) (430,750)
Fund balance, beginning 430,750 430,750 -
Fund balance, ending 430,750$ -$ (430,750)$
CITY OF COMPTONNonmajor Other Capital Projects Fund
Budgetary Comparison ScheduleFor the Year Ended June 30, 2009
105

106
This page is left blank intentionally.

CITY OF COMPTON Description of Nonmajor Enterprise Funds
June 30, 2009
107
ENTERPRISE FUNDS
Golf Course Fund The Golf Course Fund is used to account for all activities of the City-owned golf course. Recreational Fund The Recreation Fund is used to account for recreational activities financed by user fees.

Golf Course Recreational TotalAssets:Current assets: Due from other funds -$ 103,281$ 103,281$
Liabilities:Current liabilities: Accrued liabilities 128 - 128 Due to other funds 74,444 - 74,444 Deposits - 49,790 49,790Noncurrent liabilities: Postemployment benefit obligation 1,404 - 1,404
Total liabilities 75,976 49,790 125,766
Net Assets:Unrestricted (deficit) (75,976) 53,491 (22,485)
Total net assets (deficit) (75,976)$ 53,491$ (22,485)$
control -$ -$ -$
CITY OF COMPTONCombining Statement of Net Assets
Nonmajor Enterprise FundsJune 30, 2009
108

Golf Course Recreational Total
Operating revenues:Charges for services 47,488$ 15,139$ 62,627$ Other - 2,535 2,535
Total operating revenue 47,488 17,674 65,162
Operating expenses:Public works 48,452 - 48,452 Environmental and human services 562 10,363 10,925
Total operating expenses 49,014 10,363 59,377
Change in net assets (1,526) 7,311 5,785
Net assets (deficit), beginning (74,450) 46,180 (28,270) Net assets (deficit), ending (75,976)$ 53,491$ (22,485)$
CITY OF COMPTON Combining Statement of Revenues, Expenses and Changes in Fund Net Assets
Nonmajor Enterprise FundsJune 30, 2009
109

Golf Course Recreational TotalCash flows from operating activities: Cash received from customers 47,488$ 15,139$ 62,627$ Cash payment to suppliers for goods and services (47,482) (3,515) (50,997)
Net cash provided by operating activities 6 11,624 11,630
Cash flows from non-capital financing activities: Loan to other funds (6) (11,624) (11,630)
Net cash provided by (used in) financial activities (6) (11,624) (11,630)
Net increase in cash and cash equivalents - - -
Cash and cash equivalents, beginning - - -
Cash and cash equivalents, ending -$ -$ -$
Reconciliation of operating income (loss) to net cash provided by operating activities: Operating income (loss) (1,526)$ 7,311$ 5,785$ Adjustments to reconcile operating income (loss) to net cash provided by operating activities Changes in operating liabilities: Increase (decrease) in:
Accrued liabilities 128 - 128 Deposits payable - 4,313 4,313 Postemployment benefit obligation 1,404 - 1,404 Net cash provided by operating activities 6$ 11,624$ 11,630$
For the Year Ended June 30, 2009Nonmajor Enterprise Funds
Combining Statement of Cash FlowsCITY OF COMPTON
110

CITY OF COMPTON Description of Nonmajor Internal Service Funds
June 30, 2009
111
Equipment Rental Fund The Equipment Rental Fund was established to account for the rental costs of City equipment. Such costs are billed to the other departments at a rate which will provide for the future acquisition of equipment as well as operating costs. Central Duplicating Fund The Central Duplicating Fund was established to account for all duplicating costs. Such costs are billed to the other departments to cover operating costs. Self-Insurance Funds The Self-Insurance Funds were established to account for the City’s self-insurance activities.

Equipment Central SelfRental Duplication Insurance Total
Assets: Current assets: Cash and cash equivalents -$ -$ 509,590$ 509,590$ Due from other funds - 326,357 801,049 1,127,406 Inventories, at cost 15,328 - - 15,328
Total current assets 15,328 326,357 1,310,639 1,652,324
Noncurrent assets: Capital assets:
Nondepreciable 44,109 - - 44,109 Depreciated 108,859 315,319 - 424,178
Total assets 168,296 641,676 1,310,639 2,120,611
Liabilities: Current liabilities: Due to other funds 1,645,803 - 19,201,976 20,847,779 Accrued liabilities 96,985 20,124 777,861 894,970 Self-insurance claims - - 1,027,877 1,027,877 Capital lease - 106,389 - 106,389 Noncurrent liabilities: Capital lease 95,004 287,760 - 382,764
Self-insurance claims - - 4,118,051 4,118,051
Total liabilities 1,837,792 414,273 25,125,765 27,377,830
Net Assets: Invested in capital assets, net of related debt 57,964 (78,830) - (20,866) Unrestricted (deficit) (1,727,460) 306,233 (23,815,126) (25,236,353)
Total net assets (deficit) (1,669,496)$ 227,403$ (23,815,126)$ (25,257,219)$
CITY OF COMPTONCombining Statement of Net Assets
Internal Service Funds June 30, 2009
112
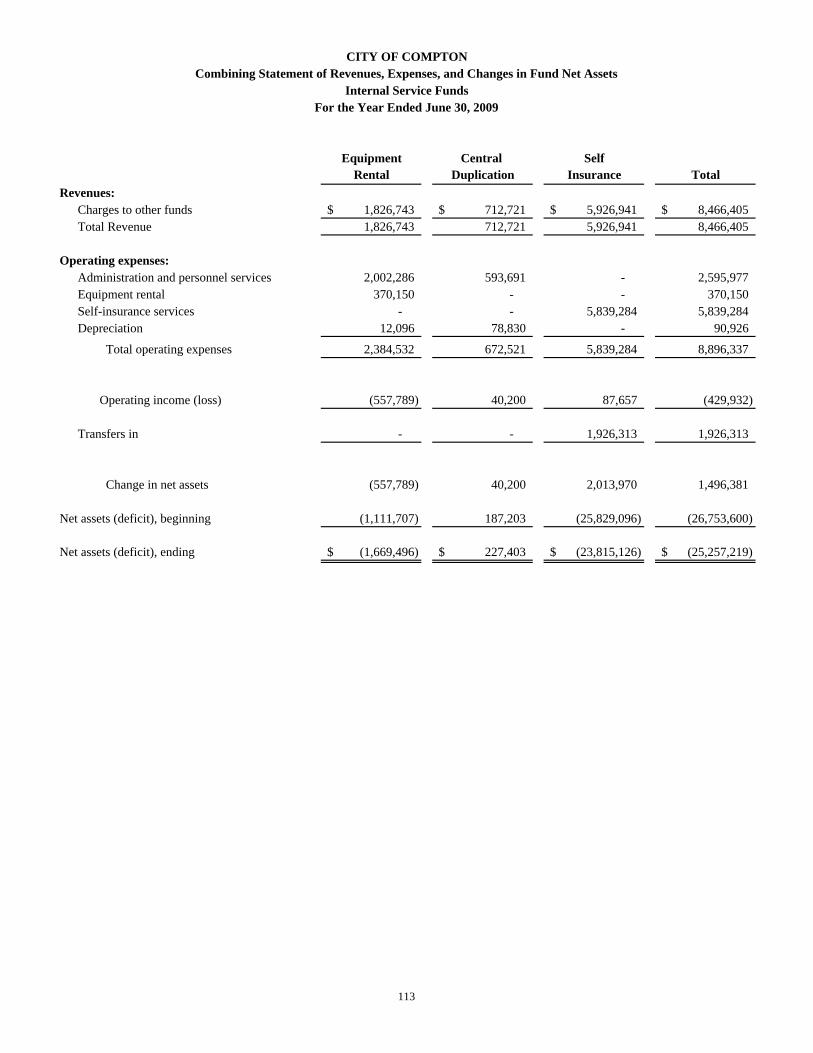
Equipment Central SelfRental Duplication Insurance Total
Revenues:Charges to other funds 1,826,743$ 712,721$ 5,926,941$ 8,466,405$ Total Revenue 1,826,743 712,721 5,926,941 8,466,405
Operating expenses:Administration and personnel services 2,002,286 593,691 - 2,595,977 Equipment rental 370,150 - - 370,150 Self-insurance services - - 5,839,284 5,839,284 Depreciation 12,096 78,830 - 90,926
Total operating expenses 2,384,532 672,521 5,839,284 8,896,337
Operating income (loss) (557,789) 40,200 87,657 (429,932)
Transfers in - - 1,926,313 1,926,313
Change in net assets (557,789) 40,200 2,013,970 1,496,381
Net assets (deficit), beginning (1,111,707) 187,203 (25,829,096) (26,753,600)
Net assets (deficit), ending (1,669,496)$ 227,403$ (23,815,126)$ (25,257,219)$
CITY OF COMPTONCombining Statement of Revenues, Expenses, and Changes in Fund Net Assets
Internal Service FundsFor the Year Ended June 30, 2009
113

Equipment Central SelfRental Duplication Insurance Total
Cash flows from operating activitiesCash received from customers 1,826,743$ 712,721$ 6,318,556$ 8,858,020$ Cash payments to suppliers for goods and services (1,812,491) (349,031) (4,920,990) (7,082,512) Cash payments to employees for services (461,922) (233,719) (1,079,735) (1,775,376)
Net cash provided by (used in) operating activities (447,670) 129,971 317,831 132
Cash flows from non-capital financing activities:
Loan repayment from other funds 473,620 - 521,584 995,204 Loan to other funds - (129,971) (2,417,394) (2,547,365) Transfers from other funds (net) - - 1,926,313 1,926,313
Net cash provided by (used in) non-capital financing activities 473,620 (129,971) 30,503 374,152
Cash flows from capital and related financing activities:
Net capital lease payment (25,950) - - (25,950)
(25,950) - - (25,950)
Net increase in cash and cash equivalents - - 348,334 348,334
Cash and cash equivalents, beginning - - 161,256 161,256
Cash and cash equivalents, ending -$ -$ 509,590$ 509,590$
Reconciliation of operating income (loss) to net cash provided by (used in) Operating activities:
Operating income (loss) (557,789)$ 40,200$ 87,657$ (429,932)$ Adjustments to reconcile operating income (loss) to net cash provided by (used in) operating activities:
Depreciation expense 12,096 78,830 - 90,926 Changes in operating assets and liabilities Decrease (increase) in: Inventories, at cost 19,176 - - 19,176 Increase (decrease) in: Accrued liabilities 78,847 10,941 759,186 848,974 Self-insurance claims - - (529,012) (529,012)
Net cash provided by (used in) operating activities (447,670)$ 129,971$ 317,831$ 132$
CITY OF COMPTONCombining Statement of Cash Flows
Internal Service FundsFor the Year Ended June 30, 2009
114

Balance BalanceJuly 1, 2008 Additions Deductions June 30, 2009
Assets:Cash and investments 360,451$ 2,849$ 807$ 362,493$ Accounts receivable 8,499 88,026 4,410 92,115 Due from other funds 977,148 - 540,980 436,168 Total assets 1,346,098$ 90,875$ 546,197$ 890,776$
Liabilities:Accrued liabilities 2,866$ 23,313$ 23,191$ 2,988$ Deposits 1,343,232 157,474 788,821 711,885 Agency obligations - 175,903 - 175,903 Total liabilities 1,346,098$ 356,690$ 812,012$ 890,776$
CITY OF COMPTONStatement of Changes in Assets and Liabilities
For the Year Ended June 30, 2009Agency Funds
115

VarianceFinal Actual Positive
Budget Amount (Negative)Revenues: Intergovernmental revenues 1,194,455$ 1,046,119$ (148,336)$
Expenditures: Current - Environmental and human services 1,399,201 1,013,004 386,197
Excess (deficiency) of revenues over (under) expenditures (204,746) 33,115 237,861
Other financing sources (uses): Transfers in - 117,479 93,810 Transfers out - (162,163) (162,163)
Total other financing sources (uses) - (44,684) (68,353)
Net change in fund balance (204,746) (11,569) 169,508
Fund balance, beginning 9,047 9,047 -
Fund deficit, ending (195,699)$ (2,522)$ 169,508$
Note:This is part of Federal Grants Fund.
Workforce Investment Act - WIA FundsBudgetary Comparison Schedule
For the Year Ended June 30, 2009
116

VarianceFinal Actual Positive
Budget Amount (Negative)Revenues: Intergovernmental revenues 7,071,445$ 6,999,078$ (72,367)$ Use of money and property 2,089,000 2,527,132 438,132 Charges for services 803,100 922,781 119,681 Other 4,000 43,104 39,104
Total revenues 9,967,545 10,492,095 524,550
Expenditures: General government 52,639 44,781 7,858 Environmental and human services 10,781,224 9,800,670 980,554
Total expenditures 10,833,863 9,845,451 988,412
Net change in fund balance (866,318) 646,644 (463,862)
Fund deficit, beginning (871,745) (871,475) -
Fund deficit, ending (1,738,063)$ (224,831)$ (463,862)$
Note:This is part of Federal Grants Fund.
Budgetary Comparison ScheduleFor the Year Ended June 30, 2009
Local Housing Authority Fund
117

118
STATISTICAL SECTION

Fiscal Year End
Residential Property
Commercial Property
Industrial Property
Other Property
Unsecured Property
Less Tax-Exempt
Property*Taxable
Assessed Value
Estimated Actual Taxable
Value (1)
Factor of Taxable Assessed Value (1)
2002-03 $1,487,562,249 $25,914,251 $42,363,139 $34,131,122 $33,172,349 $74,862,864 $1,548,280,246 $0 0.0000002003-04 1,587,118,445 27,212,212 33,203,304 35,036,465 32,262,720 76,705,730 1,638,127,416 0 0.0000002004-05 1,717,312,459 29,536,516 37,838,444 36,929,634 30,769,653 79,771,512 1,772,615,194 0 0.0000002005-06 1,955,069,437 32,781,604 42,109,754 44,070,029 27,791,117 80,106,898 2,021,715,043 0 0.0000002006-07 2,270,868,570 38,961,878 46,197,304 45,054,789 34,767,150 83,271,158 2,352,578,533 2,521,823,033 1.0719402007-08 2,607,691,757 43,459,744 52,185,046 49,212,595 31,234,734 85,196,819 2,698,587,057 3,027,706,734 1.1219602008-09 2,754,412,213 45,160,523 55,308,244 70,843,223 26,866,528 81,650,818 2,870,939,913 3,091,818,546 1.076936
Source: Los Angeles County Assessor data, MuniServices, LLC 1) Estimated Actual Value is derived from a series of calculations comparing median assessed values from 1940 to current median sale prices. Based on these calculations a multiplier value was extrapolated and applied to current assessed values. *Public Utility values are excluded from these figures.
City of ComptonCity Only Assessed Value and Estimated Actual Value of Taxable Property
Last Seven Fiscal Years
119

Fiscal Year End
Residential Property
Commercial Property
Industrial Property
Other Property
Unsecured Property
Less Tax-Exempt
Property*Taxable
Assessed Value
Estimated Actual
Taxable Value (1)
Factor of Taxable Assessed Value (1)
2002-03 $174,191,038 $229,217,018 $712,398,661 $59,713,143 $280,739,573 $22,455,533 $1,433,803,900 $0 0.0000002003-04 186,167,404 253,606,166 755,311,840 65,420,742 275,158,275 26,870,958 1,508,793,469 0 0.0000002004-05 198,653,512 263,582,644 785,625,886 65,915,972 223,915,191 26,474,886 1,511,218,319 0 0.0000002005-06 224,035,653 287,407,198 827,228,450 80,683,914 218,541,063 27,921,517 1,609,974,761 0 0.0000002006-07 284,376,073 301,234,054 868,405,005 86,656,421 263,126,855 31,663,643 1,772,134,765 1,899,622,140 1.0719402007-08 330,248,972 345,774,321 1,031,731,661 99,576,536 230,898,567 34,303,386 2,003,926,671 2,248,325,568 1.1219602008-09 348,497,161 368,665,448 1,112,151,081 105,473,012 263,035,520 38,414,540 2,159,407,682 2,325,543,871 1.076936
Source: Los Angeles County Assessor data, MuniServices, LLC1) Estimated Actual Value is derived from a series of calculations comparing median assessed values from 1940 to current median sale prices. Based on these calculations a multiplier value was extrapolated and applied to current assessed values. *Public Utility values are excluded from these figures.
City of ComptonRDA Only Assessed Value and Estimated Actual Value of Taxable Property
Last Seven Fiscal Years
120

Fiscal Year End
Residential Property
Commercial Property
Industrial Property
Other Property
Unsecured Property
Less Tax-Exempt
Property*Taxable
Assessed Value
Total Direct Tax
Rate (1)
Estimated Actual Taxable
Value (2)
Factor of Taxable Assessed Value (2)
2002-03 $1,661,753,287 $255,131,269 $754,761,800 $93,844,265 $313,911,922 $97,318,397 $2,982,084,146 0.100407 $0 0.0000002003-04 1,773,285,849 280,818,378 788,515,144 100,457,207 307,420,995 103,576,688 3,146,920,885 0.100407 0 0.0000002004-05 1,915,965,971 293,119,160 823,464,330 102,845,606 254,684,844 106,246,398 3,283,833,513 0.100407 0 0.0000002005-06 2,179,105,090 320,188,802 869,338,204 124,753,943 246,332,180 108,028,415 3,631,689,804 0.100407 0 0.0000002006-07 2,555,244,643 340,195,932 914,602,309 131,711,210 297,894,005 114,934,801 4,124,713,298 0.100407 4,421,445,173 1.0719402007-08 2,937,940,729 389,234,065 1,083,916,707 148,789,131 262,133,301 119,500,205 4,702,513,728 0.100407 5,276,032,302 1.1219602008-09 3,102,909,374 413,825,971 1,167,459,325 176,316,235 289,902,048 120,065,358 5,030,347,595 0.100407 5,417,362,418 1.076936
Source: Los Angeles County Assessor data, MuniServices, LLC1) Total direct tax rate is the city share of the 1% Proposition 13 tax only for TRA 02800.2) Estimated Actual Value is derived from a series of calculations comparing median assessed values from 1940 to current median sale prices. Based on these calculations a multiplier value was extrapolated and applied to current assessed values. *Public Utility values are excluded from these figures.
City of ComptonCitywide Assessed Value and Estimated Actual Value of Taxable Property
Last Seven Fiscal Years
121

Category 1999-00 2000-01 2001-02 2002-03 2003-04 2004-05 2005-06 2006-07 2007-08 2008-09Residential $0 $0 $0 $1,598,700,761 $1,706,264,217 $1,847,830,512 $2,110,499,767 $2,482,705,990 $2,864,881,847 $3,029,124,163Industrial 0 0 0 754,529,726 788,104,749 823,223,745 868,834,383 914,160,400 1,083,459,243 1,166,993,133Commercial 0 0 0 250,661,939 276,414,335 287,955,272 314,761,914 335,735,179 383,207,137 408,498,994Institutional 0 0 0 16,610,030 17,304,247 18,406,517 21,687,604 20,709,463 20,984,072 25,975,815Vacant 0 0 0 34,236,838 41,278,219 40,597,698 54,205,782 57,586,889 62,393,943 62,156,315Recreational 0 0 0 4,472,794 2,966,861 3,012,876 4,004,512 4,084,594 6,621,726 6,754,152Government 0 0 0 2,746,296 0 0 910,000 928,200 1,775,000 0Unknown 0 0 0 3,344,225 6,761,625 7,884,728 10,446,301 10,944,017 17,366,732 17,930,429Miscellaneous 0 0 0 2,960,915 539,513 395,653 403,557 411,618 588,142 428,228Rural 0 0 0 0 27,024 6,868 7,004 7,143 7,285 7,429Possessory Interest 0 0 0 26,843,118 18,318,509 19,942,585 24,109,115 27,615,264 22,132,471 23,558,944
Net Secured Value 0 0 0 2,695,106,642 2,857,979,299 3,049,256,454 3,409,869,939 3,854,888,757 4,463,417,598 4,741,427,602
Unsecured Value 0 0 0 313,820,622 307,260,095 254,519,644 245,928,980 297,439,805 261,228,601 288,919,993Net Taxable Value $0 $0 $0 $3,008,927,264 $3,165,239,394 $3,303,776,098 $3,655,798,919 $4,152,328,562 $4,724,646,199 $5,030,347,595
City of ComptonNet Assessed Value of Property by Use Code
Last Seven Fiscal Years
Source: Los Angeles County Assessor data, MuniServices, LLCUse code categories are based on Los Angeles County Assessor's data
122

123
$0
$1,000,000
$2,000,000
$3,000,000
$4,000,000
$5,000,000
$6,000,000
In T
hous
ands
2002-03 2003-04 2004-05 2005-06 2006-07 2007-08 2008-09
Fiscal Year
Assessed Value By Land Use Code
Residential Industrial Commercial Institutional
Vacant Recreational Government Unknown
Miscellaneous Rural Possessory Interest Unsecured Value

1999-00 2000-01 2001-02 2002-03 2003-04 2004-05 2005-06 2006-07 2007-08 2008-09Basic City and County Levy CITY OF COMPTON 0.000000 0.000000 0.000000 0.100407 0.100407 0.100407 0.100407 0.100407 0.100407 0.100407 COUNTY OF LOS ANGELES 0.000000 0.000000 0.000000 0.899593 0.899593 0.899593 0.899593 0.899593 0.899593 0.899593
TOTAL 0.000000 0.000000 0.000000 1.000000 1.000000 1.000000 1.000000 1.000000 1.000000 1.000000
Override Assessments CITY - COMPTON 0.000000 0.000000 0.000000 0.451632 0.451632 0.451632 0.000000 0.451632 0.451632 0.451632 COUNTY 0.000000 0.000000 0.000000 0.000000 0.000000 0.000000 0.000000 0.000663 0.000000 0.000000 UNIFIED SCHOOLS 0.000000 0.000000 0.000000 0.000000 0.055700 0.062613 0.000000 0.033825 0.059759 0.062375 COMMNTY COLLEGE 0.000000 0.000000 0.000000 0.000000 0.027143 0.003963 0.000000 0.019747 0.017629 0.023940 FLOOD CONTROL 0.000000 0.000000 0.000000 0.000881 0.000462 0.000245 0.000000 0.000052 0.000000 0.000000 METRO WATER DIST 0.000000 0.000000 0.000000 0.000000 0.000000 0.000000 0.000000 0.004700 0.004500 0.004300 DETENTION FAC 0.000000 0.000000 0.000000 0.001033 0.000992 0.000923 0.000000 0.000000 0.000000 0.000000 COMPTON AREA 1110 0.000000 0.000000 0.000000 0.006700 0.006100 0.005800 0.000000 0.000000 0.000000 0.000000
TOTAL 0.000000 0.000000 0.000000 0.460246 0.542029 0.525176 0.000000 0.510619 0.533520 0.542247
TOTAL TAX RATE 0.000000 0.000000 0.000000 1.460246 1.542029 1.525176 1.000000 1.510619 1.533520 1.542247
Source: Los Angeles County Auditor/Controller data, MuniServices, LLCTRA 02800 is represented for this reportRates are not adjusted for ERAF
City of ComptonDirect and Overlapping Property Tax Rates
Last Ten Fiscal Years
124

Fiscal Year
Population (1)
Personal Income (2)
Per Capita Personal
Income (2)Median
Age
**Public School
Enrollment
County Unemployment
Rate (%) (3)
City Unemployment
Rate (%) (3)
County Population
(1)
Median Sales Price -
SFR
Median Household
Income2000-01 93,493 $971,298,777 $10,389 - 33,171 5.7% 10.0% - - -2001-02 94,481 - - - - 6.8% 11.9% - - -2002-03 95,263 - - - - 7.0% 12.2% - - -2003-04 95,882 - - - - 6.5% 11.4% - - -2004-05 96,033 1,211,648,361 12,617 27.8 34,673 5.3% 9.5% - - -2005-06 95,659 1,149,247,226 12,014 25.9 34,293 4.7% 8.5% - - -2006-07 99,451 1,295,249,824 13,024 24.7 - 4.7% 8.4% 10,275,914 372,400 38,6822007-08 99,242 1,226,234,152 12,356 24.7 27,864 5.0% 8.9% 10,363,850 - -2008-09 99,431 1,312,588,631 13,201 25.9 27,369 12.6% 21.2% 10,301,658 - -
City of ComptonDemographic and Economic Statistics
Last Nine Fiscal Years
Source: 2008-09 thru 2006-07, MuniServices, LLC1) Population Projections are provided by the California Department of Finance Projections.2) Income Data is provided by the United States Census Data and is adjusted for inflation.3) Unemployment and Total Employment Data are provided by the EDD's Bureau of Labor Statistics Department.**Student Enrollment reflects the total number of students enrolled in the Compton Unified School District. Any other school districts within the City are not accounted for in this statistic.
125

TaxpayerTaxable Value
($)
Percent of Total City Taxable
Value (%)Taxable
Value ($)
Percent of Total City Taxable
Value (%)PR I Dominguez Hills 154,480,020 3.07% 0 0.00%AMB Property L P 151,051,860 3.00% 0 0.00%Ralphs Grocery Co 89,178,526 1.77% 0 0.00%South Bay Industrials Co L L C 73,727,278 1.47% 0 0.00%Prologis California I LLC 72,857,575 1.45% 0 0.00%Los Angeles Industrial Park LLC 43,911,000 0.87% 0 0.00%CCL Plastic Packaging Sedaspec 28,792,293 0.57% 0 0.00%Inland Empire Realty Holding C 27,206,460 0.54% 0 0.00%Faec Holdings 398417 LLC 22,625,000 0.45% 0 0.00%Walnut Industrial Park LLC 21,853,500 0.43% 0 0.00%Owens Corning Roofing 21,196,903 0.42% 0 0.00%Compton Commercial Dev 17,828,294 0.35% 0 0.00%Girardi Financial LLC 16,826,388 0.33% 0 0.00%Valassis Direct Mail Inc. 14,165,039 0.28% 0 0.00%Kraco Enterprise Inc. 13,890,714 0.28% 0 0.00%Lake Plaza LLC 12,630,288 0.25% 0 0.00%Prism IQ Partners LLC 12,109,310 0.24% 0 0.00%Entertainment Services 12,020,880 0.24% 0 0.00%Linde Inc. 10,945,220 0.22% 0 0.00%Rancho Way Properties LLC 10,914,000 0.22% 0 0.00%CSME Partners LLC 10,850,000 0.22% 0 0.00%Demenno Kerdoon 10,655,033 0.21% 0 0.00%Knickerbocker Properties Inc X 10,432,797 0.21% 0 0.00%GATX Tank Storage Terminals Co 10,247,134 0.20% 0 0.00%San Ysidro Investments II LLC 10,212,566 0.20% 0 0.00% Total Top 25 Taxpayers 880,608,078 17.51% 0 0.00%
Total Taxable Value 5,030,347,595 100.00% 0 100.00%
2008-09 1999-00
Source: Los Angeles County Assessor data, MuniServices, LLC
City of ComptonPrincipal Property Tax Payers
Current Fiscal Year and Nine Years Ago
126
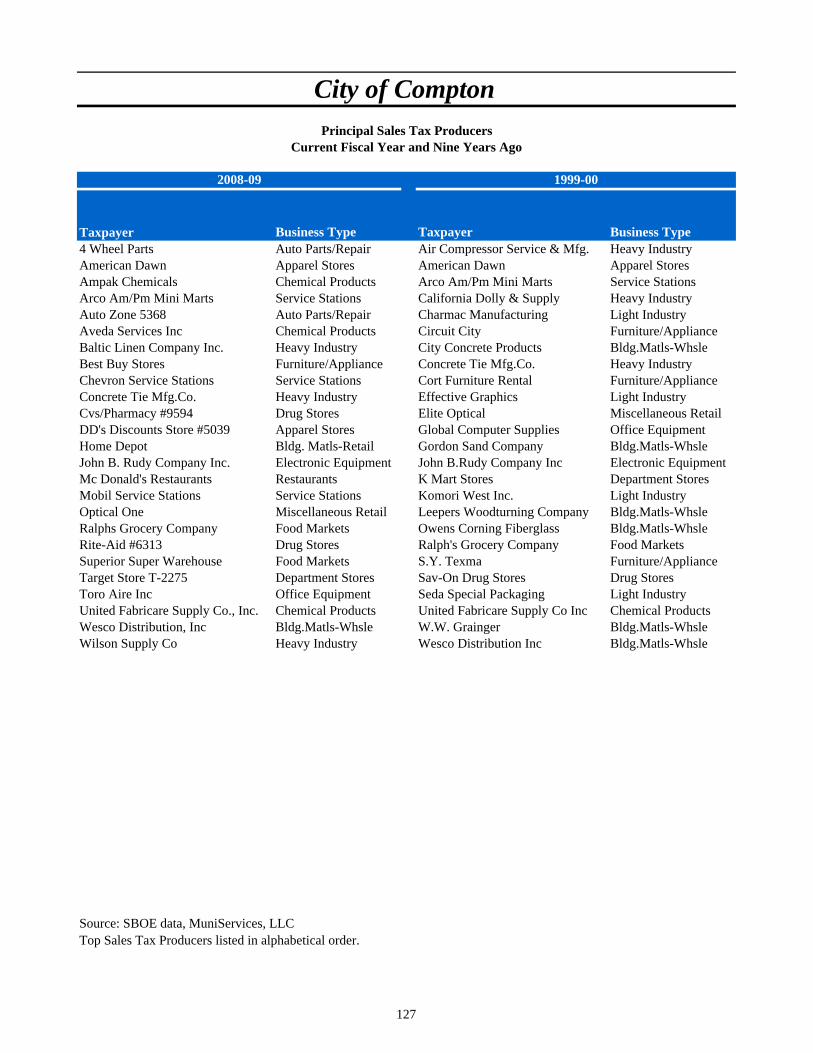
Taxpayer Business Type Taxpayer Business Type4 Wheel Parts Auto Parts/Repair Air Compressor Service & Mfg. Heavy IndustryAmerican Dawn Apparel Stores American Dawn Apparel StoresAmpak Chemicals Chemical Products Arco Am/Pm Mini Marts Service StationsArco Am/Pm Mini Marts Service Stations California Dolly & Supply Heavy IndustryAuto Zone 5368 Auto Parts/Repair Charmac Manufacturing Light IndustryAveda Services Inc Chemical Products Circuit City Furniture/ApplianceBaltic Linen Company Inc. Heavy Industry City Concrete Products Bldg.Matls-WhsleBest Buy Stores Furniture/Appliance Concrete Tie Mfg.Co. Heavy IndustryChevron Service Stations Service Stations Cort Furniture Rental Furniture/ApplianceConcrete Tie Mfg.Co. Heavy Industry Effective Graphics Light IndustryCvs/Pharmacy #9594 Drug Stores Elite Optical Miscellaneous RetailDD's Discounts Store #5039 Apparel Stores Global Computer Supplies Office EquipmentHome Depot Bldg. Matls-Retail Gordon Sand Company Bldg.Matls-WhsleJohn B. Rudy Company Inc. Electronic Equipment John B.Rudy Company Inc Electronic EquipmentMc Donald's Restaurants Restaurants K Mart Stores Department StoresMobil Service Stations Service Stations Komori West Inc. Light IndustryOptical One Miscellaneous Retail Leepers Woodturning Company Bldg.Matls-WhsleRalphs Grocery Company Food Markets Owens Corning Fiberglass Bldg.Matls-WhsleRite-Aid #6313 Drug Stores Ralph's Grocery Company Food MarketsSuperior Super Warehouse Food Markets S.Y. Texma Furniture/ApplianceTarget Store T-2275 Department Stores Sav-On Drug Stores Drug StoresToro Aire Inc Office Equipment Seda Special Packaging Light IndustryUnited Fabricare Supply Co., Inc. Chemical Products United Fabricare Supply Co Inc Chemical ProductsWesco Distribution, Inc Bldg.Matls-Whsle W.W. Grainger Bldg.Matls-WhsleWilson Supply Co Heavy Industry Wesco Distribution Inc Bldg.Matls-Whsle
2008-09 1999-00
Source: SBOE data, MuniServices, LLCTop Sales Tax Producers listed in alphabetical order.
City of ComptonPrincipal Sales Tax Producers
Current Fiscal Year and Nine Years Ago
127