city of bell gardens, california … of bell gardens, california comprehensive annual financial...
TRANSCRIPT

CITY OF BELL GARDENS, CALIFORNIA
COMPREHENSIVE ANNUAL FINANCIAL REPORT
JUNE 30, 2011
203 North Brea BlvdSuite 203Brea, CA 92821
Lance Soll & Lunghard, LLP
41185 Golden Gate CircleSuite 103Murrieta, CA 92562

CITY OF BELL GARDENS, CALIFORNIA
COMPREHENSIVE ANNUAL FINANCIAL REPORT
JUNE 30, 2011
PREPARED BY:
FINANCE & ADMINISTRATIVE SERVICES DEPARTMENT

CITY OF BELL GARDENS
COMPREHENSIVE ANNUAL FINANCIAL REPORT
JUNE 30, 2011
TABLE OF CONTENTS Page Number INTRODUCTORY SECTION
Letter of Transmittal ............................................................................................................................ i City Officials ....................................................................................................................................... iv
Organization Chart ............................................................................................................................ v FINANCIAL SECTION Independent Auditor’s Report .................................................................................................................. 1 Management’s Discussion and Analysis .................................................................................................. 3 Basic Financial Statements: Government-Wide Financial Statements:
Statement of Net Assets ........................................................................................................... 11
Statement of Activities ............................................................................................................... 12 Fund Financial Statements: Balance Sheet - Governmental Funds ...................................................................................... 14 Reconciliation of the Balance Sheet of Governmental Funds to the Statement of Net Assets .............................................................. 16 Statement of Revenues, Expenditures and Changes in Fund Balances - Governmental Funds ..................................................................................... 18 Reconciliation of the Statement of Revenues, Expenditures and Changes in Fund Balances of Governmental Funds to the Statement of Activities ................................................................................................................................ 20
Budgetary Comparison Statement - General Fund .................................................................. 21 Statement of Net Assets - Proprietary Funds ........................................................................... 22 Statement of Revenues, Expenses and Changes in Fund Net Assets - Proprietary Funds ...................................................................................................................... 23
Statement of Cash Flows - Proprietary Funds .......................................................................... 24 Notes to Financial Statements ............................................................................................................... 25

CITY OF BELL GARDENS
COMPREHENSIVE ANNUAL FINANCIAL REPORT
JUNE 30, 2011
TABLE OF CONTENTS
Page Number COMBINING AND INDIVIDUAL FUND STATEMENTS AND SCHEDULES
Combining Balance Sheet - Nonmajor Governmental Funds ......................................................... 56 Combining Statement of Revenues, Expenditures and
Changes in Fund Balances - Nonmajor Governmental Funds ........................................................ 64
Budgetary Comparison Schedules - Special Revenue Funds: Public Safety Augmentation ...................................................................................................... 71 COPS State (SLESF) ................................................................................................................ 72 State Gas Tax ........................................................................................................................... 73 Asset Forfeiture ......................................................................................................................... 74 Waste Management .................................................................................................................. 75 Community Development Block Grant ...................................................................................... 76 Proposition “A” .......................................................................................................................... 77 Proposition “C” .......................................................................................................................... 78 Air Quality Improvement ............................................................................................................ 79 Recycling Grants ....................................................................................................................... 80 Academic Pursuit ...................................................................................................................... 81 Separated Employee Benefits .................................................................................................. 82 Post Employment Benefits ........................................................................................................ 83 Measure R ................................................................................................................................. 84 COPS 2010 Grants ................................................................................................................... 85 Anson Ford Park ....................................................................................................................... 86
Budgetary Comparison Schedule – Capital Projects Funds:
Transportation Development Act .............................................................................................. 87 Capital Improvement Projects ................................................................................................... 88 Community Development Commission ..................................................................................... 89
Budgetary Comparison Schedule – Debt Service Funds:
Community Development Commission ..................................................................................... 90

CITY OF BELL GARDENS
COMPREHENSIVE ANNUAL FINANCIAL REPORT
JUNE 30, 2011
TABLE OF CONTENTS
Page Number STATISTICAL SECTION
Net Assets by Component ............................................................................................................... 93 Changes in Net Assets .................................................................................................................... 94 Program Revenues by Function/Program ....................................................................................... 96 Fund Balances - Governmental Funds ............................................................................................ 97 Changes in Fund Balances - Governmental Funds ........................................................................ 98 Tax Revenues by Source - Governmental Funds ......................................................................... 100 Assessed Value and Estimated Actual Value of Taxable Property ............................................... 101 Direct and Overlapping Property Tax Rates .................................................................................. 102 Principal Property Tax Payers ....................................................................................................... 103 Property Tax Levies and Collections ............................................................................................. 104 Taxable Sales by Category ........................................................................................................... 105 Direct and Overlapping Sales Tax Rates ...................................................................................... 106 Principal Sales Tax Remitters ....................................................................................................... 107 Ratios of Outstanding Debt by Type.............................................................................................. 108 Ratios of General Bonded Debt Outstanding ................................................................................ 109 Direct and Overlapping Governmental Activities Debt .................................................................. 110 Legal Debt Margin Information ...................................................................................................... 111 Pledged Revenue Coverage ......................................................................................................... 112 Demographic and Economic Statistics .......................................................................................... 113 Full-time-Equivalent City Government Employees by Function/Program ..................................... 114 Operating Indicators by Function/Program .................................................................................... 115 Capital Asset Statistics by Function/Program ............................................................................... 116

THIS PAGE INTENTIONALLY LEFT BLANK


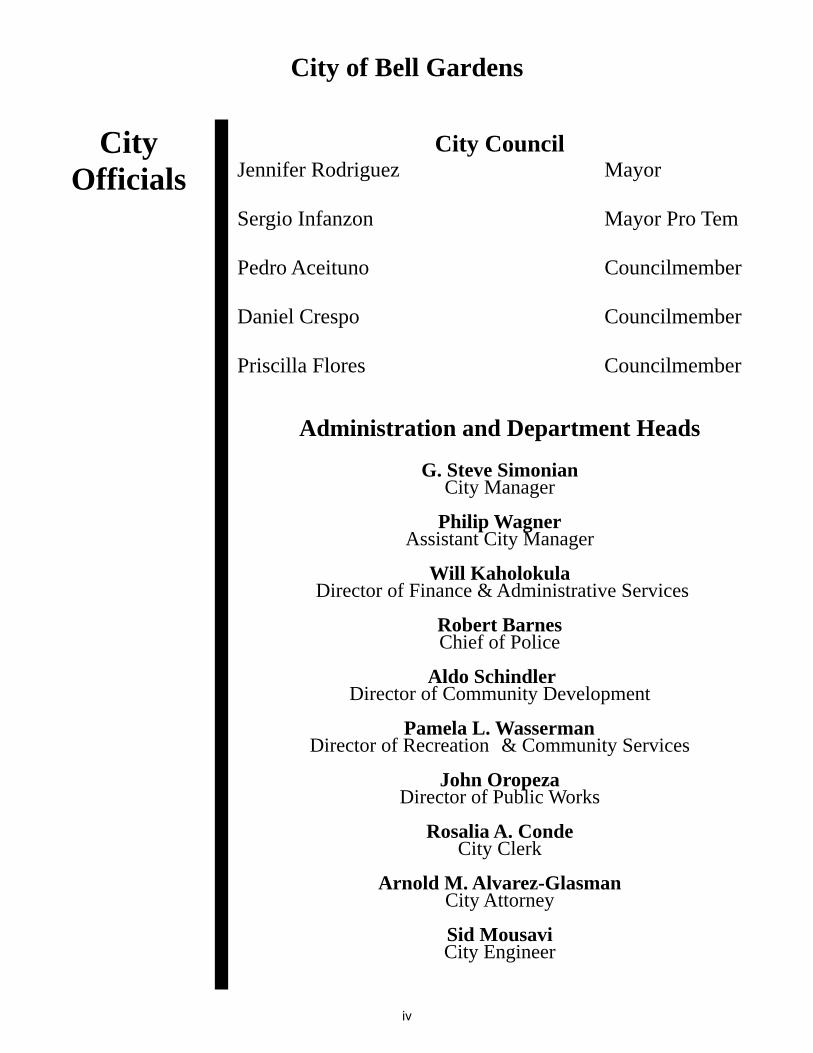
City Officials
City Council Jennifer Rodriguez Mayor Sergio Infanzon Mayor Pro Tem Pedro Aceituno Councilmember Daniel Crespo Councilmember Priscilla Flores Councilmember
Administration and Department Heads
G. Steve Simonian City Manager
Philip Wagner
Assistant City Manager
Will Kaholokula Director of Finance & Administrative Services
Robert Barnes Chief of Police
Aldo Schindler
Director of Community Development
Pamela L. Wasserman Director of Recreation & Community Services
John Oropeza
Director of Public Works
Rosalia A. Conde City Clerk
Arnold M. Alvarez-Glasman
City Attorney
Sid Mousavi City Engineer
City of Bell Gardens
iv

City of Bell Gardens
Organization Chart
Residents of Bell Gardens
Mayor and City Council
5 Elected Officials 1 Secretary
City Clerk 2 Full Time
City Manager
4 Full Time
City Attorney
Police
77 Full Time
Finance & Adm. Services
8 Full Time
Recreation & Community Services
12 Full Time
Public Works 30 Full Time
Community Development
13 Full Time
v

THIS PAGE INTENTIONALLY LEFT BLANK
vi

INDEPENDENT AUDITOR’S REPORT To The Honorable Mayor and Members of the City Council The City of Bell Gardens, California We have audited the accompanying financial statements of the governmental activities, the business-type activities, each major fund and the aggregate remaining fund information of the City of Bell Gardens, California, as of and for the year ended June 30, 2011, which collectively comprise the City’s basic financial statements as listed in the accompanying table of contents. These financial statements are the responsibility of the City of Bell Gardens’ management. Our responsibility is to express opinions on these financial statements based on our audit. We conducted our audit in accordance with auditing standards generally accepted by the United States of America and the standards applicable to financial audits contained in the Government Auditing Standards issued by the Comptroller General of the United States. Those standards require that we plan and perform the audit to obtain reasonable assurance about whether the financial statements are free of material misstatement. An audit includes examining, on a test basis, evidence supporting the amounts and disclosures in the financial statements. An audit also includes assessing the accounting principles used and significant estimates made by management, as well as evaluating the overall financial statement presentation. We believe that our audit provides a reasonable basis for our opinion. In our opinion, the financial statements referred to above present fairly, in all material respects, the respective financial position of the governmental activities, the business-type activities, each major fund and the aggregate remaining fund information of the City of Bell Gardens, California, as of June 30, 2011, and the respective changes in financial position and cash flows, where applicable, and the respective budgetary comparison for the General Fund thereof for the year then ended in conformity with accounting principles generally accepted in the United States of America. We would like to draw the reader’s attention to Note 15 – “California Redevelopment Agency Dissolution”. The note provides information on two bills passed, AB1X26 and AB1X27 which dissolve redevelopment agencies and provide an option to avoid dissolution by making certain defined payments. The Note also provides further information on the California Supreme Court ruling dated December 29, 2011 in regards to these two bills. In accordance with Government Auditing Standards, we have also issued our report dated January 24, 2012, on our consideration of the City of Bell Gardens’ internal control over financial reporting and our tests of its compliance with certain laws, regulations, contracts, grant agreements and other matters. The purpose of that report is to describe the scope of our testing of internal control over financial reporting and compliance and the results of that testing, and not to provide an opinion on the internal control over financial reporting or on compliance. That report is an integral part of an audit performed in accordance with Government Auditing Standards and should be considered in assessing the results of our audit.
Lance, Soll & Lunghard, LLP 203 North Brea Boulevard • Suite 203 • Brea, CA 92821 • TEL: 714.672.0022 • Fax: 714.672.0331 www.lslcpas.comOrange County Temecula Valley Silicon Valley
Brandon W. Burrows, CPADavid E. Hale, CPA, CFP A Professional CorporationDonald G. Slater, CPARichard K. Kikuchi, CPASusan F. Matz, CPAShelly K. Jackley, CPABryan S. Gruber, CPADeborah A. Harper, CPA

To The Honorable Mayor and Members of the City Council The City of Bell Gardens, California Accounting principles generally accepted in the United States of America require that the management's discussion and analysis as listed in the table of contents be presented to supplement the basic financial statements. Such information, although not a part of the basic financial statements, is required by the Governmental Accounting Standards Board, who considers it to be an essential part of financial reporting for placing the basic financial statements in an appropriate operational, economic, or historical context. We have applied certain limited procedures to the required supplementary information in accordance with auditing standards generally accepted in the United States of America, which consisted of inquiries of management about the methods of preparing the information and comparing the information for consistency with management's responses to our inquiries, the basic financial statements, and other knowledge we obtained during our audit of the basic financial statements. We do not express an opinion or provide any assurance on the information because the limited procedures do not provide us with sufficient evidence to express an opinion or provide any assurance. Our audit was conducted for the purpose of forming opinions on the financial statements that collectively comprise the City’s financial statements as a whole. The introductory section, combining and individual nonmajor fund financial statements and statistical section, are presented for purposes of additional analysis and are not a required part of the financial statements. The combining and individual nonmajor fund financial statements are the responsibility of management and were derived from and relate directly to the underlying accounting and other records used to prepare the financial statements. The information has been subjected to the auditing procedures applied in the audit of the financial statements and certain additional procedures, including comparing and reconciling such information directly to the underlying accounting and other records used to prepare the financial statements or to the financial statements themselves, and other additional procedures in accordance with auditing standards generally accepted in the United States of America. In our opinion, the information is fairly stated in all material respects in relation to the financial statements as a whole. The introductory and statistical sections have not been subjected to the auditing procedures applied in the audit of the basic financial statements and, accordingly, we do not express an opinion or provide any assurance on them.
Brea, California January 24, 2012
2

CITY OF BELL GARDENS
MANAGEMENT’S DISCUSSION AND ANALYSIS As management of the City of Bell Gardens, we offer readers of the City’s financial statements this narrative overview and analysis of the financial activities of the City of Bell Gardens for the fiscal year ended June 30, 2011. We encourage readers to consider the information presented here in conjunction with additional information that we have furnished in our letter of transmittal and the City’s financial statements. FINANCIAL HIGHLIGHTS
� At June 30, 2011, the City’s net assets (excess of assets over liabilities) were $101.1 million. Of this amount, $5.1 million is available to meet the City’s ongoing operations.
� During the fiscal year ended June 30, 2011, the City’s total net assets decreased by $4.6 million
of which a majority is represented in the governmental activities. OVERVIEW OF THE FINANCIAL STATEMENTS This discussion and analysis is intended to serve as an introduction to the City’s basic financial statements, which are comprised of three components: 1) Government-Wide Financial Statements, 2) Fund Financial Statements, and 3) Notes to the Basic Financial Statements. This report also contains other supplementary information in addition to the basic financial statements themselves. Government-Wide Financial Statements The Government-Wide Financial Statements present the financial picture of the City and provide readers with a broad view of the City’s finances. These statements present governmental activities and business type activities separately and include all assets of the City as well as all liabilities. The Statement of Net Assets and the Statement of Activities report information about the City as a whole and about its activities. These statements include all assets and liabilities of the City using the accrual basis of accounting, which is similar to the accounting used by most private-sector companies. All of the current year’s revenues and expenses are taken into account, regardless of when cash is received or paid. The Statement of Net Assets presents information on all of the City’s assets and liabilities, with the difference between the two reported as net assets. Over time, increases in net assets may serve as a useful indicator of whether the financial position of the City is improving or deteriorating. The Statement of Activities presents information showing how the City’s net assets changed during the year. All changes in net assets are reported as soon as the underlying event occurs, regardless of timing of related cash flows. In the Statement of Net Assets and the Statement of Activities, we separate the City activities as follows: Governmental Activities Most of the City’s basic services are reported in this category, including general government, public safety, public works, community development, and recreation. Property, business, hotel and sales taxes, club card fees, interest income, and state and federal grants finance these activities.
3

Business-Type Activities The City charges a fee to customers to cover all or most of the costs of certain services it provides. The City’s water utility and golf course operations are reported as business-type activities. The government-wide financial statements include not only the City itself (known as the primary government), but also two legally separate entities, the Bell Gardens Community Development Commission and the Bell Gardens Financing Authority. The City is financially accountable for these entities and financial information for these blended component units are reported within the financial information presented for the primary government itself. Fund Financial Statements The fund financial statements provide detailed information about the City’s most significant funds – not the City as a whole. Some funds are required to be established by State law and bond covenants. However, management establishes many other funds to help it control and manage money for particular purposes or to show that it is meeting legal responsibilities for using certain taxes, grants, and other funding sources. The fund financial statements include statements for each of the three categories of activities – governmental, proprietary and fiduciary. The governmental activities are prepared using the current financial resources measurement focus and the modified accrual basis of accounting. The business-type activities are prepared using the economic resources measurement focus and the accrual basis of accounting. The fiduciary activities are agency funds, which only report assets and liabilities and do not have a measurement focus. Governmental Funds—The Governmental Funds are used to account for essentially the same functions reported as governmental activities in the Government-Wide Financial Statements. However, unlike the Government-Wide Financial Statements, Governmental Funds Financial Statements focus on current financial resources, which emphasize near-term inflows and outflows of spendable resources as well as balances of spendable resources at the end of the fiscal year. This information is essential in evaluating the City’s near-term financial requirements. To better understand the City’s long-term and short-term requirements, it is useful to compare the City’s Governmental Fund Statements with the governmental activities in the Government-Wide Financial Statements. A reconciliation of the statements is provided for both the governmental fund balance sheet and the statement of revenues, expenditures and changes in fund balances to facilitate this comparison. The City of Bell Gardens maintains 27 governmental funds. Information is presented separately in the governmental fund balance sheet and in the governmental fund statement of revenues, expenditures, and changes in fund balances for the General Fund, the Community Development Commission Capital Projects Fund, and the Community Development Commission Debt Service Fund which are reported as major funds. Data from the other 24 governmental funds are combined into a single, aggregate presentation. Individual fund data for each of these non-major governmental funds is provided in the form of combining statements in the Supplementary Information section of this report. The City adopts an annual appropriated budget for its General fund. A budgetary comparison statement has been provided for the General fund to demonstrate its compliance with this budget. Proprietary Funds—The City maintains only one type of proprietary fund, the enterprise fund for its water utility and golf course operations. Enterprise funds are used to report the same functions presented as business-type activities in government-wide financial statements.
4

Notes to the Basic Financial Statements The notes provide additional information that is essential to a full understanding of the data provided in the Government-Wide and Fund Financial Statements. The combining statements referred to earlier in connection with the non-major governmental funds and enterprise funds are presented immediately following the required supplementary information. GOVERNMENT-WIDE FINANCIAL ANALYSIS Statement of Net Assets For the fiscal year ended June 30, 2011, net assets of the City were $101.1 million, which is a decrease of $4.6 million from the prior year. The following is the condensed Statement of Net Assets for the fiscal years ended June 30, 2011 and 2010.
Approximately $78 million (77%) of the City’s net assets consist of the City’s investment in capital assets such as land, buildings, machinery and equipment, less any related debt to acquire those assets that is still outstanding. These assets are used to provide services to the citizens of the City of Bell Gardens; therefore, they are not available for future spending. Although the City’s investment in capital assets is reported net of related debt, it should be noted that the resources needed to repay this debt must be provided from other sources, since capital assets themselves cannot be used to liquidate these liabilities.
Net Assets As of June 30
2010 2011 2010 2011 2010 2011
Current and other assets $ 38,509,707 $ 35,914,168 $ 939,030 $ 806,334 $ 39,448,737 $ 36,720,502Capital assets 109,692,870 109,372,619 7,486,262 7,337,699 117,179,132 116,710,318
Total Assets 148,202,577 145,286,787 8,425,292 8,144,033 156,627,869 153,430,820
Long-term liabilities outstanding 40,969,027 42,498,683 3,846,314 3,642,571 44,815,341 46,141,254Other liabilities 5,787,508 5,807,568 353,045 370,614 6,140,553 6,178,182
Total Liabilities 46,756,535 48,306,251 4,199,359 4,013,185 50,955,894 52,319,436
Net assets:Invested in Capital Assets Net of Related Debt 73,735,338 74,822,075 3,429,948 3,480,128 77,165,286 78,302,203 Restricted 17,088,677 17,354,065 398,434 399,355 17,487,111 17,753,420 Unrestricted 10,622,027 4,804,396 397,551 251,365 11,019,578 5,055,761 Total Net Assets $ 101,446,042 $ 96,980,536 $ 4,225,933 $ 4,130,848 $ 105,671,975 $ 101,111,384
TotalBusiness-type ActivitiesGovernmental Activities
5

Statement of Activities The following is the condensed Statement of Activities and Changes in Net Assets for the fiscal years ended June 30, 2011 and 2010.
City of Bell GardensChanges in Net Assets
2010 2011 2010 2011 2010 2011Revenues:Program revenues:
Charges for services $ 1,380,147 $ 1,651,510 $ 1,411,992 $ 1,401,856 $ 2,792,139 $ 3,053,366Operating grants and contrib. 3,159,241 2,146,983 - - 3,159,241 2,146,983Capital grants and contrib. 3,791,143 1,839,711 10,000 3,801,143 1,839,711
General revenues:Sales taxes 2,030,961 2,321,800 - - Transient occupancy taxes 189,926 221,374 - - Franchise taxes 2,572,707 2,568,428 - - Business license taxes 243,129 280,160 - - Property taxes 4,886,712 4,696,696 - - 4,886,712 4,696,696Other taxes 1,104,418 1,182,332 - - Motor Vehicle in Lieu 3,866,793 3,905,639 - - Use of money and property 6,630,950 3,281,827 6,778 8,664Club card taxes 10,684,933 9,695,632 - - 10,684,933 9,695,632Miscellaneous 303,354 249,606 - - 303,354 249,606
Total Revenues 40,844,414 34,041,698 1,428,770 1,410,520 25,627,522 21,681,994
Expenses:General government 10,175,559 8,821,722 - - 10,175,559 8,821,722Public safety 12,965,767 12,393,794 - - 12,965,767 12,393,794Community development 1,220,075 2,241,756 - - 1,220,075 2,241,756Parks and recreation 2,485,134 2,838,313 - - 2,485,134 2,838,313Public works 9,941,721 10,146,753 - - 9,941,721 10,146,753Interest and fiscal charges 4,857,978 1,972,014 - - 4,857,978 1,972,014Water utility - 1,460,206 1,532,393 1,460,206 1,532,393Golf course - - 251,694 216,584 251,694 216,584
Total Expenses 41,646,234 38,414,352 1,711,900 1,748,977 43,358,134 40,163,329
Increase (decrease) in net assets before transfers (801,820) (4,372,654) (283,130) (338,457) (17,730,612) (18,481,335) Transfers (1,466,556) (243,372) 1,466,556 243,372 - - Changes in Net Assets (2,268,376) (4,616,026) 1,183,426 (95,085) (1,084,950) (4,711,111)
103,714,418 101,596,562 3,042,507 4,225,933 106,756,925 105,822,495Net assets - end of the year $ 101,446,042 $ 96,980,536 $ 4,225,933 $ 4,130,848 $ 105,671,975 $ 101,111,384
Governmental Activities Business-type Activities Total
Net assets - beginning of the year restated
6

Governmental Activities The City’s net assets from governmental activities totaled $96.9 million. The cost of all governmental activities this year was $38.4 million. Overall, the City’s governmental program revenues were $5.6 million. The City paid for the remaining “public benefit” portion of governmental activities with $28.4 million in taxes (some of which could only be used for certain programs) and with other revenues, such as interest earnings and general entitlements. Revenue highlights:
� General Revenues decreased $6.8 million from the prior year mainly due to a decrease in operating and capital grants and the Card Club casino revenue.
� Card Club casino revenue decreased by $1.0 million from the prior year.
� Operating and Capital contributions and grants decreased $2.9 million. This decrease is
principally related to the completion of street improvement projects that were funded by state and federal grants in the prior year.
Expense highlights:
� Expenses decreased overall by $3.2 million. Decreases are a result of a decrease in interest and fiscal charges due to the refinancing in the City’s loan to the RDA which deferred interest earned for the next 3 years.
Business Type Activities The City’s business-type activities decreased net assets by $0.1 million. Key elements of this decrease are as follows: Revenue Highlights:
� Total program revenue in the business-type activities decreased by about $18,000.
Expense Highlights:
� Total expenses in the business-type activities increased $37,000. FUND FINANCIAL STATEMENT ANALYSIS
The City uses fund accounting to ensure and demonstrate compliance with finance-related legal requirements. Governmental Funds The focus of the City’s governmental funds is to provide information on short-term inflows, outflows and balances of spendable resources. Such information is useful in assessing the City’s financing requirements. As of the end of Fiscal Year 2010-11, the City’s governmental funds reported combined ending fund balance deficit of $1.5 million, a decrease of $1.0 million in comparison with the prior fiscal year.
7

Proprietary Funds The City’s proprietary funds provide the same type of information found in the government-wide financial statements, but in more detail. Factors concerning these funds have already been addressed in the discussion of Government-wide Financial Analysis of business-type activities. GENERAL FUND BUDGETARY HIGHLIGHTS The original adopted General fund budget for this fiscal year was $23.61 million and the final amended budget was $23.77 million. Budget amendments totaled less than 1% of the original budget. CAPITAL ASSETS AND DEBT ADMINISTRATION Capital Assets The City of Bell Gardens has $116.7 million invested in the capital assets, as compared to $117.2 million in the prior year. Net decrease in the capital assets is approximately $0.5 million.
2010 2011 2010 2011 2010 2011
Land $ 69,022,714 $ 69,022,714 $ 1,011,000 $ 1,011,000 $ 70,033,714 $ 70,033,714 Buildings 10,758,026 10,224,115 - 10,758,026 10,224,115 Equipment 1,753,295 1,213,899 4,549,926 4,384,837 6,303,221 5,598,736 Construction in Progress 960,509 2,665,779 394,136 429,802 1,354,645 3,095,581 Infrastructure 27,198,326 26,246,112 - - 27,198,326 26,246,112 Intangibles - - 1,531,200 1,512,060 1,531,200 1,512,060
Total $ 109,692,870 $ 109,372,619 $ 7,486,262 $ 7,337,699 $ 117,179,132 $ 116,710,318
Governmental Activities Business-Type Activities Totals
Capital Assets at Year-End(Net of Depreciation)
For the Year Ended June 30
The decrease was primarily due to the increase in Accumulated Depreciation of Fixed Assets for FY 2010-11. For more detailed information, see note 6 to the financial statements.
8

Long-term Debt At year-end, the City had $48.5 million in long-term debts including development fee related obligations, capital lease obligations, other post employment benefits obligation, certificates of participations and compensated absences, as compared to $47.6 million in prior year, a net increase of $0.9 million during the fiscal year. Please refer to Note 7 for further details on the City’s long-term liabilities.
2010 2011 2010 2011 2010 2011
Accrued Leave Payable 2,445,026$ 2,582,495$ -$ -$ 2,445,026$ 2,582,495$ Other post employment obligations 5,174,113 7,492,251 - - 5,174,113 7,492,251 2003 Tax Allocation Bonds Project Area 1
6,080,000 5,720,000 - - 6,080,000 5,720,000
2003 Tax Allocation Bond Central City Project 8,400,000 8,145,000 - - 8,400,000 8,145,000
2005 Revenue Bond Series A Project Area 1 1,535,000 1,465,000 - - 1,535,000 1,465,000
2005 Revenue Bond Series A Central City Project 2,895,000 2,830,000 - - 2,895,000 2,830,000
Promissory Note- Bear Stearns 9,052,911 8,890,267 - - 9,052,911 8,890,267 Promissory Note- County of LA 4,079,000 3,731,000 - - 4,079,000 3,731,000 2006 Certificates of Participation 3,590,000 3,510,000 - - 3,590,000 3,510,000 2004 Water Refunding Revenue Bonds - 4,220,000 4,010,000 4,220,000 4,010,000
Unamortized bond premium 437,749 364,022 5,637 5,250 443,386 369,272 Unamortized bond discount (112,128) (104,745) (169,323) (157,679) (281,451) (262,424)
Total 43,576,671$ 44,625,290$ 4,056,314$ 3,857,571$ 47,632,985$ 48,482,861$
Governmental Activities Business-Type Activities Totals
Outstanding Long-Term DebtFor Fiscal Year Ended June 30
ECONOMIC FACTORS AND NEXT YEAR’S BUDGETS The City of Bell Gardens’ finances are dependent on the local, national and international economies. Even though over 40% of the City’s revenues is received from one local source, the widespread effect of a negative downturn in the economies will have an effect on the City’s finances. The fourth quarter forecast of 2011 completed by the UCLA Anderson School of Management, provided an outlook for the next five quarters that will provide a GDP growth rate for the nation that will be at a ‘below trend rate’. More specifically, the forecast presents a 2% growth rate over the next five quarters. The forecast for California is for “the recent surge in employment to abate while slow growth persists on average through 2012.” Although the outlook is not overwhelmingly positive, the outlook points out “that recent economic data has improved” taking the threat of a double-dip recession off the table. The Operating Budget for fiscal year 2011-12 reflects the City’s commitment to foster steady, controlled growth and provide the highest level of service to the community within the City’s financial constraint and is consistent with the City Council’s goals and objectives. Questions or requests for information regarding the City of Bell Gardens’ 2011-12 budget should be sent to the Finance Department at the address below. CONTACTING THE CITY’S FINANCIAL MANAGEMENT This financial report is designed to provide our citizens, taxpayers, customers, investors, and creditors with a general overview of the City of Bell Gardens’ finances and to show the City’s accountability for the money it receives. Questions concerning any of the information provided in this report or requests for additional financial information should be addressed to the City’s Finance Department, at the City of Bell Gardens, 7100 Garfield Avenue, Bell Gardens, CA 90201.
9

THIS PAGE INTENTIONALLY LEFT BLANK
10

CITY OF BELL GARDENS
STATEMENT OF NET ASSETS
Governmental Business-TypeActivities Activities Total
Assets:Cash and investments 16,177,665$ 239,580$ 16,417,245$Receivables:
Accounts 813,018 13,519 826,537Notes and loans 11,885,598 - 11,885,598Accrued interest 14,387 75 14,462
Internal balances 10,604 (10,604) -Prepaid costs 1,225,560 - 1,225,560Deposits 20,120 - 20,120Due from other governments 2,078,815 - 2,078,815Deferred charges 217,174 164,409 381,583Restricted assets:
Cash with fiscal agent 3,471,227 399,355 3,870,582Capital assets not being depreciated 71,688,493 1,440,802 73,129,295Capital assets, net of depreciation 37,684,126 5,896,897 43,581,023
Total Assets 145,286,787 8,144,033 153,430,820
Liabilities:Accounts payable 2,731,447 106,349 2,837,796Accrued liabilities 321,763 1,807 323,570Accrued interest 463,835 47,458 511,293Unearned revenue 25,598 - 25,598Deposits payable 64,065 - 64,065Due to other governments 74,253 - 74,253Noncurrent liabilities:
JUNE 30, 2011
Primary Government
See Notes to Financial Statements
Noncurrent liabilities: Due within one year 2,126,607 215,000 2,341,607 Due in more than one year 42,498,683 3,642,571 46,141,254
Total Liabilities 48,306,251 4,013,185 52,319,436
Net Assets:Invested in capital assets, net of related debt 74,822,075 3,480,128 78,302,203Restricted for: Community development projects 553,252 - 553,252 Public safety 805,968 - 805,968 Public works 2,031,290 - 2,031,290 Debt service 13,963,555 399,355 14,362,910Unrestricted 4,804,396 251,365 5,055,761
Total Net Assets 96,980,536$ 4,130,848$ 101,111,384$
See Notes to Financial Statements 11
CITY OF BELL GARDENS
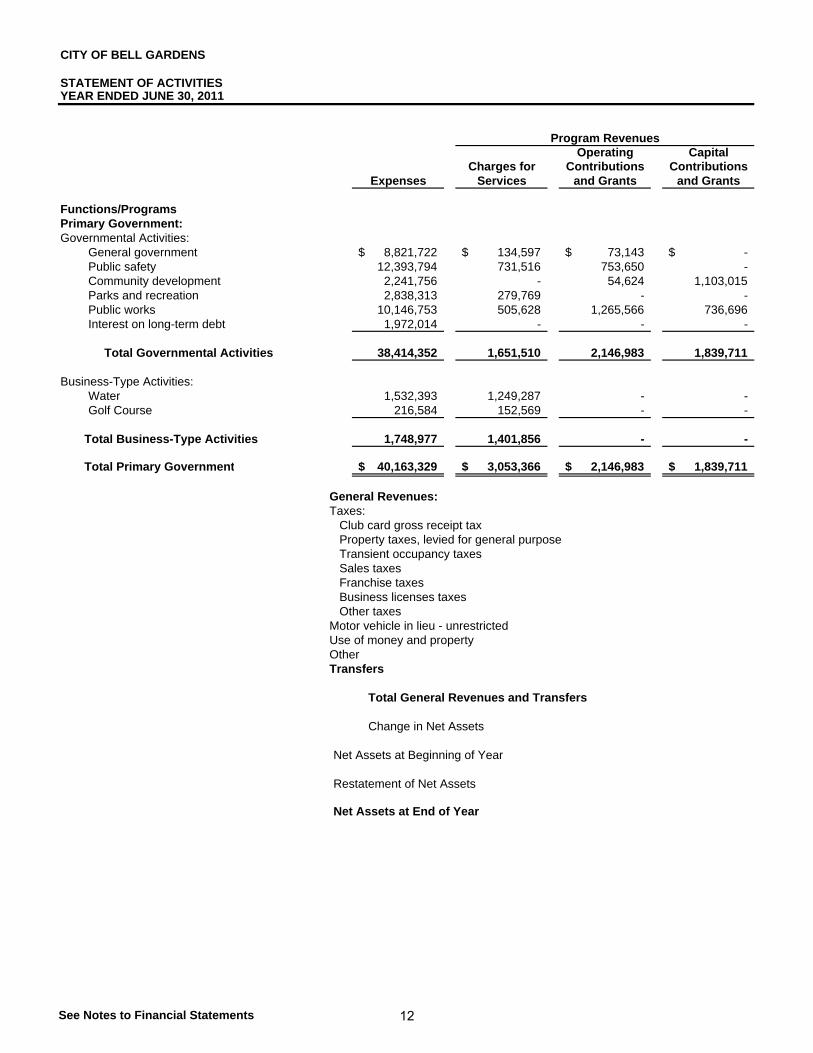
STATEMENT OF ACTIVITIESYEAR ENDED JUNE 30, 2011
Operating CapitalCharges for Contributions Contributions
Expenses Services and Grants and Grants
Functions/ProgramsPrimary Government:Governmental Activities:
General government 8,821,722$ 134,597$ 73,143$ -$ Public safety 12,393,794 731,516 753,650 - Community development 2,241,756 - 54,624 1,103,015 Parks and recreation 2,838,313 279,769 - - Public works 10,146,753 505,628 1,265,566 736,696 Interest on long-term debt 1,972,014 - - -
Total Governmental Activities 38,414,352 1,651,510 2,146,983 1,839,711
Business-Type Activities:Water 1,532,393 1,249,287 - - Golf Course 216,584 152,569 - -
Total Business-Type Activities 1,748,977 1,401,856 - -
Total Primary Government 40,163,329$ 3,053,366$ 2,146,983$ 1,839,711$
General Revenues:Taxes: Club card gross receipt tax Property taxes, levied for general purpose Transient occupancy taxes Sales taxes Franchise taxes Business licenses taxes Other taxesMotor vehicle in lieu - unrestrictedUse of money and propertyOtherTransfers
Total General Revenues and Transfers
Change in Net Assets
Net Assets at Beginning of Year
Restatement of Net Assets
Net Assets at End of Year
Program Revenues
See Notes to Financial Statements 12

Primary Government
Governmental Business-TypeActivities Activities Total
(8,613,982)$ -$ (8,613,982)$(10,908,628) - (10,908,628)
(1,084,117) - (1,084,117)(2,558,544) - (2,558,544)(7,638,863) - (7,638,863)(1,972,014) - (1,972,014)
(32,776,148) - (32,776,148)
- (283,106) (283,106)- (64,015) (64,015)
- (347,121) (347,121)
(32,776,148) (347,121) (33,123,269)
9,695,632 - 9,695,6324,696,696 - 4,696,696
221,374 - 221,3742,321,800 - 2,321,8002,568,428 - 2,568,428
280,160 - 280,1601,182,332 - 1,182,3323,905,639 - 3,905,6393,281,827 8,664 3,290,491
249,606 - 249,606(243,372) 243,372 -
28,160,122 252,036 28,412,158
(4,616,026) (95,085) (4,711,111)
101,446,042 4,225,933 105,671,975
150,520 - 150,520
96,980,536$ 4,130,848$ 101,111,384$
Net (Expenses) Revenues and Changes in Net Assets
See Notes to Financial Statements 13

CITY OF BELL GARDENS
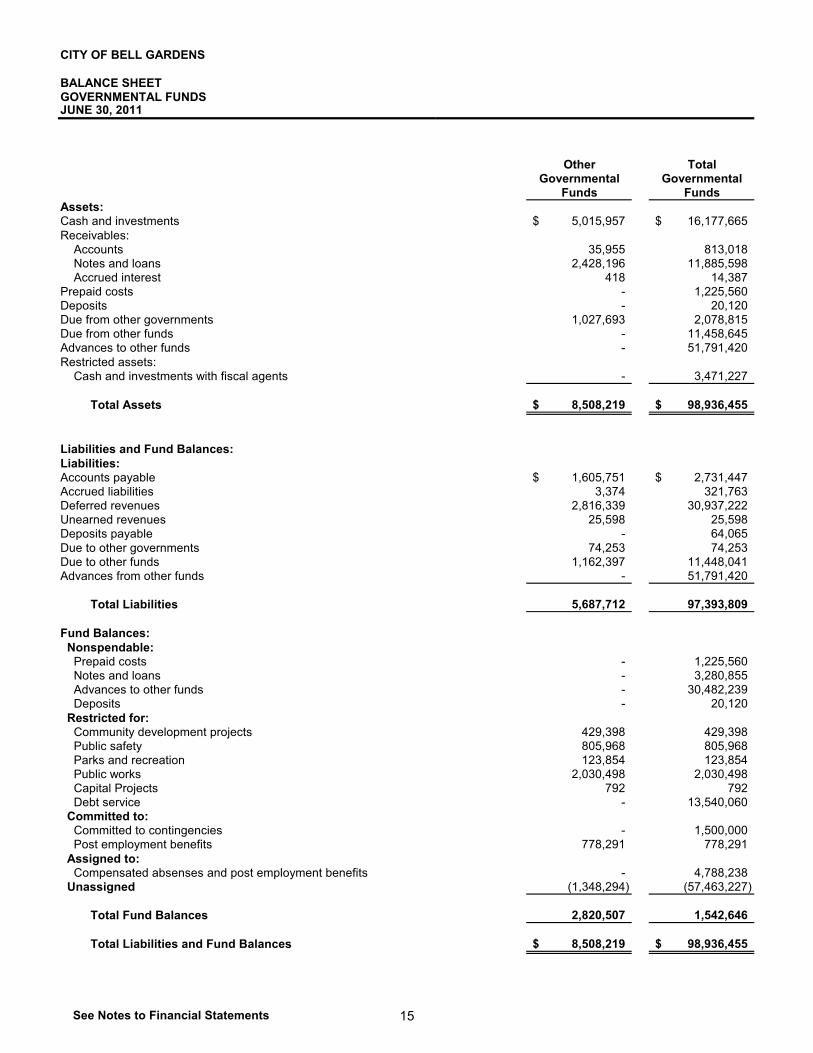
BALANCE SHEETGOVERNMENTAL FUNDS JUNE 30, 2011
Capital Projects Fund
DebtService Fund
GeneralAssets:Cash and investments 6,357,753$ 4,803,955$ -$Receivables:
Accounts 777,063 - -Notes and loans 280,855 9,176,547 -Accrued interest 13,969 - -
Prepaid costs 1,160,034 - 65,526Deposits - 20,120 -Due from other governments 867,696 39,893 143,533Due from other funds 1,173,001 38,330 10,247,314Advances to other funds 50,969,616 - 821,804Restricted assets:
Cash and investments with fiscal agents 1,520,350 - 1,950,877
Total Assets 63,120,337$ 14,078,845$ 13,229,054$
Liabilities and Fund Balances:Liabilities:Accounts payable 778,937$ 167,064$ 179,695$Accrued liabilities 315,002 3,387 -Deferred revenues 21,944,336 6,176,547 -Unearned revenues - - -Deposits payable 39,065 25,000 -
Community Development Commission
Community Development Commission
p p yDue to other governments - - -Due to other funds - 9,010,240 1,275,404Advances from other funds - 51,791,420 -
Total Liabilities 23,077,340 67,173,658 1,455,099
Fund Balances:Nonspendable:
Prepaid costs 1,160,034 - 65,526 Notes and loans 280,855 3,000,000 - Advances to other funds 29,660,435 - 821,804 Deposits - 20,120 - Restricted for: Community development projects - - - Public safety - - - Parks and recreation - - - Public works - - - Capital Projects - - - Debt service 2,653,435 - 10,886,625 Committed to: Committed to contingencies 1,500,000 - - Post employment benefits - - - Assigned to: Compensated absenses and post employment benefits 4,788,238 - - Unassigned - (56,114,933) -
Total Fund Balances 40,042,997 (53,094,813) 11,773,955
Total Liabilities and Fund Balances 63,120,337$ 14,078,845$ 13,229,054$
See Notes to Financial Statements 14
CITY OF BELL GARDENS
BALANCE SHEETGOVERNMENTAL FUNDSJUNE 30, 2011
Assets:Cash and investmentsReceivables:
AccountsNotes and loansAccrued interest
Prepaid costsDepositsDue from other governmentsDue from other fundsAdvances to other fundsRestricted assets:
Cash and investments with fiscal agents
Total Assets
Liabilities and Fund Balances:Liabilities:Accounts payableAccrued liabilitiesDeferred revenuesUnearned revenuesDeposits payable
Other TotalGovernmental Governmental
Funds Funds
5,015,957$ 16,177,665$
35,955 813,0182,428,196 11,885,598
418 14,387- 1,225,560- 20,120
1,027,693 2,078,815- 11,458,645- 51,791,420
- 3,471,227
8,508,219$ 98,936,455$
1,605,751$ 2,731,447$3,374 321,763
2,816,339 30,937,22225,598 25,598
- 64,065p p yDue to other governmentsDue to other fundsAdvances from other funds
Total Liabilities
Fund Balances:Nonspendable:
Prepaid costs Notes and loans Advances to other funds Deposits Restricted for: Community development projects Public safety Parks and recreation Public works Capital Projects Debt service Committed to: Committed to contingencies Post employment benefits Assigned to: Compensated absenses and post employment benefits Unassigned
Total Fund Balances
Total Liabilities and Fund Balances
74,253 74,2531,162,397 11,448,041
- 51,791,420
5,687,712 97,393,809
- 1,225,560- 3,280,855- 30,482,239- 20,120
429,398 429,398805,968 805,968123,854 123,854
2,030,498 2,030,498792 792
- 13,540,060
- 1,500,000778,291 778,291
- 4,788,238(1,348,294) (57,463,227)
2,820,507 1,542,646
8,508,219$ 98,936,455$
See Notes to Financial Statements 15

CITY OF BELL GARDENS
RECONCILIATION OF THE BALANCE SHEET OF GOVERNMENTAL FUNDSTO THE STATEMENT OF NET ASSETSJUNE 30, 2011
Fund balances of governmental funds 1,542,646$
Amounts reported for governmental activities in the statement of net assets are different because:
Capital assets net of depreciation have not been included as financial resources in governmental fund activity. 109,372,619
Bond issuance cost is an expenditure in the governmental funds, but it is a deferred charge in the statement of net assets. 217,174
Long-term debt and compensated absences have not been included in the governmental fund activity:
Bonds and notes payable (34,550,544) Compensated absences (2,582,495)
Governmental funds report all other post-employment benefits contributions as expenditures. However, in the statement Statement of Net Assets, any excess or deficit of contribution over the Annual Required Contribution (ARC) is reported as an assets or liabilities. (7,492,251)
Accrued interest payable for the current portion of interest due on bonds has not been reported in the governmental funds. (463,835)
Some of the City's revenue will be collected after year-end, but are not available soon enough to pay for the current year period expenditures and, therefore are reported as deferred revenue in the governmental funds. 30,937,222
Net assets of governmental activities 96,980,536$
See Notes to Financial Statements 16

THIS PAGE INTENTIONALLY LEFT BLANK
17
CITY OF BELL GARDENS
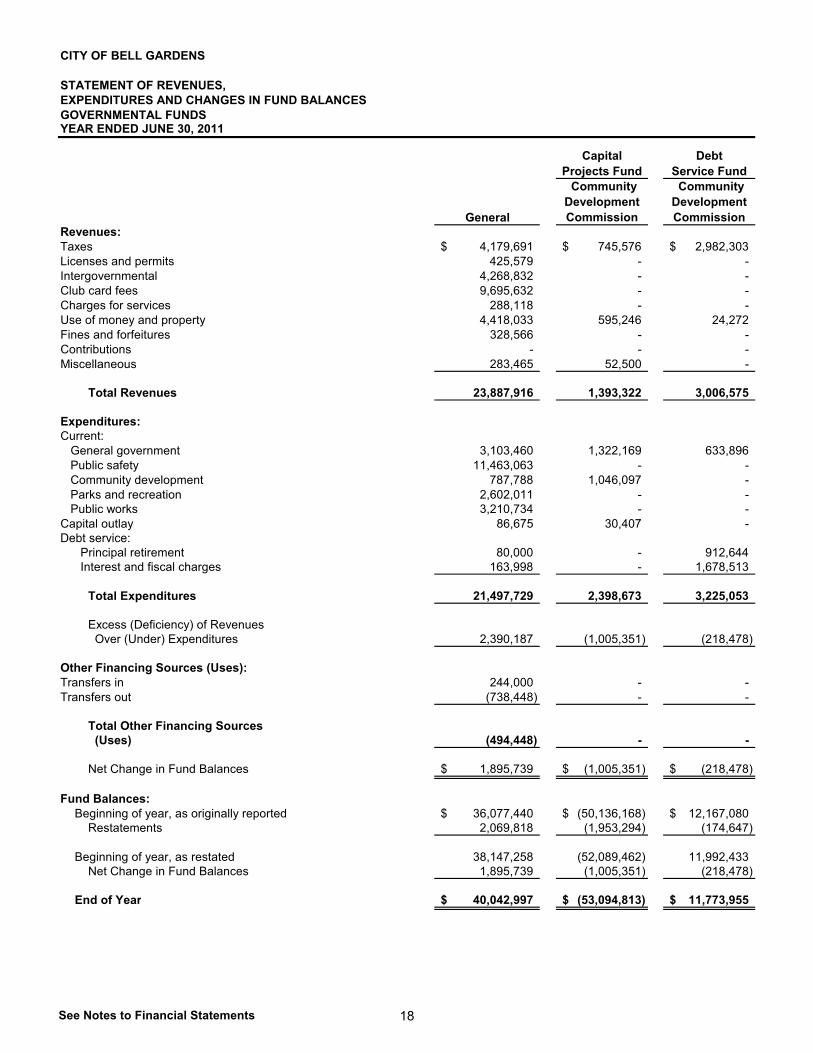
STATEMENT OF REVENUES,EXPENDITURES AND CHANGES IN FUND BALANCESGOVERNMENTAL FUNDS YEAR ENDED JUNE 30, 2011
Capital Projects Fund
Debt Service Fund
General Revenues:Taxes 4,179,691$ 745,576$ 2,982,303$Licenses and permits 425,579 - -Intergovernmental 4,268,832 - -Club card fees 9,695,632 - -Charges for services 288,118 - -Use of money and property 4,418,033 595,246 24,272Fines and forfeitures 328,566 - -Contributions - - -Miscellaneous 283,465 52,500 -
Total Revenues 23,887,916 1,393,322 3,006,575
Expenditures:Current: General government 3,103,460 1,322,169 633,896 Public safety 11,463,063 - - Community development 787,788 1,046,097 - Parks and recreation 2,602,011 - - Public works 3,210,734 - -Capital outlay 86,675 30,407 -Debt service:
Community Development Commission
Community Development Commission
Debt service: Principal retirement 80,000 - 912,644 Interest and fiscal charges 163,998 - 1,678,513
Total Expenditures 21,497,729 2,398,673 3,225,053
Excess (Deficiency) of Revenues Over (Under) Expenditures 2,390,187 (1,005,351) (218,478)
Other Financing Sources (Uses):Transfers in 244,000 - -Transfers out (738,448) - -
Total Other Financing Sources (Uses) (494,448) - -
Net Change in Fund Balances 1,895,739$ (1,005,351)$ (218,478)$
Fund Balances:Beginning of year, as originally reported 36,077,440$ (50,136,168)$ 12,167,080$ Restatements 2,069,818 (1,953,294) (174,647)
Beginning of year, as restated 38,147,258 (52,089,462) 11,992,433 Net Change in Fund Balances 1,895,739 (1,005,351) (218,478)
End of Year 40,042,997$ (53,094,813)$ 11,773,955$
See Notes to Financial Statements 18

CITY OF BELL GARDENS
STATEMENT OF REVENUES,EXPENDITURES AND CHANGES IN FUND BALANCESGOVERNMENTAL FUNDSYEAR ENDED JUNE 30, 2011
Revenues:TaxesLicenses and permitsIntergovernmentalClub card feesCharges for servicesUse of money and propertyFines and forfeituresContributionsMiscellaneous
Total Revenues
Expenditures:Current: General government Public safety Community development Parks and recreation Public worksCapital outlayDebt service:
Other TotalGovernmental Governmental
Funds Funds
3,194,391$ 11,101,961$- 425,579
3,867,091 8,135,923- 9,695,632
221,912 510,030170,693 5,208,244337,322 665,888
70,000 70,00018,998 354,963
7,880,407 36,168,220
451,090 5,510,615894,158 12,357,221373,901 2,207,786216,563 2,818,574
5,149,485 8,360,2192,294,983 2,412,065
Debt service: Principal retirement Interest and fiscal charges
Total Expenditures
Excess (Deficiency) of Revenues Over (Under) Expenditures
Other Financing Sources (Uses):Transfers inTransfers out
Total Other Financing Sources (Uses)
Net Change in Fund Balances
Fund Balances:Beginning of year, as originally reported Restatements
Beginning of year, as restated Net Change in Fund Balances
End of Year
348,000 1,340,644200,730 2,043,241
9,928,910 37,050,365
(2,048,503) (882,145)
1,004,721 1,248,721(753,645) (1,492,093)
251,076 (243,372)
(1,797,427)$ (1,125,517)$
4,409,291$ 2,517,643$208,643 150,520
4,617,934 2,668,163(1,797,427) (1,125,517)
2,820,507$ 1,542,646$
See Notes to Financial Statements 19

CITY OF BELL GARDENS
RECONCILIATION OF THE STATEMENT OF REVENUES, EXPENDITURES,AND CHANGES IN FUND BALANCES OF GOVERNMENTAL FUNDSTO THE STATEMENT OF ACTIVITIESYEAR ENDED JUNE 30, 2011
Net change in fund balances - total governmental funds (1,125,517)$
Amounts reported for governmental activities in the statement of activities aredifferent because:
Governmental funds report capital outlays as expenditures. However, in the statement of activities, the costs of those assets is allocated over their estimated useful lives as depreciation expense. This is the amount by which capital outlays exceeded depreciation in the current period. (320,251)
The issuance of long-term debt provides financial resources to governmental funds, while the repayment of the principal of long-term debt consumes the current financial resources of governmental funds. Neither transaction, however, has any effect on net assets.
Repayment of long-term debt principal 1,406,988
Debt issuance costs are expenditures in governmental funds, but these costs are capitalized on the statement of net assets. (14,752)
Accrued interest for long-term liabilities. This is the net change in accrued interest for the current period. 19,635
Compensated absences expenses reported in the statement of activities do not require the use of current financial resources and, therefore, are not reported as expenditures in governmental funds. (137,469)
Other post-retirement benefit obligation reported in the statement of activities do not require the use of current financial resources and, therefore, are not reported as expenditures in governmental funds. (2,318,138)
Revenues reported as deferred revenue in the governmental funds and recognized in the Statement of Activities. These are included in the intergovernmental revenues in the governmental fund activity. (2,126,522)
Change in net assets of governmental activities (4,616,026)$
See Notes to Financial Statements 20

CITY OF BELL GARDENS
BUDGETARY COMPARISON STATEMENTGENERAL FUNDYEAR ENDED JUNE 30, 2011
Variance with Final Budget
Budget Amounts Actual PositiveOriginal Final Amounts (Negative)
Budgetary Fund Balance, July 1, as restated 38,147,258$ 38,147,258$ 38,147,258$ -$ Resources (Inflows):Taxes 3,894,162 3,894,162 4,179,691 285,529Licenses and permits 277,680 277,680 425,579 147,899Intergovernmental 4,023,734 4,023,734 4,268,832 245,098Club card fees 10,644,350 10,644,350 9,695,632 (948,718)Charges for services 305,540 305,540 288,118 (17,422)Use of money and property 3,346,164 3,346,164 4,418,033 1,071,869Fines and forfeitures 397,674 397,674 328,566 (69,108)Miscellaneous 59,500 59,500 283,465 223,965Transfers in 894,000 894,000 244,000 (650,000)
Amounts Available for Appropriations 61,990,062 61,990,062 62,279,174 289,112 Charges to Appropriations (Outflow):General government 3,875,017 3,875,017 3,103,460 771,557Public safety 12,093,219 12,093,219 11,463,063 630,156Community development 831,486 867,007 787,788 79,219Parks and recreation 2,766,266 2,766,266 2,602,011 164,255Public works 3,206,701 3,206,701 3,210,734 (4,033)Capital outlay 86,900 113,150 86,675 26,475Debt service: Principal retirement 80,000 80,000 80,000 - Interest and fiscal charges 163,998 163,998 163,998 -Transfers out 509,000 606,500 738,448 (131,948)
Total Charges to Appropriations 23,612,587 23,771,858 22,236,177 1,535,681
Budgetary Fund Balance, June 30 38,377,475$ 38,218,204$ 40,042,997$ 1,824,793$
See Notes to Financial Statements 21

CITY OF BELL GARDENS
STATEMENT OF NET ASSETSPROPRIETARY FUNDS JUNE 30, 2011
NonmajorEnterprise
FundsGolf Course Total
Assets:Current:
Cash and investments 239,580$ - $ 239,580$Receivables:
Accounts 13,519 - 13,519Accrued interest 75 - 75
Restricted:Cash with fiscal agent 399,355 - 399,355
Total Current Assets 652,529 - 652,529
Noncurrent:Unamortized debt issuance costs 164,409 - 164,409Capital assets - net of accumulated depreciation 7,334,902 2,797 7,337,699
Total Noncurrent Assets 7,499,311 2,797 7,502,108
Total Assets 8,151,840$ 2,797$ 8,154,637$
Liabilities and Net Assets:Liabilities:Current:
Accounts payable 102,711$ 3,638$ 106,349$Accrued liabilities 751 1,056 1,807Accrued interest 47,458 - 47,458Due to other funds - 10,604 10,604Bonds, notes, and capital leases 215,000 - 215,000
Total Current Liabilities 365,920 15,298 381,218
Noncurrent:Bonds, notes, and capital leases 3,642,571 - 3,642,571
Total Noncurrent Liabilities 3,642,571 - 3,642,571
Total Liabilities 4,008,491 15,298 4,023,789
Net Assets:Invested in capital assets, net of related debt 3,477,331 2,797 3,480,128Restricted for debt service 399,355 - 399,355Unrestricted 266,663 (15,298) 251,365
Total Net Assets 4,143,349 (12,501) 4,130,848
Total Liabilities and Net Assets 8,151,840$ 2,797$ 8,154,637$
Business-Type Activities - Enterprise Funds
Water
See Notes to Financial Statements 22

CITY OF BELL GARDENS
STATEMENT OF REVENUES, EXPENSESAND CHANGES IN FUND NET ASSETSPROPRIETARY FUNDS YEAR ENDED JUNE 30, 2011
NonmajorEnterprise
FundsGolf Course Total
Operating Revenues:Sales and service charges 1,139,956$ 148,441$ 1,288,397$Miscellaneous 109,331 4,128 113,459
Total Operating Revenues 1,249,287 152,569 1,401,856
Operating Expenses:Cost of sales and services 987,526 115,032 1,102,558Personnel services 160,621 94,479 255,100Depreciation expense 177,156 7,073 184,229
Total Operating Expenses 1,325,303 216,584 1,541,887
Operating Income (Loss) (76,016) (64,015) (140,031)
Nonoperating Revenues (Expenses):Interest revenue 2,164 6,500 8,664Interest expense (207,090) - (207,090)
Total Nonoperating Revenues (Expenses) (204,926) 6,500 (198,426)
Income (Loss) Before Transfers (280,942) (57,515) (338,457)
Transfers in - 487,372 487,372Transfers out (244,000) - (244,000)
Changes in Net Assets (524,942) 429,857 (95,085)
Net Assets:Beginning of Year 4,668,291 (442,358) 4,225,933
End of Fiscal Year 4,143,349$ (12,501)$ 4,130,848$
Business-Type Activities - Enterprise Funds
Water
See Notes to Financial Statements 23

CITY OF BELL GARDENS
STATEMENT OF CASH FLOWSPROPRIETARY FUNDS YEAR ENDED JUNE 30, 2011
OtherEnterprise
FundsGolf Course Total
Cash Flows from Operating Activities:Cash received from customers and users 1,249,287$ 152,569$ 1,401,856$ Cash paid to suppliers for goods and services (972,614) (117,374) (1,089,988) Cash paid to employees for services (160,621) (94,480) (255,101)
Net Cash Provided (Used) by Operating Activities 116,052 (59,285) 56,767
Cash Flows from Non-CapitalFinancing Activities:
Cash transfers out (244,000) - (244,000)Cash transfers in - 487,372 487,372 Repayment made to other funds - (434,587) (434,587)
Net Cash Provided (Used) by Non-Capital Financing Activities (244,000) 52,785 (191,215)
Cash Flows from Capital and Related Financing Activities:
Acquisition and construction of capital assets (35,666) - (35,666) Principal paid on capital debt (210,000) - (210,000) Interest paid on capital debt (183,692) - (183,692)
Net Cash Provided (Used) by Capital and Related Financing Activities (429,358) - (429,358)
Cash Flows from Investing Activities:Interest received 2,164 6,500 8,664
Net Cash Provided (Used) byInvesting Activities 2,164 6,500 8,664
Net Increase (Decrease) in Cashand Cash Equivalents (555,142) - (555,142)
Cash and Cash Equivalents at Beginning of Year 1,194,077 - 1,194,077
Cash and Cash Equivalents at End of Year 638,935$ -$ 638,935$
Reconciliation of Operating Income to Net CashProvided (Used) by Operating Activities:Operating income (loss) (76,016)$ (64,015)$ (140,031)$Adjustments to reconcile operating income (loss) net cash provided (used) by operating activities:
Depreciation 177,156 7,073 184,229Increase (decrease) in accounts payable 14,912 (2,342) 12,570Increase (decrease) in accrued liabilities - (1) (1)
Total Adjustments 192,068 4,730 196,798Net Cash Provided (Used) by Operating Activities 116,052$ (59,285)$ 56,767$
Non-Cash Investing, Capital, and Financing Activities:Amortization of cost of issuance, bond premium and
loss on defeasance. 23,398$ -$ 23,398$
Business-Type Activities - Enterprise Funds
Water
See Notes to Financial Statements 24

CITY OF BELL GARDENS NOTES TO FINANCIAL STATEMENTS JUNE 30, 2011
I. SIGNIFICANT ACCOUNTING POLICIES
Note 1: Organization and Summary of Significant Accounting Policies
a. Description of the Reporting Entity This report includes all fund types of the City of Bell Gardens (the "primary government"), as well as the Bell Gardens Community Development Commission (the Commission) and the Bell Gardens Financing Authority (the Authority). These latter two entities meet the definition of a "component unit", and are presented on a "blended" basis, as if they were part of the primary government. Although the Commission and the Authority are legally separate entities, the governing boards of these entities are comprised of the same membership as the City Council. The City may impose its will on these component units, including the ability to appoint, hire, reassign or dismiss management. There is also a financial benefit/burden relationship between the City and these entities. The City of Bell Gardens, California (City) was incorporated on August 1, 1961. The City operates under a Council-Manager form of government and provides the following services: general government, public safety, public works, recreation and community development. The Bell Gardens Redevelopment Agency (Agency) was established on July 10, 1972, pursuant to the State of California Health and Safety Code Section 33000, entitled "Community Redevelopment Law". On May 27, 1997, the City expanded the Agency to a Community Development Commission (Commission) pursuant to the State of California Health and Safety Code, Section 34100, to include housing activities. The primary purpose of the Commission is to eliminate blighted areas by encouraging development of residential, commercial, industrial, recreational and public facilities and to provide safe and sanitary dwelling accommodations in the City, available to persons of low income. The Bell Gardens Financing Authority (Authority) was created on November 28, 1988, under a Joint Exercise of Powers Agreement by and between the City of Bell Gardens and the Bell Gardens Community Development Commission. The Authority was established pursuant to the laws of the State of California with authority to acquire the Commission's bonds as provided in Section 6588 of the Government Code of the State of California. The Commission has determined that "significant public benefits" will be derived by the Commission in undertaking the issuance of the bonds and their sale to the Authority and resale to the underwriter, in furtherance of the corporate purposes of the Commission. Separate financial statements of the Commission are available at City Hall, 7100 Garfield Avenue, Bell Gardens, California 90201-3293. Separate financial statements are not prepared for the Authority.
25

CITY OF BELL GARDENS NOTES TO FINANCIAL STATEMENTS (CONTINUED) JUNE 30, 2011 Note 1: Organization and Summary of Significant Accounting Policies (Continued)
b. Government-Wide and Fund Financial Statements The government-wide financial statements (i.e., the statement of net assets and the statement of activities) report information on all of activities of the primary government. For the most part, the effect of interfund activity has been removed from these statements, and eliminations have been made to minimize the double counting of internal activities. Governmental activities, which normally are supported by taxes and intergovernmental revenues, are reported separately from business-type activities, which rely to a significant extent on fees and charges for support. The statement of activities demonstrates the degree to which the direct expenses of a given function or segment is offset by program revenues. Direct expenses are those that are clearly identifiable with a specific function or segment. Program revenues include 1) charges to customers or applicants who purchase, use or directly benefit from goods, services, or privileges provided by a given function or segment and 2) grants and contributions that are restricted to meeting the operational or capital requirements of a particular function or segment. Taxes and other items not properly included among program revenues are reported instead as general revenues. Separate financial statements are provided for governmental funds, and proprietary funds. Major individual governmental funds and the major individual enterprise fund are reported as separate columns in the fund financial statements.
c. Measurement Focus, Basis of Accounting, and Financial Statement Presentation The government-wide and proprietary fund financial statements are reported using the economic resources measurement focus and the accrual basis of accounting. Revenues are recorded when earned and expenses are recorded when the liability is incurred, regardless of the timing of the related cash flows. Property taxes are recognized as revenues in the year for which they are levied. Grants and similar items are recognized as revenue as soon as all eligibility requirements imposed by the provider have been met. Governmental fund financial statements are reported using the current financial resources measurement focus and the modified accrual basis of accounting. Under this method, revenues are recognized when measurable and available. Revenues are considered to be available when they are collectible within the current period or soon enough thereafter to pay liabilities of the current period. For this purpose, the government considers revenues to be available if they are collected within 60 days of the end of the current fiscal year. Expenditures generally are recorded when a liability is incurred, as under accrual accounting. However, debt service expenditures, as well as expenditures related to compensated absences, claims and judgments are not recognized until paid.
Property taxes, charges for services, and interest associated with the current fiscal period are all considered to be susceptible to accrual and so have been recognized as revenues of the current fiscal period. All other revenue items are considered to be measurable and available only when cash is received by the government.
26

CITY OF BELL GARDENS NOTES TO FINANCIAL STATEMENTS (CONTINUED) JUNE 30, 2011 Note 1: Organization and Summary of Significant Accounting Policies (Continued)
The City reports the following major governmental funds:
� The General Fund is the general operating fund of the City. All general tax revenues and other receipts that are not allocated by law or contractual agreement to some other fund are accounted for in this fund. From this fund are paid the general operating expenditures not paid through other funds.
� The Community Development Commission - Capital Projects Fund accounts for the financial resources used in developing the project areas as well as the administrative expenditures incurred in sustaining Commission activities.
� The Community Development Commission - Debt Service Fund accounts for the payment of interest and principal on long-term debt, and accumulation of resources thereof.
The City reports the following major proprietary fund:
� The Water Enterprise Fund accounts for the financial activity of the City's water utility.
The costs of providing these services to the general public are financed or recovered primarily through user charges.
Additionally, the City reports the following fund types
� Special Revenue Funds – These funds account for proceeds of specific revenue
sources that are legally restricted or otherwise designated for specific purposes.
� Capital Projects Funds – These funds account for the financial resources to be used for the acquisition or construction of major capital facilities.
Private-sector standards of accounting and financial reporting issued prior to December 1, 1989, generally are followed in both the government-wide and proprietary fund financial statements to the extent that those standards do not conflict with or contradict guidance of the Governmental Accounting Standards Board. Governments also have the option of following subsequent private-sector guidance for their business-type activities and enterprise funds, subject to this same limitation. The City has elected not to follow subsequent private-sector guidance.
As a general rule the effect of interfund activity has been eliminated from the government-wide financial statements. Exceptions to this general rule are payments in lieu of taxes and other charges between the government's water function and various other functions of the government. Elimination of these charges would distort the direct costs and program revenues reported for the various functions concerned.
Amounts reported as program revenues include 1) charges to members, customers or applicants for goods, services, or privileges provided, 2) operating grants and contributions, and 3) capital grants and contributions, including special assessments. Internally dedicated resources are reported as general revenues rather than as program revenues. Likewise, general revenues include all taxes.
27

CITY OF BELL GARDENS NOTES TO FINANCIAL STATEMENTS (CONTINUED) JUNE 30, 2011 Note 1: Organization and Summary of Significant Accounting Policies (Continued)
Proprietary funds distinguish operating revenues and expenses from non-operating items. Operating revenues and expenses generally result from providing services and producing and delivering goods in connection with a proprietary fund's principal ongoing operations. The principal operating revenues of the Water Enterprise Fund are charges to customers for sales and services. Operating expenses for the enterprise fund includes the cost of sales and services, administrative expenses, and depreciation on capital assets. All revenues and expenses not meeting this definition are reported as non operating revenues and expenses. When both restricted and unrestricted resources are available for use, it is the City's policy to use restricted resources first, then use unrestricted resources as needed.
d. Assets, Liabilities and Net Assets or Equity
1. Cash and Investments
Investments are reported in the accompanying statement of net assets at fair market value. Changes in fair market value that occur during a fiscal year are recognized as investment income reported for that fiscal year. Investment income includes interest earnings, changes in fair market value, and any gains or losses realized upon the liquidation, maturity, or sale of investments.
The City pools cash and investments of all funds, except for assets held by bond trustees and fiscal agents. Each fund's share in this pool is displayed in the accompanying financial statements as cash and investments. Investment income, earned by the pooled investments, is allocated to the various funds based on each fund's average cash and investment balance. For purposes of the statement of cash flows, the City considers all highly liquid investments (including restricted assets) with maturity of three months or less when purchased to be cash equivalents. Cash invested in the City's cash management pool is also considered to be cash equivalents.
2. Receivables and Payables
Activity between funds that are representative of lending/borrowing arrangements outstanding at the end of the fiscal year are referred to as either "due to/from other funds" (i.e., the current portion of interfund loans) or "advances to/from other funds" (i.e., the non-current portion of interfund loans). All other outstanding balances between funds are reported as "due to/from other funds." Any residual balances outstanding between the governmental activities and business-type activities are reported in the government-wide financial statements as "internal balances."
Advances between funds, as reported in the fund financial statements, are offset by a nonspendable fund balance account in applicable governmental funds to indicate that they are not available for appropriation and are not expendable available financial resources.
All trade and property tax receivables are shown net of an allowance for uncollectibles.
28

CITY OF BELL GARDENS NOTES TO FINANCIAL STATEMENTS (CONTINUED) JUNE 30, 2011 Note 1: Organization and Summary of Significant Accounting Policies (Continued)
Under California law, property taxes are assessed and collected by the counties at 1% of assessed value plus other increases approved by the voters. Property taxes collected go into a pool and are then allocated to the cities based on a predetermined formula. The City of Bell Gardens accrues only those taxes which are received from the County of Los Angeles within 60 days after year-end.
Lien date: January 1Levy date: June 30Due dates: November 1, February 1Delinquent dates: December 11, April 11
3. Inventories and Prepaid Items
Inventories of materials and supplies (if material) are carried at cost on a first-in, first-out (FIFO) basis. The City uses the consumption method of accounting for inventories. Certain payments to vendors reflect costs applicable to future accounting periods and are recorded as prepaid items in both government-wide and fund financial statements.
4. Restricted Assets
Restricted assets represent unexpended bond proceeds, interest earnings thereon and reserve amounts of certificates of participation and tax allocation bonds. Under the related resolutions and indentures, the remaining proceeds are restricted for the use of future construction of improvements to the respective projects, for debt service or for reserve requirements. The majority of these assets are held by trustees and fiscal agents.
5. Capital Assets
Capital assets, which include property, plant, equipment, intangible assets and infrastructure assets (e.g., roads, bridges, sidewalks and similar items), are reported in the applicable governmental or business-type activities columns in the government-wide financial statements. Such assets are recorded at historical cost or estimated historical cost if purchased or constructed. Donated assets are valued at the fair value of the assets on the date on which they were contributed. The costs of normal maintenance and repairs that do not add to the value of the asset or materially extend assets lives are not capitalized. The City utilizes a capitalization threshold of $5,000-$10,000 depending on asset type. Depreciation is charged to operations using the straight-line method over the estimated useful lives of the assets as follows:
Buildings and improvements 20-40 yearsEquipment 3-15 yearsInfrastructure 20-50 yearsWater rights 100 years
29

CITY OF BELL GARDENS NOTES TO FINANCIAL STATEMENTS (CONTINUED) JUNE 30, 2011 Note 1: Organization and Summary of Significant Accounting Policies (Continued)
6. Compensated Absences
The cost of earned but unused vacation and sick leave, for which the City has a future obligation to pay, is recognized in the government-wide financial statements. A liability for these amounts is reported in governmental funds only if they become due and payable as a result of employee resignations or retirements. Typically, the City liquidates its compensated absences with general fund resources.
7. Long-term Obligations
In the government-wide financial statements, and proprietary fund types in the fund financial statements, long-term debt and other long-term obligations are reported as liabilities in the applicable governmental activities, business-type activities, or proprietary fund type statement of net assets. Bond premiums and discounts, as well as issuance costs, are deferred and amortized over the life of the bonds using the straight line method. Bonds payable are reported net of the applicable bond premium or discount. Bond issuance costs are reported as deferred charges and amortized over the term of the related debt. In the fund financial statements, governmental fund types recognize bond premiums and discounts, as well as bond issuance costs, during the current period. The face amount of debt issued is reported as other financing sources. Premiums received on debt issuances are reported as other financing sources while discounts on debt issuances are reported as other financing uses. Issuance costs, whether or not withheld from the actual debt proceeds received, are reported as debt service expenditures.
8. Fund Equity
In the fund financial statements, governmental funds report the following fund balance classification:
Nonspendable - include amounts that cannot be spent because they are either
(a) not in spendable form or (b) legally or contractually required to be maintained intact.
Restricted - include amounts that are constrained on the use of resources by
either (a) external creditors, grantors, contributors, or laws of regulations of other governments or (b) by law through constitutional provisions or enabling legislation.
Committed - include amounts that can only be used for specific purposes pursuant to constraints imposed by formal action of the governing board of the Commission.
Assigned - include amounts that are constrained by the government’s intent to be used for specific purposes, but are neither restricted nor committed.
Unassigned - include the residual amounts that have not been restricted, committed, or assigned to specific purposes.
An individual governmental fund could include nonspendable resources and amounts that are restricted or unrestricted (committed, assigned, or unassigned) or any combination of those classifications.
30

CITY OF BELL GARDENS NOTES TO FINANCIAL STATEMENTS (CONTINUED) JUNE 30, 2011 Note 1: Organization and Summary of Significant Accounting Policies (Continued)
e. Reconciliation of Government-Wide and Fund Financial Statements
1. Explanation of certain differences between the governmental fund balance sheet and
the government-wide statement of assets. The governmental fund balance sheet includes a reconciliation between fund balance - total governmental funds, and net assets - governmental activities as reported in the government-wide statement of net assets. One element of that reconciliation explains that "long-term debts have not been included in the governmental fund activity." The details of this ($34,550,544) difference are summarized as follows:
2003 Tax Allocation Bonds, Series A (5,720,000)$ 2003 Tax Allocation Bonds, Series B (8,145,000) 2005 Revenue Bonds, Series A (4,295,000) 2006 Certificates of Participation (3,510,000) Notes Payable: Bear Sterns (8,890,267) Notes Payable: County of Los Angeles - Section 108 (3,731,000) Less: Unamortized original issue discount 104,745 Add: Unamortized original issue premium (364,022)
Net adjustment to reduce fund balance - total governmentalfunds to arrive at net assets - governmental activities (34,550,544)$
2. Explanation of certain differences between the governmental fund statement of revenues, expenditures and changes in fund balances and the government-wide statement of activities. The governmental fund statement of revenues, expenditures and changes in fund balances includes a reconciliation between net changes in fund balances - total governmental funds and changes in net assets of governmental activities as reported in the government-wide statement of activities. One element of that reconciliation explains that "Governmental funds report capital outlays as expenditures. However, in the statement of activities the cost of those assets is allocated over their estimated useful lives and reported as depreciation expense." The details of this ($320,251) difference are as follows:
Capital outlay 2,579,489$ Disposal of assets (80,748) Depreciation expense (2,818,992)
Net adjustment to increase net changes in fund balances - total governmental funds to arrive at changes in net assetsof governmental activities (320,251)$
31
CITY OF BELL GARDENS NOTES TO FINANCIAL STATEMENTS (CONTINUED) JUNE 30, 2011
II. STEWARDSHIP
Note 2: Stewardship, Compliance and Accountability
a. General Budget Policies
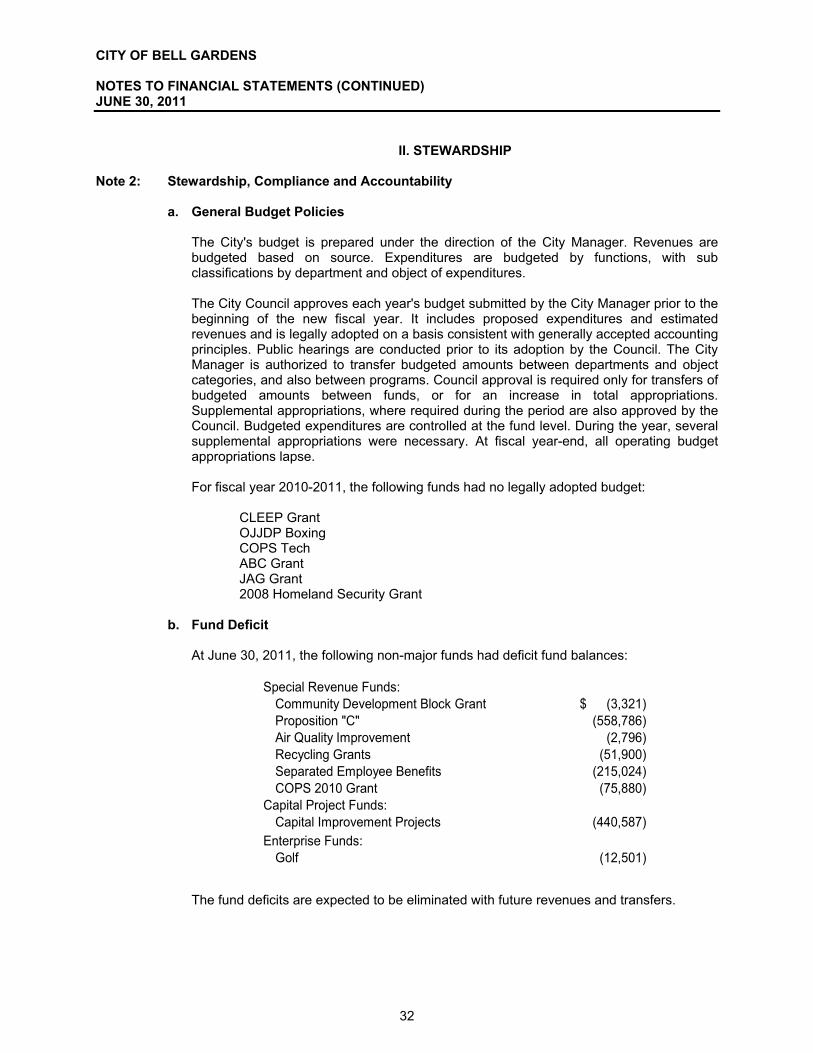
The City's budget is prepared under the direction of the City Manager. Revenues are budgeted based on source. Expenditures are budgeted by functions, with sub classifications by department and object of expenditures. The City Council approves each year's budget submitted by the City Manager prior to the beginning of the new fiscal year. It includes proposed expenditures and estimated revenues and is legally adopted on a basis consistent with generally accepted accounting principles. Public hearings are conducted prior to its adoption by the Council. The City Manager is authorized to transfer budgeted amounts between departments and object categories, and also between programs. Council approval is required only for transfers of budgeted amounts between funds, or for an increase in total appropriations. Supplemental appropriations, where required during the period are also approved by the Council. Budgeted expenditures are controlled at the fund level. During the year, several supplemental appropriations were necessary. At fiscal year-end, all operating budget appropriations lapse. For fiscal year 2010-2011, the following funds had no legally adopted budget: CLEEP Grant OJJDP Boxing COPS Tech ABC Grant JAG Grant 2008 Homeland Security Grant
b. Fund Deficit At June 30, 2011, the following non-major funds had deficit fund balances:
Special Revenue Funds:
Community Development Block Grant (3,321)$ Proposition "C" (558,786) Air Quality Improvement (2,796) Recycling Grants (51,900) Separated Employee Benefits (215,024) COPS 2010 Grant (75,880)
Capital Project Funds:Capital Improvement Projects (440,587)
Enterprise Funds:Golf (12,501)
The fund deficits are expected to be eliminated with future revenues and transfers.
32
CITY OF BELL GARDENS NOTES TO FINANCIAL STATEMENTS (CONTINUED) JUNE 30, 2011 Note 2: Stewardship, Compliance and Accountability (Continued)
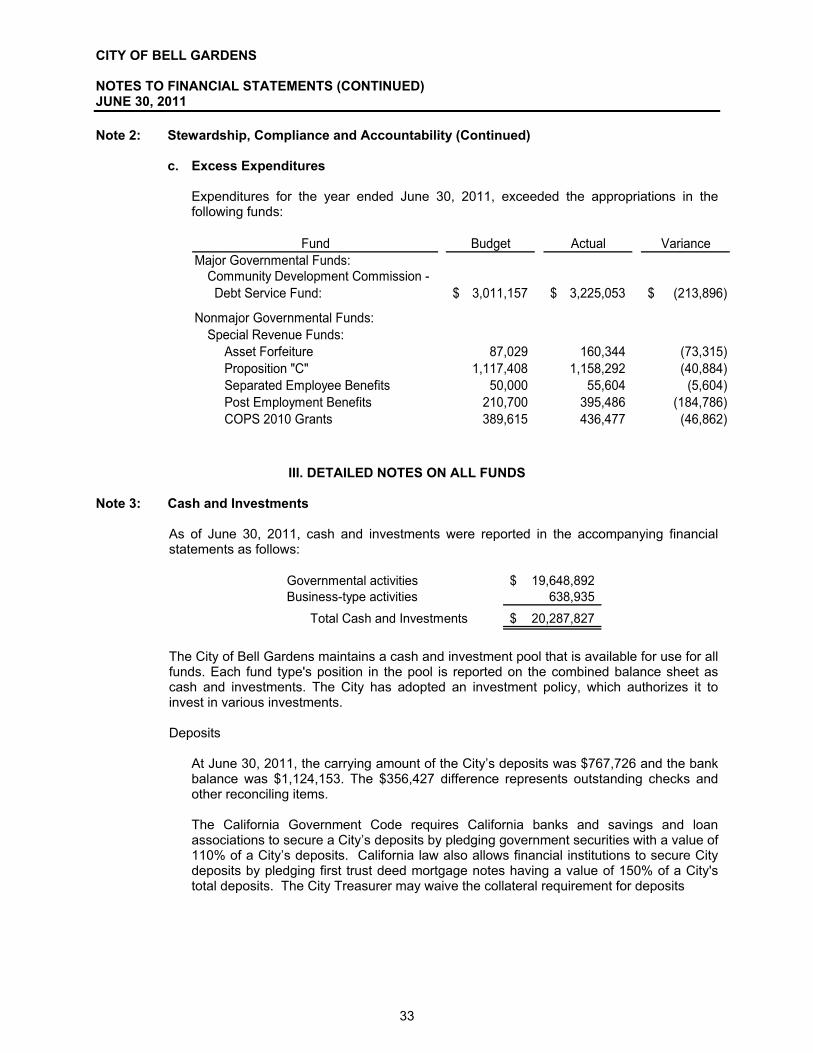
c. Excess Expenditures
Expenditures for the year ended June 30, 2011, exceeded the appropriations in the following funds:
Budget Actual Variance
Major Governmental Funds:
3,011,157$ 3,225,053$ (213,896)$
Nonmajor Governmental Funds:Special Revenue Funds:
Asset Forfeiture 87,029 160,344 (73,315) Proposition "C" 1,117,408 1,158,292 (40,884) Separated Employee Benefits 50,000 55,604 (5,604) Post Employment Benefits 210,700 395,486 (184,786) COPS 2010 Grants 389,615 436,477 (46,862)
Fund
Community Development Commission - Debt Service Fund:
III. DETAILED NOTES ON ALL FUNDS
Note 3: Cash and Investments
As of June 30, 2011, cash and investments were reported in the accompanying financial statements as follows:
Governmental activities 19,648,892$ Business-type activities 638,935
Total Cash and Investments 20,287,827$
The City of Bell Gardens maintains a cash and investment pool that is available for use for all funds. Each fund type's position in the pool is reported on the combined balance sheet as cash and investments. The City has adopted an investment policy, which authorizes it to invest in various investments. Deposits
At June 30, 2011, the carrying amount of the City’s deposits was $767,726 and the bank balance was $1,124,153. The $356,427 difference represents outstanding checks and other reconciling items. The California Government Code requires California banks and savings and loan associations to secure a City’s deposits by pledging government securities with a value of 110% of a City’s deposits. California law also allows financial institutions to secure City deposits by pledging first trust deed mortgage notes having a value of 150% of a City's total deposits. The City Treasurer may waive the collateral requirement for deposits
33

CITY OF BELL GARDENS NOTES TO FINANCIAL STATEMENTS (CONTINUED) JUNE 30, 2011 Note 3: Cash and Investments (Continued)
which are fully insured up to $250,000 by the FDIC. The collateral for deposits in federal and state chartered banks is held in safekeeping by an authorized Agent of Depository recognized by the State of California Department of Banking. The collateral for deposits with savings and loan associations is generally held in safekeeping by the Federal Home Loan Bank in San Francisco, California as an Agent of Depository. These securities are physically held in an undivided pool for all California public agency depositors. Under Government Code Section 53655, the placement of securities by a bank or savings and loan association with an "Agent of Depository" has the effect of perfecting the security interest in the name of the local governmental agency. Accordingly, all collateral held by California Agents of Depository are considered to be held for, and in the name of, the local governmental agency.
Investments Authorized by the City's Investment Policy
Under provision of the City’s investment policy, and in accordance with Section 53600 of the California Government Code, the following investments are authorized:
Investment TypesU.S. Treasury Bills, Bonds and Notes None None NoneU.S. Government Agency Securities None None NoneBills of Exchange 180 days 40% 15%Commercial Paper 270 days 40% 15%Negotiable Certificates of Deposit 5 years 30% 15%Repurchase Agreements 92 days None 15%Reverse Repurchase Agreements 92 days None 15%Local Agency Investment Fund (LAIF) None None NoneMedium Term Corporate Notes 5 years 30% 15%
Maximum Maturity
Maximum Percentage of Portfolio
Maximum Investment
In One Issuer
Investments Authorized by Debt Agreements
The above investments do not address investment of debt proceeds held by a bond trustee. Investments of debt proceeds held by a bond trustee are governed by provisions of the debt agreements, rather than the general provisions of the California Government Code or the City’s investment policy.
Investment in State Investment Pool
The City is a voluntary participant in the Local Agency Investment Fund (LAIF) that is regulated by the California Government Code under the oversight of the Treasurer of the State of California. The fair value of the City's investment in this pool is reported in the accompanying financial statements at amounts based upon the City's pro-rata share of the fair value provided by LAIF for the entire LAIF portfolio (in relation to the amortized cost of that portfolio). The balance available for withdrawal is based on the accounting records maintained by LAIF, which are recorded on an amortized cost basis.
34

CITY OF BELL GARDENS NOTES TO FINANCIAL STATEMENTS (CONTINUED) JUNE 30, 2011 Note 3: Cash and Investments (Continued)
Credit Risk
Generally, credit risk is the risk that an issuer of an investment will not fulfill its obligation to the holder of the investment. This is measured by the assignment of a rating by a nationally recognized statistical rating organization. The City's investment policy limits investments in medium term notes (MTN’s) to those rated "A" or higher by Standard and Poor's (S&P) or by Moody's. It also limits the investments in commercial paper to those rated "A1+" or higher by Standard and Poor's (S&P) or “P1” by Moody's. As of June 30, 2011, the City invested in treasury obligations. All securities were investment grade and were legal under State law. Investments in U.S. treasuries are not considered to have credit risk and, therefore, their credit quality is not disclosed. As of June 30, 2011, the City's investments in external investment pools and money market mutual funds are unrated. On August 5, 2011, Standard & Poor's Ratings Services lowered its long-term sovereign credit rating on the United States of America to AA+ from AAA. As a result, on August 8, 2011, Standard & Poor's Ratings Services lowered its issuer credit ratings and related issue ratings on various Federal Home Loan Bank, Federal Farm Credit Bank, Fannie Mae and Freddie Mac to AA+ from AAA. The City invests in LAIF which invests in various underlying securities, including the federal agency securities listed above. While LAIF is not rated, the federal agency securities are, and these have been affected by this rating change as well.
Concentration of Credit Risk The City’s investment policy does not impose restrictions on the maximum percentage it can invest in a single type of investment. As of June 30, 2011, in accordance with GASB Statement No. 40 requirements, the City is exposed to concentration of credit risk whenever they have invested more than 5% of their total investments in any one issuer. As of June 30, 2011, the City was not exposed to concentration of credit risk.
Custodial Credit Risk The custodial credit risk for deposits is the risk that, in the event of the failure of a depository financial institution, a government will not be able to recover deposits or will not be able to recover collateral securities that are in the possession of an outside party. The custodial credit risk for investments is the risk that, in the event of the failure of the counterparty to a transaction, a government will not be able to recover the value of investment or collateral securities that are in the possession of an outside party. Custodial credit risk does not apply to a local government's indirect investment in securities through the use of mutual funds or government investment pools (such as LAIF). As of June 30, 2011, none of the City’s deposits or investments were exposed to custodial credit risk.
35
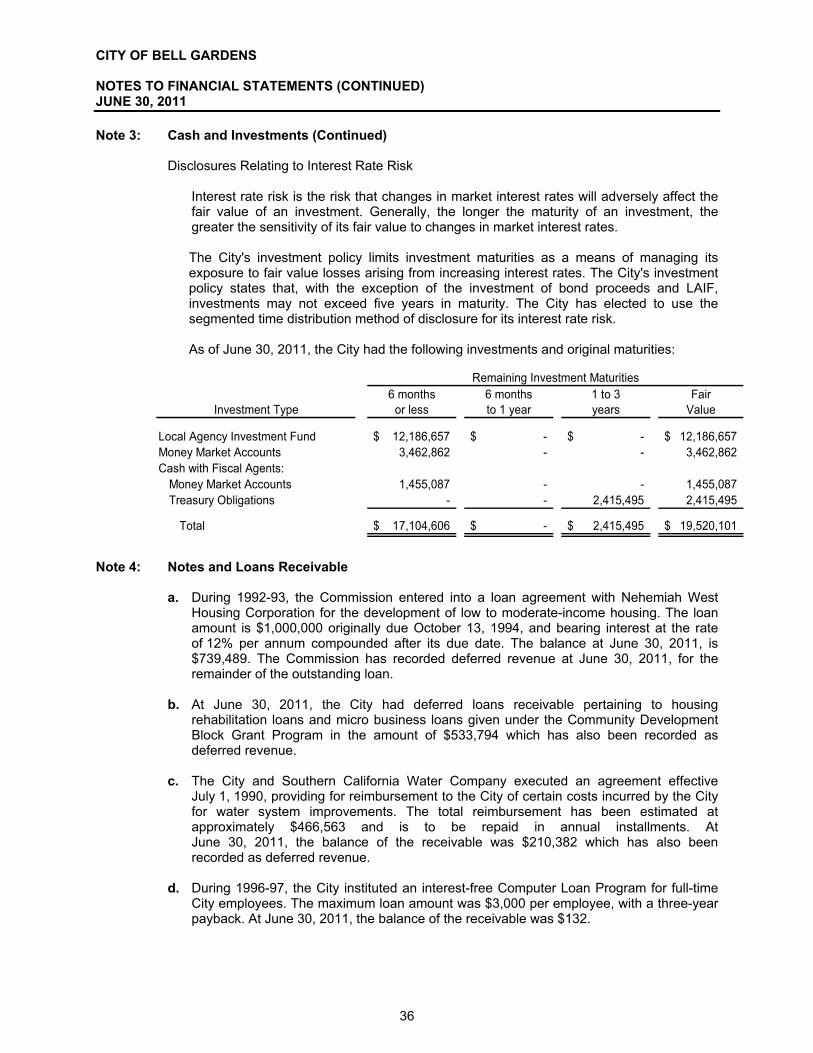
CITY OF BELL GARDENS NOTES TO FINANCIAL STATEMENTS (CONTINUED) JUNE 30, 2011 Note 3: Cash and Investments (Continued)
Disclosures Relating to Interest Rate Risk
Interest rate risk is the risk that changes in market interest rates will adversely affect the fair value of an investment. Generally, the longer the maturity of an investment, the greater the sensitivity of its fair value to changes in market interest rates. The City's investment policy limits investment maturities as a means of managing its exposure to fair value losses arising from increasing interest rates. The City's investment policy states that, with the exception of the investment of bond proceeds and LAIF, investments may not exceed five years in maturity. The City has elected to use the segmented time distribution method of disclosure for its interest rate risk. As of June 30, 2011, the City had the following investments and original maturities:
Investment Type
Local Agency Investment Fund 12,186,657$ -$ -$ 12,186,657$ Money Market Accounts 3,462,862 - - 3,462,862 Cash with Fiscal Agents:
Money Market Accounts 1,455,087 - - 1,455,087 Treasury Obligations - - 2,415,495 2,415,495
Total 17,104,606$ -$ 2,415,495$ 19,520,101$
Remaining Investment Maturities6 months
or less6 months to 1 year
1 to 3 years
Fair Value
Note 4: Notes and Loans Receivable
a. During 1992-93, the Commission entered into a loan agreement with Nehemiah West Housing Corporation for the development of low to moderate-income housing. The loan amount is $1,000,000 originally due October 13, 1994, and bearing interest at the rate of 12% per annum compounded after its due date. The balance at June 30, 2011, is $739,489. The Commission has recorded deferred revenue at June 30, 2011, for the remainder of the outstanding loan.
b. At June 30, 2011, the City had deferred loans receivable pertaining to housing
rehabilitation loans and micro business loans given under the Community Development Block Grant Program in the amount of $533,794 which has also been recorded as deferred revenue.
c. The City and Southern California Water Company executed an agreement effective
July 1, 1990, providing for reimbursement to the City of certain costs incurred by the City for water system improvements. The total reimbursement has been estimated at approximately $466,563 and is to be repaid in annual installments. At June 30, 2011, the balance of the receivable was $210,382 which has also been recorded as deferred revenue.
d. During 1996-97, the City instituted an interest-free Computer Loan Program for full-time
City employees. The maximum loan amount was $3,000 per employee, with a three-year payback. At June 30, 2011, the balance of the receivable was $132.
36

CITY OF BELL GARDENS NOTES TO FINANCIAL STATEMENTS (CONTINUED) JUNE 30, 2011 Note 4: Notes and Loans Receivable (Continued)
e. During 1997-98, the City instituted a deferred loan program for academic scholarships. At
June 30, 2011, the balance of the loans outstanding is $749,533 which has also been recorded as deferred revenue.
f. On July 25, 2002, the Commission entered into a 10-year construction loan agreement
for the purpose of improving certain commercial real property described as the Premises in a Commercial Rehabilitation Loan Agreement dated July 10, 2002. The amount of the construction loan was $667,000 and originally bore interest at the rate of 6.0% annually, compounded monthly. On June 14, 2004, the Commission approved a reduction in the interest rate in the Note and Loan Agreement to 4.5% annually, compounded monthly, due principally to the overall drop in interest rates for commercial loans in recent periods. Monthly payments of $6,965 commence on July 1, 2004, and continue until June 1, 2014. The note was paid off during the current fiscal year.
g. The Bell Gardens Community Development Commission is required by State law to set aside funds to create and preserve housing that is affordable to low and moderate income families and individuals. The City has decided to utilize these funds for a second mortgage and/or closing costs, as needed for low-to-moderate income first time homebuyers. The City has established a not-to-exceed cap of $33,000 per case on an as needed basis. The Bell Gardens First Time Home Buyer Program is a deferred equity share loan secured by a second deed of trust and note with an annual rate of 3%. The loan shall become due and payable only when the property is sold, leased or transferred. Repayment terms of principal, shared equity and interest at 3% per annum simple interest vary depending on the year sold or transferred. After the twentieth year, the loan is forgiven. The Commission's share of equity in the property shall not exceed the proportional investment as a percentage of the original purchase price. The balance of the First Time Home Buyer Program at June 30, 2011, is $862,436 which has also been recorded as deferred revenue.
h. On April 1, 2005, Bell Gardens Housing Partners, L.P., a California limited partnership
promises to pay the Bell Gardens Community Development Commission $3,812,203 for the payment of public and private debts. The Commission has provided certain financial assistance in construction of a 72-unit senior affordable housing project by providing a Commission Loan (which is represented by this Promissory Note) in the amount of $3,812,203 for the acquisition and clearing of the site and to help defray Developer's costs. The promissory note amount shall bear simple interest at the rate of 3% per annum, and 10% per annum shall accrue upon the amount of each payment required upon the date each such payment is due. The Promissory Note shall be paid from “Residual Receipts”, defined as an amount equal to sixty-five percent (65%) of the net profits produced from the project (on a prorate basis), until the note amount has been repaid in full. Any remaining principal, interest and other amounts due and owing under this promissory note shall be paid in full on or before the fifty-fifth (55th) anniversary of the date of the promissory note.
37
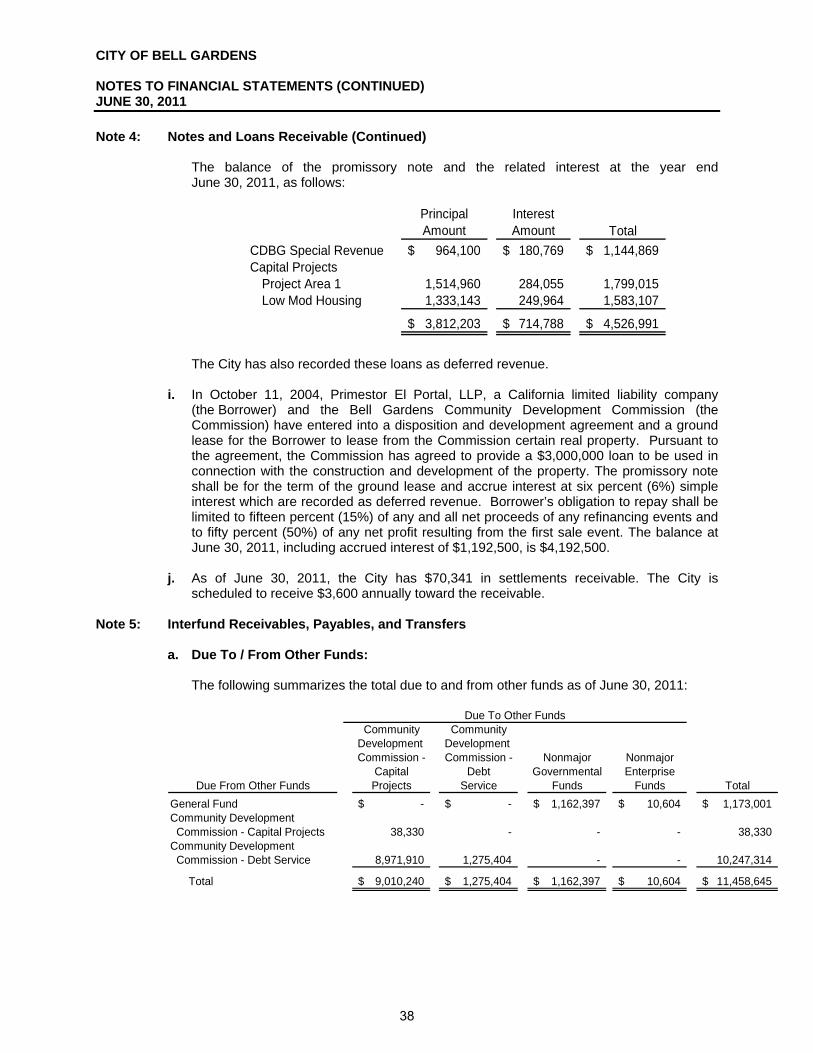
CITY OF BELL GARDENS NOTES TO FINANCIAL STATEMENTS (CONTINUED) JUNE 30, 2011 Note 4: Notes and Loans Receivable (Continued)
The balance of the promissory note and the related interest at the year end June 30, 2011, as follows:
Principal Amount
Interest Amount Total
CDBG Special Revenue 964,100$ 180,769$ 1,144,869$ Capital Projects
Project Area 1 1,514,960 284,055 1,799,015 Low Mod Housing 1,333,143 249,964 1,583,107
3,812,203$ 714,788$ 4,526,991$
The City has also recorded these loans as deferred revenue.
i. In October 11, 2004, Primestor El Portal, LLP, a California limited liability company (the Borrower) and the Bell Gardens Community Development Commission (the Commission) have entered into a disposition and development agreement and a ground lease for the Borrower to lease from the Commission certain real property. Pursuant to the agreement, the Commission has agreed to provide a $3,000,000 loan to be used in connection with the construction and development of the property. The promissory note shall be for the term of the ground lease and accrue interest at six percent (6%) simple interest which are recorded as deferred revenue. Borrower’s obligation to repay shall be limited to fifteen percent (15%) of any and all net proceeds of any refinancing events and to fifty percent (50%) of any net profit resulting from the first sale event. The balance at June 30, 2011, including accrued interest of $1,192,500, is $4,192,500.
j. As of June 30, 2011, the City has $70,341 in settlements receivable. The City is
scheduled to receive $3,600 annually toward the receivable. Note 5: Interfund Receivables, Payables, and Transfers
a. Due To / From Other Funds:
The following summarizes the total due to and from other funds as of June 30, 2011:
Community CommunityDevelopment Development Commission - Commission - Nonmajor Nonmajor
Capital Debt Governmental EnterpriseDue From Other Funds Projects Service Funds Funds Total
General Fund -$ -$ 1,162,397$ 10,604$ 1,173,001$ Community Development Commission - Capital Projects 38,330 - - - 38,330 Community Development Commission - Debt Service 8,971,910 1,275,404 - - 10,247,314
Total 9,010,240$ 1,275,404$ 1,162,397$ 10,604$ 11,458,645$
Due To Other Funds
38

CITY OF BELL GARDENS NOTES TO FINANCIAL STATEMENTS (CONTINUED) JUNE 30, 2011 Note 5: Interfund Receivables, Payables, and Transfers (Continued)
Inter-fund receivables and payables at June 30, 2011, are the result of the elimination of deficit cash balances in individual funds and routine inter-fund transactions not cleared at the end of the fiscal year.
b. Transfers To / From Other Funds:
The following summarizes the total transfers in and transfers out to other funds as of June 30, 2011:
Nonmajor NonmajorGeneral Governmental Enterprise
Transfers Out Fund Funds Funds TotalGeneral Fund -$ 251,076$ 487,372$ 738,448$ Nonmajor Governmental Funds - 753,645 - 753,645 Water Fund 244,000 - - 244,000 Total 244,000$ 1,004,721$ 487,372$ 1,736,093$
Transfer In
The General Fund transferred funds to Nonmajor Governmental Funds to fund capital projects and to pay for operating costs. The General Fund also transferred funds to the Nonmajor Enterprise Funds to cover for the Golf Course Fund’s operation deficit. The transfer of $756,645 between Nonmajor Governmental Funds was to reimburse Proposition “A” Fund for expenditure incurred on behalf of Proposition “C” Fund. The transfer to the General Fund from the Water Fund was for reimbursement of the debt service payment on the 2006 Certificates of Participation.
c. Advances To / From Other Funds
The following summarizes the total advances to and from other funds as of June 30, 2011:
Advances From Other Funds Community
DevelopmentCommission -
CapitalAdvances To Other Funds Projects
General Fund 50,969,616$ Commission Development Commission - Debt Service 821,804 Total 51,791,420$
Advances to the Community Development Commission – Capital Project Fund from the General Fund in the amount of $50,969,616 were to provide cash to the Commission for capital projects.
39

CITY OF BELL GARDENS NOTES TO FINANCIAL STATEMENTS (CONTINUED) JUNE 30, 2011 Note 5: Interfund Receivables, Payables, and Transfers (Continued)
Advances to the Community Development Commission – Capital Project from the Community Development Commission – Debt Service Fund in the amount of $821,804 were to provide fund to repay the advances due to the City.
Note 6: Capital Assets
A summary of the changes in capital asset activity for the year ended June 30, 2011, is as follows:
Beginning EndingBalance Increases Decreases Transfers Balance
Governmental Activities:Capital assets, not being depreciated:
Land 69,022,714$ -$ -$ -$ 69,022,714$ Construction-in-progress 960,509 2,544,215 - (838,945) 2,665,779
Total Capital Assets, Not Being Depreciated 69,983,223 2,544,215 - (838,945) 71,688,493
Capital assets, being depreciated:Buildings and structures 14,851,179 - - - 14,851,179 Equipment 6,854,408 35,274 270,931 - 6,618,751 Infrastructure 41,880,193 - 326,161 838,945 42,392,977
Total Capital Assets, Being Depreciated 63,585,780 35,274 597,092 838,945 63,862,907
Less accumulated depreciation:Buildings and structures 4,093,153 533,911 - - 4,627,064 Machinery and equipment 5,101,113 574,670 270,931 - 5,404,852 Infrastructure 14,681,867 1,710,411 245,413 - 16,146,865
Total Accumulated Depreciation 23,876,133 2,818,992 516,344 - 26,178,781
Total Capital Assets, Being Depreciated, Net 39,709,647 (2,783,718) 80,748 838,945 37,684,126
Governmental Activities Capital Assets, Net 109,692,870$ (239,503)$ 80,748$ -$ 109,372,619$
Depreciation expense was charged to functions/programs of the primary government in the Governmental Activities as follows:
Governmental Activities:General government 954,426$ Public works 1,864,566
Total Depreciation Expense - Governmental Activities 2,818,992$
40

CITY OF BELL GARDENS NOTES TO FINANCIAL STATEMENTS (CONTINUED) JUNE 30, 2011 Note 6: Capital Assets (Continued)
Beginning EndingBalance Increases Decreases Balance
Business-Type Activities:Capital assets, not being depreciated:
Land 1,011,000$ -$ -$ 1,011,000$ Construction in progress 394,136 35,666 - 429,802
Total Capital Assets, Not Being Depreciated 1,405,136 35,666 - 1,440,802
Capital assets, being depreciated:Water rights 1,914,000 - - 1,914,000 Equipment 5,738,884 - - 5,738,884
Total Capital Assets, Being Depreciated 7,652,884 - - 7,652,884
Less accumulated depreciation:Water rights 382,800 19,140 - 401,940 Equipment 1,188,958 165,089 - 1,354,047
Total Accumulated Depreciation 1,571,758 184,229 - 1,755,987
Total Capital Assets, Being Depreciated, Net 6,081,126 (184,229) - 5,896,897
Business-Type Activities Capital Assets, Net 7,486,262$ (148,563)$ -$ 7,337,699$
Depreciation expense was charged to functions/programs of the primary government in the Business-Type Activities as follows:
Business-Type Activities:Water 177,156$ Golf Course 7,073
Total Depreciation Expense - Business-Type Activities 184,229$
41

CITY OF BELL GARDENS NOTES TO FINANCIAL STATEMENTS (CONTINUED) JUNE 30, 2011 Note 7: Long-Term Debt
a. Governmental Activities The following is a schedule of changes in governmental fund long-term debt for the year ended June 30, 2011:
Balance Balance Due Within
July 1, 2010 Additions Deletions June 30, 2011 One Year
2003 Tax Allocation Bonds - Project Area No. 1 6,080,000$ -$ 360,000$ 5,720,000$ 375,000$ Central City Project Area 8,400,000 - 255,000 8,145,000 265,000
2005 Revenue Bonds Series A -Project Area No. 1 1,535,000 - 70,000 1,465,000 80,000 Central City Project Area 2,895,000 - 65,000 2,830,000 70,000
2006 Certificates of Participation 3,590,000 - 80,000 3,510,000 80,000 Notes Payable:
Bear Sterns 9,052,911 - 162,644 8,890,267 172,607 County of Los Angeles - Section 108 4,079,000 - 348,000 3,731,000 371,000
Accrued leave benefits 2,445,026 1,390,700 1,253,231 2,582,495 713,000 Other post employment benefits obligation 5,174,113 2,713,624 395,486 7,492,251 -
Sub-total 43,251,050$ 4,104,324$ 2,989,361$ 44,366,013 2,126,607$
Unamortized Bond Premium 364,022 Unamortized Bond Discount (104,745)
Total 44,625,290$
2003 Tax Allocation Bonds
On June 17, 2003, the Commission issued $17,705,000 of refunding revenue bonds with an average interest rate of 3.9% to advance refund $13.7 million of outstanding 1993 revenue bonds with an average interest rate of 6.25%. The net proceeds of $17.5 million (after payment of insurance, underwriter discount and other issuance cost) plus an additional 2.1 million of 1993 series monies were used to purchase U.S. government securities. Those securities were deposited in an irrevocable trust with an escrow agent to provide for all future debt service payments on the 1993 bonds. At June 30, 2011, the unamortized discount outstanding was $62,741 and the total bonds outstanding was $13,865,000. The annual requirements to amortize the outstanding bond indebtedness as of June 30, 2011, including interest, are as follows:
Principal Interest2011-2012 640,000$ 692,095$ 2012-2013 670,000 665,097 2013-2014 695,000 636,119 2014-2015 725,000 605,158 2015-2016 755,000 571,835 2016-2021 4,350,000 2,267,771 2021-2026 3,570,000 1,146,930 2026-2031 2,460,000 299,331
Totals 13,865,000$ 6,884,336$
42
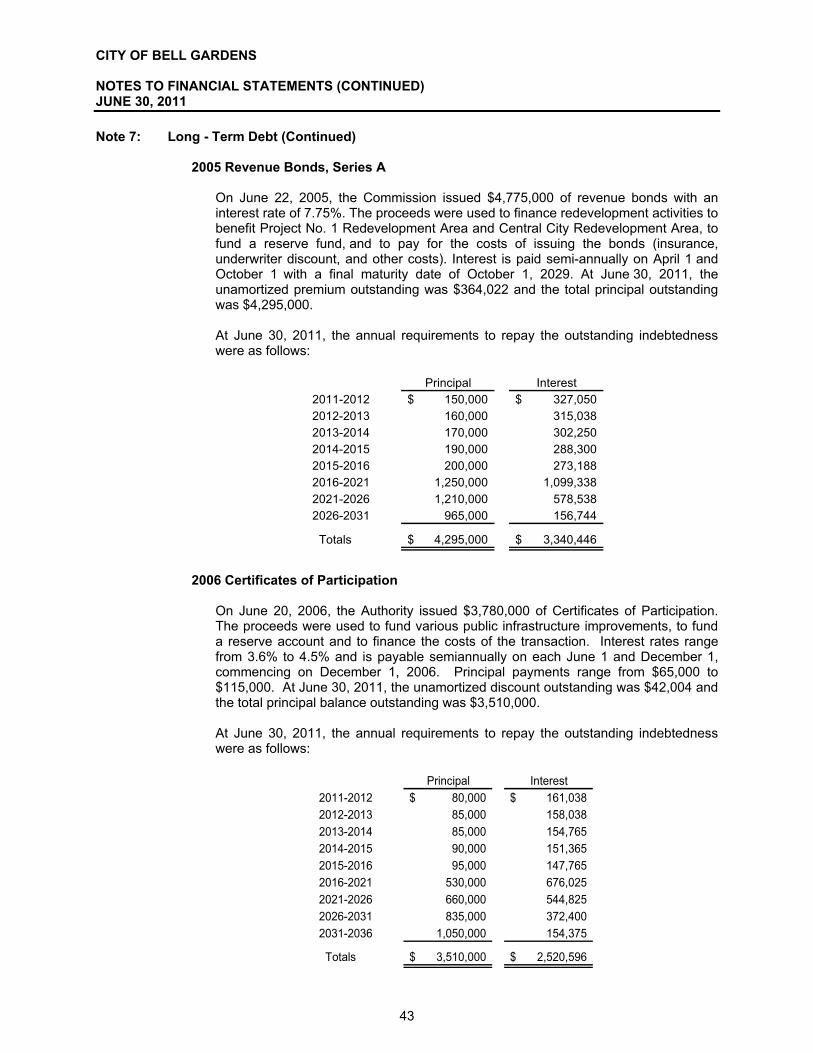
CITY OF BELL GARDENS NOTES TO FINANCIAL STATEMENTS (CONTINUED) JUNE 30, 2011 Note 7: Long - Term Debt (Continued)
2005 Revenue Bonds, Series A
On June 22, 2005, the Commission issued $4,775,000 of revenue bonds with an interest rate of 7.75%. The proceeds were used to finance redevelopment activities to benefit Project No. 1 Redevelopment Area and Central City Redevelopment Area, to fund a reserve fund, and to pay for the costs of issuing the bonds (insurance, underwriter discount, and other costs). Interest is paid semi-annually on April 1 and October 1 with a final maturity date of October 1, 2029. At June 30, 2011, the unamortized premium outstanding was $364,022 and the total principal outstanding was $4,295,000. At June 30, 2011, the annual requirements to repay the outstanding indebtedness were as follows:
Principal Interest2011-2012 150,000$ 327,050$ 2012-2013 160,000 315,038 2013-2014 170,000 302,250 2014-2015 190,000 288,300 2015-2016 200,000 273,188 2016-2021 1,250,000 1,099,338 2021-2026 1,210,000 578,538 2026-2031 965,000 156,744
Totals 4,295,000$ 3,340,446$
2006 Certificates of Participation
On June 20, 2006, the Authority issued $3,780,000 of Certificates of Participation. The proceeds were used to fund various public infrastructure improvements, to fund a reserve account and to finance the costs of the transaction. Interest rates range from 3.6% to 4.5% and is payable semiannually on each June 1 and December 1, commencing on December 1, 2006. Principal payments range from $65,000 to $115,000. At June 30, 2011, the unamortized discount outstanding was $42,004 and the total principal balance outstanding was $3,510,000. At June 30, 2011, the annual requirements to repay the outstanding indebtedness were as follows:
Principal Interest
2011-2012 80,000$ 161,038$ 2012-2013 85,000 158,038 2013-2014 85,000 154,765 2014-2015 90,000 151,365 2015-2016 95,000 147,765 2016-2021 530,000 676,025 2021-2026 660,000 544,825 2026-2031 835,000 372,400 2031-2036 1,050,000 154,375
Totals 3,510,000$ 2,520,596$
43
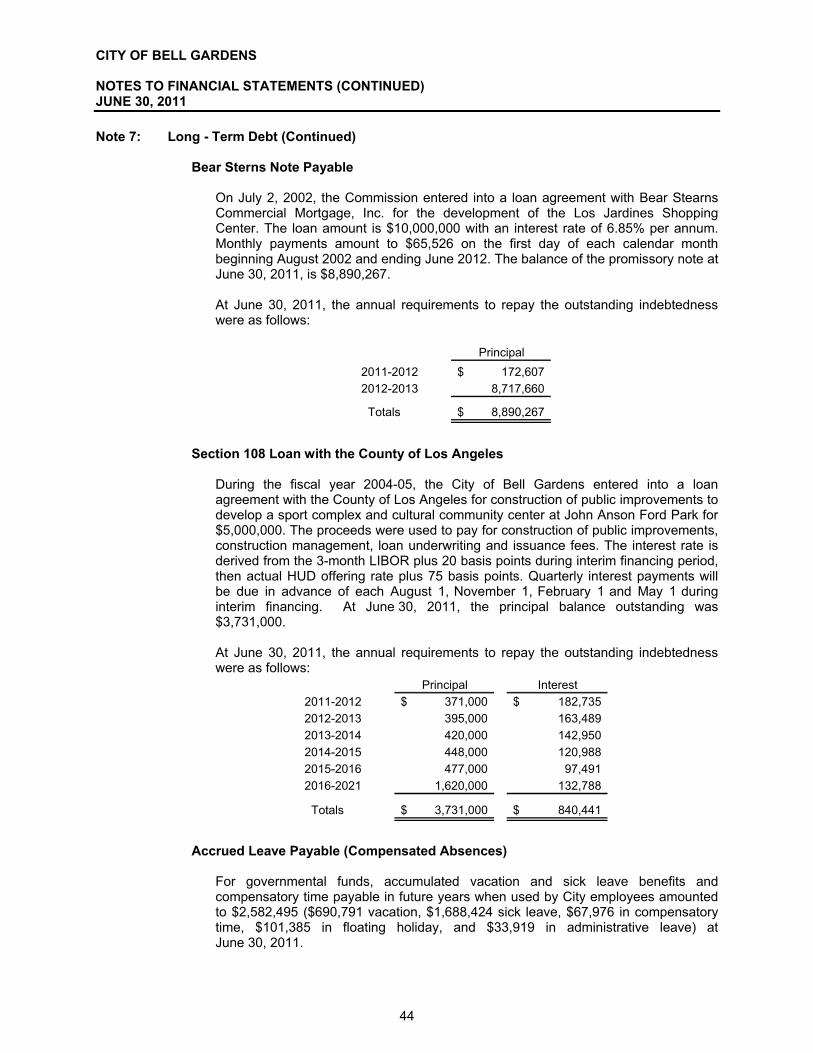
CITY OF BELL GARDENS NOTES TO FINANCIAL STATEMENTS (CONTINUED) JUNE 30, 2011 Note 7: Long - Term Debt (Continued)
Bear Sterns Note Payable
On July 2, 2002, the Commission entered into a loan agreement with Bear Stearns Commercial Mortgage, Inc. for the development of the Los Jardines Shopping Center. The loan amount is $10,000,000 with an interest rate of 6.85% per annum. Monthly payments amount to $65,526 on the first day of each calendar month beginning August 2002 and ending June 2012. The balance of the promissory note at June 30, 2011, is $8,890,267. At June 30, 2011, the annual requirements to repay the outstanding indebtedness were as follows:
Principal
2011-2012 172,607$ 2012-2013 8,717,660
Totals 8,890,267$
Section 108 Loan with the County of Los Angeles
During the fiscal year 2004-05, the City of Bell Gardens entered into a loan agreement with the County of Los Angeles for construction of public improvements to develop a sport complex and cultural community center at John Anson Ford Park for $5,000,000. The proceeds were used to pay for construction of public improvements, construction management, loan underwriting and issuance fees. The interest rate is derived from the 3-month LIBOR plus 20 basis points during interim financing period, then actual HUD offering rate plus 75 basis points. Quarterly interest payments will be due in advance of each August 1, November 1, February 1 and May 1 during interim financing. At June 30, 2011, the principal balance outstanding was $3,731,000. At June 30, 2011, the annual requirements to repay the outstanding indebtedness were as follows:
Principal Interest2011-2012 371,000$ 182,735$ 2012-2013 395,000 163,489 2013-2014 420,000 142,950 2014-2015 448,000 120,988 2015-2016 477,000 97,491 2016-2021 1,620,000 132,788
Totals 3,731,000$ 840,441$
Accrued Leave Payable (Compensated Absences)
For governmental funds, accumulated vacation and sick leave benefits and compensatory time payable in future years when used by City employees amounted to $2,582,495 ($690,791 vacation, $1,688,424 sick leave, $67,976 in compensatory time, $101,385 in floating holiday, and $33,919 in administrative leave) at June 30, 2011.
44

CITY OF BELL GARDENS NOTES TO FINANCIAL STATEMENTS (CONTINUED) JUNE 30, 2011 Note 7: Long - Term Debt (Continued)
Other Post Employment Benefits Obligation
The City’s policies relating to other post employment benefits are described in Note 9 of the Notes to Financial Statements. The liability will be paid in future years by the general fund.
Debt Service Requirements
The Bell Gardens Community Development Commission has pledged, as security for bonds it has issued, either directly or through the Financing Authority, a portion of the tax increment revenue (including Low and Moderate Income Housing set-aside) that it receives. These bonds were to provide financing for various capital projects, accomplish Low and Moderate Income Housing projects and to defease previously issued bonds. The Commission has committed to appropriate each year, from these resources amounts sufficient to cover the principal and interest requirements on the debt. Total principal and interest remaining on the debt is $28,384,782 with annual debt service requirements as indicated above. For the current year, the total tax increment revenue, net of pass through payments, recognized by the Commission was $3,432,026 and the debt service obligation on the bonds was $1,804,846.
b. Business-Type Activities
The following is a schedule of changes in proprietary fund long-term debt for the year ended June 30, 2011:
Balance Balance Due Within
July 1, 2010 Additions Deletions June 30, 2011 One Year
2004 Revenue Bonds 4,220,000$ -$ 210,000$ 4,010,000$ 215,000$
Total 4,220,000$ -$ 210,000$ 4,010,000 215,000$
Unamortized bond premium 5,250 Unamortized loss on refunding (157,679)
Total 3,857,571$
2004 Water Refunding Revenue Bonds
During fiscal year 2004-2005, the Bell Gardens Financing Authority issued $5,240,000 of refunding revenue bonds to refund the 1994 water revenue bonds and pay the cost of issuing the bonds (insurance, underwriter discount, and other costs). The maturity date of the bonds is October 1, 2024. The interest rate ranges from 1.75% to 4.875%. At June 30, 2011, the unamortized premium on the 2004 water refunding revenue bonds was $5,250 and the outstanding balance was $4,010,000.
45

CITY OF BELL GARDENS NOTES TO FINANCIAL STATEMENTS (CONTINUED) JUNE 30, 2011 Note 7: Long - Term Debt (Continued)
The debt service requirements to maturity for the revenue bonds outstanding at June 30, 2011, are as follows:
Principal Interest
2011-2012 215,000$ 176,518$ 2012-2013 225,000 168,705 2013-2014 230,000 160,343 2014-2015 240,000 151,230 2015-2016 250,000 140,805 2016-2021 1,435,000 514,426 2021-2026 1,415,000 140,041
Totals 4,010,000$ 1,452,068$
Note 8: Defined Benefit Pension Plan
Plan Description
The City of Bell Gardens contributes to the California Public Employees Retirement System (CalPERS), a cost-sharing multiple-employer defined benefit pension plan. CalPERS provides retirement and disability benefits, annual cost of living adjustments, and death benefits to plan members and beneficiaries. CalPERS acts as a common investment and administrative agent for participating public entities within the State of California. Benefit provisions and all other requirements are established by state statute and city ordinance. Copies of CalPERS' annual financial report may be obtained from their executive office: 400 P Street, Sacramento, CA 95814.
Funding Policy
Participants are required to contribute 8% (9% for safety employees) of their annual covered salary. The City makes the contributions required of City employees on their behalf and for their account. The City is required to contribute at an actuarially determined rate; the current rate is 12.431% for miscellaneous employees and 39.974% for police employees of annual covered payroll. The contribution requirements of plan members and the City are established and may be amended by PERS.
Annual Pension Cost
For 2011, the City's annual pension cost of $3,458,954 for PERS was equal to the City's required and actual contributions. The required contribution was determined as part of the June 30, 2010, actuarial valuation using the entry age normal actuarial cost method.
46
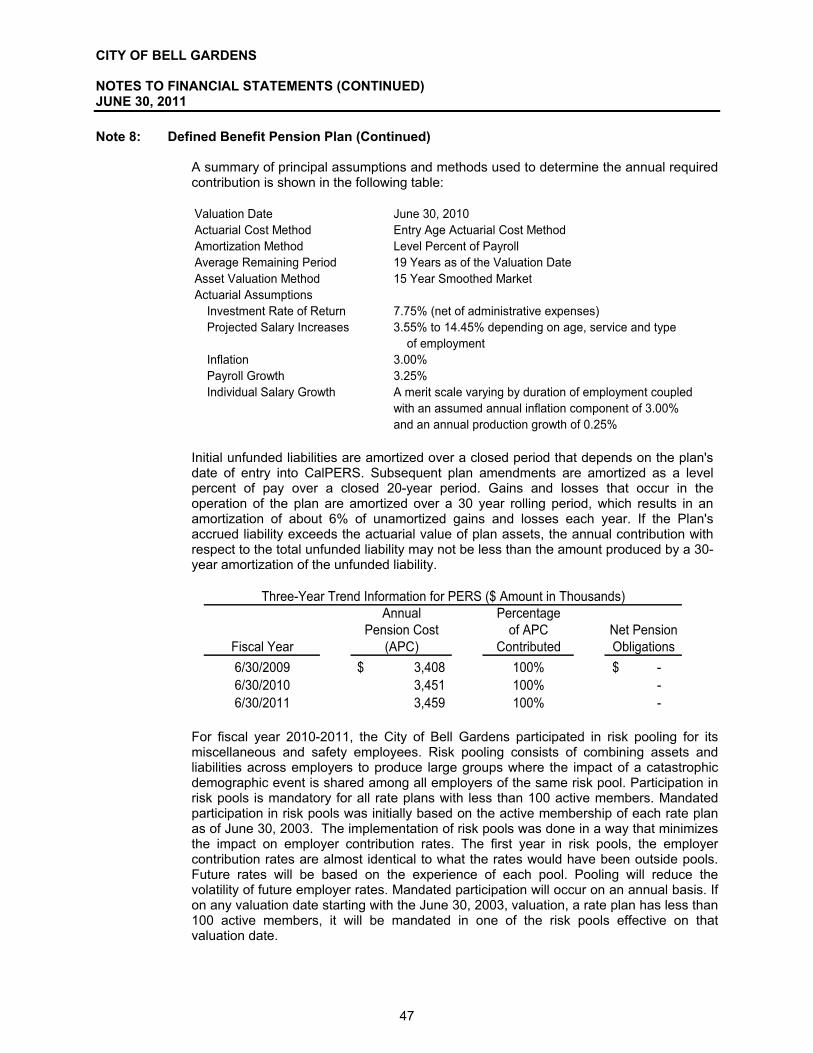
CITY OF BELL GARDENS NOTES TO FINANCIAL STATEMENTS (CONTINUED) JUNE 30, 2011 Note 8: Defined Benefit Pension Plan (Continued)
A summary of principal assumptions and methods used to determine the annual required contribution is shown in the following table:
Valuation Date June 30, 2010Actuarial Cost Method Entry Age Actuarial Cost MethodAmortization Method Level Percent of PayrollAverage Remaining Period 19 Years as of the Valuation Date Asset Valuation Method 15 Year Smoothed MarketActuarial Assumptions
Investment Rate of Return 7.75% (net of administrative expenses)Projected Salary Increases 3.55% to 14.45% depending on age, service and type
of employmentInflation 3.00%Payroll Growth 3.25%Individual Salary Growth A merit scale varying by duration of employment coupled
with an assumed annual inflation component of 3.00%and an annual production growth of 0.25%
Initial unfunded liabilities are amortized over a closed period that depends on the plan's date of entry into CalPERS. Subsequent plan amendments are amortized as a level percent of pay over a closed 20-year period. Gains and losses that occur in the operation of the plan are amortized over a 30 year rolling period, which results in an amortization of about 6% of unamortized gains and losses each year. If the Plan's accrued liability exceeds the actuarial value of plan assets, the annual contribution with respect to the total unfunded liability may not be less than the amount produced by a 30-year amortization of the unfunded liability.
Annual PercentagePension Cost of APC Net Pension
Fiscal Year (APC) Contributed Obligations6/30/2009 3,408$ 100% -$ 6/30/2010 3,451 100% - 6/30/2011 3,459 100% -
Three-Year Trend Information for PERS ($ Amount in Thousands)
For fiscal year 2010-2011, the City of Bell Gardens participated in risk pooling for its miscellaneous and safety employees. Risk pooling consists of combining assets and liabilities across employers to produce large groups where the impact of a catastrophic demographic event is shared among all employers of the same risk pool. Participation in risk pools is mandatory for all rate plans with less than 100 active members. Mandated participation in risk pools was initially based on the active membership of each rate plan as of June 30, 2003. The implementation of risk pools was done in a way that minimizes the impact on employer contribution rates. The first year in risk pools, the employer contribution rates are almost identical to what the rates would have been outside pools. Future rates will be based on the experience of each pool. Pooling will reduce the volatility of future employer rates. Mandated participation will occur on an annual basis. If on any valuation date starting with the June 30, 2003, valuation, a rate plan has less than 100 active members, it will be mandated in one of the risk pools effective on that valuation date.
47

CITY OF BELL GARDENS NOTES TO FINANCIAL STATEMENTS (CONTINUED) JUNE 30, 2011 Note 9: Other Post-Retirement Benefits
Plan Description
In addition to the pension benefits described above, the City provides retiree health insurance benefits. In accordance with the plan, which was approved by the City Council, these benefits are available to all employees who are eligible for normal PERS retirement and who retire after January 1, 1990. The City pays for monthly medical, dental and vision premium. The portion paid is based on years of service at retirement. Executives receive 10% for each year and 100% at 10 years. All other receive 0% for the first four years, 50% at five years plus 10% each year thereafter up to 100%.
Funding Policy
Currently the City funds retiree healthcare benefits on a pay-as-you-go basis. The City recognizes expenditure for its share of the annual premiums as these benefits become due. For fiscal year 2010-2011, the City paid $395,486 for benefits of 20 retired employees.
Annual OPEB Cost and Net OPEB Obligation
The City’s annual other post-retirement benefit (OPEB) cost is calculated based on the annual required contribution of the employer (ARC), an amount actuarially determined in accordance with the parameters of GASB Statement No. 45. The ARC represents a level of funding that, if paid on an ongoing basis, is projected to cover normal cost each year and amortize any unfunded actuarial liabilities over a period not to exceed thirty years. The following table shows the components of the City’s annual OPEB cost for the year, the amount actually contributed to the plan, and changes in the City’s net OPEB obligation:
Annual required contribution (ARC) 2,900,609$ Interest on net pension obligation 206,965 Adjustment to ARC (393,950)
Annual OPEB cost 2,713,624 Contribution made 395,486
Increase (decrease) in net OPEB obligation 2,318,138 Net OPEB obligation - July 1, 2010 5,174,113 Net OPEB obligation - June 30, 2011 7,492,251$
The City’s annual OPEB cost, the percentage of annual OPEB cost contributed to the plan, and the net OPEB obligation for the 2010-11 fiscal year and the two preceding years were as follows:
Actual Percentage of
Fiscal Year Annual Contribution Annual OPEB Net OPEBEnded OPEB Cost (Net of Adjustments) Cost Contributed Obligation
06/30/09 2,900,609$ 221,435$ 7.63% 2,679,174$ 06/30/10 2,810,638 315,699 11.23% 5,174,113 06/30/11 2,713,624 395,486 14.57% 7,492,251
48

CITY OF BELL GARDENS NOTES TO FINANCIAL STATEMENTS (CONTINUED) JUNE 30, 2011 Note 9: Other Post-Retirement Benefits (Continued)
Funded Status and Funding Progress
Actuarial valuations of an ongoing plan involve estimates of the value of reported amounts and assumptions about the probability of occurrence of events far into the future. Examples include assumptions about future employment, mortality, and the healthcare cost trends. Amounts determined regarding the funded status of the plan and the annual required contributions of the employer are subject to continual revision as actual results are compared with past expectations and new estimates are made about the future. The schedule of funding progress below presents multiyear trend information about whether the actuarial value of plan assets is increasing or decreasing over time relative to the actuarial accrued liabilities for benefits. Only one year is presented as this is the second year of the plan and a new actuarial has not been performed.
ActuarialAccrued UAAL as
Actuarial Actuarial Liability Unfunded a % ofValuation Valuation of (AAL) Entry AAL Funded Covered Covered
date Assets Age (UAAL) Ratio Payroll Payroll
6/30/2009 -$ 29,230$ 29,230$ 0.0% 8,781$ 332.9%
Schedule of Funding Progress for OPEB(Amount in Thousands)
Actuarial Methods and Assumptions
Projections of benefits for financial reporting purposes are based on the substantive plan (the plan as understood by the employer and the plan members) and include the types of benefits provided at the time of each valuation and the historical pattern of sharing of benefit costs between the employer and plan members to that point. The actuarial methods and assumptions used include techniques that are designed to reduce the effects of short-term volatility in actuarial accrued liabilities and the actuarial value of assets, consistent with the long-term perspective of the calculations. The actuarial valuation, dated June 30, 2009, used the frozen entry age actuarial cost method, a discount rate of 4.00% which is the long-term expected rate of return on the City’s investment fund, and a medical cost trend of 7.0%, 3.5% and 2.0% per year for medical, dental and vision respectively. The unfunded accrued actuarial liability (UAAL) is being amortized over a fixed 20-year period as a level percentage of payroll beginning with the 2009-10 fiscal year. As of the actuarial valuation date, the City had 131 active participants and 38 retirees receiving benefits.
Note 10: Insurance a. Description of Self-Insurance Pool Pursuant to Joint Powers Agreement
The City of Bell Gardens is a member of the California Joint Powers Insurance Authority (the Authority). The Authority is composed of 121 California public entities and is organized under a joint powers agreement pursuant to California Government Code §6500 et seq. The purpose of the Authority is to arrange and administer programs for the pooling of self-insured losses, to purchase excess insurance or reinsurance, and to
49

CITY OF BELL GARDENS NOTES TO FINANCIAL STATEMENTS (CONTINUED) JUNE 30, 2011 Note 10: Insurance (Continued)
arrange for group purchased insurance for property and other lines of coverage. The California JPIA began covering claims of its members in 1978. Each member government has an elected official as its representative on the Board of Directors. The Board operates through a nine-member Executive Committee.
b. Self-Insurance Programs of the Authority
A revised cost allocation methodology was introduced in 2010-2011, however it retains many elements of the previous allocation methodology. Each member pays an annual contribution (formally called the primary deposit) to cover estimated losses for the coverage period. The initial funding is paid at the beginning of the coverage period. After the close of the coverage period, outstanding claims are valued. A retrospective deposit computation is then conducted annually thereafter until all claims incurred during the coverage period are closed on a pool-wide basis. The subsequent cost re-allocation among members based on actual claim development can result in adjustments of either refunds or additions deposits required. The total funding requirement for self-insurance programs is estimated using actuarial models and pre-funded through the annual contribution. Costs are allocated to individual agencies based on exposure (payroll) and experience (claims) relative to other members of the risk-sharing pool. Additional information regarding cost allocation methodology is provided below. General Liability - In the liability program claims are pooled separately between police and non-police exposures. (1) The payroll of each member is evaluated relative to the payroll of other members. A variable credibility factor is determined for each member, which establishes the weight applied to payroll and the weight applied to losses within the formula. (2) The first layer of losses includes incurred costs up to $30,000 for each occurrence and is evaluated as a percentage of the pool’s total incurred costs within the first layer. (3) The second layer of losses includes incurred costs from $30,000 to $750,000 for each occurrence and is evaluated as a percentage of the pool’s total incurred costs within the second layer. (4) Incurred costs in excess of $750,000 up to the reinsurance attachment point of $5 million are distributed based on the outcome of cost allocation within the first and second loss layers. (5) Costs of covered claims from $5 million to $10 million are paid under a reinsurance contract subject to a $2.5 million annual aggregate deductible. Costs of covered claims from $10 million to $15 million are paid under two reinsurance contracts subject to a combined $3 million annual aggregate deductible. On a cumulative basis for all 2010-11 reinsurance contracts the annual aggregate deductible is $5.5 million. (6) Costs of covered claims from $15 million up to $50 million are covered through excess insurance policies. The overall coverage limit for each member including all layers of coverage is $50 million per occurrence. Costs of covered claims for subsidence losses are paid by reinsurance and excess insurance with a pooled limit of $35 million per occurrence. This $35 million subsidence sub-limit is composed of (a) $5 million retained with the pool’s SIR, (b) $10 million in reinsurance and (c) $20 million in excess insurance. The excess insurance layer has a $20 million annual aggregate.
50

CITY OF BELL GARDENS NOTES TO FINANCIAL STATEMENTS (CONTINUED) JUNE 30, 2011 Note 10: Insurance (Continued)
Worker Compensation - The City of Bell Gardens also participates in the workers’ compensation pool administered by the Authority. In the workers’ compensation program claims are pooled separately between public safety (police and fire) and non-public safety exposures. (1) The payroll of each member is evaluated relative to the payroll of other members. A variable credibility factor is determined for each member, which establishes the weight applied to payroll and the weight applied to losses within the formula. (2) The first layer of losses includes incurred costs up to $50,000 for each occurrence and is evaluated as a percentage of the pool’s total incurred costs within the first layer. (3) The second layer of losses includes incurred costs from $50,000 to $100,000 for each occurrence and is evaluated as a percentage of the pool’s total incurred costs within the second layer. (4) Incurred costs in excess of $100,000 up to the reinsurance attachment point of $2 million are distributed based on the outcome of cost allocation within the first and second loss layers. (5) Costs of covered claims from $2 million up to statutory limits are paid under a reinsurance policy. Protection is provided per statutory liability under California Workers’ Compensation Law.
Employer’s Liability losses are pooled among members to $2 million. Coverage from $2 million to $4 million is purchased as part of a reinsurance policy, and Employer’s Liability losses from $4 million to $10 million are pooled among members.�
c. Purchased Insurance
Environmental Insurance - The City of Bell Gardens participates in the pollution legal liability insurance program (formerly called environmental insurance) which is available through the Authority. The policy covers sudden and gradual pollution of scheduled property, streets, and storm drains owned by the City of Bell Gardens. Coverage is on a claims-made basis. There is a $50,000 deductible. The Authority has a limit of $50 million for the 3-year period from July 1, 2008 through July 1, 2011. Each member of the Authority has a $10 million sub-limit during the 3-year term of the policy.
Property Insurance - The City of Bell Gardens participates in the all-risk property protection program of the Authority. This insurance protection is underwritten by several insurance companies. City of Bell Gardens property is currently insured according to a schedule of covered property submitted by the City of Bell Gardens to the Authority. City of Bell Gardens property currently has all-risk property insurance protection in the amount of $14,481,933. There is a $5,000 deductible per occurrence except for non-emergency vehicle insurance which has a $1,000 deductible. Premiums for the coverage are paid annually and are not subject to retrospective adjustments.
Crime Insurance - The City of Bell Gardens purchases crime insurance coverage in the amount of $1,000,000 with a $2,500 deductible. The fidelity coverage is provided through the Authority. Premiums are paid annually and are not subject to retrospective adjustments.
d. Adequacy of Protection
During the past three fiscal years, none of the above programs of protection experienced settlements or judgments that exceeded pooled or insured coverage. There were also no significant reductions in pooled or insured liability coverage in 2010-11.
51

CITY OF BELL GARDENS NOTES TO FINANCIAL STATEMENTS (CONTINUED) JUNE 30, 2011 Note 11: Contingent Liabilities
The City is a defendant in various lawsuits. Although the outcome of these lawsuits is not presently determinable, in the opinion of the City attorney the resolution of these matters will not have a material adverse effect on the financial condition of the City.
Note 12: Operating Lease Agreements
a. On November 9, 1987, the Bell Gardens Community Development Commission approved
a Lease Agreement with the Bicycle Club. The Bicycle Club agreed to lease property from the Commission for use as a parking lot. The lease term is 15 years at an annual minimum rent of $559,200 per year, adjusted every five years by the greater of the Consumer Price Index or 120%. During 1989-90 the parking lot was transferred to the City of Bell Gardens as a repayment of City loans. The lease agreement was assigned to the City along with the transfer. On July 1, 2005, the Bell Gardens Community Development Commission approved an amendment to the original lease in the amount of $633,535 and $239,179 for Parcel D and C, respectively. Rent paid to the City under this agreement was $1,839,044 for the year ended June 30, 2011.
b. On November 11, 1987, the Bell Gardens Community Development Commission
approved a Lease Agreement with the Bell Gardens Hotel Partnership. The Hotel Partnership agreed to lease property with all buildings, structures, improvements and fixtures thereon for the use as a hotel and restaurant. The lease term is 99 years at a revised rate of $81,510 per year, adjusted every five years by the Consumer Price Index, plus the excess, if any, of the sum of the following over the annual rate: 6.25% of gross room revenues, 3% of gross food and beverage revenues, and 10% of all other revenues. During 1991-92, the property was transferred to the City of Bell Gardens as a repayment of City loans. The lease agreement was assigned to the City along with the transfer. Rent paid to the City under this agreement was $125,620 for the year ended June 30, 2011.
c. On February 22, 1988, the Bell Gardens Community Development Commission approved a Lease Agreement with the Bell Gardens Associates. The agreement is to lease property with all buildings, structures, improvements and fixtures thereon for use as a shopping center. The lease term is 55 years at a revised rate of $736,830, adjusted every five years by 4% from the prior increase, plus one percent of gross revenues for the preceding year. During 1991-92, the property was transferred to the City of Bell Gardens as a repayment of City loans. Rent paid to the City under this agreement was $1,248,500 for the year ended June 30, 2011.
d. On November 22, 2010 the City of Bell Gardens approved a Lease Agreement with the
City of Lynwood. The agreement is to lease 700 Acre Feet of Central Basin Groundwater Annual Pumping Right with flex rights to the City of Lynwood. The lease term is 5 years beginning in 2010-2011 at $135 per acre feet and increasing annually by $5 per acre feet until the term of the lease has expired. Rent paid to the City under this agreement was $94,500 for the year ended June 30, 2011.
52
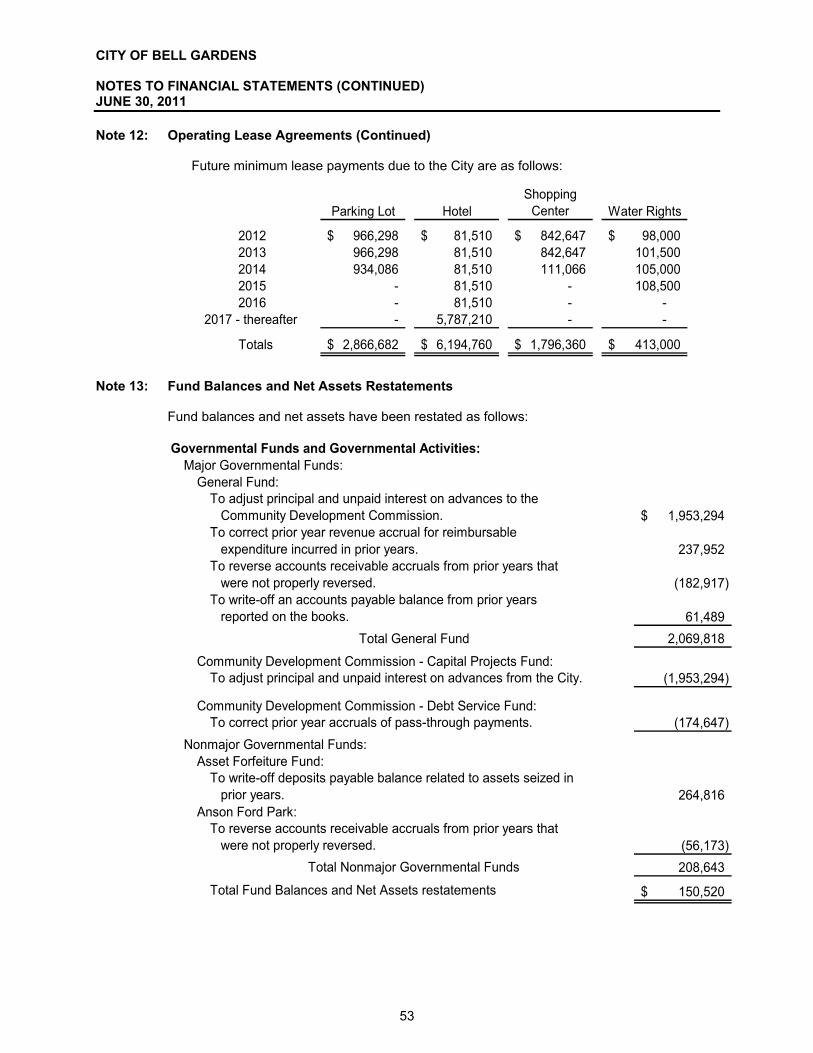
CITY OF BELL GARDENS NOTES TO FINANCIAL STATEMENTS (CONTINUED) JUNE 30, 2011 Note 12: Operating Lease Agreements (Continued)
Future minimum lease payments due to the City are as follows:
Parking Lot HotelShopping
Center Water Rights
2012 966,298$ 81,510$ 842,647$ 98,000$ 2013 966,298 81,510 842,647 101,500 2014 934,086 81,510 111,066 105,000 2015 - 81,510 - 108,500 2016 - 81,510 - -
2017 - thereafter - 5,787,210 - -
Totals 2,866,682$ 6,194,760$ 1,796,360$ 413,000$
Note 13: Fund Balances and Net Assets Restatements
Fund balances and net assets have been restated as follows: Governmental Funds and Governmental Activities:
Major Governmental Funds:General Fund:
To adjust principal and unpaid interest on advances to the Community Development Commission. 1,953,294$ To correct prior year revenue accrual for reimbursable expenditure incurred in prior years. 237,952 To reverse accounts receivable accruals from prior years that were not properly reversed. (182,917) To write-off an accounts payable balance from prior years reported on the books. 61,489
Total General Fund 2,069,818
Community Development Commission - Capital Projects Fund:To adjust principal and unpaid interest on advances from the City. (1,953,294)
Community Development Commission - Debt Service Fund:To correct prior year accruals of pass-through payments. (174,647)
Nonmajor Governmental Funds:Asset Forfeiture Fund:
To write-off deposits payable balance related to assets seized in prior years. 264,816
Anson Ford Park:To reverse accounts receivable accruals from prior years that were not properly reversed. (56,173)
Total Nonmajor Governmental Funds 208,643
Total Fund Balances and Net Assets restatements 150,520$
53

CITY OF BELL GARDENS NOTES TO FINANCIAL STATEMENTS (CONTINUED) JUNE 30, 2011 Note 14: Transactions with the State of California
SERAF Shift for fiscal year 2010-2011 On July 23, 2009, the State adopted legislation, requiring a shift of monies during fiscal years 2009-2010 and 2010-2011 to be deposited into the County “Supplemental” Educational Revenue Augmentation Fund (SERAF). These monies were to be distributed to meet the State’s Prop 98 obligations to schools. The California Redevelopment Association (CRA) and its member agencies filed a legal action in an attempt to stop these amounts from having to be paid; however, in May 2010, the Sacramento Superior Court upheld the legislation. The payment of the SERAF was due on May 10, 2011 for fiscal year 2010-2011 and was made in the amount of $261,810 using available resources from the debt service funds.
Note 15: California Redevelopment Agency Dissolution
On July 18, 2011, the California Redevelopment Association (“CRA”) and the League of California Cities (“League”) filed a petition for writ of mandate with the California Supreme Court, requesting the Court to declare unconstitutional two bills that were passed as part of the 2011-12 State Budget, AB1X 26 and 27 (California Redevelopment Association v. Matosantos). AB1X 26 dissolves redevelopment agencies effective October 1, 2011. AB1X 27 gave redevelopment agencies an option to avoid dissolution if it commits to making defined payments for the benefit of the State, school districts and certain special districts. In 2011-12, these payments amounted to a state-wide total of $1.7 billion. In 2012-13 and subsequent years, the payments totaled $400 million, annually. Each city or county’s share of these payments was determined based on its proportionate share of state-wide tax increment. On August 17, 2011 the Supreme Court issued a stay of the implementation of AB1X 26 and 27 which allowed a redevelopment agency to continue if it adopted an AB1X 27 ordinance. However, because of the effect of the stay order, the authority for the Redevelopment Agency to engage in most activities was suspended. The Supreme Court heard oral arguments on November 10, 2011 and on December 29, 2011 announced its decision in (California Redevelopment Association v. Matosantos). The court upheld AB1X 26 which eliminates redevelopment agencies, but invalidated in its entirety AB1X 27 which allowed redevelopment agencies to continue as long as they made the required payments. AB1X26 established deadlines for the process of Redevelopment Agency dissolution and the handling of existing obligations. The Court extended certain deadlines of AB1X 26 in its ruling by four months. The full text of AB1X 26 may be obtained from the California legislative information website maintained by the Legislative Counsel of the State of California at: http://www.leginfo.ca.gov/bilinfo.html.
�
54

THIS PAGE INTENTIONALLY LEFT BLANK
55

CITY OF BELL GARDENS
COMBINING BALANCE SHEETNONMAJOR GOVERNMENTAL FUNDS JUNE 30, 2011
Assets:Cash and investments 7$ 8,844$ 74,072$ 120,412$Receivables:
Accounts - - - -Notes and loans - - - -Accrued interest - 23 - 2
Due from other governments - 15,375 12,735 139,515
Total Assets 7$ 24,242$ 86,807$ 259,929$
Liabilities and Fund Balances:Liabilities:Accounts payable -$ 17,483$ 17,484$ 221,103$Accrued liabilities - - - 1,258Deferred revenues - - - -Unearned revenues - - - -Due to other governments - - - -Due to other funds - - - -
Total Liabilities - 17,483 17,484 222,361
Fund Balances:
CLEEP Grant Public Safety Augmentation
COPS State (SLESF) State Gas Tax
Special Revenue Funds
Fund Balances: Restricted for: Public safety 7 6,759 69,323 - Community development - - - - Parks and recreation - - - - Public works - - - 37,568 Capital Projects - - - - Committed to: Post employment benefits - - - - Unassigned - - - -
Total Fund Balances 7 6,759 69,323 37,568
Total Liabilities and Fund Balances 7$ 24,242$ 86,807$ 259,929$
56

CITY OF BELL GARDENS
COMBINING BALANCE SHEETNONMAJOR GOVERNMENTAL FUNDSJUNE 30, 2011
Assets:Cash and investmentsReceivables:
AccountsNotes and loansAccrued interest
Due from other governments
Total Assets
Liabilities and Fund Balances:Liabilities:Accounts payableAccrued liabilitiesDeferred revenuesUnearned revenuesDue to other governmentsDue to other funds
Total Liabilities
Fund Balances:
(Continued)
691,828$ 1,118,239$ -$ 476,372$
- - - -- - 1,678,663 -
42 126 - -36,002 93,004 222,760 74,442
727,872$ 1,211,369$ 1,901,423$ 550,814$
401$ 156,556$ 39,257$ 8,893$- 456 - 1,517- - 1,678,663 74,442- - - -- - - -- - 186,824 -
401 157,012 1,904,744 84,852
Special Revenue Funds
Asset Forfeiture
Waste Management
Community Development Block Grant
Proposition "A"
Fund Balances: Restricted for: Public safety Community development Parks and recreation Public works Capital Projects Committed to: Post employment benefits Unassigned
Total Fund Balances
Total Liabilities and Fund Balances
727,471 - - -- - - -- - - -- 1,054,357 - 465,962- - - -
- - - -- - (3,321) -
727,471 1,054,357 (3,321) 465,962
727,872$ 1,211,369$ 1,901,423$ 550,814$
57

CITY OF BELL GARDENS
COMBINING BALANCE SHEETNONMAJOR GOVERNMENTAL FUNDSJUNE 30, 2011
Assets:Cash and investmentsReceivables:
AccountsNotes and loansAccrued interest
Due from other governments
Total Assets
Liabilities and Fund Balances:Liabilities:Accounts payableAccrued liabilitiesDeferred revenuesUnearned revenuesDue to other governmentsDue to other funds
Total Liabilities
Fund Balances:
-$ 1,921$ 89,891$ 429,362$
- - - -- - - 749,533
61 3 6 36- 65,041 - -
61$ 66,965$ 89,897$ 1,178,931$
159,976$ 4,720$ 6,891$ -$- - 44 -- 65,041 - 749,533- - - -- - - -
398,871 - 134,862 -
558,847 69,761 141,797 749,533
Special Revenue Funds
Proposition "C"
Air Quality Improvement
Recycling Grants
Academic Pursuit
Fund Balances: Restricted for: Public safety Community development Parks and recreation Public works Capital Projects Committed to: Post employment benefits Unassigned
Total Fund Balances
Total Liabilities and Fund Balances
- - - -- - - 429,398- - - -- - - -- - - -
- - - -(558,786) (2,796) (51,900) -
(558,786) (2,796) (51,900) 429,398
61$ 66,965$ 89,897$ 1,178,931$
58

CITY OF BELL GARDENS
COMBINING BALANCE SHEETNONMAJOR GOVERNMENTAL FUNDSJUNE 30, 2011
Assets:Cash and investmentsReceivables:
AccountsNotes and loansAccrued interest
Due from other governments
Total Assets
Liabilities and Fund Balances:Liabilities:Accounts payableAccrued liabilitiesDeferred revenuesUnearned revenuesDue to other governmentsDue to other funds
Total Liabilities
Fund Balances:
(Continued)
-$ 778,271$ 270$ 1,960$
- - - -- - - -- 119 - -- - - -
-$ 778,390$ 270$ 1,960$
-$ -$ -$ -$- 99 - -- - - -- - - -- - - -
215,024 - - -
215,024 99 - -
Separated Employee Benefits
Post Employment
Benefits OJJDP Boxing COPS Tech
Special Revenue Funds
Fund Balances: Restricted for: Public safety Community development Parks and recreation Public works Capital Projects Committed to: Post employment benefits Unassigned
Total Fund Balances
Total Liabilities and Fund Balances
- - 270 1,960- - - -- - - -- - - -- - - -
- 778,291 - -(215,024) - - -
(215,024) 778,291 270 1,960
-$ 778,390$ 270$ 1,960$
59

CITY OF BELL GARDENS
COMBINING BALANCE SHEETNONMAJOR GOVERNMENTAL FUNDSJUNE 30, 2011
Assets:Cash and investmentsReceivables:
AccountsNotes and loansAccrued interest
Due from other governments
Total Assets
Liabilities and Fund Balances:Liabilities:Accounts payableAccrued liabilitiesDeferred revenuesUnearned revenuesDue to other governmentsDue to other funds
Total Liabilities
Fund Balances:
472,611$ 165$ 25,611$ -$
- - - -- - - -- - - -- - - 46,224
472,611$ 165$ 25,611$ 46,224$
-$ -$ -$ -$- - - -- - - 23,112- - 25,598 -- - - -- - - 23,112
- - 25,598 46,224
Measure R ABC Grant JAG Grants
2008 State Homeland
Security Grant
Special Revenue Funds
Fund Balances: Restricted for: Public safety Community development Parks and recreation Public works Capital Projects Committed to: Post employment benefits Unassigned
Total Fund Balances
Total Liabilities and Fund Balances
- 165 13 -- - - -- - - -
472,611 - - -- - - -
- - - -- - - -
472,611 165 13 -
472,611$ 165$ 25,611$ 46,224$
60

CITY OF BELL GARDENS
COMBINING BALANCE SHEETNONMAJOR GOVERNMENTAL FUNDSJUNE 30, 2011
Assets:Cash and investmentsReceivables:
AccountsNotes and loansAccrued interest
Due from other governments
Total Assets
Liabilities and Fund Balances:Liabilities:Accounts payableAccrued liabilitiesDeferred revenuesUnearned revenuesDue to other governmentsDue to other funds
Total Liabilities
Fund Balances:
(Continued)
-$ 243,949$ -$ 482,172$
- 4,386 1,569 30,000- - - -- - - -
127,047 - - 195,548
127,047$ 248,335$ 1,569$ 707,720$
-$ 50,228$ -$ 922,759$- - - -- - - 225,548- - - -- 74,253 - -
202,927 - 777 -
202,927 124,481 777 1,148,307
COPS 2010 Grant
Anson Ford Park
Transportation Development
Act
Capital Improvement
Projects
Special Revenue Funds Capital Projects Funds
Fund Balances: Restricted for: Public safety Community development Parks and recreation Public works Capital Projects Committed to: Post employment benefits Unassigned
Total Fund Balances
Total Liabilities and Fund Balances
- - - -- - - -- 123,854 - -- - - -- - 792 -
- - - -(75,880) - - (440,587)
(75,880) 123,854 792 (440,587)
127,047$ 248,335$ 1,569$ 707,720$
61

CITY OF BELL GARDENS
COMBINING BALANCE SHEETNONMAJOR GOVERNMENTAL FUNDSJUNE 30, 2011
Assets:Cash and investmentsReceivables:
AccountsNotes and loansAccrued interest
Due from other governments
Total Assets
Liabilities and Fund Balances:Liabilities:Accounts payableAccrued liabilitiesDeferred revenuesUnearned revenuesDue to other governmentsDue to other funds
Total Liabilities
Fund Balances:
TotalNonmajor
Governmental
Funds
5,015,957$
35,9552,428,196
4181,027,693
8,508,219$
1,605,751$3,374
2,816,33925,59874,253
1,162,397
5,687,712
Fund Balances: Restricted for: Public safety Community development Parks and recreation Public works Capital Projects Committed to: Post employment benefits Unassigned
Total Fund Balances
Total Liabilities and Fund Balances
805,968429,398123,854
2,030,498792
778,291(1,348,294)
2,820,507
8,508,219$
62

THIS PAGE INTENTIONALLY LEFT BLANK
63

CITY OF BELL GARDENS
COMBINING STATEMENT OF REVENUES,EXPENDITURES AND CHANGES IN FUND BALANCESNONMAJOR GOVERNMENTAL FUNDSYEAR ENDED JUNE 30, 2011
Revenues:Taxes -$ -$ -$ -$Intergovernmental - 86,450 100,000 1,160,194Charges for services - 1,878 - -Use of money and property - - 302 328Fines and forfeitures - - - -Contributions - - - -Miscellaneous - - - -
Total Revenues - 88,328 100,302 1,160,522
Expenditures:Current: General government - - - - Public safety - 209,809 209,810 - Community development - - - - Parks and recreation - - - - Public works - - - 1,504,416Capital outlay - - - -Debt service: Principal retirement - - - - Interest and fiscal charges - - - -
CLEEP Grant Public Safety Augmentation
COPS State (SLESF)
State Gas Tax
Special Revenue Funds
g
Total Expenditures - 209,809 209,810 1,504,416
Excess (Deficiency) of Revenues Over (Under) Expenditures - (121,481) (109,508) (343,894)
Other Financing Sources (Uses):Transfers in - 150,000 - -Transfers out - - - -
Total Other Financing Sources (Uses) - 150,000 - -
Net Change in Fund Balances -$ 28,519$ (109,508)$ (343,894)$
Fund Balances:Beginning of year, as originally reported 7$ (21,760)$ 178,831$ 381,462$ Restatements - - - -
Beginning of year, as restated 7 (21,760) 178,831 381,462 Net change in fund balances - 28,519 (109,508) (343,894)
End of Year 7$ 6,759$ 69,323$ 37,568$
64

CITY OF BELL GARDENS
COMBINING STATEMENT OF REVENUES,EXPENDITURES AND CHANGES IN FUND BALANCESNONMAJOR GOVERNMENTAL FUNDSYEAR ENDED JUNE 30, 2011
Revenues:TaxesIntergovernmentalCharges for servicesUse of money and propertyFines and forfeituresContributionsMiscellaneous
Total Revenues
Expenditures:Current: General government Public safety Community development Parks and recreation Public worksCapital outlayDebt service: Principal retirement Interest and fiscal charges
(Continued)
-$ 2,036,058$ -$ 632,769$- - 1,243,420 -- - - -
1,164 2,421 - -337,322 - - -
- - - -- - - -
338,486 2,038,479 1,243,420 632,769
- - - -31,739 - - -
- - 373,901 -- - - -- 2,324,597 - 239,774
37,610 - 276,830 -
- - 348,000 -- - 200,730 -
Waste Management
Community Development Block Grant
Proposition "A"
Special Revenue Funds
Asset Forfeiture
g
Total Expenditures
Excess (Deficiency) of Revenues Over (Under) Expenditures
Other Financing Sources (Uses):Transfers inTransfers out
Total Other Financing Sources (Uses)
Net Change in Fund Balances
Fund Balances:Beginning of year, as originally reported Restatements
Beginning of year, as restated Net change in fund balances
End of Year
,
69,349 2,324,597 1,199,461 239,774
269,137 (286,118) 43,959 392,995
- - - 753,645- - - -
- - - 753,645
269,137$ (286,118)$ 43,959$ 1,146,640$
193,518$ 1,340,475$ (47,280)$ (680,678)$264,816 - - -
458,334 1,340,475 (47,280) (680,678)269,137 (286,118) 43,959 1,146,640
727,471$ 1,054,357$ (3,321)$ 465,962$
65

CITY OF BELL GARDENS
COMBINING STATEMENT OF REVENUES,EXPENDITURES AND CHANGES IN FUND BALANCESNONMAJOR GOVERNMENTAL FUNDSYEAR ENDED JUNE 30, 2011
Revenues:TaxesIntergovernmentalCharges for servicesUse of money and propertyFines and forfeituresContributionsMiscellaneous
Total Revenues
Expenditures:Current: General government Public safety Community development Parks and recreation Public worksCapital outlayDebt service: Principal retirement Interest and fiscal charges
525,564$ -$ -$ -$- 40,331 28,104 -
81,887 - - -1,380 35 211 970
- - - -- - - -- - - 9,332
608,831 40,366 28,315 10,302
- - - -- - - -- - - -- - - -
1,051,176 18,448 11,074 -107,116 54,828 3,865 -
- - - -- - - -
Academic Pursuit
Proposition "C"
Air Quality Improvement
Recycling Grants
Special Revenue Funds
g
Total Expenditures
Excess (Deficiency) of Revenues Over (Under) Expenditures
Other Financing Sources (Uses):Transfers inTransfers out
Total Other Financing Sources (Uses)
Net Change in Fund Balances
Fund Balances:Beginning of year, as originally reported Restatements
Beginning of year, as restated Net change in fund balances
End of Year
1,158,292 73,276 14,939 -
(549,461) (32,910) 13,376 10,302
- - - -(753,645) - - -
(753,645) - - -
(1,303,106)$ (32,910)$ 13,376$ 10,302$
744,320$ 30,114$ (65,276)$ 419,096$- - - -
744,320 30,114 (65,276) 419,096(1,303,106) (32,910) 13,376 10,302
(558,786)$ (2,796)$ (51,900)$ 429,398$
66
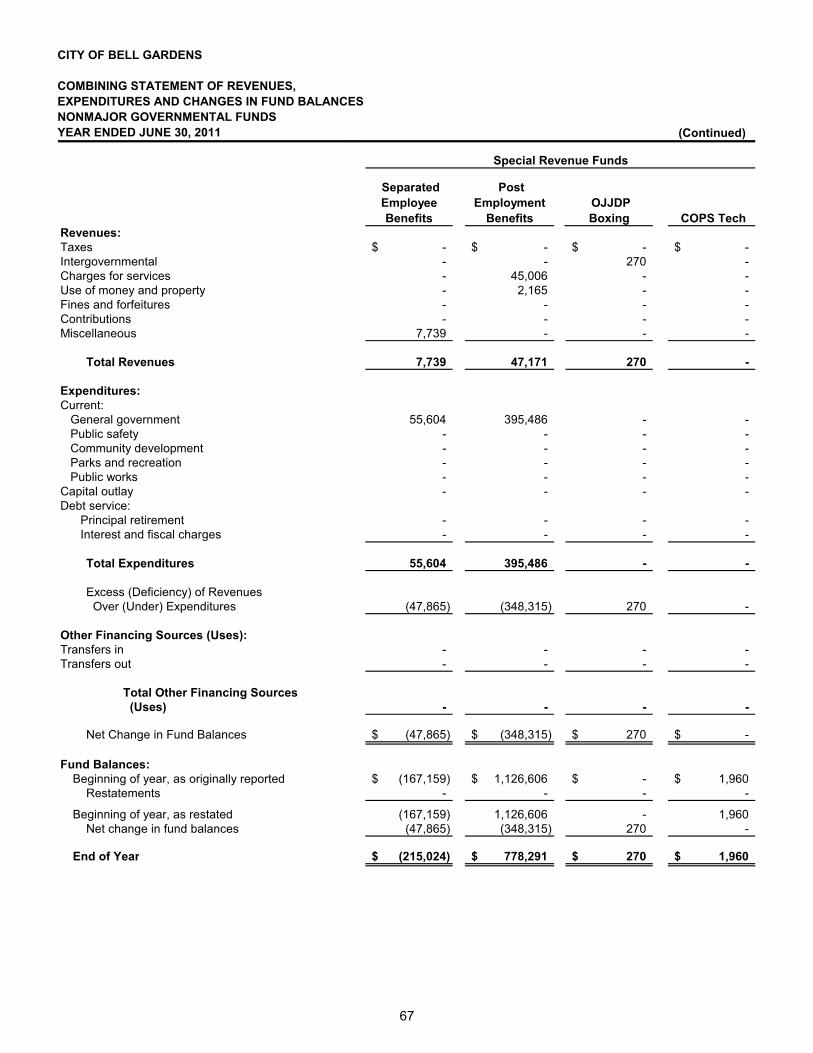
CITY OF BELL GARDENS
COMBINING STATEMENT OF REVENUES,EXPENDITURES AND CHANGES IN FUND BALANCESNONMAJOR GOVERNMENTAL FUNDSYEAR ENDED JUNE 30, 2011
Revenues:TaxesIntergovernmentalCharges for servicesUse of money and propertyFines and forfeituresContributionsMiscellaneous
Total Revenues
Expenditures:Current: General government Public safety Community development Parks and recreation Public worksCapital outlayDebt service: Principal retirement Interest and fiscal charges
(Continued)
-$ -$ -$ -$- - 270 -- 45,006 - -- 2,165 - -- - - -- - - -
7,739 - - -
7,739 47,171 270 -
55,604 395,486 - -- - - -- - - -- - - -- - - -- - - -
- - - -- - - -
COPS Tech
SeparatedEmployee Benefits
PostEmployment
Benefits OJJDP Boxing
Special Revenue Funds
g
Total Expenditures
Excess (Deficiency) of Revenues Over (Under) Expenditures
Other Financing Sources (Uses):Transfers inTransfers out
Total Other Financing Sources (Uses)
Net Change in Fund Balances
Fund Balances:Beginning of year, as originally reported Restatements
Beginning of year, as restated Net change in fund balances
End of Year
55,604 395,486 - -
(47,865) (348,315) 270 -
- - - -- - - -
- - - -
(47,865)$ (348,315)$ 270$ -$
(167,159)$ 1,126,606$ -$ 1,960$- - - -
(167,159) 1,126,606 - 1,960(47,865) (348,315) 270 -
(215,024)$ 778,291$ 270$ 1,960$
67

CITY OF BELL GARDENS
COMBINING STATEMENT OF REVENUES,EXPENDITURES AND CHANGES IN FUND BALANCESNONMAJOR GOVERNMENTAL FUNDSYEAR ENDED JUNE 30, 2011
Revenues:TaxesIntergovernmentalCharges for servicesUse of money and propertyFines and forfeituresContributionsMiscellaneous
Total Revenues
Expenditures:Current: General government Public safety Community development Parks and recreation Public worksCapital outlayDebt service: Principal retirement Interest and fiscal charges
-$ -$ -$ -$392,322 20,047 - -
- - - -912 64 13 -
- - - -- - - -- - - -
393,234 20,111 13 -
- - - -- 6,323 - -- - - -- - - -- - - -
205,156 - - -
- - - -- - - -
ABC Grant JAG Grants
2008 State Homeland
Security Grant Measure R
Special Revenue Funds
g
Total Expenditures
Excess (Deficiency) of Revenues Over (Under) Expenditures
Other Financing Sources (Uses):Transfers inTransfers out
Total Other Financing Sources (Uses)
Net Change in Fund Balances
Fund Balances:Beginning of year, as originally reported Restatements
Beginning of year, as restated Net change in fund balances
End of Year
205,156 6,323 - -
188,078 13,788 13 -
- - - -- - - -
- - - -
188,078$ 13,788$ 13$ -$
284,533$ (13,623)$ -$ -$- - - -
284,533 (13,623) - -188,078 13,788 13 -
472,611$ 165$ 13$ -$
68

CITY OF BELL GARDENS
COMBINING STATEMENT OF REVENUES,EXPENDITURES AND CHANGES IN FUND BALANCESNONMAJOR GOVERNMENTAL FUNDSYEAR ENDED JUNE 30, 2011
Revenues:TaxesIntergovernmentalCharges for servicesUse of money and propertyFines and forfeituresContributionsMiscellaneous
Total Revenues
Expenditures:Current: General government Public safety Community development Parks and recreation Public worksCapital outlayDebt service: Principal retirement Interest and fiscal charges
(Continued)
-$ -$ -$ -$360,597 - 18,824 416,532
- 93,141 - -- 160,728 - -- - - -- - - 70,000- 1,927 - -
360,597 255,796 18,824 486,532
- - - -436,477 - - -
- - - -- 216,563 - -- - - -- 25,388 18,032 1,566,158
- - - -- - - -
Transportation Development
Act
Capital Improvement
Projects Anson Ford
Park COPS 2010
Grant
Special Revenue Funds Capital Projects Funds
g
Total Expenditures
Excess (Deficiency) of Revenues Over (Under) Expenditures
Other Financing Sources (Uses):Transfers inTransfers out
Total Other Financing Sources (Uses)
Net Change in Fund Balances
Fund Balances:Beginning of year, as originally reported Restatements
Beginning of year, as restated Net change in fund balances
End of Year
436,477 241,951 18,032 1,566,158
(75,880) 13,845 792 (1,079,626)
- - - 101,076- - - -
- - - 101,076
(75,880)$ 13,845$ 792$ (978,550)$
-$ 166,182$ -$ 537,963$- (56,173) - -
- 110,009 - 537,963(75,880) 13,845 792 (978,550)
(75,880)$ 123,854$ 792$ (440,587)$
69

CITY OF BELL GARDENS
COMBINING STATEMENT OF REVENUES,EXPENDITURES AND CHANGES IN FUND BALANCESNONMAJOR GOVERNMENTAL FUNDSYEAR ENDED JUNE 30, 2011
Revenues:TaxesIntergovernmentalCharges for servicesUse of money and propertyFines and forfeituresContributionsMiscellaneous
Total Revenues
Expenditures:Current: General government Public safety Community development Parks and recreation Public worksCapital outlayDebt service: Principal retirement Interest and fiscal charges
TotalNonmajor
GovernmentalFunds
3,194,391$3,867,091
221,912170,693337,322
70,00018,998
7,880,407
451,090894,158373,901216,563
5,149,4852,294,983
348,000200,730g
Total Expenditures
Excess (Deficiency) of Revenues Over (Under) Expenditures
Other Financing Sources (Uses):Transfers inTransfers out
Total Other Financing Sources (Uses)
Net Change in Fund Balances
Fund Balances:Beginning of year, as originally reported Restatements
Beginning of year, as restated Net change in fund balances
End of Year
,
9,928,910
(2,048,503)
1,004,721(753,645)
251,076
(1,797,427)$
4,409,291$208,643
4,617,934(1,797,427)
2,820,507$
70

CITY OF BELL GARDENS
BUDGETARY COMPARISON SCHEDULEPUBLIC SAFETY AUGMENTATIONYEAR ENDED JUNE 30, 2011
Variance with Final Budget
Budget Amounts Actual PositiveOriginal Final Amounts (Negative)
Budgetary Fund Balance, July 1 (21,760)$ (21,760)$ (21,760)$ -$ Resources (Inflows):Intergovernmental 91,000 91,000 86,450 (4,550) Charges for services - - 1,878 1,878 Transfers in 150,000 150,000 150,000 -
Amounts Available for Appropriations 219,240 219,240 216,568 (2,672)
Charges to Appropriations (Outflow):Public safety 216,104 216,104 209,809 6,295
Total Charges to Appropriations 216,104 216,104 209,809 6,295
Budgetary Fund Balance, June 30 3,136$ 3,136$ 6,759$ 3,623$
71

CITY OF BELL GARDENS
BUDGETARY COMPARISON SCHEDULECOPS STATE (SLESF)YEAR ENDED JUNE 30, 2011
Variance with Final Budget
Budget Amounts Actual PositiveOriginal Final Amounts (Negative)
Budgetary Fund Balance, July 1 178,831$ 178,831$ 178,831$ -$ Resources (Inflows):Intergovernmental 100,000 100,000 100,000 - Use of money and property - - 302 302
Amounts Available for Appropriations 278,831 278,831 279,133 302
Charges to Appropriations (Outflow):Public safety 216,104 216,104 209,810 6,294
Total Charges to Appropriations 216,104 216,104 209,810 6,294
Budgetary Fund Balance, June 30 62,727$ 62,727$ 69,323$ 6,596$
72

CITY OF BELL GARDENS
BUDGETARY COMPARISON SCHEDULESTATE GAS TAXYEAR ENDED JUNE 30, 2011
Variance with Final Budget
Budget Amounts Actual PositiveOriginal Final Amounts (Negative)
Budgetary Fund Balance, July 1 381,462$ 381,462$ 381,462$ -$ Resources (Inflows):Intergovernmental 1,199,960 1,199,960 1,160,194 (39,766) Use of money and property - - 328 328
Amounts Available for Appropriations 1,581,422 1,581,422 1,541,984 (39,438)
Charges to Appropriations (Outflow):Public works 1,265,715 1,825,088 1,504,416 320,672 Capital outlay 1,000 1,000 - 1,000
Total Charges to Appropriations 1,266,715 1,826,088 1,504,416 321,672
Budgetary Fund Balance, June 30 314,707$ (244,666)$ 37,568$ 282,234$
73

CITY OF BELL GARDENS
BUDGETARY COMPARISON SCHEDULEASSET FORFEITUREYEAR ENDED JUNE 30, 2011
Variance with Final Budget
Budget Amounts Actual PositiveOriginal Final Amounts (Negative)
Budgetary Fund Balance, July 1, as restated 458,334$ 458,334$ 458,334$ -$ Resources (Inflows):Use of money and property - - 1,164 1,164 Fines and forfeitures 100,000 100,000 337,322 237,322 Transfers in - - - -
Amounts Available for Appropriations 558,334 558,334 796,820 238,486
Charges to Appropriations (Outflow):Public safety 32,029 32,029 31,739 290 Capital outlay 55,000 55,000 37,610 17,390 Transfers out - - - -
Total Charges to Appropriations 87,029 87,029 69,349 17,680
Budgetary Fund Balance, June 30 471,305$ 471,305$ 727,471$ 256,166$
74

CITY OF BELL GARDENS
BUDGETARY COMPARISON SCHEDULEWASTE MANAGEMENTYEAR ENDED JUNE 30, 2011
Variance with Final Budget
Budget Amounts Actual PositiveOriginal Final Amounts (Negative)
Budgetary Fund Balance, July 1 1,340,475$ 1,340,475$ 1,340,475$ -$ Resources (Inflows):Taxes 2,160,924 2,160,924 2,036,058 (124,866) Use of money and property - - 2,421 2,421
Amounts Available for Appropriations 3,501,399 3,501,399 3,378,954 (122,445)
Charges to Appropriations (Outflow):Public works 2,374,603 2,374,603 2,324,597 50,006 Transfers out 650,000 650,000 - 650,000
Total Charges to Appropriations 3,024,603 3,024,603 2,324,597 700,006
Budgetary Fund Balance, June 30 476,796$ 476,796$ 1,054,357$ 577,561$
75

CITY OF BELL GARDENS
BUDGETARY COMPARISON SCHEDULECOMMUNITY DEVELOPMENT BLOCK GRANTYEAR ENDED JUNE 30, 2011
Variance with Final Budget
Budget Amounts Actual PositiveOriginal Final Amounts (Negative)
Budgetary Fund Balance, July 1 (47,280)$ (47,280)$ (47,280)$ -$ Resources (Inflows):Intergovernmental 952,234 952,234 1,243,420 291,186
Amounts Available for Appropriations 904,954 904,954 1,196,140 291,186
Charges to Appropriations (Outflow):Community development 370,518 624,681 373,901 250,780 Capital outlay - 130,000 276,830 (146,830) Debt service: Principal retirement 348,000 348,000 348,000 - Interest and fiscal charges 200,730 200,730 200,730 -
Total Charges to Appropriations 919,248 1,303,411 1,199,461 103,950
Budgetary Fund Balance, June 30 (14,294)$ (398,457)$ (3,321)$ 395,136$
76

CITY OF BELL GARDENS
BUDGETARY COMPARISON SCHEDULEPROPOSITION "A"YEAR ENDED JUNE 30, 2011
Variance with Final Budget
Budget Amounts Actual PositiveOriginal Final Amounts (Negative)
Budgetary Fund Balance, July 1, as restated (680,678)$ (680,678)$ (680,678)$ -$ Resources (Inflows):Taxes 630,577 630,577 632,769 2,192 Intergovernmental 75,000 75,000 - (75,000) Transfers in - - 753,645 753,645
Amounts Available for Appropriations 24,899 24,899 705,736 680,837
Charges to Appropriations (Outflow):Public works 369,047 369,047 239,774 129,273
Total Charges to Appropriations 369,047 369,047 239,774 129,273
Budgetary Fund Balance, June 30 (344,148)$ (344,148)$ 465,962$ 810,110$
77

CITY OF BELL GARDENS
BUDGETARY COMPARISON SCHEDULEPROPOSITION "C"YEAR ENDED JUNE 30, 2011
Variance with Final Budget
Budget Amounts Actual PositiveOriginal Final Amounts (Negative)
Budgetary Fund Balance, July 1, as restated 744,320$ 744,320$ 744,320$ -$ Resources (Inflows):Taxes 523,047 523,047 525,564 2,517 Charges for services 71,052 71,052 81,887 10,835 Use of money and property - - 1,380 1,380
Amounts Available for Appropriations 1,338,419 1,338,419 1,353,151 14,732
Charges to Appropriations (Outflow):Public works 1,013,683 1,013,683 1,051,176 (37,493) Capital outlay - 103,725 107,116 (3,391) Debt service:Transfers out - - 753,645 (753,645)
Total Charges to Appropriations 1,013,683 1,117,408 1,911,937 (794,529)
Budgetary Fund Balance, June 30 324,736$ 221,011$ (558,786)$ (779,797)$
78

CITY OF BELL GARDENS
BUDGETARY COMPARISON SCHEDULEAIR QUALITY IMPROVEMENTYEAR ENDED JUNE 30, 2011
Variance with Final Budget
Budget Amounts Actual PositiveOriginal Final Amounts (Negative)
Budgetary Fund Balance, July 1 30,114$ 30,114$ 30,114$ -$ Resources (Inflows):Intergovernmental 110,736 110,736 40,331 (70,405) Use of money and property - - 35 35
Amounts Available for Appropriations 140,850 140,850 70,480 (70,370)
Charges to Appropriations (Outflow):Public works 16,000 16,000 18,448 (2,448) Capital outlay 95,736 95,736 54,828 40,908
Total Charges to Appropriations 111,736 111,736 73,276 38,460
Budgetary Fund Balance, June 30 29,114$ 29,114$ (2,796)$ (31,910)$
79

CITY OF BELL GARDENS
BUDGETARY COMPARISON SCHEDULERECYCLING GRANTSYEAR ENDED JUNE 30, 2011
Variance with Final Budget
Budget Amounts Actual PositiveOriginal Final Amounts (Negative)
Budgetary Fund Balance, July 1 (65,276)$ (65,276)$ (65,276)$ -$ Resources (Inflows):Intergovernmental 11,000 11,000 28,104 17,104 Use of money and property - - 211 211
Amounts Available for Appropriations (54,276) (54,276) (36,961) 17,315
Charges to Appropriations (Outflow):Public works 12,614 12,614 11,074 1,540 Capital outlay 70,000 70,000 3,865 66,135
Total Charges to Appropriations 82,614 82,614 14,939 67,675
Budgetary Fund Balance, June 30 (136,890)$ (136,890)$ (51,900)$ 84,990$
80

CITY OF BELL GARDENS
BUDGETARY COMPARISON SCHEDULEACADEMIC PURSUITYEAR ENDED JUNE 30, 2011
Variance with Final Budget
Budget Amounts Actual PositiveOriginal Final Amounts (Negative)
Budgetary Fund Balance, July 1 419,096$ 419,096$ 419,096$ -$ Resources (Inflows):Use of money and property - - 970 970 Miscellaneous 20,000 20,000 9,332 (10,668)
Amounts Available for Appropriations 439,096 439,096 429,398 (9,698)
Charges to Appropriations (Outflow):General government 25,000 25,000 - 25,000
Total Charges to Appropriations 25,000 25,000 - 25,000
Budgetary Fund Balance, June 30 414,096$ 414,096$ 429,398$ 15,302$
81

CITY OF BELL GARDENS
BUDGETARY COMPARISON SCHEDULESEPARATED EMPLOYEE BENEFITSYEAR ENDED JUNE 30, 2011
Variance with Final Budget
Budget Amounts Actual PositiveOriginal Final Amounts (Negative)
Budgetary Fund Balance, July 1 (167,159)$ (167,159)$ (167,159)$ -$ Resources (Inflows):Miscellaneous - - 7,739 7,739
Amounts Available for Appropriations (167,159) (167,159) (159,420) 7,739
Charges to Appropriations (Outflow):General government 50,000 50,000 55,604 (5,604)
Total Charges to Appropriations 50,000 50,000 55,604 (5,604)
Budgetary Fund Balance, June 30 (217,159)$ (217,159)$ (215,024)$ 2,135$
82
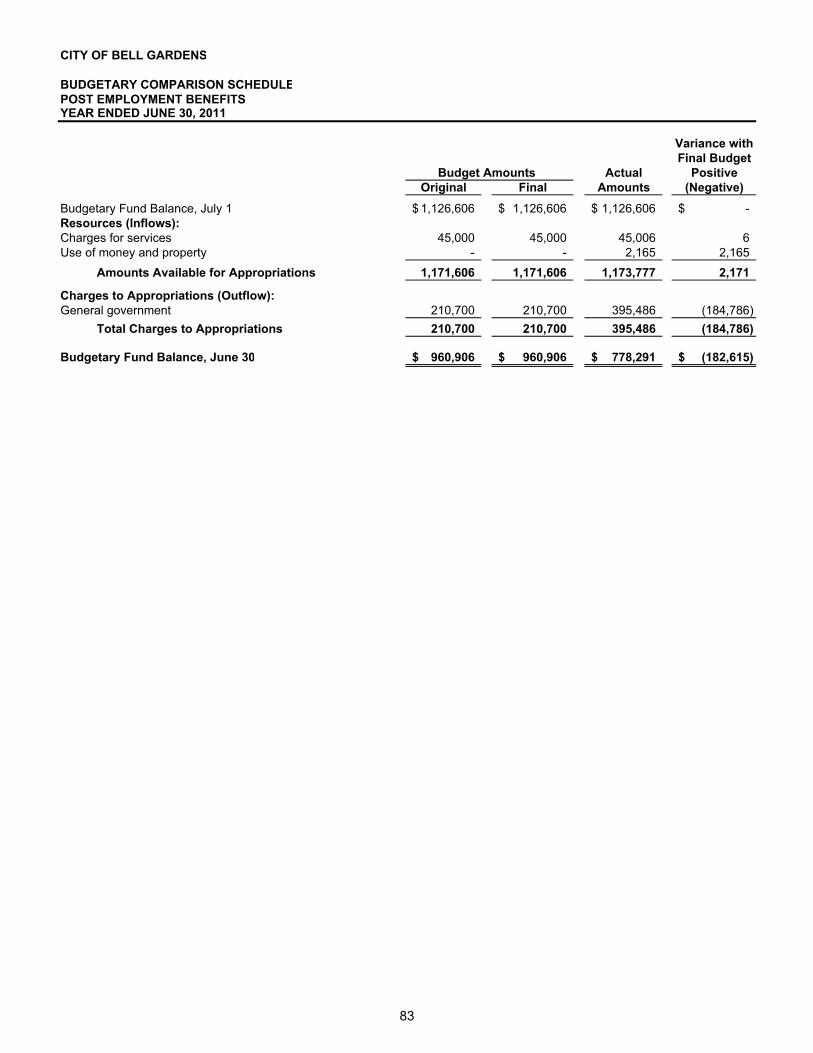
CITY OF BELL GARDENS
BUDGETARY COMPARISON SCHEDULEPOST EMPLOYMENT BENEFITSYEAR ENDED JUNE 30, 2011
Variance with Final Budget
Budget Amounts Actual PositiveOriginal Final Amounts (Negative)
Budgetary Fund Balance, July 1 1,126,606$ 1,126,606$ 1,126,606$ -$ Resources (Inflows):Charges for services 45,000 45,000 45,006 6 Use of money and property - - 2,165 2,165
Amounts Available for Appropriations 1,171,606 1,171,606 1,173,777 2,171
Charges to Appropriations (Outflow):General government 210,700 210,700 395,486 (184,786)
Total Charges to Appropriations 210,700 210,700 395,486 (184,786)
Budgetary Fund Balance, June 30 960,906$ 960,906$ 778,291$ (182,615)$
83

CITY OF BELL GARDENS
BUDGETARY COMPARISON SCHEDULEMEASURE RYEAR ENDED JUNE 30, 2011
Variance with Final Budget
Budget Amounts Actual PositiveOriginal Final Amounts (Negative)
Budgetary Fund Balance, July 1 284,533$ 284,533$ 284,533$ -$ Resources (Inflows):Intergovernmental 392,285 392,285 392,322 37 Use of money and property - - 912 912
Amounts Available for Appropriations 676,818 676,818 677,767 949
Charges to Appropriations (Outflow):Capital outlay 442,000 666,007 205,156 460,851
Total Charges to Appropriations 442,000 666,007 205,156 460,851
Budgetary Fund Balance, June 30 234,818$ 10,811$ 472,611$ 461,800$
84

CITY OF BELL GARDENS
BUDGETARY COMPARISON SCHEDULECOPS 2010 GRANTSYEAR ENDED JUNE 30, 2011
Variance with Final Budget
Budget Amounts Actual PositiveOriginal Final Amounts (Negative)
Budgetary Fund Balance, July 1 -$ -$ -$ -$ Resources (Inflows):Intergovernmental 389,615 389,615 360,597 (29,018)
Amounts Available for Appropriations 389,615 389,615 360,597 (29,018)
Charges to Appropriations (Outflow):Public safety 389,615 389,615 436,477 (46,862)
Total Charges to Appropriations 389,615 389,615 436,477 (46,862)
Budgetary Fund Balance, June 30 -$ -$ (75,880)$ (75,880)$
85

CITY OF BELL GARDENS
BUDGETARY COMPARISON SCHEDULEANSON FORD PARKYEAR ENDED JUNE 30, 2011
Variance with Final Budget
Budget Amounts Actual PositiveOriginal Final Amounts (Negative)
Budgetary Fund Balance, July 1, as restated 110,009$ 110,009$ 110,009$ -$ Resources (Inflows):Charges for services 90,000 90,000 93,141 3,141 Use of money and property 150,000 150,000 160,728 10,728 Miscellaneous - - 1,927 1,927 Transfers in 100,000 100,000 - (100,000)
Amounts Available for Appropriations 450,009 450,009 365,805 (84,204)
Charges to Appropriations (Outflow):Parks and recreation 220,400 220,400 216,563 3,837 Capital outlay 25,000 25,000 25,388 (388)
Total Charges to Appropriations 245,400 245,400 241,951 3,449
Budgetary Fund Balance, June 30 204,609$ 204,609$ 123,854$ (80,755)$
86

CITY OF BELL GARDENS
BUDGETARY COMPARISON SCHEDULETRANSPORTATION DEVELOPMENT ACTYEAR ENDED JUNE 30, 2011
Variance with Final Budget
Budget Amounts Actual PositiveOriginal Final Amounts (Negative)
Budgetary Fund Balance, July 1 -$ -$ -$ -$ Resources (Inflows):Intergovernmental 18,824 18,824 18,824 -
Amounts Available for Appropriations 18,824 18,824 18,824 -
Charges to Appropriations (Outflow):Capital outlay 18,824 18,824 18,032 792
Total Charges to Appropriations 18,824 18,824 18,032 792
Budgetary Fund Balance, June 30 -$ -$ 792$ 792$
87

CITY OF BELL GARDENS
BUDGETARY COMPARISON SCHEDULECAPITAL IMPROVEMENT PROJECTSYEAR ENDED JUNE 30, 2011
Variance with Final Budget
Budget Amounts Actual PositiveOriginal Final Amounts (Negative)
Budgetary Fund Balance, July 1 537,963$ 537,963$ 537,963$ -$ Resources (Inflows):Intergovernmental 1,993,639 2,310,499 416,532 (1,893,967)Contributions - - 70,000 70,000Transfers in 109,000 206,500 101,076 (105,424)
Amounts Available for Appropriations 2,640,602 3,054,962 1,125,571 (1,929,391)
Charges to Appropriations (Outflow):Capital outlay 2,102,639 3,694,306 1,566,158 2,128,148
Total Charges to Appropriations 2,102,639 3,694,306 1,566,158 2,128,148
Budgetary Fund Balance, June 30 537,963$ (639,344)$ (440,587)$ 198,757$
88
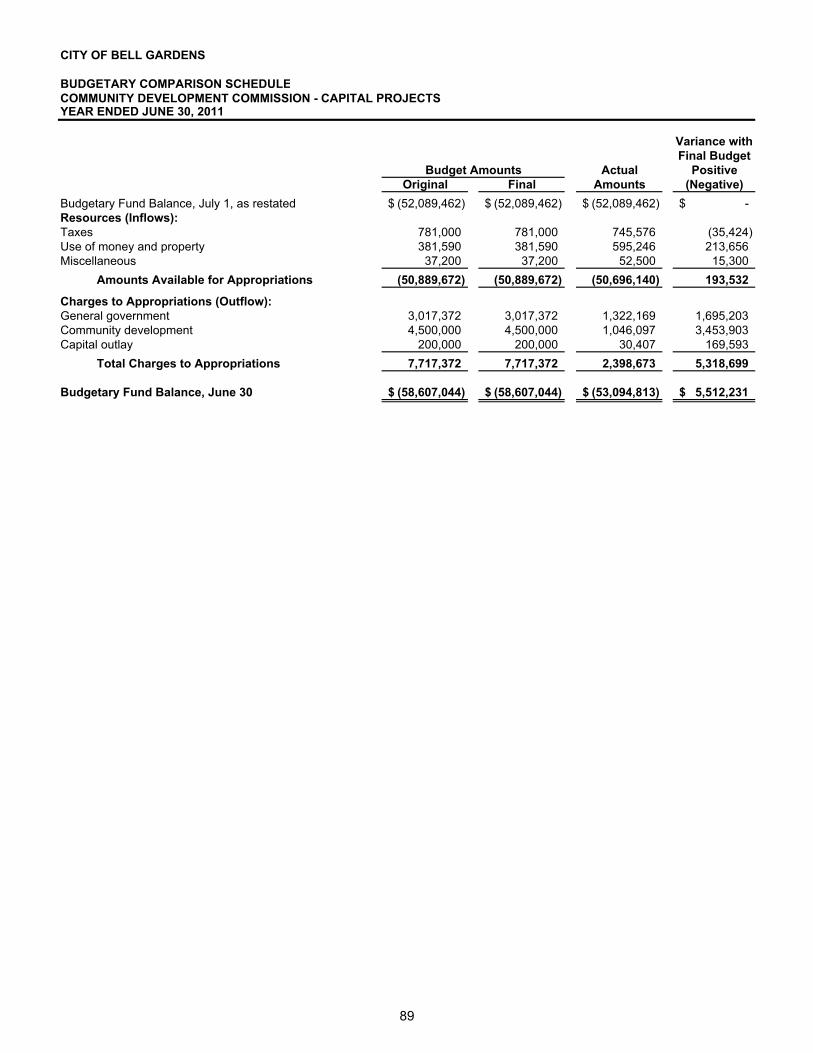
CITY OF BELL GARDENS
BUDGETARY COMPARISON SCHEDULECOMMUNITY DEVELOPMENT COMMISSION - CAPITAL PROJECTSYEAR ENDED JUNE 30, 2011
Variance with Final Budget
Budget Amounts Actual PositiveOriginal Final Amounts (Negative)
Budgetary Fund Balance, July 1, as restated (52,089,462)$ (52,089,462)$ (52,089,462)$ -$ Resources (Inflows):Taxes 781,000 781,000 745,576 (35,424)Use of money and property 381,590 381,590 595,246 213,656Miscellaneous 37,200 37,200 52,500 15,300
Amounts Available for Appropriations (50,889,672) (50,889,672) (50,696,140) 193,532
Charges to Appropriations (Outflow):General government 3,017,372 3,017,372 1,322,169 1,695,203Community development 4,500,000 4,500,000 1,046,097 3,453,903Capital outlay 200,000 200,000 30,407 169,593
Total Charges to Appropriations 7,717,372 7,717,372 2,398,673 5,318,699
Budgetary Fund Balance, June 30 (58,607,044)$ (58,607,044)$ (53,094,813)$ 5,512,231$
89

CITY OF BELL GARDENS
BUDGETARY COMPARISON SCHEDULECOMMUNITY DEVELOPMENT COMMISSION - DEBT SERVICEYEAR ENDED JUNE 30, 2011
Variance with Final Budget
Budget Amounts Actual PositiveOriginal Final Amounts (Negative)
Budgetary Fund Balance, July 1, as restated 11,992,433$ 11,992,433$ 11,992,433$ -$ Resources (Inflows):Taxes 3,120,000 3,120,000 2,982,303 (137,697)Use of money and property 25,000 25,000 24,272 (728)
Amounts Available for Appropriations 15,137,433 15,137,433 14,999,008 (138,425)
Charges to Appropriations (Outflow):General government 382,000 382,000 633,896 (251,896)Debt service: Principal retirement 950,644 950,644 912,644 38,000 Interest and fiscal charges 1,678,513 1,678,513 1,678,513 -
Total Charges to Appropriations 3,011,157 3,011,157 3,225,053 (213,896)
Budgetary Fund Balance, June 30 12,126,276$ 12,126,276$ 11,773,955$ (352,321)$
90

Statistical Section
This part of the City of Bell Gardens comprehensive annual financial report presents detailed information as a context for understanding what the information in the financial statements, note disclosures, and required supplementary information says about the government’s overall financial health.
Contents Financial Trends These schedules contain trend information to help the reader understand how the government’s financial performance and well-being have changed over time. Revenue Capacity These schedules contain information to help the reader asses the government’s most significant local revenue source, the property tax. Debt Capacity These schedules present information to help the reader assess the afford- ability of the government’s current levels of outstanding debt and the government’s ability to issue additional debt in the future. Demographic and Economic Information These schedules offer demographic and economic indicators to help the reader understand the environment with in which the government’s financial activities take place. Operating Information These schedules contain service and infrastructure data to help the reader understand how the information in the government’s financial report relates to the services that the government provides and the activities it performs.
Sources: Unless otherwise noted, the information in these schedules is derived from the comprehensive annual financial reports for the relevant year.
91

THIS PAGE INTENTIONALLY LEFT BLANK
92

City of Bell GardensNet Assets by Component, Last Five Fiscal Years(accrual basis of accounting)
2007 2008 2009 2010 2011
Governmental activitiesInvested in capital assets, net of related debt 54,608,728$ 58,383,063$ 72,643,986$ 73,967,264$ 74,822,075$ Restricted 16,130,908 17,172,343 17,896,542 17,088,677 17,354,065 Unrestricted 35,608,537 32,303,477 12,851,973 10,390,101 4,804,396
Total governmental activities net assets 106,348,173$ 107,858,883$ 103,392,501$ 101,446,042$ 96,980,536$
Business-type activitiesInvested in capital assets, net of related debt 474,856$ 584,837$ 2,816,150$ 3,429,948$ 3,480,128$ Restricted 405,014 400,688 398,665 398,434 399,355 Unrestricted 1,352,304 985,558 (357,093) 397,551 251,365
Total business-type activities net assets 2,232,174$ 1,971,083$ 2,857,722$ 4,225,933$ 4,130,848$
Primary governmentInvested in capital assets, net of related debt 55,083,584$ 58,967,900$ 75,460,136$ 77,397,212$ 78,302,203$ Restricted 16,535,922 17,573,031 18,295,207 17,487,111 17,753,420 Unrestricted 36,960,841 33,289,035 12,494,880 10,787,652 5,055,761
Total primary government net assets 108,580,347$ 109,829,966$ 106,250,223$ 105,671,975$ 101,111,384$
Fiscal Year
93
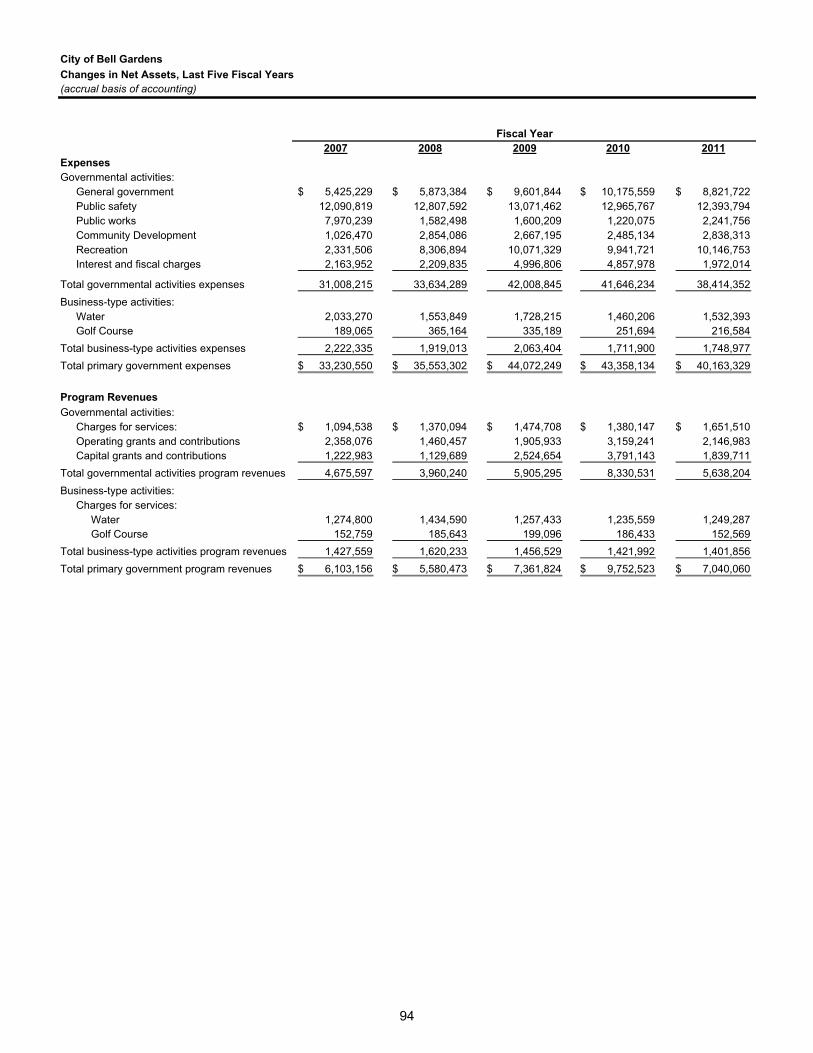
City of Bell GardensChanges in Net Assets, Last Five Fiscal Years(accrual basis of accounting)
2007 2008 2009 2010 2011ExpensesGovernmental activities:
General government 5,425,229$ 5,873,384$ 9,601,844$ 10,175,559$ 8,821,722$ Public safety 12,090,819 12,807,592 13,071,462 12,965,767 12,393,794 Public works 7,970,239 1,582,498 1,600,209 1,220,075 2,241,756 Community Development 1,026,470 2,854,086 2,667,195 2,485,134 2,838,313 Recreation 2,331,506 8,306,894 10,071,329 9,941,721 10,146,753 Interest and fiscal charges 2,163,952 2,209,835 4,996,806 4,857,978 1,972,014
Total governmental activities expenses 31,008,215 33,634,289 42,008,845 41,646,234 38,414,352Business-type activities:
Water 2,033,270 1,553,849 1,728,215 1,460,206 1,532,393 Golf Course 189,065 365,164 335,189 251,694 216,584
Total business-type activities expenses 2,222,335 1,919,013 2,063,404 1,711,900 1,748,977Total primary government expenses 33,230,550$ 35,553,302$ 44,072,249$ 43,358,134$ 40,163,329$
Program Revenues Governmental activities:
Charges for services: 1,094,538$ 1,370,094$ 1,474,708$ 1,380,147$ 1,651,510$ Operating grants and contributions 2,358,076 1,460,457 1,905,933 3,159,241 2,146,983 Capital grants and contributions 1,222,983 1,129,689 2,524,654 3,791,143 1,839,711
Total governmental activities program revenues 4,675,597 3,960,240 5,905,295 8,330,531 5,638,204Business-type activities:
Charges for services: Water 1,274,800 1,434,590 1,257,433 1,235,559 1,249,287 Golf Course 152,759 185,643 199,096 186,433 152,569
Total business-type activities program revenues 1,427,559 1,620,233 1,456,529 1,421,992 1,401,856Total primary government program revenues 6,103,156$ 5,580,473$ 7,361,824$ 9,752,523$ 7,040,060$
Fiscal Year
94

City of Bell GardensChanges in Net Assets, Last Five Fiscal Years(accrual basis of accounting)
2007 2008 2009 2010 2011Net (Expense)/RevenueGovernmental activities (26,332,618)$ (29,674,049)$ (36,103,550)$ (33,315,703)$ (32,776,148)$ Business-type activities (1,021,607) (298,780) (591,875) (289,908) (347,121)Total primary government net expense (27,354,225)$ (29,972,829)$ (36,695,425)$ (33,605,611)$ (33,123,269)$
General Revenues and Other Changes in Net AssetsGovernmental activities:
TaxesSales taxes 3,619,193$ 2,187,115$ 2,086,198$ 2,030,961$ 2,321,800$ Property taxes 4,184,141 4,650,564 4,908,149 4,886,712 4,696,696 Other taxes 18,100,953 20,062,895 19,188,075 18,661,906 17,853,565
Use of money and property 4,581,829 4,261,200 5,175,607 6,630,950 3,281,827 Others 308,314 241,528 167,393 303,354 249,606
Total governmental activities 30,794,430 31,403,302 31,525,422 32,513,883 28,403,494Business-type activities:
Investment earnings 59,662 28,633 10,266 6,778 8,664 Miscellaneous 6,791 9,056 - - -
Total business-type activities 66,453 37,689 10,266 6,778 8,664Total primary government 30,860,883$ 31,440,991$ 31,535,688$ 32,520,661$ 28,412,158$
Change in Net AssetsGovernmental activities 4,461,812$ 1,729,253$ (4,578,128)$ (801,820)$ (4,372,654)$ Business-type activities (955,154) (261,091) (581,609) (283,130) (338,457)Total primary government 3,506,658$ 1,468,162$ (5,159,737)$ (1,084,950)$ (4,711,111)$
Fiscal Year
95
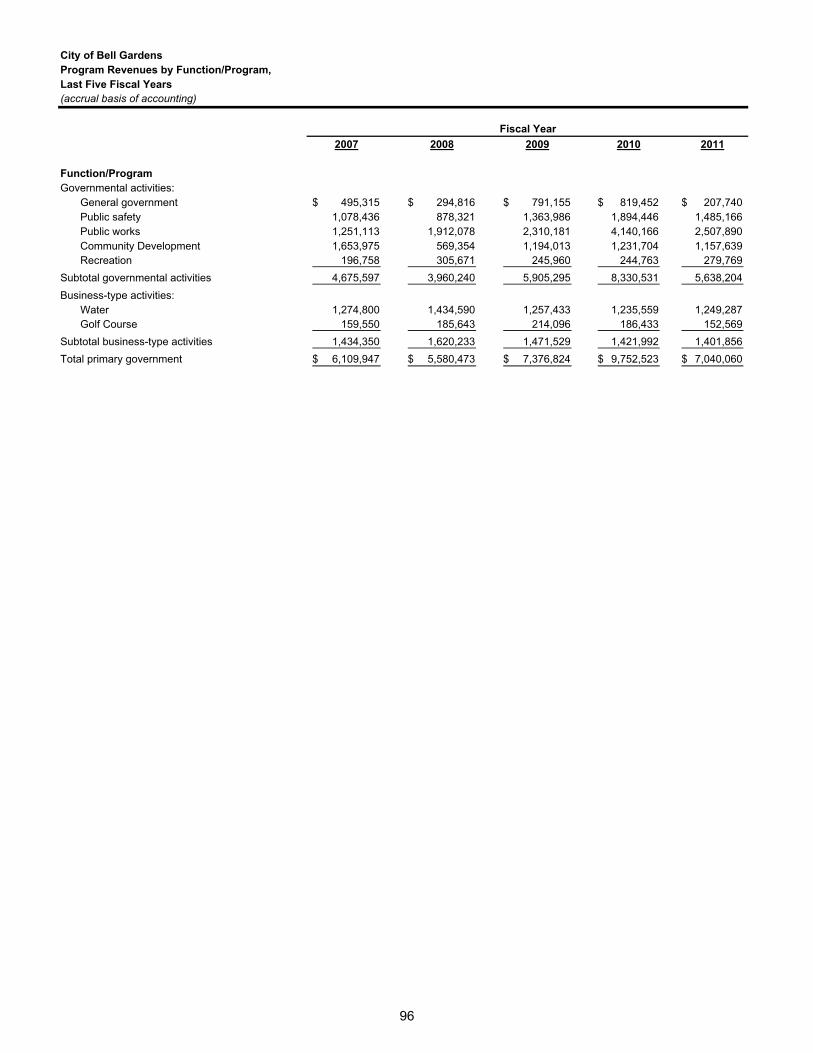
City of Bell GardensProgram Revenues by Function/Program,Last Five Fiscal Years(accrual basis of accounting)
2007 2008 2009 2010 2011
Function/ProgramGovernmental activities:
General government 495,315$ 294,816$ 791,155$ 819,452$ 207,740$ Public safety 1,078,436 878,321 1,363,986 1,894,446 1,485,166 Public works 1,251,113 1,912,078 2,310,181 4,140,166 2,507,890 Community Development 1,653,975 569,354 1,194,013 1,231,704 1,157,639 Recreation 196,758 305,671 245,960 244,763 279,769
Subtotal governmental activities 4,675,597 3,960,240 5,905,295 8,330,531 5,638,204Business-type activities:
Water 1,274,800 1,434,590 1,257,433 1,235,559 1,249,287 Golf Course 159,550 185,643 214,096 186,433 152,569
Subtotal business-type activities 1,434,350 1,620,233 1,471,529 1,421,992 1,401,856Total primary government 6,109,947$ 5,580,473$ 7,376,824$ 9,752,523$ 7,040,060$
Fiscal Year
96

City
of B
ell G
arde
nsFu
nd B
alan
ces,
Gov
ernm
enta
l Fun
ds,
Last
Ten
Fis
cal Y
ears
(mod
ified
acc
rual
bas
is o
f acc
ount
ing)
2002
2003
2004
2005
2006
2007
2008
2009
2010
2011
Gen
eral
Fun
dR
eser
ved
24,8
05,5
81$
27
,091
,253
$
27,0
91,2
53$
34
,015
,965
$
34,1
68,6
52$
33
,874
,087
$
31,5
86,0
07$
29
,533
,393
$
28,1
92,3
77$
U
nres
erve
d8,
746,
923
5,
500,
140
6,
660,
359
(104
,175
)2,
586,
628
2,91
6,57
5
760,
914
5,66
3,39
07,
885,
063
Non
spen
dabl
e31
,101
,324
Res
trict
ed2,
653,
435
Com
mitt
ed1,
500,
000
Ass
igne
d4,
788,
238
Una
ssig
ned
-
Tota
l gen
eral
fund
33,5
52,5
04$
32
,591
,393
$
33,7
51,6
12$
33
,911
,790
$
36,7
55,2
80$
36
,790
,662
$
32,3
46,9
21$
35
,196
,783
$
36,0
77,4
40$
40
,042
,997
$
All
Oth
er G
over
nmen
tal F
unds
Res
erve
d24
,905
,690
$
32,7
40,2
30$
35
,014
,898
$
31,1
85,0
98$
23
,140
,763
$
26,3
46,3
70$
23
,533
,346
$
6,44
4,81
3$
3,79
0,62
2$
Unr
eser
ved,
repo
rted
in:
Spe
cial
reve
nue
fund
s1,
095,
556
2,
025,
677
2,
087,
509
2,
292,
088
3,
534,
142
1,
271,
134
2,
712,
006
4,
517,
811
3,
517,
293
C
apita
l pro
ject
s fu
nds
(65,
851,
349)
(57,
461,
230)
(61,
246,
257)
(34,
713,
969)
(35,
801,
626)
(34,
850,
737)
(31,
878,
388)
(53,
943,
090)
(52,
969,
266)
Deb
t ser
vice
fund
s-
--
-10
,417
,926
11,2
34,3
49
12,9
74,7
6613
,121
,160
12,1
01,5
54
Non
spen
dabl
e3,
907,
450
Res
trict
ed14
,277
,135
Com
mitt
ed77
8,29
1A
ssig
ned
-
U
nass
igne
d(5
7,46
3,22
7)
Tota
l all
othe
r gov
ernm
enta
l fun
ds(3
9,85
0,10
3)$
(2
2,69
5,32
3)$
(2
4,14
3,85
0)$
(1
,236
,783
)$
1,
291,
205
$
4,00
1,11
6$
7,
341,
730
$
(29,
859,
306)
$
(33,
559,
797)
$
(38,
500,
351)
$
Fisc
al Y
ear
97

City
of B
ell G
arde
nsC
hang
es in
Fun
d B
alan
ces,
Gov
ernm
enta
l Fun
ds,
Last
Ten
Fis
cal Y
ears
(mod
ified
acc
rual
bas
is o
f acc
ount
ing) 20
0220
0320
0420
0520
0620
0720
0820
0920
1020
11R
even
ues
Taxe
s (s
ee S
ched
ule
6)13
,932
,327
$
13,4
31,9
85$
15
,115
,703
$
16,4
22,6
94$
21
,365
,783
$
22,7
62,2
69$
24
,001
,964
$
23,2
15,9
56$
22
,397
,036
$
20,7
97,5
93$
Li
cens
es a
nd p
erm
its28
3,98
6
28
7,17
1
29
2,10
6
36
8,15
2
49
7,98
0
36
1,51
0
27
0,40
8
25
8,30
3
27
1,02
4
42
5,57
9
Fi
nes
and
forfe
iture
s35
3,73
0
31
3,93
5
34
8,32
7
38
4,69
6
48
1,64
3
44
2,51
3
52
0,41
0
56
9,56
1
36
5,60
2
66
5,88
8
U
se o
f mon
ey a
nd p
rope
rty3,
563,
181
3,
516,
356
3,
138,
976
3,
499,
560
3,
839,
828
6,
675,
935
4,
573,
273
4,
062,
189
4,
860,
235
5,
208,
244
Fr
om o
ther
Age
ncie
s5,
146,
644
8,
235,
920
6,
252,
389
8,
073,
251
5,
780,
814
4,
518,
060
5,
922,
632
7,
549,
280
9,
839,
425
8,
135,
923
C
harg
es fo
r ser
vice
s55
3,22
2
39
0,97
0
35
6,52
2
52
6,72
1
38
3,92
5
52
9,70
9
57
9,27
6
53
4,91
8
46
5,30
9
51
0,03
0
O
ther
reve
nues
952,
252
1,
163,
991
1,
842,
635
2,
723,
112
1,
280,
528
86
4,04
9
641,
667
23
4,09
2
254,
627
42
4,96
3
Tota
l rev
enue
s24
,785
,342
27
,340
,328
27
,346
,658
31
,998
,186
33
,630
,501
36
,154
,045
36
,509
,630
36
,424
,299
38
,453
,258
36
,168
,220
Expe
nditu
res
Gen
eral
gov
ernm
ent
6,64
0,22
7
7,71
9,36
1
4,94
8,15
8
7,75
9,85
7
6,57
8,91
8
5,09
4,74
8
5,31
4,57
6
6,29
0,55
1
6,76
1,24
2
5,51
0,61
5
Pub
lic s
afet
y7,
683,
095
7,
988,
131
8,
228,
354
9,
157,
560
9,
770,
145
11
,925
,675
12,5
67,0
59
13
,123
,483
12,9
03,2
19
12
,357
,221
Pub
lic w
orks
3,30
0,02
8
4,45
8,04
1
4,96
6,57
3
4,66
7,32
8
5,13
8,82
7
6,57
8,25
5
10,1
18,8
33
8,
025,
112
8,
011,
053
8,
360,
219
C
omm
unity
Dev
elop
men
t9,
180,
464
3,
809,
851
3,
663,
070
2,
260,
839
83
4,97
2
1,
009,
672
1,
556,
904
1,
623,
507
1,
185,
669
2,
207,
786
R
ecre
atio
n1,
396,
091
1,
448,
349
1,
975,
354
2,
087,
435
1,
732,
059
2,
313,
549
2,
829,
241
2,
636,
528
2,
470,
040
2,
818,
574
C
apita
l Out
lay
2,05
7,76
7
1,95
2,38
9
2,75
6,81
4
11,1
35,9
45
9,
802,
891
3,
023,
248
2,
262,
313
2,
117,
959
2,
622,
433
2,
412,
065
D
ebt s
ervi
ceIn
tere
st2,
940,
288
1,96
0,41
21,
513,
288
1,49
1,94
31,
956,
692
2,15
3,23
72,
219,
715
4,93
5,07
24,
876,
961
2,04
3,24
1P
rinci
pal
285,
000
378,
808
98,4
7552
7,44
564
5,14
975
8,40
61,
122,
436
1,21
3,60
81,
273,
762
1,34
0,64
4B
ond
Issu
ance
cos
ts-
--
-10
8,45
3
--
- -
-To
tal e
xpen
ditu
res
33,4
82,9
6029
,715
,342
28,1
50,0
8639
,088
,352
36,5
68,1
0632
,856
,790
37,9
91,0
7739
,965
,820
40,1
04,3
7937
,050
,365
Exc
ess
of re
venu
esov
er (u
nder
)ex
pend
iture
s(8
,697
,618
)(2
,375
,014
)(8
03,4
28)
(7,0
90,1
66)
(2,9
37,6
05)
3,29
7,25
5(1
,481
,447
)(3
,541
,521
)(1
,651
,121
)(8
82,1
45)
Fisc
al Y
ear
98

City
of B
ell G
arde
nsC
hang
es in
Fun
d B
alan
ces,
Gov
ernm
enta
l Fun
dsLa
st T
en F
isca
l Yea
rs(m
odifi
ed a
ccru
al b
asis
of a
ccou
ntin
g) 2002
2003
2004
2005
2006
2007
2008
2009
2010
2011
Oth
er F
inan
cing
Sour
ces
(Use
s)
Bon
ds is
sued
-$
27
,705
,000
$
-$
4,
775,
000
$
3,
870,
000
$
-
$
-$
-
$
-$
-
$
Loan
pro
ceed
s-
-
-
1,00
0,00
0
3,43
3,42
0
-
-
-
-
-
P
rem
ium
on
bond
s is
sued
-
-
-
55
2,94
5
-
-
-
-
-
-
Lo
ss o
n sa
le o
f pro
perty
-
-
(486
,216
)
-
-
-
-
-
-
-
P
aym
ents
to e
scro
w a
gent
-
(1
3,50
7,32
5)
-
-
-
-
-
-
-
-
O
ther
deb
ts is
sued
-
-
-
-
-
-
566,
580
-
-
-
Tr
ansf
ers
in44
7,50
0
35
2,36
0
21
5,34
5
4,
496,
559
56
9,06
2
82
,342
173,
783
-
1,
636,
628
1,
248,
721
Tr
ansf
ers
out
(447
,500
)
(352
,360
)
(215
,345
)
(4,4
96,5
59)
(5
69,0
62)
(8
2,34
2)
(173
,783
)
- (3
,103
,184
)
(1,4
92,0
93)
Tota
l oth
er fi
nanc
ing
sou
rces
(use
s)-
14,1
97,6
75
(486
,216
)
6,32
7,94
5
7,30
3,42
0
- 56
6,58
0
- (1
,466
,556
)
(243
,372
)
Net
cha
nge
in fu
nd b
alan
ces
(8,6
97,6
18)
$
11,8
22,6
61$
(1
,289
,644
)$
(7
62,2
21)
$
4,36
5,81
5$
3,
297,
255
$
(914
,867
)$
(3
,541
,521
)$
(3
,117
,677
)$
(1
,125
,517
)$
Deb
t ser
vice
as
a p
erce
ntag
e of
non
capi
tal
exp
endi
ture
s10
.26%
8.43
%6.
35%
7.79
%10
%10
.28%
10.3
2%19
.40%
19.6
4%10
.83%
99

City of Bell GardensTax Revenues by Source, Governmental FundsLast Ten Fiscal Years(modified accrual basis of accounting)
Fiscal PropertyYear Property Sales & Use Occupancy Franchise Transfer Other Total
2002 2,660,072$ 1,474,359$ 113,846$ 290,548$ 32,128$ 9,566,096$ 14,137,049$ 2003 2,556,912 1,399,219 104,458 287,042 40,871 9,330,527 13,719,029 2004 2,825,297 1,451,529 152,172 322,076 51,618 10,635,087 15,437,779 2005 3,142,991 1,559,831 14,779 331,301 53,701 11,518,392 16,620,995 2006 4,121,469 1,798,188 203,253 372,002 59,955 12,990,223 19,545,090 2007 4,338,039 1,971,556 210,541 377,235 27,031 14,479,837 21,404,239 2008 5,375,177 2,172,279 185,061 366,072 25,784 14,615,223 22,739,596 2009 6,023,238 2,155,134 204,761 414,256 24,163 16,525,839 25,347,391 2010 5,588,240 1,962,040 187,820 323,941 15,858 16,739,536 24,817,435 2011 4,955,009 2,150,865 223,480 517,145 23,999 16,235,880 24,106,378
Change110.08% 33.08% 64.98% 11.49% -50.64% 74.99% 75.55% 2001–2010
100

City
of B
ell G
arde
nsA
sses
sed
Valu
e an
d Es
timat
ed A
ctua
l Val
ue o
f Tax
able
Pro
pert
yLa
st T
en F
isca
l Yea
rs
Tota
lEs
timat
edTa
xabl
e A
sses
sed
Tota
l Tax
able
Dire
ctA
ctua
lVa
luea
as a
Fisc
alR
esid
entia
lC
omm
erci
alIn
dust
rial
Mis
cella
neou
sA
sses
sed
Tax
Taxa
ble
Perc
enta
ge o
fYe
arPr
oper
tyPr
oper
tyPr
oper
tyPr
oper
tyVa
lue
Rat
eVa
lue
Act
ual T
axab
le V
alue
2002
591,
898,
050
$
100,
185,
438
$
94,9
96,5
24$
94
,090
,980
$
881,
170,
992
$
1
8,81
1,71
0$
10
000.
000%
2003
614,
266,
319
101,
784,
077
100,
782,
503
96,6
26,9
42
91
3,45
9,84
1
1
9,
134,
598
1000
0.00
0%20
0466
0,94
4,16
1
10
6,30
0,73
0
10
6,85
0,47
9
92
,374
,341
966,
469,
711
1
9,66
4,69
7
10
000.
000%
2005
708,
601,
929
115,
433,
535
110,
152,
149
99,4
42,3
20
1,
033,
629,
933
1
10
,336
,299
10
000.
000%
2006
770,
429,
209
127,
667,
610
112,
101,
508
95,5
79,1
18
1,
105,
777,
445
1
11
,057
,774
10
000.
000%
2007
845,
104,
706
162,
394,
202
121,
576,
893
104,
513,
313
1,23
3,58
9,11
4
1
12,3
35,8
91
1000
0.00
0%20
0892
4,39
6,83
918
6,59
7,85
313
0,68
4,37
711
3,02
4,31
51,
354,
703,
384
1
13
,547
,034
1000
0.00
0%20
0998
1,73
5,37
420
2,86
7,29
413
6,01
9,84
911
9,83
8,68
11,
440,
461,
198
1
14
,404
,612
1000
0.00
0%20
1098
5,09
5,92
520
9,18
2,39
414
9,47
5,01
313
2,49
7,32
71,
476,
250,
659
1
14
,762
,507
1000
0.00
0%20
1196
3,22
4,29
220
9,53
2,59
614
3,79
6,74
513
5,22
2,93
11,
451,
776,
564
1
14
,517
,766
1000
0.00
0%
101

City of Bell GardensDirect and Overlapping Property Tax RatesLast Ten Fiscal Years(rate per $1,000 of assessed value)
General MontebelloObligation Redevelopment Total Los Unified
Fiscal Basic Debt Debt Direct Angeles SchoolYear Rate Service Service Rate County District
2002 1.00 - - 1.00 0.0441 0.0256 2003 1.00 - - 1.00 0.0401 0.0229 2004 1.00 - - 1.00 0.0444 0.0238 2005 1.00 - - 1.00 0.0413 0.0255 2006 1.00 - - 1.00 0.0356 0.0553 2007 1.00 - - 1.00 0.0341 0.0673 2008 1.00 - - 1.00 0.2230 0.0668 2009 1.00 - - 1.00 0.2191 0.0806 2010 1.00 - - 1.00 0.2628 0.0967 2011 1.00 - - 1.00 0.3279 0.0979
Source: LA County Assessor 2001/02 - 2010/11 tax rate table
City Direct Rates
Notes: The city's basic property tax rate may be increased only by a majority vote of the city's residents. Rates for debt service are set based on each year's requirements.
102

City of Bell GardensPrincipal Property Tax PayersCurrent Year and Ten Years Ago
Percentage Percentageof Total City of Total City
Taxable Taxable Taxable TaxableAssessed Assessed Assessed Assessed
Taxpayer Value Rank Value Value Rank Value
Florence Eastern Marketplace 36,000,000$ 1 2.48%Burnham Pacific Operating Partnership 19,060,384 2 2.16%Bell Gardens Casino LP 31,713,204 2 2.18%Bell Gardens Bicycle Club 31,435,126 3 2.17% $33,643,892 1 3.82%Primestor Bell Gardens LLC 19,242,010 4 1.33%Primestor El Portal LLC 18,396,974 5 1.27%Wei Chuan International Inc. 16,861,872 6 1.16% $11,198,651 3 1.27%Giraffe Properties LLC 8,498,577 7 0.59%Realty Associates Fund V 7,542,044 8 0.52% 8,036,049 4 0.91%Bell Gardens Hospitality LLC 7,461,610 9 0.51%Suva Montalane Investment LLC 6,939,722 10 0.48%Metal Surfaces Inc. 7,066,934 5 0.80%Haig Kelegian 6,196,179 6 0.70%James P. & Judy A. Berg 5,387,183 7 0.61%Jamers Parkhouse Trust 5,209,349 8 0.59%Mid Cities Paper Box Company Inc. 4,965,400 9 0.56%Toys R Us 4,565,703 10 0.52%Yoo Jin Management Company Ltd.
Total 184,091,139$ 12.69% 105,329,724$ 11.94%
Bell Gardens Bicycle Club
2011 2002
Source: HdL Coren & Cone, Los Angeles County Assessor 2010/11 and 2001/02 Combined Tax Rolls
103

City of Bell GardensProperty Tax Levies and CollectionsLast Ten Fiscal Years
FiscalYear Taxes Levied
Ended for the PercentageJune 30, Fiscal Year Amount of Levy
2002 571,473$ 535,421$ 93.69%2003 590,075 558,605 94.67%2004 856,577 802,210 93.65%2005 921,461 866,965 94.09%2006 992,774 854,809 86.10%2007 999,229 936,278 93.70%2008 1,058,324 968,838 91.54%2009 1,056,288 978,420 92.63%2010 1,037,815 950,706 91.61%2011 1,052,661 961,074 91.30%
Sources: Finance Department records and Los Angeles County Assessors Office
Collected within theFiscal Year of the Levy
104

City
of B
ell G
arde
nsTa
xabl
e Sa
les
by C
ateg
ory
Last
Ten
Cal
enda
r Yea
rs(in
thou
sand
s of
dol
lars
)
2002
2003
2004
2005
2006
2007
2008
2009
2010
2011
App
arel
sto
res
4,83
1$
4,
643
$
4,
388
$
5,16
9$
5,
404
$
17,4
32$
28,2
95$
26,8
31$
26,4
93$
30,4
55$
Gen
eral
mer
chan
dise
1,27
8
1,
416
1,
111
1,15
6
1,
139
1,14
9
1,
158
1,25
81,
997
2,17
4Fo
od s
tore
s 14
,638
14
,143
14,6
40
15,2
98
16,3
79
16,2
98
16,4
3416
,812
16,6
0216
,231
Eat
ing
and
drin
king
est
ablis
hmen
ts24
,016
23
,821
25,2
57
35,0
01
35,2
70
37,8
34
39,6
6340
,005
36,5
9936
,575
Bui
ldin
g m
ater
ials
and
farm
tool
s2,
738
2,71
7
3,60
0
3,
814
5,64
4
5,
803
4,71
74,
193
3,57
63,
275
Aut
o de
aler
s an
d su
pplie
s 13
,828
12
,766
14,2
87
17,1
03
19,6
53
17,0
21
17,1
9717
,539
15,3
1316
,036
Ser
vice
sta
tions
18
,261
17
,678
16,3
65
18,1
58
19,5
69
20,3
58
25,7
8840
,026
29,1
6733
,011
Oth
er re
tail
stor
es30
,554
30
,356
28,6
60
31,9
22
33,6
74
33,2
90
36,6
3434
,150
30,5
6932
,136
All
othe
r out
lets
40,7
14
35,6
23
36,3
93
38,8
18
40,3
96
43,1
64
42,7
66
42,8
30
36,2
2938
,002
Tota
l15
0,85
8$
14
3,16
3$
14
4,70
1$
16
6,43
9$
17
7,12
8$
19
2,34
9$
21
2,65
2$
22
3,64
4$
19
6,54
5$
20
7,89
5$
City
dire
ct s
ales
tax
rate
1.25
%1.
25%
1.25
%1.
25%
1.25
%1.
25%
1.00
%1.
00%
1.00
%1.
00%
Sour
ce:S
tate
of C
alifo
rnia
Boa
rd o
f Equ
aliz
atio
n an
d th
e H
dL C
ompa
nies
Not
e: D
ue to
con
fiden
tialit
y is
sues
, the
nam
es o
f the
top
ten
larg
est r
even
ue p
ayer
s ar
e no
t ava
ilabl
e. T
he c
ateg
orie
s pr
esen
ted
are
inte
nded
to p
rovi
de a
ltern
ativ
e in
form
atio
n re
gard
ing
the
sour
ces
of th
e C
ity's
reve
nue.
Cal
enda
r Yea
r
105

City of Bell GardensDirect and Overlapping Sales Tax RatesLast Ten Fiscal Years
City Los StateFiscal Direct Angeles ofYear Rate County California
2002 1.25 1.00 5.752003 1.25 1.00 5.752004 1.25 1.00 6.002005 1.00 1.00 6.252006 1.00 1.00 6.252007 1.00 1.00 6.252008 1.00 1.00 6.252009 1.00 1.50 7.252010 1.00 1.50 7.252011 1.00 1.50 7.25
Sources: Los Angeles County
Note: The city sales tax rate may be changed only with the approval of the state legislature.
106

City of Bell GardensPrincipal Sales Tax RemittersCurrent Year and Ten Years Ago
2011
Tax Remitter Business Category Tax Remitter
Ana Valero Service Stations Apco Service StationsApplebees Restaurants Liquor Arco AM PM Mini Mart Service StationsAuto Zone Automotive Supply Stores Auto Zone Automotive Supply StoresBicycle Club Casino Restaurants Liquor Bicycle Club Restaurants LiquorBig 5 Sporting Goods Sporting Goods/Bike Stores Bicycle Club Casino Restaurants LiquorCalzado Anrea International Shoe Stores Big 5 Sporting Goods Sporting Goods/Bike StoresCasa Leaders HP Home Furnishings Chevron Pronto Lube & Tune Service StationsChevron Pronto Lube & Tune Service Stations El Tapatio Foods Grocery Stores Beer/WineEl Pollo Loco Restaurants No Alcohol Enterprise Products Office EquipmentEl Tapatio Foods Grocery Stores Beer/Wine Eurocraft Architectural Met Light Industrial/PrintersFactory 2U Family Apparel Factory 2 U Grocery Stores LiquorUnion 76 Station Service Stations Food 4 Less Grocery Stores LiquorFood 4 Less Grocery Stores Liquor IHOP Restaurants No AlcoholIHOP Restaurants No Alcohol Industrial Forklifts Transportation Non AutoMarshalls Family Apparel John Lisee Pumps Repair Shop/Hand Tool RentMc Donalds Restaurants No Alcohol La Habra Welding Repair Shop/Hand Tool RentMosier Lumber/Building Materials Mc Donalds Restaurants No AlcoholParkhouse Tire Service Automotive Supply Stores Parkhouse Tire Service Automotive Supply StoresPremier Fiesta Mexicana Restaurants Liquor Reds Catering Restaurants No AlcoholRite Aid Drug Stores Rite Aid Drug StoresRoss Department Stores Super A Foods Grocery Stores LiquorSouth West Petroleum Service Stations Toys R Us Specialty StoresSpeedy Fuel Service Stations United R T M Business Service StationsSuper A Foods Grocery Stores Liquor West Coast Accudyne Heavy IndustrialToys R Us Specialty Stores Wilcox Machine Heavy Industrial
Percent of FY Total Paid by Top 25 Accounts 66.50% 61.23%
Source: Hinderliter, de Llamas & Associates, State Board of Equalization
2002
Business Category
107

City
of B
ell G
arde
nsR
atio
s of
Out
stan
ding
Deb
t by
Type
Last
Ten
Fis
cal Y
ears
Bus
ines
s - t
ype
Act
iviti
es
Tax
Cer
tific
ates
Wat
erTo
tal
Perc
enta
geFi
scal
Allo
catio
nR
even
ueN
otes
ofR
even
uePr
imar
yof
Per
sona
lPe
rYe
arB
onds
Bon
dsPa
yabl
ePa
rtic
ipat
ion
Bon
dsG
over
nmen
tIn
com
e C
apita
2002
13,7
70,0
00$
-$
-$
-$
5,13
0,31
8$
18,9
00,3
18$
6.28
%42
9
2003
17,7
05,0
00
-
9,
921,
192
-
5,
032,
144
32
,658
,336
10
.53%
723
20
0417
,705
,000
-
9,82
2,71
7
-
4,96
5,00
0
32,4
92,7
17
9.87
%72
3
2005
17,2
85,0
00
4,77
5,00
0
10
,715
,272
-
5,
240,
000
38
,015
,272
11
.11%
840
20
0616
,755
,000
4,
775,
000
14,0
33,5
43
3,87
0,00
0
-
39,4
33,5
43
-86
9
2007
16,2
10,0
00
4,75
0,00
0
13
,910
,137
3,
805,
000
4,82
0,00
0
43,4
95,1
37
-95
9
2008
15,6
50,0
004,
675,
000
14,0
59,2
813,
735,
000
4,62
5,00
042
,744
,281
11.5
8%94
2
2009
15,0
75,0
004,
555,
000
13,9
17,6
733,
665,
000
4,42
5,00
041
,637
,673
10.6
7%91
8
2010
14,4
80,0
004,
430,
000
13,4
58,9
113,
590,
000
4,22
0,00
040
,178
,911
9.72
%85
5
2011
13,8
65,0
004,
295,
000
12,6
21,2
673,
510,
000
4,01
0,00
038
,301
,267
6.77
%86
9
Not
es: D
etai
ls re
gard
ing
the
city
's o
utst
andi
ng d
ebt c
an b
e fo
und
in th
e no
tes
to th
e fin
anci
al s
tate
men
ts.
Gov
ernm
enta
l Act
iviti
es
108

City of Bell GardensRatios of General Bonded Debt OutstandingLast Ten Fiscal Years
Percentage ofGeneral Actual Taxable
Fiscal Obligation Redevelopment Value of PerYear Bonds Bonds Total Property Capita
2002 - 13,770,000$ 13,770,000$ 156.27% 304.66 2003 - 17,705,000 17,705,000 193.82% 393.92 2004 - 17,705,000 17,705,000 183.19% 391.19 2005 - 17,285,000 17,285,000 167.23% 380.96 2006 - 16,755,000 16,755,000 151.52% 363.89 2007 - 16,210,000 16,210,000 131.41% 346.66 2008 - 15,650,000 15,650,000 115.52% 334.64 2009 - 15,075,000 15,075,000 104.65% 322.21 2010 - 14,480,000 14,480,000 98.09% 308.07 2011 - 13,865,000 13,865,000 95.50% 314.73
Notes: Details regarding the city's outstanding debt can be found in the notes to the financial statements.
General Bonded Debt Outstanding
109

City of Bell GardensDirect and Overlapping Governmental Activities DebtAs of June 30, 2010(dollars in thousands)
EstimatedShare of
Estimated Direct andDebt Percentage Overlapping
Governmental Unit Outstanding* Applicable * Debt*
Debt repaid with property taxes
Los Angeles CountyLos Angeles County Flood Control District 69,610,000$ 0.118% 82,140$ Metropolitan Water District 264,220,000 0.061% 161,174Cerritos Community College District 112,115,994 0.071% 79,602Los Angeles Community College District 2,665,515,000 0.204% 5,437,651Downey Unified School District 81,275,256 0.215% 174,742Los Angeles Unified School District 11,874,430,000 0.001% 118,744Montebello Unfiied School District 157,730,618 12.142% 19,151,652Los Angeles County Regional Park and Open Space Assessment District 222,660,000 0.118% 262,740
Subtotal, direct and overlapping tax debt 25,468,444$
Other debtLos Angeles County General Fund Obligations 855,695,839$ 0.118% 1,009,721$ Los Angeles County Pension Obligations 118,486,192 0.118% 139,814Los Angeles County Superintendent of Schools Certificate of Particpation 13,185,458 0.118% 15,559Los Angles Unified School District Certificate of Participation 456,780,324 0.001% 4,568Montebello Unified School District Certificates of Participation 15,125,000 12.142% 1,836,478City of Bell Gardens Certificates of Participation 3,590,000 100.000% 3,590,000Los Angeles County Sanitation District No. 2 Authority 34,810,192 2.942% 1,024,117
Subtotal, overlapping debt 7,620,256 Less: Los Angeles County Certificates of Participation (100% self-supporting) from leasehold revenues on properties in Marina Del Rey (347)
7,619,909
City direct debt 33,088,700
Total direct and overlapping debt 33,088,353$
* June 30, 2011 figures not available
Notes: Overlapping governments are those that coincide, at least in part, with the geographic boundaries of the city. This schedule estimates the portion of the outstanding debt of those overlapping governments that is borne by the residents and businesses of the City of Bell Gardens. This process recognizes that, when considering the city's ability to issue and repay long-term debt, the entire debt burden borne by the residents and businesses should be taken into account. However, this does not imply that every taxpayer is a resident—and therefore responsible for repaying the debt—of each overlapping government.
110

City
of B
ell G
arde
nsLe
gal D
ebt M
argi
n In
form
atio
nLa
st T
en F
isca
l Yea
rs
Lega
l Deb
t Mar
gin
Cal
cula
tion
for F
isca
l Yea
r 201
0A
sses
sed
valu
e1,
451,
776,
564
$
Deb
t lim
it (1
5% o
f ass
esse
d va
lue)
217,
766,
485
D
ebt a
pplic
able
to li
mit:
Gen
eral
obl
igat
ion
bond
s-
Less
: Am
ount
set
asi
de fo
r
r
epay
men
t of g
ener
al
o
blig
atio
n de
bt-
Tota
l net
deb
t app
licab
le to
lim
it-
Lega
l deb
t mar
gin
217,
766,
485
$
2002
2003
2004
2005
2006
2007
2008
2009
2010
2011
Deb
t lim
it13
2,17
5,64
9$
13
7,01
8,97
6$
14
4,97
0,45
7$
15
3,65
5,05
6$
16
5,86
6,61
7$
18
5,03
8,36
7$
20
3,20
5,50
8$
216,
069,
180
$
221,
437,
599
$
21
7,76
6,48
5$
Tota
l net
deb
t app
licab
le to
lim
it-
- -
- -
- -
- -
-
Lega
l deb
t mar
gin
132,
175,
649
$
137,
018,
976
$
144,
970,
457
$
153,
655,
056
$
165,
866,
617
$
185,
038,
367
$
203,
205,
508
$
216,
069,
180
$
221,
437,
599
$
217,
766,
485
$
Tota
l net
deb
t app
licab
le to
the
limit
as
a pe
rcen
tage
of d
ebt l
imit
0.00
%0.
00%
0.00
%0.
00%
0.00
%0.
00%
0.00
%0.
00%
0.00
%0.
00%
Not
e:U
nder
sta
te fi
nanc
e la
w, t
he c
ity's
out
stan
ding
gen
eral
obl
igat
ion
debt
sho
uld
not e
xcee
d 15
per
cent
of t
otal
ass
esse
d pr
oper
ty v
alue
. The
City
has
no
bond
ed
inde
bted
ness
.
Fisc
al Y
ear
111

City
of B
ell G
arde
nsPl
edge
d-R
even
ue C
over
age
Last
Ten
Fis
cal Y
ears
Util
ityLe
ss:
Net
Fisc
alSe
rvic
eO
pera
ting
Ava
ilabl
eYe
arC
harg
esEx
pens
esR
even
uePr
inci
pal
Inte
rest
Cov
erag
e
2002
1,08
6,57
5$
83
5,98
1$
250,
594
$
95
,000
$
35
1,34
6$
0.56
20
031,
335,
000
754,
649
58
0,35
1
100,
000
361,
773
1.
26
2004
1,31
6,00
0
1,
494,
351
(178
,351
)
10
5,00
0
34
7,01
5
(0.3
9)
2005
1,33
3,00
0
97
4,45
9
358,
541
11
0,00
0
17
0,56
7
1.28
20
061,
317,
852
1,17
3,92
814
3,92
419
0,00
020
4,38
40.
36
2007
1,27
4,80
01,
945,
581
(670
,781
)19
5,00
020
0,24
1(1
.70)
2008
1,43
4,59
01,
329,
089
105,
501
200,
000
195,
499
0.27
2009
1,24
6,00
02,
087,
433
(841
,433
)20
5,00
019
0,05
2(2
.13)
2010
1,11
3,59
41,
775,
816
(662
,222
)20
5,00
019
0,05
2(1
.68)
2011
1,13
9,95
61,
423,
836
(283
,880
)21
0,00
018
3,69
3(0
.72)
Not
es:D
etai
ls re
gard
ing
the
city
's o
utst
andi
ng d
ebt c
an b
e fo
und
in th
e no
tes
to th
e fin
anci
alst
atem
ents
. Ope
ratin
g ex
pens
es d
o no
t inc
lude
inte
rest
, dep
reci
atio
n, o
r am
ortiz
atio
n ex
pens
es.
Deb
t Ser
vice
Wat
er R
even
ue B
onds
112

City
of B
ell G
arde
nsD
emog
raph
ic a
nd E
cono
mic
Sta
tistic
sLa
st T
en C
alen
dar Y
ears
Pers
onal
Per
Inco
me
Cap
itaC
alen
dar
(thou
sand
sPe
rson
alU
nem
ploy
men
tYe
arPo
pula
tion
of d
olla
rs)
Inco
me
Rat
e
2002
45,1
98
301,
002,
945
$
30,8
28$
11.1
%20
0344
,946
31
0,04
3,50
1
31
,452
11
.5%
2004
45,2
59
329,
048,
068
33,1
79
10.7
%20
0545
,372
34
2,23
1,12
134
,426
8.3%
2006
46,0
44
**
7.3%
2007
46,7
60
**
*20
0846
,766
36
9,17
4,34
8
37
,362
7.
1%20
0946
,786
39
0,29
5,86
5
39
,794
11
.8%
2010
47,0
02
413,
316,
582
42,2
65
11.6
%20
1144
,054
56
5,36
5,00
0
43
,999
1.
1%
Sour
ces:
Pop
ulat
ion
prov
ided
by
the
Cal
iforn
ia S
tate
Dep
t. of
Fin
ance
. P
erso
nal i
ncom
e an
d pe
rca
pita
inco
me
prov
ided
from
the
Bur
eau
of E
cono
mic
Ana
lysi
s an
d un
empl
oym
ent
data
pro
vide
d by
the
Sta
te D
epar
tmen
t of C
omm
erce
and
Lab
or.
Not
e: T
he in
form
atio
n pr
ovid
ed fo
r per
sona
l inc
ome
and
per c
apita
per
sona
l inc
ome
is fo
r the
Cou
nty
of L
os A
ngel
es.
Info
rmat
ion
for B
ell G
arde
ns w
as n
ot a
vaila
ble.
* In
form
atio
n no
t ava
ilabl
e
113
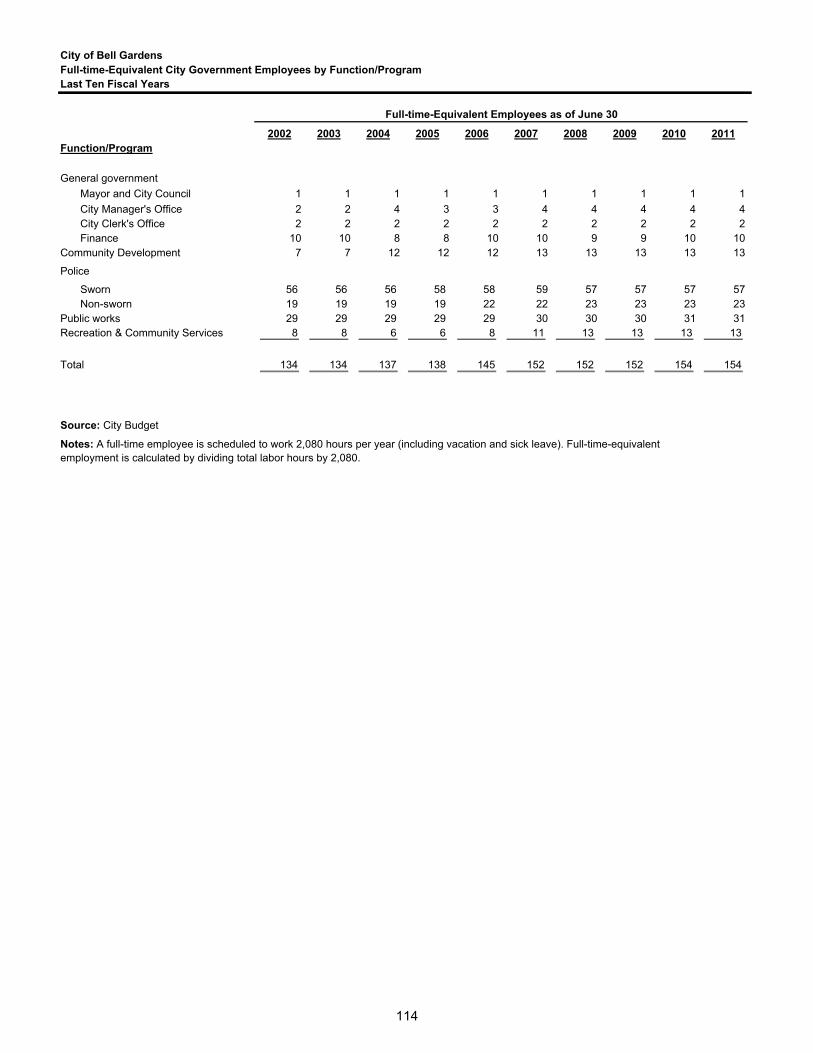
City of Bell GardensFull-time-Equivalent City Government Employees by Function/ProgramLast Ten Fiscal Years
2002 2003 2004 2005 2006 2007 2008 2009 2010 2011Function/Program
General governmentMayor and City Council 1 1 1 1 1 1 1 1 1 1City Manager's Office 2 2 4 3 3 4 4 4 4 4City Clerk's Office 2 2 2 2 2 2 2 2 2 2Finance 10 10 8 8 10 10 9 9 10 10
Community Development 7 7 12 12 12 13 13 13 13 13
Police
Sworn 56 56 56 58 58 59 57 57 57 57Non-sworn 19 19 19 19 22 22 23 23 23 23
Public works 29 29 29 29 29 30 30 30 31 31Recreation & Community Services 8 8 6 6 8 11 13 13 13 13
Total 134 134 137 138 145 152 152 152 154 154
Source: City Budget
Notes: A full-time employee is scheduled to work 2,080 hours per year (including vacation and sick leave). Full-time-equivalent employment is calculated by dividing total labor hours by 2,080.
Full-time-Equivalent Employees as of June 30
114

City
of B
ell G
arde
nsO
pera
ting
Indi
cato
rs b
y Fu
nctio
n/Pr
ogra
mLa
st T
en F
isca
l Yea
rs
2002
2003
2004
2005
2006
2007
2008
2009
2010
2011
Func
tion/
Prog
ram
Gen
eral
gov
ernm
ent
Bui
ldin
g pe
rmits
issu
ed31
9
285
32
2
441
49
4
505
368
237
231
281
Pol
ice
Phy
sica
l arr
ests
612
1,
358
1,89
9
1,
818
1,53
1
1,
684
1,31
8
1,
642
1,52
4
1,
586
Par
king
vio
latio
ns4,
044
9,74
8
7,
203
8,81
0
6,
040
7,07
77,
493
7,60
7
5,
614
4,77
7Tr
affic
vio
latio
ns*
*4,
728
4,53
4
4,
495
5,07
95,
819
4,16
2
3,
864
5,13
3R
efus
e co
llect
ion
Ref
use
colle
cted
(ton
s pe
r day
)70
.0
70.0
72
.0
72.0
74
.0
8710
1
93
75
72
R
ecyc
labl
es c
olle
cted
(ton
s pe
r day
)9.
0
9.0
9.
0
11.0
11
.0
2314
11
23
22
O
ther
pub
lic w
orks
Stre
et re
surfa
cing
(mile
s)*
**
1.7
1.
4
07.
5*
1.5
3.2
Pot
hole
s re
paire
d22
5
270
27
5
280
28
0
277
321
28
8
330
29
5
Par
ks a
nd re
crea
tion
Ath
letic
fiel
d pe
rmits
issu
ed
565
776
480
678
275
31
914
7
53
4
14
6
16
5C
omm
unity
cen
ter a
dmis
sion
s14
0,04
7
142,
148
14
4,28
0
146,
444
14
8,64
1
156,
000
163,
800
26
0,40
6
430,
053
40
1,75
8Tr
ansi
tTo
tal r
oute
mile
s*
*18
8,68
7
179,
856
*
**
**
*P
asse
nger
s35
0,85
3
317,
091
31
2,84
4
346,
574
28
3,58
3
287,
996
346,
832
32
2,51
1
**
Sour
ces:
Var
ious
city
dep
artm
ents
.
* In
form
atio
n no
t ava
ilabl
e
Fisc
al Y
ear
115

City
of B
ell G
arde
nsC
apita
l Ass
et S
tatis
tics
by F
unct
ion/
Prog
ram
Last
Ten
Fis
cal Y
ears
2002
2003
2004
2005
2006
2007
2008
2009
2010
2011
Func
tion/
Prog
ram
Pol
ice Sta
tions
1
1
1
1
1
1
11
11
Oth
er p
ublic
wor
ksS
treet
s (m
iles)
386.
4
390.
4
394.
3
398.
3
402.
3
402.
340
2.3
402.
340
2.3
402.
3H
ighw
ays
(mile
s)
107.
4
107.
410
7.4
107.
4
107.
410
7.4
107.
410
7.4
107.
410
7.4
Stre
etlig
hts
7,83
9
7,91
9
7,99
9
8,07
9
8,16
1
8,16
28,
162
8,16
28,
162
8,16
2Tr
affic
sig
nals
101
105
105
106
106
111
111
111
111
111
Par
ks a
nd re
crea
tion
Acr
eage
64
64
64
64
64
6464
6464
64P
layg
roun
ds7
9
9
9
10
1010
1010
10B
aseb
all/s
oftb
all d
iam
onds
30
39
39
39
41
3
33
33
Was
tew
ater
San
itary
sew
ers
(mile
s)46
5.3
47
0.0
47
4.8
47
9.6
48
4.4
48
4.4
48
4.4
48
4.4
48
4.4
48
4.4
Sto
rm s
ewer
s (m
iles)
325.
2
328.
4
331.
8
335.
1
338.
5
338.
5
338.
5
338.
5
338.
5
338.
5Tr
eatm
ent c
apac
ity (t
hous
ands
of g
allo
ns)
3,55
0
3,55
0
3,55
0
3,55
0
4,20
0
4,20
0
4,20
0
4,20
0
4,20
0
4,20
0Tr
ansi
t—S
enio
r Citi
zen
Bus
1
1
1
1
1
1
1
7
7
7
Sour
ces:
Var
ious
city
dep
artm
ents
.N
otes
:No
capi
tal a
sset
indi
cato
rs a
re a
vaila
ble
for t
he g
ener
al g
over
nmen
t fun
ctio
n.
* In
form
atio
n no
t ava
ilabl
e
Fisc
al Y
ear
116