city of brea, california comprehensive annual …
TRANSCRIPT

CITY OF BREA, CALIFORNIA
COMPREHENSIVE ANNUAL FINANCIAL REPORT FOR THE FISCAL YEAR ENDED JUNE 30, 2017
Prepared by:
Administrative Services Department
Cindy Russell Administrative Services Director
Lee Squire
Financial Services Manager


i
CITY OF BREA, CALIFORNIA
COMPREHENSIVE ANNUAL FINANCIAL REPORT FOR THE FISCAL YEAR ENDED JUNE 30, 2017
TABLE OF CONTENTS
Page INTRODUCTORY SECTION: Letter of Transmittal v Organizational Chart xiii GFOA Award xiv FINANCIAL SECTION: Independent Auditors' Report 1
Management's Discussion and Analysis (Required Supplementary Information) 5
Basic Financial Statements:
Government-wide Financial Statements:
Statement of Net Position 19 Statement of Activities 20
Governmental Fund Types:
Balance Sheet 24 Reconciliation of the Balance Sheet of Governmental Funds
to the Statement of Net Position 27 Statement of Revenues, Expenditures and Changes in Fund Balances 28 Reconciliation of the Statement of Revenues, Expenditures and Changes
In Fund Balances of Governmental Funds to the Statement of Activities 30
Proprietary Funds: Statement of Net Position 32 Statement of Revenues, Expenses and Changes in Fund Net Position 33 Statement of Cash Flows 34
Fiduciary Funds:
Statement of Net Position 36 Statement of Changes in Fiduciary Net Position 37
Notes to Basic Financial Statements 39
Required Supplementary Information: Schedule of Changes in the Net Pension Liability and Related Ratios – Miscellaneous Plan 93 Schedule of Changes in the Net Pension Liability and Related Ratios – Safety Plan 94 Schedule of Plan Contributions 95 Schedule of Funding Progress 96 Schedule of Revenues, Expenditures and Changes in Fund Balance – Budget and Actual – General Fund 97 Schedule of Revenues, Expenditures and Changes in Fund Balance – Budget and Actual – Housing Successor Fund 98 Note to Required Supplementary Information 99

ii
CITY OF BREA, CALIFORNIA
COMPREHENSIVE ANNUAL FINANCIAL REPORT
FOR THE FISCAL YEAR ENDED JUNE 30, 2017 TABLE OF CONTENTS (CONTINUED)
Page
Supplementary Information:
Schedule of Revenues, Expenditures, and Changes in Fund Balance – Budget and Actual: Major Capital Projects Funds – Capital Improvements Fund 103
Non-Major Governmental Funds:
Combining Balance Sheet 106 Combining Statement of Revenues, Expenditures and Changes in Fund Balances 110 Schedule of Revenues, Expenditures and Changes in Fund Balances – Budget and Actual:
Gas Tax 114 Narcotics Enforcement Asset Seizure 115 Air Quality Improvement 116 Park Development 117 Measure M 118 Affordable Housing Trust 119 Community Development Block Grant 120 Blackstone CFD 121 La Floresta CFD 122 Taylor-Morrison CFD 123 Capital and Mitigation Improvement 124 Storm Drain 125 Midbury 126
Proprietary Funds: Combining Statement of Net Position 128 Combining Statement of Revenues, Expenses and Changes in Fund Net Position 129 Combining Statement of Cash Flows 130
Internal Service Funds: Combining Statement of Net Position 132 Combining Statement of Revenues, Expenses and Changes in Fund Net Position 133 Combining Statement of Cash Flows 134
Agency Funds: Combining Balance Sheet 136 Combining Statement of Changes in Fiduciary Assets and Liabilities 138

iii
CITY OF BREA, CALIFORNIA
COMPREHENSIVE ANNUAL FINANCIAL REPORT FOR THE FISCAL YEAR ENDED JUNE 30, 2017
TABLE OF CONTENTS (CONTINUED)
Page
STATISTICAL SECTION:
Financial Trends Net Position by Component, Last Ten Fiscal Years 143 Changes in Net Position, Last Ten Fiscal Years 144 Fund Balances of Governmental Funds, Last Ten Fiscal Years 146 Changes in Fund Balances of Governmental Funds, Last Ten Fiscal Years 147
Revenue Capacity Assessed Value and Estimated Actual Value of Taxable Property, Last Ten Fiscal Years 148 Direct and Overlapping Property Tax Rates, Last Ten Fiscal Years 149 Principal Property Tax Payers, Current Year and Nine Years Ago 150 Property Tax Levies and Collections, Last Ten Fiscal Years 151 Taxable Sales by Category, Last Ten Fiscal Years 152
Debt Capacity Ratios of Outstanding Debt by Type, Last Ten Fiscal Years 153 Ratio of Net General Bonded Debt Outstanding, Last Ten Fiscal Years 154 Direct and Overlapping Debt 155 Legal Debt Margin, Last Ten Fiscal Years 156 Pledged Revenue Coverage 157
Demographic and Economic Information Demographic and Economic Statistics, Last Ten Fiscal Years 158 Principal Employers, Current Year and Last Nine Fiscal Years 159
Operating Information Full-time City Equivalent City Employees by Function, Last Ten Fiscal Years 160 Operating Indicators, Last Ten Fiscal Years 161 Capital Asset Statistics by Function, Last Ten Fiscal Years 162
OTHER REPORTS: Independent Auditors’ Report on Internal Control Over Financial Reporting And on Compliance and Other Matters Based on an Audit of Financial Statements Performed in Accordance with Government Auditing Standards 163
Schedule of Findings and Responses 165
Audit Communication Letter 171

iv
This page intentionally left blank.

INTRODUCTORY SECTION

This page intentionally left blank.


xiii

xiv

FINANCIAL SECTION

This page intentionally left blank.

25231 Paseo De Alicia, Suite 100, Laguna Hills, CA 92653 P 949.768.0833 F 949.768.8408 W vtdcpa.com
1
INDEPENDENT AUDITORS’ REPORT To the Members of the City Council City of Brea, California Report on the Financial Statements We have audited the accompanying financial statements of the governmental activities, the business-type activities, each major fund, and the aggregate remaining fund information of the City of Brea, California, (City) as of and for the year ended June 30, 2017, and the related notes to the financial statements, which collectively comprise the City’s basic financial statements as listed in the table of contents. Management’s Responsibility for the Financial Statements Management is responsible for the preparation and fair presentation of these financial statements in accordance with accounting principles generally accepted in the United States of America; this includes the design, implementation, and maintenance of internal control relevant to the preparation and fair presentation of financial statements that are free from material misstatement, whether due to fraud or error. Auditors’ Responsibility Our responsibility is to express opinions on these financial statements based on our audit. We conducted our audit in accordance with auditing standards generally accepted in the United States of America and the standards applicable to financial audits contained in Government Auditing Standards, issued by the Comptroller General of the United States. Those standards require that we plan and perform the audit to obtain reasonable assurance about whether the financial statements are free from material misstatement. An audit involves performing procedures to obtain audit evidence about the amounts and disclosures in the financial statements. The procedures selected depend on the auditors’ judgment, including the assessment of the risks of material misstatement of the financial statements, whether due to fraud or error. In making those risk assessments, the auditor considers internal control relevant to the entity’s preparation and fair presentation of the financial statements in order to design audit procedures that are appropriate in the circumstances, but not for the purpose of expressing an opinion on the effectiveness of the entity’s internal control. Accordingly, we express no such opinion. An audit also includes evaluating the appropriateness of accounting policies used and the reasonableness of significant accounting estimates made by management, as well as evaluating the overall presentation of the financial statements. We believe that the audit evidence we have obtained is sufficient and appropriate to provide a basis for our audit opinions.

2
Opinions In our opinion, the financial statements referred to above present fairly, in all material respects, the respective financial position of the governmental activities, the business-type activities, each major fund, and the aggregate remaining fund information of the City, as of June 30, 2017, and the respective changes in financial position, and, where applicable, cash flows thereof for the year then ended in accordance with accounting principles generally accepted in the United States of America. Emphasis of Matter As described in Notes 4 and 13 to the financial statements, the City restated net position of as July 1, 2016 for amounts related to the City’s equity investment in California Domestic Water Company (CDWC) to include Cadway, Inc., the consolidated wholly owned subsidiary of CDWC. The City’s other related party transactions with CDWC are described in Note 4. As described in Note 13 to the financial statements, the City restated net position as of July 1, 2016 for amounts reflected in Construction in Progress, but were placed into service in 2013. Also, as described in Note 1 to the financial statements, the City adopted Governmental Accounting Standards Board (GASB) Statement No. 82, Pension Issues – An Amendment of GASB Statements No. 67, No. 68, and No. 73, as of July 1, 2016. Our opinion is not modified with respect to these matters. Other Matters Required Supplementary Information Accounting principles generally accepted in the United States of America require that the management’s discussion and analysis (pages 5 through 17), schedule of changes in the net pension liability and related ratios for the Miscellaneous and Safety Plans (pages 93 through 94), and schedule of plan contributions for the Miscellaneous and Safety Plans (page 95), schedule of funding progress (page 96), schedules of revenues, expenditures and changes in fund balance – budget and actual for the General fund and each major special revenue fund and related note (pages 97 through 99), be presented to supplement the basic financial statements. Such information, although not a part of the basic financial statements, is required by the Governmental Accounting Standards Board who considers it to be an essential part of financial reporting for placing the basic financial statements in an appropriate operational, economic, or historical context. We have applied certain limited procedures to the required supplementary information in accordance with auditing standards generally accepted in the United States of America, which consisted of inquiries of management about the methods of preparing the information and comparing the information for consistency with management’s responses to our inquiries, the basic financial statements, and other knowledge we obtained during our audit of the basic financial statements. We do not express an opinion or provide any assurance on the information because the limited procedures do not provide us with sufficient evidence to express an opinion or provide any assurance.

3
Other Information Our audit was conducted for the purpose of forming opinions on the financial statements that collectively comprise the City’s basic financial statements. The introductory section, combining and individual nonmajor funds financial statements and budgetary comparison schedules, and statistical section, are presented for purposes of additional analysis and are not a required part of the basic financial statements. The combining and individual nonmajor funds financial statements and budgetary comparison schedules are the responsibility of management and were derived from and relate directly to the underlying accounting and other records used to prepare the basic financial statements. Such information has been subjected to the auditing procedures applied in the audit of the basic financial statements and certain additional procedures, including comparing and reconciling such information directly to the underlying accounting and other records used to prepare the basic financial statements or to the basic financial statements themselves, and other additional procedures in accordance with auditing standards generally accepted in the United States of America. In our opinion, the combining and individual nonmajor funds financial statements and budgetary comparison schedules are fairly stated, in all material respects, in relation to the basic financial statements as a whole. The introductory and statistical sections have not been subjected to the auditing procedures applied in the audit of the basic financial statements and, accordingly, we do not express an opinion or provide any assurance on them. Other Reporting Required by Government Auditing Standards In accordance with Government Auditing Standards, we have also issued our report dated May 31, 2018, on our consideration of the City’s internal control over financial reporting and on our tests of its compliance with certain provisions of laws, regulations, contracts, and grant agreements and other matters. The purpose of that report is to describe the scope of our testing of internal control over financial reporting and compliance and the results of that testing, and not to provide an opinion on internal control over financial reporting or on compliance. That report is an integral part of an audit performed in accordance with Government Auditing Standards in considering the City’s internal control over financial reporting and compliance.
Laguna Hills, California May 31, 2018

4
This page intentionally left blank.

MANAGEMENT’S DISCUSSION AND ANALYSIS

This page intentionally left blank.

5
MANAGEMENT’S DISCUSSION AND ANALYSIS
This section of the City of Brea’s Comprehensive Annual Financial Report (CAFR) presents management’s discussion and analysis of the City’s financial performance during the fiscal year that ended on June 30, 2017. This analysis should be read in conjunction with the Transmittal Letter at the front of this report and the accompanying Basic Financial Statements. FINANCIAL HIGHLIGHTS Long-Term Economic Resource (Government-wide) Focus – Economic resources are differentiated from financial resources in that the economic measurement focus measures changes in net position as soon as the event occurs regardless of the timing of related cash flows. Therefore, this measurement focus includes both current spendable resources and fixed non-spendable assets, and long-term claims against these assets. The resulting net position utilizing this measurement focus provides one measure of the City’s overall long-term financial condition. The assets and deferred inflows of the City exceeded its liabilities at the close of the most recent fiscal
year resulting in a net position of $228 million. The City’s total net position increased overall by $15 million, $11 million due to current year operations
and $4 million due to capital asset restatement. The City’s non-current liabilities of $179 million primarily includes $111.6 million in net pension liabilities
and $57.2 million of outstanding bonded debt and capital leases (which was used to finance the acquisition of capital assets and to fund capital improvements). Total capital assets, net of depreciation represent $271 million of the $410 million in total assets. A significant portion of the capital assets have been funded through bond financing from the former Brea Redevelopment Agency.
Short-Term Financial Resource (Fund) Focus – The financial resources focus measures inflows of current spendable assets. The resulting net difference between current financial assets and current financial liabilities otherwise known as fund balance (or net working capital in the private sector) is to measure the City’s ability to finance activities in the near term. At the close of the current fiscal year, the City’s Governmental Funds reported a combined ending fund
balance of $79 million, a decrease of $5 million. Of the total combined fund balance of $79 million for governmental funds, $412,659 was non-spendable, $52.9 million was restricted, $11.3 million was assigned, and $14.1 million was unassigned.
The General Fund reported a decrease of $2.9 million in fund balance resulting in total ending fund balance of $34 million. The decrease was primarily due to the funding of the Downtown Parking Structure from the Community Benefit and Economic Development Fund. Of total ending fund balance, $412,659 was non-spendable, $8.2 million was restricted, $11.3 million was assigned and $14.1 million was unassigned. The unassigned balance is available for future appropriations.

6
OVERVIEW OF THE FINANCIAL STATEMENTS The financial section of the comprehensive annual financial report contains the following information: Independent Auditors’ Report, Management’s Discussion and Analysis (this section), the Basic Financial Statements, and the Supplementary Information section, an optional section that presents combining and budgetary schedules for individual non-major funds. The Basic Financial Statements are comprised of three components: 1) Government-wide Financial Statements, 2) Fund Financial Statements and 3) Notes to the Financial Statements. The Management’s Discussion and Analysis is intended to be an introduction to the Basic Financial Statements. BASIC FINANCIAL STATEMENTS Government-wide Financial Statements – The Government-wide Financial Statements are intended to provide a “Big Picture” view of the City as a whole using accounting methods similar to those used by private sector companies. The statement of net position includes all of the City’s assets (including non-spendable assets like streets and roads) and any deferred inflows, liabilities (including long-term liabilities that may be paid over twenty or more years) and any deferred outflows of resources. All of the current year revenues and expenses are accounted for in the statement of activities regardless of when cash is received or paid. Government-wide Financial Statements report the City’s net position and how they have changed. Net position – the difference between the City’s assets and liabilities – is one way to measure the City’s financial health, or position. Over time, increases or decreases in the City’s net position are an indicator of whether its financial health is improving or deteriorating, respectively. To assess the overall health of the City, one should also consider additional non-financial factors such as changes in the City’s property tax base and the condition of the City’s roads. The City’s Government-wide Financial Statements are divided into two categories:
Governmental Activities – This statement depicts the extent to which programs are self-supporting and the net amount provided by property taxes and other general revenues. Most of the City’s basic services are included in this category, such as public safety, community development, community services, public works, and general administration. Taxes and charges for services finance most of these activities.
Business-type Activities – The City’s business enterprises include urban runoff, water utility, sewer utility, sanitation, and information technology external support. The City charges fees to customers to recover the cost of providing these services.
Fund Financial Statements – Funds are accounting devices that the City uses to track and control resources intended for specific purposes. The Fund Financial Statements provide more detailed information about the City’s most significant funds (major funds) but not the City as a whole. Some funds are required by State and Federal law or by bond covenants. Other funds are utilized simply to control and manage resources intended for particular purposes. The City utilizes three broad categories of funds:
Governmental Funds – Governmental Funds are used to account for essentially the same functions reported as Government Activities in the Government-wide Financial Statements. However, unlike the Government-wide Financial Statements, Governmental Fund Financial Statements utilize the financial resources measurement focus and thus concentrate on near-term inflows and outflows of spendable resources, as well as on balances of spendable resources available at the end of the fiscal year. Consequently, the Governmental Fund Financial Statements provide a detailed short-term view that helps a reader determine whether there are more or fewer financial resources that can be spent in the near future to finance City programs.

7
Proprietary Funds – Services for which the City charges customers a fee are generally reported in Proprietary Funds (Enterprise Funds and Internal Service Funds). Like the Government-wide Financial Statements, these funds provide both long and short-term financial information utilizing the economic resources measurement focus. The City’s Enterprise Funds (urban runoff, water, utility, sewer utility, sanitation, and information technology external support) are individual funds represented in the combined presentation of Business-type Activities in the Government-wide Financial Statements. The individual fund presentation provides more detailed information about each business segment, its operating statements, and statements of cash flow. The City also uses Internal Service Funds that are utilized to report and allocate the cost of certain centrally managed and operated activities (risk management, equipment replacement, and building occupancy). Because the Internal Service Funds primarily serve the government, they are reported with Governmental Activities rather than the Business-type Activities in the Government-wide Financial Statements. Fiduciary Funds – The City utilizes Fiduciary Funds to account for assets held by the City in a trustee capacity, or as an agent for other governmental entities, private organizations, or individuals. All of the City’s fiduciary activities are reported in a separate statement of fiduciary net position and a statement of changes in fiduciary net position. We exclude these activities from the City’s Government-wide Financial Statements because the City cannot use these assets to finance its operations.
Notes to the Financial Statements – The financial statements also include the Notes to the Financial Statements that provide important narrative details about the information contained in the financial statements. Information contained in the Notes to the Financial Statements is critical to a reader’s full understanding of the Government-wide and Fund Financial Statements. Supplementary Information – In addition to the required elements of the Basic Financial Statements, we have also included a Supplementary Information section, which includes budgetary and combining schedules that provide additional details about the City’s non-major Governmental Funds, Enterprise Funds, Internal Service Funds, and Fiduciary Funds.

8
GOVERNMENT-WIDE FINANCIAL ANALYSIS Net Position – Net position may serve over time as a useful indicator of a government’s financial position. The City’s combined net position for the year ended June 30, 2017, as shown in Table 1, was $229 million.
2017 2016 2017 2016 2017 2016
Current and other assets 96,892$ 102,695$ 16,310$ 33,535$ 113,202$ 136,230 Capital assets 177,570 173,086 93,268 85,681 270,838 258,767 Noncurrent assets 8,956 173,086 17,170 85,681 26,126 258,767
Total assets 283,418 275,781 126,748 119,216 410,166 394,997
Deferred charge on refunding - - 655 819 655 819 Deferred pension related items 19,606 16,256 1,901 1,566 21,507 17,822
Total Deferred Outflows of Resources 19,606 16,256 2,556 2,385 22,162 18,641
Noncurrent liabilities 116,851 104,990 62,181 63,205 179,032 168,195 Other liabilities 16,128 8,209 3,819 3,735 19,947 11,944
Total liabilities 132,979 113,199 66,000 66,940 198,979 180,139
Deferred pension related items 3,784 16,933 1,178 2,683 4,962 19,616
Total Deferred Inflows of Resources 3,784 16,933 1,178 2,683 4,962 19,616
Net Investment in Capital Assets 170,548 165,493 42,092 33,174 212,640 198,667 Restricted 52,867 54,410 5,641 6,166 58,508 60,576 Unrestricted (57,154) (57,998) 14,393 12,638 (42,761) (45,360)
Total net position 166,261$ 161,905$ 62,126$ 51,978$ 228,387$ 213,883$
(in thousands)Fiscal Year Ended June 30, 2017
Net PositionTable 1
Total ActivitiesBusiness-Type ActivitiesGovernmental Activities
Net Investment of Capital Assets – The largest component of the $410 million in total assets is the City’s investment in capital assets (e.g., land, buildings, infrastructure, and equipment), representing $271 million or 66% of total assets. A significant portion of the capital assets have been funded through bond financing from the former Brea Redevelopment Agency. Noncurrent Liabilities -- Of the $179 million in long-term (non-current) liabilities, $57.5 million represents outstanding bonded debt and capital leases and $111.6 million represents net pension liability. The proceeds from debt were used to finance the acquisition of capital assets and to fund capital improvements. Restricted Net Position –The $58.5 million in restricted net position was on overall decrease of $2.1 million from the prior fiscal year. Unrestricted Net Position – The ($42.8) million in unrestricted net position was an overall decrease of $2.8 million from the prior fiscal year. Overall the City’s net position increased $15 million during the current fiscal year.

9
2017 2016 2017 2016 2017 2016
Revenues:Program Revenues:
Charges for services 9,484$ 8,905$ 28,377$ 24,498$ 37,861$ 33,403$ Operating grants and contributions 2,633 3,399 525 11 3,158 3,410 Capital grants and contributions 5,669 2,337 - - 5,669 2,337
General Revenues:Taxes:
Property taxes 17,888 16,656 - - 17,888 16,656 Sales taxes 21,200 21,612 - - 21,200 21,612 Transient occupancy taxes 1,716 1,606 - - 1,716 1,606 Franchise taxes 1,680 1,590 - - 1,680 1,590 Business license taxes 1,079 1,102 - - 1,079 1,102 Other taxes 392 797 - - 392 797
Motor vehicle in lieu 75 73 - - 75 73 Use of money and property 1,111 1,602 (23) 304 1,088 1,906 Rental Income 1,032 952 - - 1,032 952 Other 8,694 2,940 138 328 8,832 3,268 Gain (loss) on sale of capital asset (2) 83 112 73 110 156
Total Revenues 72,651 63,654 29,129 25,214 101,780 88,868
Expenses:General government 7,758 7,298 - - 7,758 7,298 Public safety 33,938 31,372 - - 33,938 31,372 Community development 3,403 3,011 - - 3,403 3,011 Community services 7,599 7,268 - - 7,599 7,268 Public works 16,307 13,544 - - 16,307 13,544 Interest on long-term debt 415 435 - - 415 435 Urban runoff - - 377 415 377 415 Water utility - - 14,883 14,085 14,883 14,085 Sewer utility - - 1,630 1,591 1,630 1,591 Sanitation - - 3,045 2,938 3,045 2,938 Information Technology External Support - - 1,724 1,312 1,724 1,312
Total Expenses 69,420 62,928 21,659 20,341 91,079 83,269
Change in net position before transfers 3,231 726 7,470 4,873 10,701 5,599
Transfers 1,125 1,591 (1,125) (1,591) - -
Change in net position 4,356 2,317 6,345 3,282 10,701 5,599
Net position at beginning of year 161,905 151,833 51,978 48,174 213,883 200,007
Restatement of Net position - 7,755 3,803 522 3,803 8,277
Net position at end of year 166,261$ 161,905$ 62,126$ 51,978$ 228,387$ 213,883$
Governmental Activities Business-Type Activities Total Activities
Table 2Change in Net Position
Fiscal Year Ended June 30, 2017(in thousands)
Governmental Activities – The cost of all Governmental Activities in the current fiscal year was $69.4 million. As shown on the statement of activities, $9.5 million of the cost was paid by those who directly benefited from the programs; $8.3 million was financed by contributions and grants received from other governmental organizations, developers, and property owners for both capital and operating activities; and $54.9 million was subsidized through general City revenues. Therefore, as a result of operations, the City’s change in net position before transfers increased by $3.2 million.

10
Property tax revenues for Fiscal Year 2016-17 increased by $1,232,000 when compared to Fiscal Year 2015-16. The increase in property tax revenues is primarily due to the increase in sale value of residential and commercial properties as well as new residential construction in the Blackstone and La Floresta housing developments. Sales tax revenues for Fiscal Year 2016-17 were $421,000 lower when compared to Fiscal Year 2015-16. Total expenses for Fiscal Year 2016-17 were $69.4 million, an increase of $6.5 million when compared to Fiscal Year 2015-16. This was primarily due to a combination of increases in public safety and public works expenses. Brea is a full service city providing residents, businesses and visitors with the following functional services: General Government is comprised of two departments (City Council/City Manager and Administrative Services) providing general governance, executive management, legal services, communication and marketing, human resources, records management, information technology, accounting, budget, treasury, utility billing, purchasing and reprographics. Public Safety is comprised of two departments (Police Services and Fire Services) providing general law enforcement, public safety dispatch, fire suppression, fire prevention, paramedic services and emergency preparedness. Community Development is comprised of two divisions (Planning & Building Services and Economic Development Services) providing planning, zoning and building services, redevelopment services, economic development and housing services. Community Services is overseen by one department and includes recreation, arts and human services, and the community center. Public Works is overseen by one department and includes engineering and construction of public facilities, parks, streets and related infrastructure, traffic engineering as well as the maintenance of all public facilities, parks, streets and related infrastructure. Business-type activities is comprised of two departments (Public Works and Administrative Services) providing five activities to residential and business customers (urban runoff, water utility, sewer utility, sanitation services and information technology external support to public agencies). Each programs’ net cost (total cost less revenues generated by the activities) is presented below. The net cost shows the extent to which the City’s general taxes support each of the City’s programs.

11
2017 2016 2017 2016
General government 7,758$ 7,298$ 2,669$ 2,824$ Public safety 33,938 31,372 1,712 2,048 Community development 3,403 3,011 2,592 1,866 Community services 7,599 7,268 2,958 3,330 Public works 16,307 13,544 7,855 4,573 Interest on long-term debt 415 435 - -
Totals 69,420$ 62,928$ 17,786$ 14,641$
Table 3
Fiscal Year Ended June 30, 2017(in thousands)
Governmental Activities
ProgramExpenses
ProgramRevenues
Of the $17.8 million in program revenues that financed the Governmental Activities, 44% was utilized for Public Works, 17% was utilized for Community Services, and 15% was utilized for each General Government and Community Development, while the remaining 9% supplemented Public Safety.

12
Table 5 Governmental Activities
Fiscal Year Ended June 30, 2017
Major Governmental Activities in the current fiscal year included the following: Revenues The City’s combined amount of program revenues, general revenues, taxes and transfers were $73.8
million. This amount includes operating and capital contributions and grants of $8.3 million and $45.1 million in taxes and transfers.
Of the $73.8 million in total governmental revenues and transfers, 24.1% represents program revenues
and 61.1% represents taxes & transfers. Other revenues make up the remaining 14.8%. Expenses In the current year, expenses for all Governmental Activities were $69.4 million. See Table 5 above for
an analysis of the expenses by function/program.

13
Business-type Activities – Business-type Activities increased the City’s net position by $10.1 million which was comprised of various changes in the net position of the urban runoff, water utility, sewer utility, sanitation and information technology external support activities, as well as a restatement to opening net position of $3.8 million. Business-type Activities are financed primarily by fees charged to external parties for goods and services.
Table 6 Program Expense & Revenue – Business-type Activities
Fiscal Year Ended June 30, 2017 (in millions)
Business-type Activities in the current fiscal year included the following: The water utility activity had an increase in net position of $9.2 million. The increase in net position was primarily due to the increase in charges for services of $5.4 million, as well as $3.8 million restatement due to reclassification of a capital improvement project and the effect of now using the equity method of investment application using consolidated activity of California Domestic Water Company, including the activity of Cadway, a wholly-owned subsidiary of California Domestic Water Company. Of the $12 million in water related expenses, 44.8% was from the purchase of water, 12.7% was from maintenance and other operating expenses, 18% was from depreciation, and 24.5% covered personnel costs. Water rates were adjusted effective January 2017, to fund on-going operations, recapture the bond coverage ratio and provide funding for planned capital improvements to the water utility system. The sewer utility activity had an increase in net position of $581,309. The increase in net position was primarily due to Capital Improvement Projects not completed with the fiscal year and carried forward to Fiscal Year 2017-18. Of the $1.6 million in sewer related expenses, 14.3% was from maintenance and other operating expenses, 26.4% from depreciation and 59.3% from personnel costs. The urban runoff activity had an increase in net position of $27,272. This increase was primarily due to user rates being adjusted as well as revenues over expenses. Operating expenses, which include maintenance and operation costs of $148,130, personnel costs of $227,772, depreciation of $938, interest expense of $434 and transfer out of $7,540, totaled $384,814 while operating and non-operating revenues totaled $412,086.

14
The sanitation utility activity had an increase in net position of $105,079. The increase in net position was due to operating revenues of $3.6 million, expenses of $3 million and the transfer out of $465,000 of franchise fees. Operating expenses, included maintenance and operation costs of $2.4 million and personnel costs of $606,083. The information technology external support activity had an increase in net position of $185,584. Operating revenues of $1.9 million exceeded operating expenses of $1.7 million. FINANCIAL ANALYSIS OF THE CITY’S FUNDS As noted earlier, the City uses fund accounting to highlight available financial resources and to ensure and demonstrate compliance with finance-related legal requirements. Governmental Funds – Utilizing the financial resources measurement focus, the City’s Governmental Funds provide information on near-term inflows and outflows, and balances of spendable resources. This information is useful in assessing the City’s financing requirements. In particular, unassigned fund balance may serve as a useful measure of a government’s net resources available for spending at the end of the fiscal year. At the end of the current fiscal year, the City’s governmental funds reported a combined ending fund balance of $79 million, a decrease of $5 million. Non-spendable fund balance of $412,659 is for advances to other funds. Restricted fund balance totals $52.9 million, legally restricted by external parties. Assigned fund balance totals $11.3 million which is primarily for community center replacement. Unassigned fund balance totals $14.1 million. The General Fund ended the fiscal year with a $34 million fund balance, a net decrease of $2.9 million. Non-spendable fund balance of $412,659 is for advances to other funds. Restricted fund balance of $8.2 million includes $6.8 million toward the payment of the City’s pension obligations and remaining is for items such as debt service funds with trustees as well as for lighting and landscape districts. Assigned fund balance of $11.3 million is primarily for capital asset replacement. Unassigned fund balance of $14.1 million is available for future appropriations. The Housing Successor Fund ended the fiscal year with a fund balance of $20.7 million all of which is restricted for affordable housing activities and for notes and loans receivable. The City’s Capital Projects Fund ended the fiscal year with a fund balance of $9 million, a decrease of $5 million. Restricted fund balance of $9 million is primarily for impact fees. Proprietary Funds – The City’s Proprietary Funds (Enterprise and Internal Service Funds) presented in the Fund Financial Statements section basically provide the same type of information in the Government-wide Financial Statements, but include individual segment information. The Water Utility Fund ended the fiscal year with a net position of $50 million, an increase of $9.2 million from prior year. The increase in net position was primarily due to the increase in charges of $5.4 million for services, as well as $3.8 million in restatements due to reclassification of a capital improvement project and the effect of now using the equity method of investment application using consolidated activity of California Domestic Water Company, including the activity of Cadway, a wholly-owned subsidiary of California Domestic Water Company. Of the $50 million in net position $28.1 million is net investment in capital assets, $5.6 million is restricted for debt service and $16.3 million is unrestricted. The Sewer Utility Fund ended the fiscal year with $15.1 million in net position, an increase of $581,309. The increase in net position was primarily due to Capital Improvement Projects not completed with the fiscal year and carried forward to Fiscal Year 2017-18. Of the $15.1 million in net position $1.1 million is unrestricted and the balance is net investment in capital assets.

15
GENERAL FUND BUDGETARY HIGHLIGHTS The final budgeted resources and transfers in for the General Fund at fiscal year-end were $2.5 million more than the original budget and total actual resources and transfers in were $484,880 more than the final budget. The final appropriations and transfers out for the General Fund at fiscal year-end were $7.1 million more than the original budget and total actual expenditures and transfers out were $5.3 million less than the final budget. Several factors contributed to the final variance and are briefly summarized as follows: Changes to Original Budget Resources (Inflows): The $2.5 million variance was primarily due to increased miscellaneous revenue which is attributed to
the City’s portion of sale proceeds of the Successor Agency’s liquidation of assets.
Changes to Appropriation (Outflows): The variance between original budget and final budget of $7.1 million was primarily due to a $4.1 million
increase in transfers out, $3.0 million increase in operational costs primarily consisting of capital outlay and public safety.
Variances with Final Budget Resources (Inflows): The variance between budgeted and actual resources was $971,620. This was primarily due to
transfers in. Charges to Appropriation (Outflows): The variance between budgeted and actual charges of $6.8 million was due to $4.0 million decrease in
transfers out, $2.8 million decrease in operational charges across all departments including capital outlay. Operational charges for General Government decreased by $549,578, Public Safety decreased by $482,695, Community Services decreased by $546,023 and remaining variance was spread over Community Development, and Public Works departments.

16
CAPITAL ASSETS AND DEBT ADMINISTRATION
Capital Assets The City’s investment in capital assets for governmental and business-type activities as of June 30, 2017, amounts to $271 million (net of accumulated depreciation). This investment in a broad range of capital assets includes land, structures and improvements, furniture, machinery and equipment, park facilities, roads, sidewalks, water system, storm drains, sound walls, and bridges. The total net increase (including additions and deletions) of $12 million represents a 4.7% increase from last year.
2017 2016 2017 2016 2017 2016
Land 47,152$ 44,743$ 2,074$ 2,075$ 49,226$ 46,818$ Water rights - - 32,375 23,931 32,375 23,931 Structures and improvements 40,310 41,757 - - 40,310 41,757 Equipment 8,579 8,726 73 98 8,652 8,824 Infrastructure 69,085 71,852 58,746 56,598 127,831 128,450 Construction-in-progress 12,444 6,008 - 2,979 12,444 8,987
Totals 177,570$ 173,086$ 93,268$ 85,681$ 270,838$ 258,767$
Total
Table 7
Fiscal Year Ended June 30, 2017Capital Assets (net of depreciation)
(in thousands)
GovernmentalActivities
Business-TypeActivities
The net increase to construction-in-progress totaled $3.5 million, as noted above. This was primarily due to the addition of various capital improvement projects, not yet completed. However, the following significant capital assets and infrastructure projects were completed in Fiscal Year 2016-17:
Berry Street Booster Station Glenbrook Tract Waterline Improvements Traffic Control Technology improvements
Additional information on the City’s capital assets can be found in Note (7) of the Notes to the Financial Statements.
17
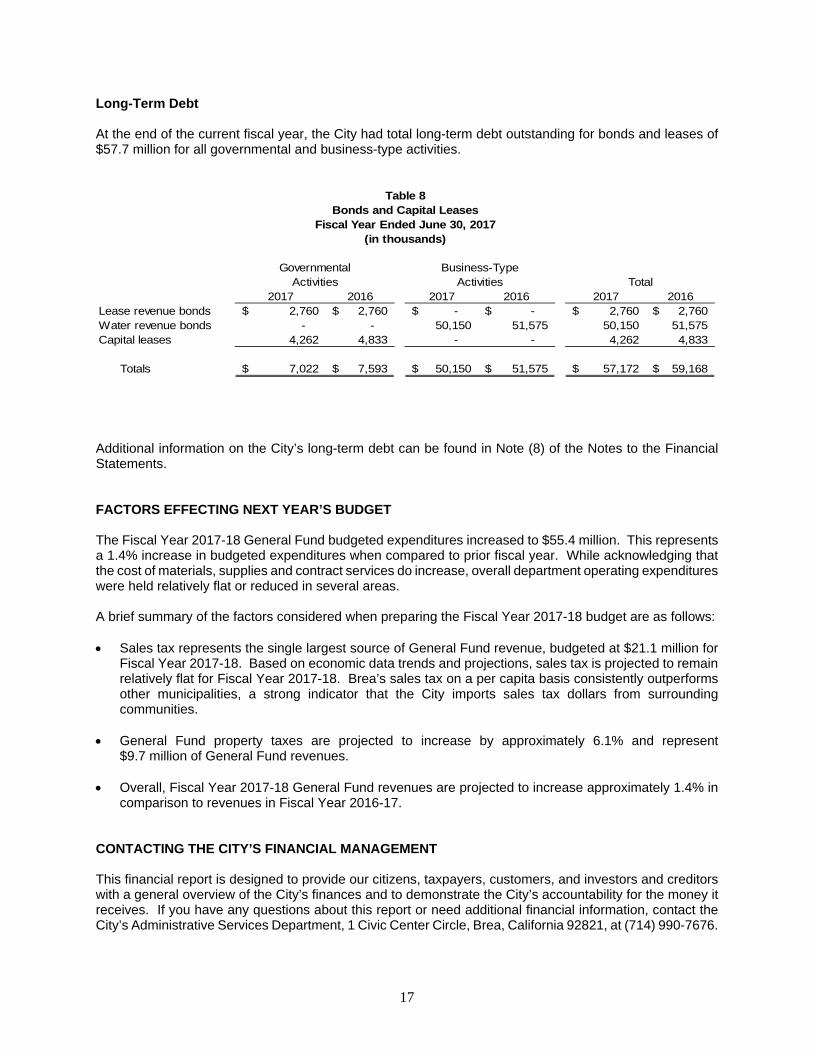
Long-Term Debt At the end of the current fiscal year, the City had total long-term debt outstanding for bonds and leases of $57.7 million for all governmental and business-type activities.
2017 2016 2017 2016 2017 2016Lease revenue bonds 2,760$ 2,760$ -$ -$ 2,760$ 2,760$ Water revenue bonds - - 50,150 51,575 50,150 51,575 Capital leases 4,262 4,833 - - 4,262 4,833
Totals 7,022$ 7,593$ 50,150$ 51,575$ 57,172$ 59,168$
Business-TypeActivities Total
Table 8
Fiscal Year Ended June 30, 2017(in thousands)
GovernmentalActivities
Bonds and Capital Leases
Additional information on the City’s long-term debt can be found in Note (8) of the Notes to the Financial Statements. FACTORS EFFECTING NEXT YEAR’S BUDGET The Fiscal Year 2017-18 General Fund budgeted expenditures increased to $55.4 million. This represents a 1.4% increase in budgeted expenditures when compared to prior fiscal year. While acknowledging that the cost of materials, supplies and contract services do increase, overall department operating expenditures were held relatively flat or reduced in several areas. A brief summary of the factors considered when preparing the Fiscal Year 2017-18 budget are as follows: Sales tax represents the single largest source of General Fund revenue, budgeted at $21.1 million for
Fiscal Year 2017-18. Based on economic data trends and projections, sales tax is projected to remain relatively flat for Fiscal Year 2017-18. Brea’s sales tax on a per capita basis consistently outperforms other municipalities, a strong indicator that the City imports sales tax dollars from surrounding communities.
General Fund property taxes are projected to increase by approximately 6.1% and represent $9.7 million of General Fund revenues.
Overall, Fiscal Year 2017-18 General Fund revenues are projected to increase approximately 1.4% in comparison to revenues in Fiscal Year 2016-17.
CONTACTING THE CITY’S FINANCIAL MANAGEMENT This financial report is designed to provide our citizens, taxpayers, customers, and investors and creditors with a general overview of the City’s finances and to demonstrate the City’s accountability for the money it receives. If you have any questions about this report or need additional financial information, contact the City’s Administrative Services Department, 1 Civic Center Circle, Brea, California 92821, at (714) 990-7676.

18
This page intentionally left blank.

BASIC FINANCIAL STATEMENTS

This page intentionally left blank.

CITY OF BREA, CALIFORNIA
STATEMENT OF NET POSITION JUNE 30, 2017
See accompanying notes to basic financial statements.
19
Governmental Business-typeActivities Activities Total
Assets:Current Assets:
Cash and investments 62,675,000$ 10,899,089$ 73,574,089$ Prepaid expense 38,956 2,500,836 2,539,792 Receivables:
Taxes 172,238 - 172,238 Accounts 877,556 4,606,544 5,484,100 Accrued Interest 1,783,516 - 1,783,516 Notes and loans 18,808,469 - 18,808,469
Internal balances 1,718,993 (1,718,993) - Due from other governments 10,701,356 22,784 10,724,140 Due from Successor Agency 115,637 - 115,637
Total Current Assets 96,891,721 16,310,260 113,201,981 Noncurrent assets: Restricted assets:
Cash and investments 6,947,905 - 6,947,905 Cash with fiscal agent 2,008,092 5,641,012 7,649,104
Capital assets not being depreciated 59,596,087 34,449,960 94,046,047 Capital assets, net of depreciation 117,974,257 58,818,122 176,792,379
Equity in California Domestic Water Company - 11,528,829 11,528,829
Total Noncurrent Assets 186,526,341 110,437,923 296,964,264
Total Assets 283,418,062 126,748,183 410,166,245
Deferred Outflows of Resources: Deferred charge on refunding - 655,216 655,216 Deferred amounts related to pensions 19,606,493 1,900,782 21,507,275
Total Deferred Outflows of Resources 19,606,493 2,555,998 22,162,491
Liabilities:Current liabilities: Accounts payable 5,834,330 754,142 6,588,472 Accrued liabilities 1,616,798 195,727 1,812,525 Accrued interest 94,441 1,380,954 1,475,395 Unearned revenue 1,340,046 - 1,340,046 Deposits payable 343,303 249,430 592,733 Due to other governments 2,408,815 - 2,408,815 Due to Successor Agency 170,568 - 170,568
Long-term liabilities, due within one year 4,319,922 1,238,796 5,558,718
Total Current Liabilities 16,128,223 3,819,049 19,947,272 Noncurrent liabilities:
Long-term liabilities, due in more than one year 9,815,564 50,857,868 60,673,432 Net OPEB obligation 6,742,813 - 6,742,813 Net pension liability 100,292,830 11,323,304 111,616,134
Total Noncurrent Liabilities 116,851,207 62,181,172 179,032,379
Total Liabilities 132,979,430 66,000,221 198,979,651 Deferred Inflows of Resources: Deferred amounts related to pensions 3,783,956 1,178,328 4,962,284
Net Position:
Net investment in capital assets 170,548,467 42,091,695 212,640,162 Restricted for:
Affordable housing 23,122,161 - 23,122,161 Public safety 909,075 - 909,075 Public works 4,629,380 - 4,629,380 Capital projects 17,055,790 - 17,055,790 Pension 6,854,304 - 6,854,304 Debt service 296,368 5,641,012 5,937,380
Unrestricted (57,154,376) 14,392,925 (42,761,451)
Total Net Position 166,261,169$ 62,125,632$ 228,386,801$
Primary Government

CITY OF BREA, CALIFORNIA
STATEMENT OF ACTIVITIES YEAR ENDED JUNE 30, 2017
See accompanying notes to basic financial statements.
20
Operating CapitalCharges for Grants and Grants and
Functions/Programs Expenses Services Contributions ContributionsGovernmental activities:
General government 7,758,276$ 1,605,816$ 1,062,680$ -$ Public safety 33,938,469 1,297,025 415,154 - Community development 3,403,082 2,151,955 174,690 265,749 Community services 7,598,666 2,818,718 138,728 - Public works 16,306,542 1,610,889 841,466 5,402,736 Interest on long-term debt 414,974 - - -
Total governmental activities 69,420,009 9,484,403 2,632,718 5,668,485
Business-type activities:Urban runoff 376,623 412,086 - - Water utility 14,882,443 20,098,490 491,011 - Sewer utility 1,630,319 2,322,756 - - Sanitation 3,045,308 3,584,153 34,154 - Information technology external support 1,724,116 1,959,634 - -
Total business-type activities 21,658,809 28,377,119 525,165 -
Total primary government 91,078,818$ 37,861,522$ 3,157,883$ 5,668,485$
General revenues:Taxes:
Property taxes - general purposesProperty taxes - paramedic programTransient occupancy taxSales taxesFranchise taxBusiness licenses taxesOther taxes
Motor vehicle in lieu - unrestrictedUse of money and propertyRental IncomeOtherGain (loss) on disposal of capital assets
Total General RevenuesTransfers
Change in net positionNet Position at Beginning of Year
Restatement of Net Position
Net Position at End of Year
Program Revenues

See accompanying notes to basic financial statements.
21
Governmental Business-typeActivities Activities
(5,089,780)$ -$ (5,089,780)$ (32,226,290) - (32,226,290)
(810,688) - (810,688) (4,641,220) - (4,641,220) (8,451,451) - (8,451,451)
(414,974) - (414,974)
(51,634,403) - (51,634,403)
- 35,463 35,463 - 5,707,058 5,707,058 - 692,437 692,437 - 572,999 572,999 - 235,518 235,518
- 7,243,475 7,243,475
(51,634,403) 7,243,475 (44,390,928)
14,195,847 - 14,195,847 3,692,137 - 3,692,137 1,716,180 - 1,716,180
21,200,598 - 21,200,598 1,680,293 - 1,680,293 1,078,509 - 1,078,509
392,075 - 392,075 75,398 - 75,398
1,110,886 (23,077) 1,087,809 1,031,756 - 1,031,756 8,693,445 138,132 8,831,577
(1,731) 112,137 110,406 54,865,393 227,192 55,092,585
1,125,415 (1,125,415) - 4,356,405 6,345,252 10,701,657
161,904,764 51,977,823 213,882,587
- 3,802,557 3,802,557
166,261,169$ 62,125,632$ 228,386,801$
Net (Expense) Revenue and Changes in Net Position
Total

22
This page intentionally left blank.

23
GOVERNMENTAL FUNDS
MAJOR GOVERNMENTAL FUNDS GENERAL FUND The General fund is used to account for fiscal resources which are dedicated to governmental operations of the City, and not required to be accounted for in another fund. HOUSING SUCCESSOR FUND The Housing Successor Fund is used to account for revenues received and expenditures made for affordable housing. The primary sources of revenue are from loan repayments generated from the use of the former Brea Redevelopment Agency’s Low and Moderate Income Housing Funds. CAPITAL PROJECTS FUNDS – CAPITAL IMPROVEMENTS The Capital Improvements Fund is used to account for the costs of constructing street improvements, parks and other public improvements not normally included within the other Capital Projects Funds. Financing is provided by Federal and State Grant Revenues and interfund transfers from the Special Revenue Funds and General Fund.
NON-MAJOR GOVERNMENTAL FUNDS Non-major governmental funds are those governmental funds which do not meet the criteria of a major fund. For reporting purposes in this section, they are combined together as Non-major Governmental Funds.

CITY OF BREA, CALIFORNIA
BALANCE SHEET GOVERNMENTAL FUNDS
JUNE 30, 2017
See accompanying notes to basic financial statements.
24
Special Capital
Revenue Fund Projects Fund
Housing CapitalGeneral Successor Improvements
Assets: Cash and investments 25,418,375$ 2,956,060$ 13,792,112$ Prepaid costs 38,956 - Receivables:
Taxes 152,337 - - Accounts 849,107 12,375 7,045 Interest 298,871 1,484,645 - Notes and loans - 16,961,728 -
Due from other funds 439,894 - - Due from other governments 4,777,485 - 5,732,128 Due from Successor Agency 26,595 - 89,042 Advances to other funds 373,703 - - Restricted assets:
Cash and investments 6,827,659 - 120,246 Cash and investments with fiscal agents 296,368 1,711,724 -
Total assets 39,499,350$ 23,126,532$ 19,740,573$
Liabilities, deferred inflows of resources,and fund balances:Liabilities: Account payable 1,002,999$ 7,195$ 4,498,816$ Accrued liabilities 1,523,992 5,356 20,055 Unearned revenues 1,160,080 - 179,966 Deposits payable 342,386 917 - Due to other governments 774,765 - - Advances from other funds - - 443,788 Due to Successor Agency 2,253 - -
Total liabilities 4,806,475 13,468 5,142,625
Deferred Inflows of Resources: Unavailable revenues 684,789 2,450,200 5,592,439
Fund balances (deficit): Nonspendable 412,659 - - Restricted 8,201,746 20,662,864 9,005,509 Assigned 11,316,072 - - Unassigned 14,077,609 - - Total fund balances 34,008,086 20,662,864 9,005,509
Total liabilities, deferred inflows of resources and fund balances 39,499,350$ 23,126,532$ 19,740,573$

See accompanying notes to basic financial statements.
25
Non-major TotalGovernmental Governmental
Funds Funds
14,202,200$ 56,368,747$ - 38,956
19,901 172,238 1,217 869,744
- 1,783,516 1,846,741 18,808,469
- 439,894 191,743 10,701,356
- 115,637 443,788 817,491
- 6,947,905 - 2,008,092
16,705,590$ 99,072,045$
61,323$ 5,570,333$ 11,635 1,561,038
- 1,340,046 - 343,303
1,634,050 2,408,815 18,203 461,991
- 2,253
1,725,211 11,687,779
2,692 8,730,120
- 412,659 14,996,959 52,867,078
- 11,316,072 (19,272) 14,058,337
14,977,687 78,654,146$
16,705,590$ 99,072,045$

26
This page intentionally left blank.

CITY OF BREA, CALIFORNIA
RECONCILIATION OF THE GOVERNMENTAL FUNDS BALANCE SHEET
TO THE STATEMENT OF NET POSITION JUNE 30, 2017
See accompanying notes to basic financial statements.
27
Fund balances of governmental funds $ 78,654,146
Amounts reported for governmental activities in the statement of net position are different because:
Capital assets, net of depreciation, have not been included as financial resources in governmental fund activity. Those capital assets consist of:
Capital assets, depreciable and nondepreciable $ 291,217,295 Accumulated depreciation (119,190,098) 172,027,197
Long-term liabilities are not due and payable in the current period and, therefore, are not reported in governmental funds. Those long term liabilities consist of:
Lease revenue bonds (2,760,000)Capital leases payable (4,261,876)Compensated absences (2,523,701)Other post employment benefits (OPEB) obligation (6,742,813) (16,288,390)
Accrued interest payable for the current portion of interest due on bonds does not (91,843)require the use of current financial resources and therefore has not been reported in the governmental funds.
Amounts reported for net pension liability are not due in the current period and therefore are not reported in the governmental funds. Related components that will affect the net pension liability in future measurement years are reported as deferred outflows and deferred inflows of resources and are not reported in the governmental funds.
Net pension liability (97,349,980)Deferred outflows of resources related to pensions 19,033,985 Deferred inflows of resources related to pensions (3,541,132) (81,857,127)
Revenues reported as unavailable revenues in the governmental funds do not provide current financial resources but are recognized in the in the statement of activities. 8,730,120
Internal Service Funds are used by management to charge the costs of certain activitiesto individual funds. The assets, deferred outflows and inflows of resources, and liabilities of the internal service funds are included in governmental activities in the statement of net position. 5,087,066
Net Position of Governmental Activities 166,261,169$

CITY OF BREA, CALIFORNIA
STATEMENT OF REVENUES, EXPENDITURES AND CHANGES IN FUND BALANCES
GOVERNMENTAL FUNDS FOR THE YEAR ENDED JUNE 30, 2017
See accompanying notes to basic financial statements.
28
Special Revenue Fund
Capital Projects Fund
Housing Capital General Successor Improvements
Revenues: Taxes 38,308,747$ -$ -$ Licenses and permits 870,940 - - Intergovernmental 7,808,780 - 533,669 Charges for services 3,789,430 - 1,521,150 Investment income, net 768,370 322,507 8,186 Fines and forfeitures 554,708 - - Developer contributions - - 535 Rental income 1,441,527 - - Other revenues 3,440,937 1,867,260 14,303
Total revenues 56,983,439 2,189,767 2,077,843
Expenditures: Current: General government 5,032,816 - 561,790 Public safety 34,011,330 - - Community development 3,009,011 277,504 - Community services 7,395,363 - - Public works 5,537,040 - - Capital outlay 403,524 - 14,404,865 Debt service: Principal 410,411 - - Interest and fiscal charges 397,243 - -
Total expenditures 56,196,738 277,504 14,966,655
Excess (deficiency) of revenues over (under) expenditures 786,701 1,912,263 (12,888,812)
Other financing sources (uses): Transfers in 2,207,848 - 7,874,546 Transfers out (5,887,391) - -
Total other financing sources (uses) (3,679,543) - 7,874,546
Net change in fund balances (2,892,842) 1,912,263 (5,014,266)
Fund balances, beginning of year 36,900,928 18,750,601 14,019,775
Fund balances, end of year 34,008,086$ 20,662,864$ 9,005,509$

See accompanying notes to basic financial statements.
29
Non-major TotalGovernmental Governmental
Funds Funds
1,907,227$ 40,215,974$ - 870,940
1,163,819 9,506,268 878,367 6,188,947
1,751 1,100,814 42,768 597,476
- 535 - 1,441,527
140,316 5,462,816
4,134,248 65,385,297
50,612 5,645,218 366,238 34,377,568 184,080 3,470,595
- 7,395,363 240,964 5,778,004
- 14,808,389
- 410,411 - 397,243
841,894 72,282,791
3,292,354 (6,897,494)
- 10,082,394 (2,646,478) (8,533,869)
(2,646,478) 1,548,525
645,876 (5,348,969)
14,331,811 84,003,115
14,977,687$ 78,654,146$

CITY OF BREA, CALIFORNIA
RECONCILIATION OF THE STATEMENT OF REVENUES, EXPENDITURES AND CHANGES IN FUND BALANCES OF GOVERNMENTAL FUNDS
TO THE STATEMENT OF ACTIVITIES FOR THE YEAR ENDED JUNE 30, 2017
See accompanying notes to basic financial statements.
30
Net change in fund balances - total governmental funds $ (5,348,969)
Amounts reported for governmental activities in the statement of activities are different because:
Governmental funds report capital outlays as expenditures. However, in the statement ofactivities, the costs of those assets are allocated over their estimated useful lives as depreciation expenses. Additionally, certain capital contributions are only reported as revenues on the government wide statement of activities.
Capital outlay $ 9,468,649 Depreciation (7,017,463)Capital contributions 2,408,747 4,859,933
The issuance of long-term debt (e.g., bonds, leases) provides current resources togovernmental funds, while the repayment of long-term debt principal is an expenditurein the governmental funds; The issuance of debt increases long-term liabilities and therepayment reduces long-term liabilities in the statement of net position. Also, governmental funds report the effect of premiums, discounts when debt is first issued, whereas these amounts are amortized in the statement of activities.
Capital leases principal payments 242,096
Some expenses reported in the statement of activities do no require the use ofcurrent financial resources, and therefore, are not reported as expenditures in the governmental funds. These expenses consists of the following:
Changes in interest payable for long-term liabilities 2,593 Changes in compensated absences (75,834)Changes in OPEB obligations (1,090,211)Changes in net pension liabilities and related deferred outflows and inflows of resources 1,154,288
Revenues in the statement of activities that do not provide current financial resourcesare not reported in the governmental funds. 4,863,659
Internal service funds are used by management to charge the costs of certain activities,such as equipment management and self-insurance, to individual funds. The net revenues(expenses) of the internal service funds is reported with governmental activities. (251,150)
Change in net position of governmental activities 4,356,405$

31
PROPRIETARY FUNDS
MAJOR ENTERPRISE FUNDS WATER UTILITY FUND The Water Utility Fund is a Major Fund used to account for the operations of the City’s water utility, which are operated in manner similar to a private enterprise. The costs (expenses, including depreciation) of providing these services to the general public on a continuing basis are financed or recovered primarily through user charges. SEWER UTILITY FUND The Sewer Utility Fund is a Major Fund used to account for the operations of the City’s sewer distribution lines, which are operated in a manner similar to a private enterprise. The costs (expenses, including depreciation) of providing these services to the general public on a continuing basis are financed or recovered primarily through user charges.
NON-MAJOR ENTERPRISE FUNDS Non-major proprietary funds are those proprietary funds which do not meet the criteria of a major fund. For reporting purposes in this section, they are combined together as Non-major Enterprise Funds.
GOVERNMENTAL ACTIVITIES INTERNAL SERVICES FUNDS The Internal Service Funds are used to allocate the cost of providing goods and services by one department to other department on a cost reimbursement basis.

CITY OF BREA, CALIFORNIA
STATEMENT OF NET POSITION PROPRIETARY FUNDS
JUNE 30, 2017
See accompanying notes to basic financial statements.
32
Governmental Non-major ActivitiesEnterprise Internal
Water Utility Sewer Utility Funds Total Service Funds
Current assets:Cash and investments 6,879,710$ 2,815,352$ 1,204,027$ 10,899,089$ 6,306,253$ Prepaid Expenses 2,500,836 - - 2,500,836 - Receivables: Accounts receivable 3,191,260 412,201 1,003,083 4,606,544 7,812 Due from other governments - - 22,784 22,784 -
Total current assets 12,571,806 3,227,553 2,229,894 18,029,253 6,314,065
Noncurrent assets:Restricted - Cash and investments with fiscal agent 5,641,012 - - 5,641,012 - Capital assets - net of accumulated depreciation 79,236,745 14,029,072 2,265 93,268,082 5,543,147 Equity in California Domestic Water Company 11,528,829 - - 11,528,829 - Advances to other funds - - - - 866,119
Total noncurrent assets 96,406,586 14,029,072 2,265 110,437,923 6,409,266
Total assets 108,978,392 17,256,625 2,232,159 128,467,176 12,723,331
Deferred charge on refunding 655,216 - - 655,216 - Deferred pension related items 796,134 310,641 794,007 1,900,782 572,508
Total deferred outflows of resources 1,451,350 310,641 794,007 2,555,998 572,508
Current liabilities:Accounts payable 532,613 5,382 216,147 754,142 263,997 Accrued liabilities 82,694 30,718 82,315 195,727 55,760 Accrued interest 1,380,954 - - 1,380,954 2,598 Deposits payable 249,430 - - 249,430 - Due to other funds - - 439,894 439,894 - Compensated absences, due within one year 78,086 28,899 91,811 198,796 69,539 Claims and judgments, due within one year - - - - 1,753,904 Bonds, notes, and capital leases, due within one year 1,040,000 - - 1,040,000 168,315
Total current liabilities 3,363,777 64,999 830,167 4,258,943 2,314,113
Non-current liabilities:Advances from other funds 1,221,619 - - 1,221,619 - Compensated absences, due in more than one year 26,029 9,633 30,604 66,265 23,180 Claims and judgments, due in more than one year - - - - 2,743,287 Net pension liability 4,539,352 2,123,684 4,660,268 11,323,304 2,942,850 Bonds, notes, and capital leases, due in more than one year 50,791,603 - - 50,791,603 -
Total noncurrent liabilities 56,578,603 2,133,317 4,690,872 63,402,791 5,709,317 Total liabilities 59,942,380 2,198,316 5,521,038 67,661,734 8,023,429
Deferred pension related items 450,893 281,362 446,073 1,178,328 242,824
Net position (deficit):Net investment in capital assets 28,060,358 14,029,072 2,265 42,091,695 5,543,147 Restricted for debt service 5,641,012 - - 5,641,012 - Unrestricted 16,335,099 1,058,516 (2,943,210) 14,450,405 (513,561)
Total net position (deficit) 50,036,469$ 15,087,588$ (2,940,945)$ 62,183,112$ 5,029,586$
Reconciliation of Net Position to the Statement of Net Position
62,183,112
(65,717)
8,237 Net Position per Statement of Net Position 62,125,632$
service activities related to enterprise funds
Net Position per Statement of Net Position - Proprietary FundsPrior years' accumulated adjustment to reflect the consolidation of
internal service funds activities related to the enterprise fundsCurrent years' adjustments to reflect the consolidation of internal
Deferred inflows of resources
Enterprise Funds
Assets:
Deferred outflows of resources:
Liabilities:

CITY OF BREA, CALIFORNIA
STATEMENT OF REVENUES, EXPENSES, AND CHANGES IN NET POSITION
PROPRIETARY FUNDS FOR THE YEAR ENDED JUNE 30, 2017
See accompanying notes to basic financial statements.
33
Governmental Non-major ActivitiesEnterprise Internal
Water Utility Sewer Utility Funds Total Service FundsOperating revenues:
Charges for services 18,788,632$ 2,209,586$ 5,063,181$ 26,061,399$ 7,673,619$ Connection fees 903,674 55,516 - 959,190 - Other revenues 406,184 57,654 892,692 1,356,530 576,208
Total operating revenues 20,098,490 2,322,756 5,955,873 28,377,119 8,249,827 Operating expenses:
Personnel services 2,942,564 967,487 2,304,226 6,214,277 1,497,751 Maintenance and operation 1,528,589 232,686 2,842,989 4,604,264 3,817,328 Cost of purchased water 5,394,508 - - 5,394,508 - Claims and judgements - - - - 1,935,696 Depreciation expense 2,163,100 431,188 938 2,595,226 791,827 Total operating expenses 12,028,761 1,631,361 5,148,153 18,808,275 8,042,602 Operating income 8,069,729 691,395 807,720 9,568,844 207,225
Nonoperating revenues (expenses):Federal interest subsidy on debt 491,011 - - 491,011 - Intergovernmental revenues - - 34,154 34,154 - Interest expense (2,872,884) (7,565) (1,399) (2,881,848) (20,324) Change in equity of California Domestic Water Company 138,132 - - 138,132 - Gain (loss) on disposal of capital assets 109,758 2,379 - 112,137 (6,704)
Total nonoperating revenues (expenses) (2,133,983) (5,186) 32,755 (2,106,414) (27,028) Income before transfers 5,935,746 686,209 840,475 7,462,430 180,197
Transfers:Transfers in - - - - 88,882 Transfers out (497,975) (104,900) (522,540) (1,125,415) (511,992)
Total transfers (497,975) (104,900) (522,540) (1,125,415) (423,110) Change in net position 5,437,771 581,309 317,935 6,337,015 (242,913)
Net position (deficit):Net position at beginning of year 40,796,141 14,506,279 (3,258,880) 52,043,540 5,272,499 Restatement of net position 3,802,557 - - 3,802,557 - Net position (deficit) at beginning of year, as restated 44,598,698 14,506,279 (3,258,880) 55,846,097 5,272,499
Net position (deficit) at end of year 50,036,469$ 15,087,588$ (2,940,945)$ 62,183,112$ 5,029,586$
Reconciliation of Changes in Net Position to the Statement of Activities:
Changes in Net Position, per the Statement of Revenues, Expense and Changes in Fund Net Position - Proprietary Funds 6,337,015$
Adjustment to reflect the consolidation of current fiscal year internal service funds activities related to enterprise funds 8,237 Changes in Net Position of Business-Type Activities per Statement of Activities 6,345,252$
Enterprise Funds

CITY OF BREA, CALIFORNIA
STATEMENT OF CASH FLOWS PROPRIETARY FUNDS
FOR THE YEAR ENDED JUNE 30, 2017
See accompanying notes to basic financial statements.
34
Governmental Non-major ActivitiesEnterprise Internal
Water Utility Sewer Utility Funds Total Service FundsCash flows from operating activities:
Cash received from customers and users 19,899,739$ 2,259,924$ 5,961,358$ 28,121,021$ 8,457,595$ Cash payments to suppliers for goods and services (13,469,991) (266,583) (5,137,705) (18,874,279) (5,546,229) Cash payments to employees for services (46,018) (997,095) (144,834) (1,187,947) (1,962,265)
Net cash provided by operating activities 6,383,730 996,246 678,819 8,058,795 949,101
Cash flows from noncapital financing activities:Cash transfer out (497,975) (104,900) (522,540) (1,125,415) (511,992) Cash transfer in - - - - 88,882 Advances received (repaid) from (to) other funds (810,554) - - (810,554) 574,677 Intergovernmental revenues - - 34,154 34,154 - Federal interest subsidy on debt 491,011 - - 491,011 -
Net cash provided by (used for) noncapital financing activities (817,518) (104,900) (488,386) (1,410,804) 151,567
Cash Flows from capital and related financing activities:Acquisition and construction of capital assets (2,163,953) - - (2,163,953) (475,823) Proceeds from sale of capital assets 109,758 2,379 - 112,137 53,059 Principal and interest paid on long-term debt (4,244,160) - - (4,244,160) (182,483)
Net cash provided by (used for) capital and related financing activities (6,298,355) 2,379 - (6,295,976) (605,247)
Cash flows from investing activities:Interest received 14,113 (7,565) (1,399) 5,149 (1,106)
Net Increase (decrease) in cash and cash equivalents (718,030) 886,160 189,034 357,164 494,315
Cash and cash equivalents at beginning of year 13,238,752 1,929,192 1,014,993 16,182,937 5,811,938
Cash and cash equivalents at end of year 12,520,722$ 2,815,352$ 1,204,027$ 16,540,101$ 6,306,253$
Reconciliation of operating income (loss) to net cash provided by (used for) operating activities:
Operating income 8,069,729$ 691,395$ 807,720$ 9,568,844$ 207,225$ Adjustments to reconcile operating income to net cash provided by operating activities:
Depreciation 2,163,100 431,188 938 2,595,226 791,827 (Increase) decrease in accounts receivable (198,751) (62,832) (331,622) (593,205) 5,896 (Increase) in prepaid expense (2,500,836) - - (2,500,836) -
- - 337,107 337,107 - Increase (decrease) in accounts payable (1,110,079) (33,897) 1,972 (1,142,004) (297,389) Increase (decrease) in accrued liabilities 318 (369) 7,538 7,487 711 Increase in deposit payables 6,585 - - 6,585 - Increase in claims and judgements - - - - 276,271 (Decrease) in due to other funds - - (90,273) (90,273) - Increase in compensated absences 26,426 (1,312) 21,658 46,772 15,514 (Decrease) in net pension liability (72,762) (27,927) (76,219) (176,908) (50,954)
Total adjustments (1,685,999) 304,851 (128,901) (1,510,049) 741,876
Net cash provided by operating activities 6,383,730$ 996,246$ 678,819$ 8,058,795$ 949,101$
Non-cash investing, capital, and financing activities:Amortization of bond discount and premium (56,776)$ -$ -$ (56,776)$ -$ Amortization of loss on refunding. 163,804 - - 163,804 - Change in equity of California Domestic Water Company 138,132 - - 138,132 -
Enterprise Funds
Decrease due from other governments

35
FIDUCIARY FUNDS AGENCY FUNDS Agency Funds, a type of Fiduciary Funds, are used to account for assets held by the City as an agent for other governmental entities, private organizations, or individuals. PRIVATE-PURPOSE TRUST FUND Private-Purpose Trust Funds, a type of Fiduciary Funds, is used to account for assets held by the City as Successor Agency of the former Brea Redevelopment Agency.

CITY OF BREA, CALIFORNIA
STATEMENT OF NET POSITION FIDUCIARY FUNDS
JUNE 30, 2017
See accompanying notes to basic financial statements.
36
Private-
Purpose Trust
Fund
SuccessorAgency Agency of theFunds Former RDA
Assets:Cash and investments 4,919,487$ 1,806,091$ Receivables: Taxes 9,007 - Accounts 17,659 - Accrued interest - 116,932 Deferred loans - 2,039,314 Due from other governments 19,065 426,000 Due from the City of Brea - 2,253 Land held for resale - 612,856 Prepaid insurance - 172,800 Restricted assets: Cash and investments with fiscal agents 1,466,381 28,580,065 Capital assets: Capital assets, net of accumulated depreciation 468,006 -
Total assets 6,899,605$ 33,756,311
Deferred outflows of resources:Deferred charges on refunding -$ 1,687,138
Liabilities:Accounts payable 278,191 43,336 Accrued liabilities 538,955 - Accrued interest - 2,530,603 Due to the City of Brea 9,936 115,637 Due to external parties/other agencies 6,072,523 - Long-term liabilities: Due in one year - 9,773,391 Due in more than one year - 155,904,055
Total liabilities 6,899,605$ 168,367,022
Net Position (deficit):Held in trust for other purposes (132,923,573)$

CITY OF BREA, CALIFORNIA
STATEMENT OF CHANGES IN FIDUCIARY NET POSITION FIDUCIARY FUNDS
FOR THE YEAR ENDED JUNE 30, 2017
See accompanying notes to basic financial statements.
37
Private-Purpose
Trust Fund
SuccessorAgency of theFormer RDA
Additions:Taxes 18,131,944$ Interest and changes in fair value of investments 153,280 Rental income 440,804 Sale of assets 8,199,676 Miscellaneous 87,563
Total additions 27,013,267
Deductions:Administrative expenses 407,186 Contractual services 26,891 Interest expense and cost of issuance 7,874,889 Payment to the County of Orange 8,366,581 Payments to the City of Brea 4,121,754 Pass through agreement payments 1,575,641 Project expenses 157,762
Total deductions 22,530,704
Changes in net position 4,482,563
Net position (deficit):Trust deficit, beginning of the year (137,406,136)
Trust deficit, end of the year (132,923,573)$

38
This page intentionally left blank.

CITY OF BREA, CALIFORNIA
NOTES TO BASIC FINANCIAL STATEMENTS JUNE 30, 2017
39
NOTE 1 – SUMMARY OF SIGNIFICANT ACCOUNTING POLICIES The financial statements of the City of Brea, California (City) have been prepared in conformity with generally accepted accounting principles (GAAP) as applied to government units. The Governmental Accounting Standards Board (GASB) is the accepted standard-setting body for establishing governmental accounting and financial reporting principles. The significant accounting policies of the City of Brea are described below.
a. Description of the Reporting Entity
The City of Brea was incorporated on February 23, 1917, under the general laws of the State of California. The City operates under the Council-Manager form of government and provides the following services: public safety (police and fire), highways and streets, cultural recreation, public improvements, planning and zoning, and general administrative services.
The accounting policies of the City conform to accounting principles generally accepted in the United States of America as applicable to governments.
As required by accounting principles generally accepted in the United States of America, these financial statements present the City of Brea and its component units, entities for which the City is considered to be financially accountable. The City is considered to be financially accountable for an organization if the City appoints a voting majority of that organization's governing body and the City is able to impose its will on that organization, or there is a potential for that organization to provide specific financial benefits to or impose specific financial burdens on the City. The City is also considered to be financially accountable for an organization if that organization is fiscally dependent (i.e., it is unable to adopt its budget, levy taxes, set rates or charges, or issue bonded debt without approval from the City). In certain cases, other organizations are included as component units if the nature and significance of their relationship with the City are such that their exclusion would cause the City's financial statements to be misleading or incomplete. Based upon the above criteria, the component units of the City are the Brea Public Financing Authority, the Brea Community Benefit Financing Authority and the Midbury Assessment Authority.
Since City Council serves as the governing board for these component units, all of the City's component units are considered to be blended component units. Blended component units, although legally separate entities, are in substance, part of the City's operations, so data from these units is combined therein. A brief description of each component unit follows:
Brea Public Financing Authority The Brea Public Financing Authority was created by a joint exercise of powers agreement between the City of Brea and the former Redevelopment Agency of the City of Brea on November 17, 1987. In April 1988, the Brea-Olinda Unified School District became an associate member of the Authority. The purpose of the Brea Public Financing Authority is to provide, through the issuance of debt, financing necessary for various capital improvements. The Brea Public Financing Authority is administered by the Board who are the members of the City Council and the Mayor. The Brea Public Financing Authority's primary source of income is installment sale, loan and lease payments received from the City and the Successor Agency to the former Brea Redevelopment Agency, which will be used to meet the debt service requirements on debt issues. The Brea Public Financing Authority does not have taxing power. Separate financial statements are not prepared for the Brea Public Financing Authority.

CITY OF BREA, CALIFORNIA
NOTES TO BASIC FINANCIAL STATEMENTS JUNE 30, 2017
40
NOTE 1 – SUMMARY OF SIGNIFICANT ACCOUNTING POLICIES (CONTINUED) a. Description of the Reporting Entity (Continued)
Brea Community Benefit Financing Authority The Brea Community Benefit Financing Authority was created by a joint exercise of powers agreement between the City of Brea and the Industrial Development Authority of the City of Brea on July 22, 2014. The purpose of the Brea Community Benefit Financing Authority is to provide, though the issuance of debt, financing for various capital improvements. The Brea Community Benefit Financing Authority is administered by the Board who are the members of the City Council and the Mayor. The Brea Community Benefit Financing Authority’s primary source of income is installment sale, loan, and lease payments from the City, which will be used to meet the debt service requirements on debt issues. Separate financial statements are not prepared for the Brea Community Benefit Financing Authority.
Midbury Assessment Authority The Midbury Assessment Authority was created by a joint exercise of powers agreement between the City of Brea, Los Angeles County, and Orange County on May 18, 1999. The purpose of the authority is to provide a means for each party to the agreement to contribute money to street improvement projects, to form an assessment district and to levy an assessment to finance the balance of the projects. The Authority is administered by the Board who are the members of the City Council and the Mayor. The Authority’s primary source of income is from new assessments that result in additional taxes. Separate financial statements are not prepared for the Midbury Assessment Authority.
b. Government-Wide and Fund Financial Statements
The government-wide financial statements (i.e., the statement of net position and the statement of activities) report information on all of the nonfiduciary activities of the primary government and its component units. For the most part, the effect of interfund activity has been removed from these statements. Governmental activities, which normally are supported by taxes and intergovernmental revenues, are reported separately from business-type activities, which rely to a significant extent on fees and charges for support. Fiduciary activities of the City are not included in these statements. The statement of activities demonstrates the degree to which the direct expenses of a given function or segment is offset by program revenues. Direct expenses are those that are clearly identifiable with a specific function or segment. Program revenues include: 1) charges to customers or applicants who purchase, use or directly benefit from goods, services or privileges provided by a given function or segment, and 2) grants and contributions that are restricted to meeting the operational or capital requirements of a particular function or segment. Taxes and other items not properly included among program revenues are reported instead as general revenues.
Separate financial statements are provided for governmental funds, proprietary funds and fiduciary funds, even though the latter are excluded from the government-wide financial statements. Major individual governmental funds and major individual enterprise funds are reported as separate columns in the fund financial statements.

CITY OF BREA, CALIFORNIA
NOTES TO BASIC FINANCIAL STATEMENTS JUNE 30, 2017
41
NOTE 1 – SUMMARY OF SIGNIFICANT ACCOUNTING POLICIES (CONTINUED)
c. Measurement Focus, Basis of Accounting and Financial Statement Presentation
The government-wide financial statements are reported using the economic resources measurement focus and the accrual basis of accounting, as are the proprietary fund financial statements. Revenues are recorded when earned and expenses are recorded when a liability is incurred, regardless of the timing of related cash flows. Property taxes are recognized as revenues in the year for which they are levied. Grants and similar items are recognized as revenue as soon as all eligibility requirements imposed by the provider have been met.
The fund financial statements provide information about the government’s funds, including its fiduciary funds and blended component units. Separate statements for each fund category – governmental, proprietary, and fiduciary – are presented.
Governmental fund financial statements are reported using the current financial resources measurement focus and the modified accrual basis of accounting. Revenues are recognized as soon as they are both measurable and available. Revenues are considered to be available when they are collectible within the current period or soon enough thereafter to pay liabilities of the current period. For this purpose, the government considers revenues to be available if they are collected within 60 days of the end of the current fiscal period, with the exception of sales tax revenue, which are considered available if collected within 90 days of year end. Expenditures generally are recorded when a liability is incurred, as under accrual accounting. However, debt service expenditures, as well as expenditures related to compensated absences and claims and judgments, are recorded only when payment is due.
Property taxes, franchise taxes, licenses and interest associated with the current fiscal period are all considered to be susceptible to accrual and so have been recognized as revenues of the current fiscal period. Only the portion of special assessments receivable due within the current fiscal period is considered to be susceptible to accrual as revenue of the current period. All other revenue items are considered to be measurable and available only when cash is received by the government. The City’s fiduciary funds consist of agency funds and a private purpose trust fund. Agency funds are custodial in nature (assets equal liabilities) and do not involve measurement of results of operations. Private purpose trust funds are accounted for using the “economic resources” measurement focus and the accrual basis of accounting. Under the accrual basis of accounting, revenues are recognized in the period in which they are earned while expenses are recognized in the period in which the liability is incurred.
The City reports the following major governmental funds:
The General Fund is the City's primary operating fund. It accounts for all general revenues of the City
not specifically levied or collected for other City funds, and for expenditures related to the rendering of general services by the City. The General Fund is used to account for all resources not required to be accounted for in another fund.
The Housing Successor Special Revenue Fund accounts for the housing assets as a result of the
dissolution of the former Brea Redevelopment Agency. Resources generated from these assets are to be used for low to moderate income housing purposes. The primary sources of revenue are from rental & lease of property owned by the former Brea Redevelopment Agency and loan repayments generated from the use of the former Brea Redevelopment Agency’s Low and Moderate Income Housing Funds.

CITY OF BREA, CALIFORNIA
NOTES TO BASIC FINANCIAL STATEMENTS JUNE 30, 2017
42
NOTE 1 – SUMMARY OF SIGNIFICANT ACCOUNTING POLICIES (CONTINUED)
c. Measurement Focus, Basis of Accounting and Financial Statement Presentation (Continued)
The Capital Improvements Capital Projects Fund accounts for the costs of constructing street improvements, parks and other public improvements not normally included within the other Capital Projects Funds. Financing is provided by federal, state and county grant revenues and interfund transfers from the General Fund, and Special Revenue Funds.
The City reports the following major proprietary funds:
The Water Utility Enterprise Fund accounts for the City’s water utility operations, which are financed
and operated in a manner similar to a private enterprise. The cost (expenses, including depreciation) of providing these services to the general public on a continuing basis is financed or recovered primarily through user charges.
The Sewer Utility Enterprise Fund accounts for the operations of the City’s sewer distribution lines,
which are operated in a manner similar to a private enterprise. The costs (expenses, including depreciation) of providing these services to the general public on a continuing basis are financed or recovered primarily through user charges.
Additionally, the City reports the following fund types:
Special Revenue Funds are used to account for the proceeds of specific revenue sources that are legally
restricted or committed to expenditures for specified purposes.
Debt Service Funds are used to account for the accumulation of resources for and payment of interest and principal on long-term debt.
Capital Projects Funds are used to account for financial resources used for the acquisition or
construction of major capital facilities (other than those financed by proprietary funds).
Internal Service Funds account for financial transactions related to repairs, replacement, and maintenance of City-owned buildings and vehicles and to account for the City's self-insurance programs. These services are provided to other departments or agencies of the City on a cost reimbursement basis.
Agency Funds account for assets held by the City in a custodial capacity as a trustee or as an agent.
These assets include deposits from assessment district’s property owners. Agency funds are custodial in nature (assets equal liabilities) and do not involve measurement of results of operations.
Private-Purpose Trust Fund accounts for the assets and liabilities of the former redevelopment agency and the allocated revenue to pay estimated installment payments of enforceable obligations until the obligations of the former redevelopment agency are paid in full and assets have been liquidated.

CITY OF BREA, CALIFORNIA
NOTES TO BASIC FINANCIAL STATEMENTS JUNE 30, 2017
43
NOTE 1 – SUMMARY OF SIGNIFICANT ACCOUNTING POLICIES (CONTINUED)
c. Measurement Focus, Basis of Accounting and Financial Statement Presentation (Continued)
As a general rule, the effect of interfund activity has been eliminated from the government-wide financial statements. Exceptions to this general rule are charges between the government’s proprietary funds function and various other functions of the government. Elimination of these charges would distort the direct costs and program revenues reported for the various functions concerned. Residual net position balances in internal service funds are allocated back to the governmental and enterprise funds that they originally charged. Amounts reported as program revenues include: 1) charges to customers or applicants for goods, services or privileges provided, 2) operating grants and contributions, and 3) capital grants and contributions, including special assessments. Internally dedicated resources are reported as general revenues rather than as program revenues. Likewise, general revenues include all taxes. Proprietary funds distinguish operating revenues and expenses from non-operating items. Operating revenues and expenses generally result from providing services and producing and delivering goods in connection with a proprietary fund's principal ongoing operations.
The principal operating revenues of the Enterprise Funds and of the Internal Service Funds are charges to customers for sales and services. Operating expenses for Enterprises Funds and Internal Service Funds include the cost of sales and services, administrative expenses and depreciation on capital assets. All revenues and expenses not meeting this definition are reported as non-operating revenues and expenses.
d. Assets, Deferred Outflows, Liabilities, Deferred Inflows, and Net Position Cash and Investments
Cash includes demand deposits, certificates of deposits and savings account balances. The California Government Code and the City of Brea's investment policy permit the City of Brea to invest in various instruments and pools. Investments are reported in the accompanying balance sheet at fair value, except for investment contracts that are reported at cost because they are not transferable and they have terms that are not affected by changes in market interest rates. The State Treasurer's Investment Pool operates in accordance with appropriate state laws and regulations. The reported value of the pool is the same as the fair value of the pool shares.
The City reports its investments at fair value in the balance sheet according to GASB Statement No. 31, Accounting and Financial Reporting for Certain Investments and for External Investment Pools. Interest earnings, realized gains and losses and, changes in the fair value of investments are recognized as revenue from the use of money and property in the operating statement. Highly liquid money market investments with maturities of one year or less at time of purchase are stated at amortized cost. All other investments are reported at fair value. Fair value is the price that would be received to sell an asset in an orderly transaction between market participants at the measurement date. The City pools cash and investments of all funds except for assets held by fiscal agents. Each fund's share in this pool is displayed in the accompanying financial statements as cash and investments. Investment income earned by the pooled investments is allocated to the various funds based on each fund's average cash and investment balance.

CITY OF BREA, CALIFORNIA
NOTES TO BASIC FINANCIAL STATEMENTS JUNE 30, 2017
44
NOTE 1 – SUMMARY OF SIGNIFICANT ACCOUNTING POLICIES (CONTINUED) d. Assets, Deferred Outflows, Liabilities, Deferred Inflows, and Net Position (Continued)
The City applies GASB Statement No. 72, Fair Value Measurements and Application for determining fair value measurements, applying fair value to investments, and disclosures related to the fair value hierarchy. The fair value hierarchy, which has three levels, is based on the valuation inputs used to measure fair value: Level 1 inputs are quoted prices in active markets for identical assets; Level 2 inputs are significant other observable inputs; Level 3 inputs are significant unobservable inputs. For purposes of the statement of cash flows, cash equivalents are defined as short-term, highly liquid investments that are both readily convertible to known amounts of cash or so near their maturity that they present insignificant risk of changes in value because of changes in interest rates. Cash equivalents also represent the proprietary funds' share in the cash and investment pool of the City of Brea. Cash equivalents have an original maturity date of three months or less from the date of purchase. For financial statement presentation purposes, cash and cash equivalents are shown as both restricted and unrestricted cash.
Restricted Cash and Investments
Certain proceeds of debt issues, as well as certain resources set aside for their repayment, are classified as restricted assets on the balance sheet because their use is limited by applicable bond covenants.
Additionally, the City has established the PARS Post-Employment Benefits Trust as a tax-exempt trust within the meaning of Section 115 of the IRS Code to accumulate resources to “stabilize” the amount of its General fund resources that it will need to meet future contributions requirements to CalPERS. The balances and activities of the Trust are irrevocably dedicated to funding future obligations to CalPERS. The assets will benefit the City through reduced future cash flow demands on the City’s General fund resources, and continue to be assets of the City. These amounts are reflected as restricted cash and investments in the General fund.
Receivables and Payables Activity between funds that are representative of lending/borrowing arrangements outstanding at the end of the fiscal year are referred to as either "due to/from other funds" (i.e., the current portion of interfund loans) or "advances to/from other funds" (i.e., the non-current portion of interfund loans). All other outstanding balances between funds are reported as "due to/from other funds.” Any residual balances outstanding between the governmental activities and business-type activities are reported in the government-wide financial statements as "internal balances."
The amounts recorded as a receivable due from other governments include sales taxes, property taxes and grant revenues collected or provided by federal, state, county and city governments and unremitted to the City as of June 30, 2017. The County of Orange assesses bills and collects property taxes for the City.
All trade and tax receivables are shown net of an allowance for uncollectibles.

CITY OF BREA, CALIFORNIA
NOTES TO BASIC FINANCIAL STATEMENTS JUNE 30, 2017
45
NOTE 1 – SUMMARY OF SIGNIFICANT ACCOUNTING POLICIES (CONTINUED)
d. Assets, Deferred Outflows, Liabilities, Deferred Inflows, and Net Position (Continued)
Prepaid Items Certain payments to vendors reflect costs applicable to future accounting periods and are recorded as prepaid items in both government-wide and fund financial statements. The Water Utility fund also reports a prepaid expense for water purchased in advance, to be used in future periods. Refer to note 4.
Inventories Inventories of materials and supplies are carried at cost. The City records inventory using a first-in-first-out (FIFO) basis and the consumption method. Land Held for Resale
The former Brea Redevelopment Agency acquired land as part of its primary purpose to develop blighted properties. The Successor Agency to the former Brea Redevelopment Agency records these parcels as land held for resale in its financial statements. The property is being carried at cost or, if lower, the estimated net realizable value upon entering into an agreement to sell the property. Values recorded on the balance sheet are net of allowances for decline in value.
Capital Assets Capital assets, which include property, plant, equipment, intangible assets and infrastructure assets (e.g., roads, bridges, sidewalks and similar items), are reported in the applicable governmental or business-type activities columns in the government-wide financial statements. Capital assets and infrastructure are defined by the City as assets with an initial, individual cost of more than $5,000 and $100,000 respectively and an estimated useful life in excess of four years. Such assets are recorded at historical cost or estimated historical cost if purchased or constructed. Donated capital assets are recorded at acquisition value at the date of donation.
The costs of normal maintenance and repairs that do not add to the value of the assets or materially extend assets lives are not capitalized.
Major outlays for capital assets and improvements are capitalized as projects are constructed. Interest incurred during the construction phase of capital assets of business-type activities is included as part of the capitalized value of the assets constructed. The amount of interest to be capitalized is calculated by offsetting interest expense incurred from the date of the borrowing until completion of the project with interest earned on invested proceeds over the same period.

CITY OF BREA, CALIFORNIA
NOTES TO BASIC FINANCIAL STATEMENTS JUNE 30, 2017
46
NOTE 1 – SUMMARY OF SIGNIFICANT ACCOUNTING POLICIES (CONTINUED)
d. Assets, Deferred Outflows, Liabilities, Deferred Inflows, and Net Position (Continued) Property, plant and equipment of the primary government and its component units are depreciated using the straight-line method over the following estimated useful lives:
Asset YearsBuildings 40 - 50Computers 4 - 5Equipment 4 - 10Improvements 10 - 50Infrastructure 40 - 50Software 5 - 10Vehicles 4 - 10
The City classifies certain water rights as intangible assets with an indefinite useful life as there are no legal, contractual or other factors that limit the benefits associated with the water rights.
Deferred Outflows/Inflows of Resources
In addition to assets, the statement of financial position will sometimes report a separate section for deferred outflows of resources. Deferred outflows of resources represents a consumption of net position that applies to a future period(s) and so will not be recognized as an outflow of resources (expense/ expenditure) until then. The City has two items that qualify for reporting in this category. One is deferred charges on refunding reported in the government-wide statement of net position and the proprietary funds statement of net position. Deferred charges on refunding results from the difference in the carrying value of refunded debt and its reacquisition price. This amount is deferred and amortized over the shorter of the life of the refunded or refunding debt. The other item is deferred pension related items reported in the government-wide statement of net position and the proprietary funds statement of net position. The City reports deferred outflows of resources for pension contributions made after the actuarial measurement date. This amount is deferred and will be expensed in the following fiscal year. Other deferred outflows of resources are reported for the net difference between projected and actual earning on pension plan investments. This amount will be amortized over a five-year period on a straight-line basis. In addition to liabilities, the balance sheet or statement of net position reports a separate section for deferred inflows of resources. Deferred inflows of resources represents an acquisition of net position that applies to a future period(s) and so will not be recognized as an inflow of resources (revenue) until that time. The City reports two items as deferred inflows of resources. First, unavailable revenues arise only under a modified accrual basis of accounting, and accordingly, is reported only in the governmental funds balance sheet. These amounts reflect resources that have been earned but not received within the period of availability. Therefore, this does not provide an available financial resource in the current period, and the recognition is deferred until these criteria have been met, as unavailable revenues. The other item is deferred pension related items reported in the government-wide statement of net position and the proprietary funds statement of net position. These amounts are the result of differences between expected and actual experience and changes in assumptions. These will be recognized as pension expense over the expected average remaining service lifetime.

CITY OF BREA, CALIFORNIA
NOTES TO BASIC FINANCIAL STATEMENTS JUNE 30, 2017
47
NOTE 1 – SUMMARY OF SIGNIFICANT ACCOUNTING POLICIES (CONTINUED)
d. Assets, Deferred Outflows, Liabilities, Deferred Inflows, and Net Position (Continued) Compensated Absences It is the City’s policy for employees to accumulate earned but unused vacation and sick benefits. Permanent City employees earn from 10 to 20 vacation days a year, depending upon their length of employment, and 12 sick days a year. Employees may carry forward unused sick leave indefinitely. Upon termination or retirement, permanent employees are entitled to receive compensation at their current base salary for all unused vacation leave. Any unused sick leave is forfeited upon termination of employment. All vacation pay is accrued when incurred in the government-wide and proprietary fund financial statements. A liability for these amounts is reported in governmental funds only if they have matured, for example, as a result of employee resignations and retirements. Long-Term Obligations In the government-wide financial statements, proprietary fund types in the fund financial statements, and in the fiduciary funds financial statements, long-term debt and other long-term obligations are reported as liabilities in the applicable governmental activities, business-type activities, proprietary fund type statement of net position, or the statement of fiduciary net position. Bond premiums and discounts are deferred and amortized over the life of the bonds using the effective interest method. Bonds payable are reported net of the applicable bond premium or discount. In the fund financial statements, governmental fund types recognize bond premiums and discounts during the current period. The face amount of debt issued is reported as other financing sources. Premiums received on debt issuances are reported as other financing sources while discounts on debt issuances are reported as other financing uses. Claims and Judgments
The City records a liability for litigation, judgments and claims when it is probable that an asset has been impaired or a liability has been incurred prior to year-end and the probable amount of loss (net of any insurance coverage) can be reasonably estimated. This liability is recorded in the Internal Service Funds that account for the City's self-insurance activities. Net Pension Liability
For purposes of measuring the net pension liability, deferred outflows and inflows of resources related to pensions, and pension expense, information about the fiduciary net position and additions to/deductions from the fiduciary net position have been determined on the same basis as they are reported by CalPERS. For this purpose, benefit payments (including refunds of employee contributions) are recognized when currently due and payable in accordance with the benefit terms. Investments are reported at fair value. CalPERS audited financial statements are publicly available reports that can be obtained at CalPERS’ website under Forms and Publications.

CITY OF BREA, CALIFORNIA
NOTES TO BASIC FINANCIAL STATEMENTS JUNE 30, 2017
48
NOTE 1 – SUMMARY OF SIGNIFICANT ACCOUNTING POLICIES (CONTINUED)
d. Assets, Deferred Outflows, Liabilities, Deferred Inflows, and Net Position (Continued) Fund Balances In the governmental fund financial statements, fund balances are classified as follows:
Nonspendable Fund Balance – This amount indicates the portion of funds balances which cannot be spent because they are either not in spendable form such as prepaid items, inventories, land held for resale or loans/notes receivable, or legally or contractually required to be maintained intact, such as the principal portion of an endowment. Only the General Fund may report nonspendable fund balance for long-term interfund receivables and land held for resale.
Restricted Fund Balance – This amount indicates the portion of fund balances which has been restricted a) externally imposed by creditors (such as through debt covenants), grantors, contributors, or laws or regulations of other governments; or b) imposed by law through constitutional provisions or enabling legislation. Long-term interfund receivables and land held for resale in governmental funds other than the General Fund are included within restricted fund balance.
Committed Fund Balance – This amount indicates the portion of fund balances which can only be used for specific purposes pursuant to a formal resolution of the City Council.
Assigned Fund Balance – This amount indicates the portion of fund balances which is constrained by the City’s intent to be used for specific purpose, but is neither restricted nor committed. The Administrative Services Director is authorized to determine and define the amount of assigned fund balances, which was established by City Council through resolution. Unassigned Fund Balance – This includes the excess residual amounts in the General Fund and the residual deficit of all other governmental funds which have not been restricted, committed, or assigned to specific purposes.
The City Council, as the City's highest level of decision-making authority, may commit fund balance for specific purposes pursuant to the adoption of a resolution. These committed amounts cannot be used for any other purpose unless the City Council removes or changes the specified use through the adoption of another resolution. City Council action to commit fund balance needs to occur within the fiscal reporting period; however, the amount can be determined subsequently.
Fund balance flow assumptions
Sometimes the government will fund outlays for a particular purpose from both restricted and unrestricted resources (the total of committed, assigned, and unassigned fund balance). In order to calculate the amounts to report as restricted, committed, assigned, and unassigned fund balance in the governmental fund financial statements a flow assumption must be made about the order in which the resources are considered to be applied. It is the City’s policy to consider restricted fund balance to have been depleted before using any of the components of unrestricted fund balance. Further, when the components of unrestricted fund balance can be used for the same purpose, committed fund balance is depleted first, followed by assigned fund balance. Unassigned fund balance is applied last.

CITY OF BREA, CALIFORNIA
NOTES TO BASIC FINANCIAL STATEMENTS JUNE 30, 2017
49
NOTE 1 – SUMMARY OF SIGNIFICANT ACCOUNTING POLICIES (CONTINUED)
d. Assets, Deferred Outflows, Liabilities, Deferred Inflows, and Net Position (Continued) Net Position In the governmental-wide financial statements and proprietary fund financial statements, net position is classified as follows:
Net Investment in Capital Assets – This amount consists of capital assets net of accumulated depreciation and reduced by outstanding debt that is attributed to the acquisition, construction, or improvement of the assets. Restricted Net Position – This amount is restricted by external creditors, grantors, contributors, or laws or regulations of other governments. As of June 30, 2017, $36,101,252 of net position is restricted by enabling legislation. Unrestricted Net Position – This amount is all net position that do not meet the definition of “net investment in capital assets” or “restricted net position.”
Net position flow assumption Sometimes the City will fund outlays for a particular purpose from both restricted (e.g., restricted bond or grant proceeds) and unrestricted resources. In order to calculate the amounts to report as restricted – net position and unrestricted – net position in the government-wide and proprietary fund financial statements, a flow assumption must be made about the order in which the resources are considered to be applied. It is the government’s policy to consider restricted – net position to have been depleted before unrestricted – net position is applied.
e. Property Tax
Property tax revenue is recognized on the modified accrual basis, that is, in the fiscal year for which the taxes have been levied providing they become available. Available means when due, or past due and receivable within the current period and collected within the current period or expected to be collected soon enough thereafter to be used to pay liabilities of the current period. The County of Orange collects property taxes for the City. Tax liens attach annually as of 12:01 A.M. on the first day in January the preceding fiscal year for which the taxes are levied. Taxes are levied on both real and personal property, as it exists on that date. The tax levy covers the fiscal period July 1 to June 30. All secured personal property taxes and one-half of the taxes on real property are due November 1; the second installment is due February 1. All taxes are delinquent, if unpaid, on December 10 and April 10, respectively. Unsecured personal property taxes become due on the first of March each year and are delinquent, if unpaid, on August 31.
f. Use of Estimates
The preparation of financial statements in conformity with accounting principles generally accepted in the United States of America requires management to make estimates and assumptions that affect the reported amounts of assets and liabilities and disclosures of contingent assets and liabilities at the date of the financial statements and the reported amounts of revenues and expenses during the reporting period. Actual results could differ from those estimates.

CITY OF BREA, CALIFORNIA
NOTES TO BASIC FINANCIAL STATEMENTS JUNE 30, 2017
50
NOTE 1 – SUMMARY OF SIGNIFICANT ACCOUNTING POLICIES (CONTINUED) g. Effect of New Accounting Standards
During the fiscal year ended June 30, 2017, the City implemented the following Governmental Accounting Standards Board (GASB) standards: GASB Statement No. 82 – In March 2016, GASB issued Statement No. 82, Pension Issues – An Amendment of GASB Statements No. 67, No. 68, and No. 73. The objective of the Statement is to address certain issues that have been raised with respect to Statements No. 67, Financial Reporting for Pension Plans, No. 68, Accounting and Financial Reporting for Pensions, and No. 73, Accounting and Financial Reporting for Pensions and Related Assets That Are Not within the Scope of GASB Statement 68, and Amendments to Certain Provisions of GASB Statements 67 and 68. Specifically, the Statement addresses issues regarding (1) the presentation of payroll-related measures in required supplementary information, (2) the selection of assumptions and the treatment of deviations from the guidance in an Actuarial Standard of Practice for financial reporting purposes, and (3) the classification of payments made by employers to satisfy employee (plan member) contribution requirements. The City implemented this pronouncement effective July 1, 2016.
h. Pronouncements Issued But Not Yet Adopted
The GASB has issued pronouncements that have an effective date subsequent to June 30, 2017, which may impact future financial presentations:
GASB Statement No. 75 – In June 2015, GASB issued Statement No. 75, Accounting and Financial Reporting for Postemployment Benefits Other Than Pensions. The objective of this Statement is to improve accounting and financial reporting by state and local governments for postemployment benefits other than pensions (other postemployment benefits or OPEB). This Statement is effective for fiscal years beginning after June 15, 2017, or the 2017-2018 fiscal year. The City has not determined the effect of the Statement.
GASB Statement No. 81 – In March 2016, GASB issued Statement No. 81, Irrevocable Split–Interest Agreements. The objective of the Statement is to improve financial reporting for irrevocable split-interest agreements by providing recognition and measurement guidance for situations in which a government is a beneficiary of the agreement. The Statement requires that a government that receives resources pursuant to an irrevocable split-interest agreement recognize assets, liabilities, and deferred inflows of resources at the inception of the agreement. Furthermore, the Statement requires that a government recognize assets representing its beneficial interests in irrevocable split-interest agreements that are administered by a third party, if the government controls the present service capacity of the beneficial interests. The Statement requires that a government recognize revenue when the resources become applicable to the reporting period. The Statement is effective for the reporting periods beginning after December 15, 2016, or the 2017-18 fiscal year. The City has not determined the effect of the Statement.

CITY OF BREA, CALIFORNIA
NOTES TO BASIC FINANCIAL STATEMENTS JUNE 30, 2017
51
NOTE 1 – SUMMARY OF SIGNIFICANT ACCOUNTING POLICIES (CONTINUED)
h. Pronouncements Issued But Not Yet Adopted (Continued) GASB Statement No. 83 – In November 2016, GASB issued Statement No. 83, Certain Asset Retirement Obligations. This Statement addresses accounting and financial reporting for certain asset retirement obligations (AROs). An ARO is a legally enforceable liability associated with the retirement of a tangible capital asset. A government that has legal obligations to perform future asset retirement activities related to its tangible capital asset should recognize a liability based on the guidance in this Statement. This Statement also requires disclosure of information about the nature of a government’s ARO, the methods and assumptions used for the estimates of the liabilities, and the estimated remaining useful life of the associated tangible capital assets. The requirements of this Statement are effective for reporting periods beginning after June 15, 2018, or the 2018-19 fiscal year. The City has not determined the effect of the Statement.
GASB Statement No. 84 – In January 2017, GASB issued Statement No. 84, Fiduciary Activities. The objective of this Statement is to improve guidance regarding the identification of fiduciary activities for accounting and financial reporting purposes and how those activities should be reported. The requirements of this Statement are effective for reporting periods beginning after December 15, 2018, or the 2019-20 fiscal year. The City has not determined the effect of this Statement.
GASB Statement No. 85 – In March 2017, GASB issued Statement No. 85, Omnibus 2017. The objective of this Statement is to address practice issues that have been identified during implementation and application of certain GASB Statements. This Statement addresses a variety of topics including issues related to blending component units, goodwill, fair value measurement and application, and postemployment benefits (pensions and other postemployment benefits [OPEB]). The Statement is effective for the reporting periods beginning after June 15, 2017, or 2017-2018 fiscal year. The City has not determined the effect of the Statement.
GASB Statement No. 86 – In May 2017, GASB issued Statement No. 86, Certain Debt Extinguishment Issues. The primary objective of this Statement is to improve consistency in accounting and financial reporting for in-substance defeasance of debt by providing guidance for transactions in which cash and other monetary assets acquired with only existing resources—resources other than the proceeds of refunding debt—are placed in an irrevocable trust for the sole purpose of extinguishing debt. This Statement also improves accounting and financial reporting for prepaid insurance on debt that is extinguished and notes to financial statements for debt that is defeased in substance. The Statement is effective for the reporting periods beginning after June 15, 2017, or 2017-2018 fiscal year. The City has not determined the effect of the Statement.
GASB Statement No. 87 – In June 2017, GASB issued Statement No. 87, Leases. The objective of this Statement is to better meet the information needs of financial statement users by improving accounting and financial reporting for leases by governments. This Statement increases the usefulness of governments’ financial statements by requiring recognition of certain lease assets and liabilities for leases that previously were classified as operating leases and recognized as inflows of resources or outflows of resources based on the payment provisions of the contract. It establishes a single model for lease accounting based on the foundational principle that leases are financings of the right to use an underlying asset. Under this Statement, a lessee is required to recognize a lease liability and an intangible right-to-use lease asset, and a lessor is required to recognize a lease receivable and a deferred inflow of resources, thereby enhancing the relevance and consistency of information about governments’ leasing activities. The Statement is effective for the reporting periods beginning after December 15, 2019, or 2020-2021 fiscal year. The City has not determined the effect of the Statement.

CITY OF BREA, CALIFORNIA
NOTES TO BASIC FINANCIAL STATEMENTS JUNE 30, 2017
52
NOTE 1 – SUMMARY OF SIGNIFICANT ACCOUNTING POLICIES (CONTINUED)
i. Pronouncements Issued But Not Yet Adopted (Continued) GASB Statement No. 88 – In April 2018, GASB issued Statement No. 88, Certain Disclosures Related to Debt, Including Direct Borrowings and Direct Placements. The objective of this Statement is to improve the information that is disclosed in notes to government financial statements related to debt, including direct borrowings and direct placements. This Statement defines debt for purposes of disclosure in notes to financial statements as a liability that arises from a contractual obligation to pay cash (or other assets that may be used in lieu of cash) in one or more payments to settle an amount that is fixed at the date the contractual obligation is established. It requires that additional essential information related to debt be disclosed in notes to financial statements, including unused lines of credit; assets pledged as collateral for the debt; and terms specified in debt agreements related to significant events of default with finance-related consequences, significant termination events with finance-related consequences, and significant subjective acceleration clauses. For notes to financial statements related to debt, this Statement also requires that existing and additional information be provided for direct borrowings and direct placements of debt separately from other debt. The Statement is effective for the reporting periods beginning after June 15, 2018, or 2018-2019 fiscal year. The City has not determined the effect of the Statement.
NOTE 2 – STEWARDSHIP, COMPLIANCE AND ACCOUNTABILITY Deficit Fund Balances or Net Position The following individual nonmajor funds have a deficit at June 30, 2017:
Community Development Block Grant Special Revenue Fund (7,110)$ Midbury Capital Projects Fund (12,162) Sanitation Enterprise Fund (2,312,975) Information Technology External Support Enterprise Fund (914,951)
For the Community Development Block Grant special revenue fund and the Midbury capital projects fund, the City expects to eliminate these deficits with anticipated future revenues from grants, special assessments and fee for services. For the Sanitation and Information Technology External Support enterprise funds, the deficits are the result of pension reporting of the net pension liability, and will be eliminated through future charges.
At June 30, 2017, the Successor Agency of the Former RDA Private-purpose Trust Fund had a deficit net position amount of $132,923,573. The deficit balance will be eliminated with future property tax revenue.

CITY OF BREA, CALIFORNIA
NOTES TO BASIC FINANCIAL STATEMENTS JUNE 30, 2017
53
NOTE 3 – CASH AND INVESTMENTS As of June 30, 2017, cash and investments are classified in the accompanying financial statements as follows:
TotalCash and investments 73,574,089$ 6,725,578$ 80,299,667$ Restricted assets:
Cash and investments 6,947,905 - 6,947,905 Cash and investments with fiscal agents 7,649,104 30,046,446 37,695,550
Total cash and investments 88,171,098$ 36,772,024$ 124,943,122$
Statement of Net Position
Statement of Fiduciary Net
Position
Cash and investments as of June 30, 2017, consist of the following:
Cash on hand 7,989$ Deposits with financial institutions 2,813,928 Investments 77,477,750 Restricted cash and investments 6,947,905 Cash and investments with fiscal agents 37,695,550
Total cash and investments 124,943,122$
The City of Brea maintains a cash and investment pool that is available for use for all funds. Each fund type's position in the pool is reported on the combined balance sheet as cash and investments. The City has adopted an investment policy, which authorizes it to invest in various investments. a. Cash Deposits
The carrying amount of the City’s cash deposits was $2,813,928 at June 30, 2017. Bank balances were $3,390,980 at that date. The $577,052 difference represents outstanding checks and other reconciling items. As of June 30, 2017, the City’s deposits with financial institutions were covered by FDIC up to $250,000, and the remaining amounts of $3,140,980 were collateralized as described below. The California Government Code requires California banks and savings and loan associations to secure a City’s deposits by pledging government securities with a value of 110% of a City’s deposits. California law also allows financial institutions to secure a City’s deposits by pledging first trust deed mortgage notes having a value of 150% of a City’s total deposits. The City Treasurer may waive the collateral requirement for deposits that are fully insured up to $250,000 by the FDIC. The collateral for deposits in federal and state chartered banks is held in safekeeping by an authorized Agent of Depository recognized by the State of California Department of Banking. The collateral for deposits with savings and loan associations is generally held in safekeeping by the Federal Home Loan Bank in San Francisco, California as an Agent of Depository. These securities are physically held in an undivided pool for all California public agency depositors. Under Government Code Section 53655, the placement of securities by a bank or savings and loan association with an “Agent of Depository” has the effect of perfecting the security interest in the name of the local governmental agency. Accordingly, all collateral held by California Agents of Depository are considered to be held for, and in the name of, the local governmental agency.

CITY OF BREA, CALIFORNIA
NOTES TO BASIC FINANCIAL STATEMENTS JUNE 30, 2017
54
NOTE 3 – CASH AND INVESTMENTS (CONTINUED) b. Investments
Investments Authorized by the California Government Code and the City’s Investment Policy Funds of the City, other than bond proceeds and cash deposits held in restricted accounts, may be invested in any instrument allowable under current legislation of the State of California (Government Code Section 53600 et sec.) so long as the investment is appropriate and consistent with the City’s investment policy. The following investments are authorized:
Maximum MaximumMaximum Percentage or Amount Investment In
Authorized Investment Type Maturity of Portfolio One IssuerU.S. Treasury Obligations (Bills, Notes and Bonds) 5 years No limit No limitU.S. Government Sponsored Enterprise Securities* 5 years No limit No limitBanker's Acceptances 180 days 40% 30%Commercial Paper 270 days 25% 10%Repurchase Agreements 1 year No limit No limitCertificates of Deposit 5 years 30% No limitNegotiable Certificates of Deposit 5 years 30% No limitPassbook Savings Accounts/Interest Bearing Investment Accounts n/a No limit No limitMedium Term Corporate Notes 5 years 30% No limitBank Money Market Accounts 5 years 20% 10%California Local Agency Investment Fund n/a $65,000,000 No limitCounty of Orange Investment Fund (County Pool) n/a No limit No limitAsset Backed Securities 5 years 10% No limitSupranationals 5 years 15% 5%
*maximum of 5% in callable bonds issued by such agencies
Provisions of Government Code Section 53601 are to be adhered to at all times. Additionally, the City will use the guidelines established by the joint committee of the California Municipal Treasurers Association and the California Society of Municipal Finance Officers as the basis for investing in government investment pools. For purposes of complying with legal investment limitations, the percentage referenced above refers to the maturity value of the portfolio at the time of purchase.
Investments Authorized by Debt Agreements The above investments do not address investment of debt proceeds held by a bond trustee. Investments of debt proceeds held by a bond trustee are governed by provisions of the debt agreements rather than the general provisions of the California Government Code or the City’s investment policy.

CITY OF BREA, CALIFORNIA
NOTES TO BASIC FINANCIAL STATEMENTS JUNE 30, 2017
55
NOTE 3 – CASH AND INVESTMENTS (CONTINUED) b. Investments (Continued)
Investments in State Investment Pool The City is a voluntary participant in the California Local Agency Investment Fund (LAIF) that is regulated by California Government Code Section 16429 under the oversight of the Treasurer of the State of California. LAIF is overseen by the Local Agency Investment Advisory Board, which consists of five members, in accordance with State statute. The State Treasurer’s Office audits the fund annually. Each City may invest up to $65,000,000 without limitation. The fair value of the position in the investment pool is the same as the value of the pool shares. The balance available for withdrawal on demand are based on the accounting records maintained by LAIF, which are recorded on an amortized cost basis.
Restricted Cash & Investments The City has established a Section 115 Trust to accumulate resources for future contributions to CalPERS. As of June 30, 2017, the City reported $6,947,905 in restricted cash and investments. As of June 30, 2017, the City had $6,827,659 of restricted cash and investments reported in the general fund in a Section 115 Trust restricted for future pension contributions and $120,246 in a construction escrow account reported in the Capital Improvements fund. In January 2016, the City adopted an investment policy for the Section 115, which authorized the following investments:
Debt obligations of the U.S. Government, its agencies, and Government Sponsored Enterprises Mortgage-Backed Securities Asset Backed Securities Collateralized Mortgage Obligations Commercial Mortgage-Backed Securities Corporate debt securities issued by U.S. or foreign entities including, but not limited to, limited
partnerships, equipment trust certificates and enhanced equipment trust certificates Eligible instruments issued pursuant to SEC Rule 144(a) Municipal Bonds
The portfolio will maintain a minimum weighted average quality of A- at all times. Individual securities shall have a minimum quality rating of Baa3 by Moody’s or BBB- by Standard & Poor’s (S&P).

CITY OF BREA, CALIFORNIA
NOTES TO BASIC FINANCIAL STATEMENTS JUNE 30, 2017
56
NOTE 3 – CASH AND INVESTMENTS (CONTINUED)
c. Risk Disclosures
Disclosures Relating to Credit Risk
Generally, credit risk is the risk that an issuer of an investment will not fulfill its obligation to the holder of the investment. This is measured by the assignment of a rating by a nationally recognized statistical rating organization. Presented below is the minimum rating required by (where applicable) the California Government Code, the City’s investment policy, or debt agreements, and the actual rating as of year-end for each investment type.
MinimumInvestment Type legal rating Not Rated AAA AA+ AA- AA
U.S. Treasury Obligations N/A -$ -$ 15,177,667$ -$ -$ U.S. Government Sponsored Enterprise Securities N/A - - 19,112,309 - - Coporate Bonds A - 903,443 1,687,801 3,805,236 1,099,828 Money Market Mutual Funds AAA - 143,092 - - Asset Backed Securities AA - 5,025,499 - - - Commercial Paper A-1/A - 2,173,288 - - - California Local Agency Investment Fund N/A 13,524,396 - - - - Supranational AA - 3,796,745 - - - Municipal Bonds N/A - - 1,010,127 - - Restricted Cash and Investments - Section 115 Trust
Corporate Bonds N/A - - 366,297 717,437 - Money Market Mutual Funds N/A 4,536,524 - - - -
Restricted Cash and Investments with Fiscal AgentsMoney Market Mutual Funds N/A - 29,999,988 - - - U.S. Treasury Obligations N/A - - 5,197,713 - - U.S. Government Sponsored Enterprise Securities N/A - - 2,497,849 - -
‐
Total 18,060,920$ 42,042,055$ 45,049,763$ 4,522,673$ 1,099,828$
MinimumInvestment Type legal rating A+ A BBB+ BBB Total
U.S. Treasury Obligations N/A -$ -$ -$ -$ 15,177,667$ U.S. Government Sponsored Enterprise Securities N/A - - - - 19,112,309 Coporate Bonds A 3,877,986 6,140,333 - - 17,514,627 Money Market Mutual Funds AAA - - - - 143,092 Asset Backed Securities AA - - - - 5,025,499 Commercial Paper A-1/A - - - - 2,173,288 California Local Agency Investment Fund N/A - - - - 13,524,396 Supranational AA - - - - 3,796,745 Municipal Bonds N/A - - - - 1,010,127 Restricted Cash and Investments - Section 115 Trust -
Corporate Bonds N/A 276,162 723,642 222,158 105,685 2,411,381 Money Market Mutual Funds N/A - - - - 4,536,524
Restricted Cash and Investments with Fiscal Agents - Money Market Mutual Funds N/A - - - - 29,999,988 U.S. Treasury Obligations N/A - - - - 5,197,713 U.S. Government Sponsored Enterprise Securities N/A - - - - 2,497,849
Total 4,154,148$ 6,863,975$ 222,158$ 105,685$ 122,121,205$
Custodial Credit Risk
The custodial credit risk for deposits is the risk that, in the event of the failure of a depository financial institution, a government will not be able to recover deposits or will not be able to recover collateral securities that are in the possession of an outside party. The custodial credit risk for investments is the risk that, in the event of the failure of the counterparty to a transaction, a government will not be able to recover the value of investment or collateral securities that are in the possession of an outside party. The City uses a third party investment manager to manage their investments, and has authority from City Council to execute purchases and sales of investments according to the parameters in their investment policy without the approval of management. Investments are held by another third party custodian designated by the City.

CITY OF BREA, CALIFORNIA
NOTES TO BASIC FINANCIAL STATEMENTS JUNE 30, 2017
57
NOTE 3 – CASH AND INVESTMENTS (CONTINUED)
c. Risk Disclosures (Continued)
Concentration of Credit Risk The City’s investment policy imposes restrictions for certain types of investments with any one issuer. Investments in any one issuer that represents 5% or more of the total City’s investments are as follows:
Issuer Investment Type AmountFHLMC U.S Government Sponsored Enterprise 7,287,712$ FNMA U.S Government Sponsored Enterprise 10,060,147
Interest Rate Risk The City's investment policy limits investment maturities as a means of managing its exposure to fair value losses arising from increasing interest rates. The City’s investment policy states that at least 25% of the City’s portfolio will mature in one year or less. The only exception to these maturity limits will be the investment for the bond proceeds for the Reserve Fund. As of June 30, 2017, the City had the following investments and original maturities:
12 months 13 to 24 25 to 60 More thanInvestment Type or less Months Months 60 Months Total
U.S. Treasury Obligations -$ 2,776,490$ 12,401,177$ -$ 15,177,667$ U.S. Government Sponsored Enterprise Securities 1,133,759 1,630,337 16,348,213 - 19,112,309 Coporate Bonds 4,895,893 5,082,823 7,535,911 - 17,514,627 Money Market Mutual Funds 143,092 - - - 143,092 Asset Backed Securities 122,543 2,245,037 2,657,919 - 5,025,499 Commercial Paper 2,173,288 - - - 2,173,288 California Local Agency Investment Fund 13,524,396 - - - 13,524,396 Supranational - 1,451,861 2,344,884 - 3,796,745 Municipal Bonds - 1,010,127 - - 1,010,127 Restricted Cash and Investments - Section 115 Trust
Corporate Bonds - 426,778 1,021,622 962,981 2,411,381
Money Market Mutual Funds 4,536,524 - - - 4,536,524 Restricted Cash and Investments with Fiscal Agents
Money Market Mutual Funds 29,999,988 - - - 29,999,988 U.S. Treasury Obligations - 599,202 4,598,511 - 5,197,713 U.S. Government Sponsored Enterprise Securities - 262,025 2,235,824 - 2,497,849
56,529,483$ 15,484,680$ 49,144,061$ 962,981$ 122,121,205$
Investment Maturities (in Years)

CITY OF BREA, CALIFORNIA
NOTES TO BASIC FINANCIAL STATEMENTS JUNE 30, 2017
58
NOTE 3 – CASH AND INVESTMENTS (CONTINUED) Fair Value Measurement and Application The City categorizes its fair value measurements within the fair value hierarchy established by generally accepted accounting principles. The hierarchy is based on the valuation inputs used to measure the fair value of the asset. Level 1 inputs are quoted prices in active markets for identical assets; Level 2 inputs are significant other observable inputs; Level 3 inputs are significant unobservable inputs. The City has the following recurring fair value measurements as of June 30, 2017:
Investments notMeasured at
Investment Type Totals Fair Value 1 2 3U.S. Treasury Obligations 15,177,667$ -$ -$ 15,177,667$ -$ U.S. Government Sponsored Enterprise Securities 19,112,309 - - 19,112,309 - Coporate Bonds 17,514,627 - - 17,514,627 - Money Market Mutual Funds 143,092 143,092 - - - Asset Backed Securities 5,025,499 - - 5,025,499 - Commercial Paper 2,173,288 2,173,288 California Local Agency Investment Fund 13,524,396 13,524,396 - - - Supranational 3,796,745 - - 3,796,745 - Municipal Bonds 1,010,127 - - 1,010,127 - Restricted Cash and Investments - Section 115 Trust
Corporate Bonds 2,411,381 - - 2,411,381 - Money Market Mutual Funds 4,536,524 4,536,644 - - -
Restricted Cash and Investments with Fiscal AgentsMoney Market Mutual Funds 29,999,988 29,999,988 - - - U.S. Treasury Obligations 5,197,713 - - 5,197,713 - U.S. Government Sponsored Enterprise Securities 2,497,849 - - 2,497,849 -
122,121,205$ 48,204,120$ -$ 73,917,205$ -$
Level
Deposits and withdrawals related to the investments in LAIF and money market funds are made on the basis of $1 and not fair value. Accordingly, under the fair value hierarchy these investments are uncategorized. NOTE 4 – CALIFORNIA DOMESTIC WATER COMPANY (CDWC) The City purchases 87% of its water for the Water Enterprise fund operations through the California Domestic Water Company (CDWC). CDWC is a private mutual water company, organized as a not-for-profit under Section Code 501(c)(12), which provides water primarily to wholesale customers in east Whittier, La Habra and Brea. CDWC has a wholly owned subsidiary, Cadway Inc. (Cadway), which owns and leases certain water rights to CDWC. Both CDWC and Cadway participate in the Pellissier Co-Tenancy. Cadway is treated as a C Corporation for federal and state tax purposes. Separately prepared consolidated financial statements of CDWC include both CDWC and Cadway, Inc., and may be obtained from the City. The City holds 1,502.72 of water rights in the Main San Gabriel Basin which are capitalized at cost, and reported as “water rights” within capital assets. Each year, these water rights are temporarily leased to CDWC in order for CDWC to deliver water to the City based on its ownership. For the year ended June 30, 2017, based on the limits set by the Main San Gabriel Basin Water Master, the City was able to purchase .758977 acre feet of water per acre foot of water rights owned, or 1,140.53 acre feet at a cost of $197,685.

CITY OF BREA, CALIFORNIA
NOTES TO BASIC FINANCIAL STATEMENTS JUNE 30, 2017
59
NOTE 4 – CALIFORNIA DOMESTIC WATER COMPANY (CDWC) (CONTINUED)
The City also holds 687.85 shares of preferred stock which are reported at cost as “water rights” within capital assets. During December 2011, Brea was issued 664.14 shares of preferred stock for $8,141,812 to secure Brea’s claim to the 664.14 acre feet of water rights from CDWC. During May 2013, Brea was issued another 23.75 shares of preferred stock for $302,592 to secure Brea’s claim to another 23.75 acre feet of water rights from CDWC. This resulted in a total of 687.89 shares of preferred stock for a total of $8,444,404 used to secure an equal amount of water delivered pursuant to water rights. There is an immaterial difference of 0.04 shares between the City’s records and CDWC records. As a preferred stock shareholder in CDWC, the City is entitled to a certain number of acre feet of water based on the number of preferred stock shares owned. This water is purchased at the same cost as water purchased using water rights owned by the City. For the current fiscal year, the City was entitled to purchase .758977 acre feet of water per acre foot of water rights owned, or 522.06 acre feet at the common stock entitlement rate for a total cost of $90,490. As of June 30, 2017, the City holds 2,106.5 shares of Common Stock in the CDWC. The City values its common stock holdings using the equity method of investment as the City holds approximately 26.31% of the total shares outstanding. The City reported $138,132 as the change in equity for the year ended June 30, 2017. As a common stock shareholder in CDWC, the City is entitled to purchase a certain amount of water based on the number of common stock shares owned. For the year ended June 30, 2017, the City was entitled to purchase 1.55 acre feet of water per common stock share owned or 3,265.08 acre feet of at the common stock entitlement rate, for a total cost of $1,254,690.
As described in Note 13, the City restated opening balances for the equity investment to reflect the consolidated entity, including Cadway, Inc., a wholly-owned subsidiary of CDWC. As of the date of the report, management has asserted they are revising and memorializing certain provisions related to the water rights acquired through preferred stock within an Agreement, in order to clearly and accurately reflect the rights and privileges of these transactions. The Agreement was initially presented to City Council on May 15, 2018, but the item was postponed to a future meeting. The effect of changes, if any, as a result this Agreement, will be reflected in future reporting periods, when known. During the year ended June 30, 2017, the City paid $3,759,475 to California Domestic Water Company for purchases of water during the year.

CITY OF BREA, CALIFORNIA
NOTES TO BASIC FINANCIAL STATEMENTS JUNE 30, 2017
60
NOTE 5 – NOTES, LOANS, AND DEFERRED LOANS RECEIVABLE Notes and loans receivable consist of rehabilitation loans made from Community Development Block Grant (“CDBG”) and HOME grant funds to low income individuals that need assistance in rehabilitating their homes or mobile homes to meet current code standards. Amounts are due from the proceeds only upon the sale or transfer of the property. Loans made to mobile home owners are forgiven if the owner lives in the property 5 years or more. Repayments received by the City from homeowners are remitted to the County. Thus, the City has offset the notes and loans receivable balance with a liability due to other governments on the accompanying balance sheet. Notes and loans receivable from each of these funds are comprised of the following at June 30, 2017:
CDBG 1,598,500$ HOME Grant Funds 35,241 Total notes and loans receivable 1,633,741$
The City (through the former redevelopment agency) has made long term loans to various developers and organizations to stimulate low and moderate income housing projects and to low and moderate income individuals to rehabilitate their homes to meet current code standards or to assist them in purchasing a home. Some assistance given gave the City rights to receive “silent seconds” on property when sold to a low and moderate income individual. These “silent seconds” gave the City the right to a portion of the proceeds from the sale of the property. Collection terms of these loans vary and range from 5 years to 55 years. The majority of loans made to developers will be repaid from residual receipts and from monies earned on the property once they are built. Home buyer assistance loans begin repayment after 5 years and will be repaid over a 30-year period. For the remainder of loans and notes receivable, the Agency has classified fund balance as “restricted” indicating that these resources are not current available resources. The outstanding balance of these notes and loans are reported in the Housing Successor Fund and are comprised of the following at June 30, 2017:
Home Buyer Assistance Loans 5,098,627$ Rehabilitation Loans 162,929 Developer / Organization Loans:Acacia Apartments 1,473,345 Birch Hills Afforadable Apartments 4,750,000 Bonterra Apartments 1,160,827 Imperial Apartments 2,853,000 La Habra Housing 637,000 South Walnut Bungalows 826,000
Total notes, loans and deferred loans receivable 16,961,728$

CITY OF BREA, CALIFORNIA
NOTES TO BASIC FINANCIAL STATEMENTS JUNE 30, 2017
61
NOTE 6 – INTERFUND RECEIVABLES, PAYABLES AND TRANSFERS The composition of interfund balances as of June 30, 2017, is as follows: Due To/From Other Funds
Due FromOther Funds
Due to Other Funds General FundNon-major Enterprise Funds 439,894$
The balances due between funds at June 30, 2017 were a result of routine transactions not cleared prior to the end of the fiscal year. Advances To/From Other Funds
Capital Non-majorImprovements Governmental Water Utility
Advances to Other Funds Fund Funds Fund TotalGeneral Fund -$ 18,203$ 355,500$ 373,703$ Non-major Governmental Funds 443,788 - - 443,788 Internal Service Funds - - 866,119 866,119
Total 443,788$ 18,203$ 1,221,619$ 1,683,610$
Advances from Other Funds
a. The General Fund and the Internal Service Funds advanced $1,221,619 to the Water Utility Fund in order
to purchase water rights in 2012. Amounts will be repaid through January 2019, with interest accrued at 0.38%.
b. The General Fund advanced Non-major Governmental Funds $18,203 to fund street improvements. Amount will be repaid through June 30, 2020 with interested accrued at 0.36%.
c. Non-major Governmental Funds advanced the Capital Improvements Fund $443,788 to fund the SuperBlock I Parking Structure. These amounts will be repaid from future receipts of the Successor Agency 2011 bonds during FY 2018-2019.

CITY OF BREA, CALIFORNIA
NOTES TO BASIC FINANCIAL STATEMENTS JUNE 30, 2017
62
NOTE 6 – INTERFUND RECEIVABLES, PAYABLES AND TRANSFERS (CONTINUED) Transfers In/Out from Other Funds
CapitalImprovements Internal Service
Transfers Out General Fund Fund Funds TotalGovernmental Activities:
General Fund 5,887,391$ -$ 5,887,391$ Non-major Governmental Funds 1,181,048 1,426,868 38,562 2,646,478 Internal Service Funds 511,800 192 - 511,992
Business-type Activities:Water Utility - 447,655 50,320 497,975 Sewer Utility - 104,900 - 104,900 Non-major Enterprise Funds 515,000 7,540 - 522,540 Total 2,207,848$ 7,874,546$ 88,882$ 10,171,276$
Transfers In
a. The General Fund transferred $5,887,391 to the Capital Improvements Fund for various capital
improvement program projects.
b. Non-major Governmental Funds transferred $1,181,048 to the General Fund for street maintenance purposes, funded through restricted revenue sources (Gas Tax, etc.).
c. Non-major Governmental Funds transferred $1,426,868 to the Capital Improvements Fund for various capital improvement program projects.
d. Non-major Governmental Funds transferred $38,562 to the Internal Services Funds for the purchase of two alternative fuel vehicles (from the Air Quality Improvement fund).
e. The Internal Service Funds transferred $511,800 to the General Fund for general purposes.
f. The Water Utility Fund transferred $447,655 to reimburse the Capital Improvements Fund for capital improvement program project costs that are not subject to being capitalized.
g. The Water Utility Fund transferred $50,320 to reimburse the Internal Services Funds for purchase of a vehicle.
h. The Sewer Utility Fund transferred $104,900 to reimburse the Capital Improvements Fund for capital improvement program project costs that are not subject to being capitalized.
i. Non-major Enterprise Funds transferred $515,000 to the General Fund, which the majority of this transfer was from the Sanitation Fund, for franchise fees collected from the City’s contract refuse hauling company.
j. Non-major Enterprise Funds transferred $7,540 to the Capital Improvements Fund for capital improvement project costs that are not subject to being capitalized.

CITY OF BREA, CALIFORNIA
NOTES TO BASIC FINANCIAL STATEMENTS JUNE 30, 2017
63
NOTE 7 – CAPITAL ASSETS
Summary of changes in capital assets for the governmental activities for the year ended June 30, 2017, is as follows:
Beginning EndingBalance Transfers Additions Disposals Balance
Governmental activities:Capital assets, not depreciated:
Land 44,742,843$ -$ 2,408,747$ -$ 47,151,590$ Construction in progress 6,008,328 (318,761) 6,754,930 - 12,444,497
Total Capital Assets, Not Depreciated 50,751,171 (318,761) 9,163,677 - 59,596,087
Capital assets, being depreciated:Structures and improvements 88,754,110 - 257,904 - 89,012,014 Equipment 20,834,822 - 1,276,439 (515,159) 21,596,102 Infrastructure 131,347,859 318,761 1,676,035 - 133,342,655
Total Capital Assets Being Depreciated 240,936,791 318,761 3,210,378 (515,159) 243,950,771
Less accumulated depreciation for:Structures and improvements (46,997,192) - (1,704,531) - (48,701,723) Equipment (12,108,605) - (1,343,355) 434,560 (13,017,400) Infrastructure (59,495,987) - (4,761,404) - (64,257,391)
Total Accumulated Depreciation (118,601,784) - (7,809,290) 434,560 (125,976,514)
Total Capital Assets Being Depreciated, Net 122,335,007 318,761 (4,598,912) (80,599) 117,974,257
Governmental Activities Capital Assets, Net 173,086,178$ -$ 4,564,765$ (80,599)$ 177,570,344$

CITY OF BREA, CALIFORNIA
NOTES TO BASIC FINANCIAL STATEMENTS JUNE 30, 2017
64
NOTE 7 – CAPITAL ASSETS (CONTINUED)
Beginning EndingBalance, as restated Transfers Additions Disposals Balance
Business-Type Activities:Capital assets, not depreciated:
Land 2,074,536$ -$ -$ -$ 2,074,536$ Water rights - fee title 23,931,020 - - - 23,931,020 Water rights - preferred stock 8,444,404 - - - 8,444,404 Construction in progress 141,295 (2,298,244) 2,156,949 - -
Total Capital Assets, not depreciated 34,591,255 (2,298,244) 2,156,949 - 34,449,960
Capital assets, being depreciated:Equipment 344,551 - 7,002 (10,024) 341,529 Infrastructure 109,831,348 2,298,244 - - 112,129,592
Total Capital Assets Being Depreciated 110,175,899 2,298,244 7,002 (10,024) 112,471,121
Less accumulated depreciation for:Equipment (246,815) - (27,798) 10,024 (264,589) Infrastructure (50,820,984) - (2,567,426) - (53,388,410)
Total Accumulated Depreciation (51,067,799) - (2,595,224) 10,024 (53,652,999)
Total Capital Assets Being Depreciated, Net 59,108,100 2,298,244 (2,588,222) - 58,818,122
Business-Type Activities Capital Assets, Net 93,699,355$ -$ (431,273)$ -$ 93,268,082$
The City has a total $32,375,424 in water rights. As described in Note 4, $8,444,404 of the water rights are held as preferred stock in California Domestic Water Company. The remaining $23,931,020 of water rights are held in the name of the City. Combined, the rights held by the City allow the City to purchase 1,662.59 acre feet of water annually at a set rate of $173.33 per acre foot. Refer to Note 4 for further details of transactions with California Domestic Water Company.

CITY OF BREA, CALIFORNIA
NOTES TO BASIC FINANCIAL STATEMENTS JUNE 30, 2017
65
NOTE 7 – CAPITAL ASSETS (CONTINUED)
Depreciation expense was charged to functions/programs of the primary government as follows:
Governmental Activities:City:
General government 1,113,972$ Public safety 422,538 Community development 6,643 Community services 375,305 Public works 5,099,005
Total City 7,017,463 Internal service:
Vehicle maintenance 672,357$ Building occupancy 119,470
Total internal service 791,827 Total Governmental Activities 7,809,290$
Business-Type Activities:Water utility 2,163,100$ Sewer utility 431,188 Urban runoff 938
Total Business-Type Activities 2,595,226$
NOTE 8 – LONG-TERM LIABILITIES a. Governmental Activities Long-Term Liabilities
A summary of changes in governmental activities long-term debt for the year ended June 30, 2017, is noted below:
Beginning Ending Due WithinBalance Additions Deletions Balance One Year
Lease Revenue Bonds:2010 lease revenue bonds 2,760,000$ -$ -$ 2,760,000$ -$
Capital leases 4,833,071 - (571,195) 4,261,876 603,704 Compensated absences 2,525,071 3,001,998 (2,910,650) 2,616,419 1,962,314 Claims and judgments (note 11) 4,220,920 1,910,407 (1,634,136) 4,497,191 1,753,904
14,339,062$ 4,912,405$ (5,115,981)$ 14,135,486$ 4,319,922$

CITY OF BREA, CALIFORNIA
NOTES TO BASIC FINANCIAL STATEMENTS JUNE 30, 2017
66
NOTE 8 – LONG-TERM LIABILITIES (CONTINUED) a. Governmental Activities Long-Term Liabilities (Continued)
Lease Revenue Bonds
2010 Lease Revenue Bonds
The $2,835,000 principal amount of the 2010 Lease Revenue Bonds was issued by the Brea Public Financing Authority (Authority) in April 2010. The proceeds were used to finance a portion of the costs of the installation of photovoltaic energy systems and energy efficient improvements on City property. The Authority elected to treat the bonds as “Build America Bonds” under Section 54AA(g)(2) of the Tax Code which made the Authority eligible for cash subsidy payments from the United States Treasury equal to 35% of the interest payable on the bonds. These are referred to as “refundable credits” in the bond indenture and are pledged for the payment of the bonds.
Bonds maturing on April 1, 2030, in the amount of $1,260,000 are term bonds and bear interest at 6.734%. Installments are $380,000, $420,000 and $460,000 and are due in 2028, 2029 and 2030. Bonds maturing on April 1, 2036, in the amount of $1,500,000, are term bonds and bear interest at 6.884%. Installments range from $165,000 to $510,000 every year from 2031 to 2036.
Bonds are payable from the lease payments to be made by the City of Brea for the leasing of certain real property pursuant to the lease agreement dated April 1, 2010. The required reserve for the 2010 lease revenue bonds is $261,807. As of June 30, 2017, the reserve amount was $265,707.
The outstanding balance at June 30, 2017, was $2,760,000.
The debt service schedule of the 2010 Lease Revenue Bonds are as follows:
Year Ending June 30: Principal Interest Total2018 -$ 188,108$ 188,108$ 2019 - 188,108 188,108 2020 - 188,108 188,108 2021 - 188,108 188,108 2022 - 188,108 188,108
2023-2027 - 940,540 940,540 2028-2032 1,935,000 656,276 2,591,276 2033-2036 825,000 148,351 973,351
Total 2,760,000$ 2,685,707$ 5,445,707$
Capital Leases
In February 2006, the City entered into a lease agreement with LaSalle National Leasing Corporation to acquire new energy management equipment. Per the lease agreement, the semi-annual payments of $87,091 are due in February and August of each year with the final payment due in February 2018. The outstanding balance at June 30, 2017, was $168,314.
In April 2010, the City entered into equipment lease purchase agreement with Banc of America Leasing & Capital, LLC to finance the Brea Civic and Cultural Center Project, and the Brea Community Center Project. Per the lease agreement, remaining semi-annual payments ranging from $11,467 to $85,272 are due in April and October of each year with the final payment due in April 2027. The outstanding balance at June 30, 2017, was $2,640,000.

CITY OF BREA, CALIFORNIA
NOTES TO BASIC FINANCIAL STATEMENTS JUNE 30, 2017
67
NOTE 8 – LONG-TERM LIABILITIES (CONTINUED) a. Governmental Activities Long-Term Liabilities (Continued)
In August 2015, the City entered into an equipment lease purchase agreement with Banc of America Public Capital Corp in the amount of $1,952,104 for the acquisition of public safety radio communication equipment in connection with the upgrade of the Orange County 800 Megahertz Countywide Coordinated Communication System. Per the lease agreement, remaining semiannual payments ranging from $140,195 to $150,611 are due in June and December of each year with the final payment due in June 2022. The outstanding balance at June 30, 2017, was $1,453,562. The assets acquired through capital lease is as follows: Equipment 8,932,096$ Less: Accumulated Depreciation (2,381,435)
Total 6,550,661$
Combined future capital lease payments are as follows:
Year Ending June 30:2018 805,013$ 2019 645,818 2020 654,191 2021 666,271 2022 676,736
2023-2027 1,960,107
Total minimum lease payments 5,408,135
Less: amount representing interest (1,146,259)
Present value of minimum lease payment 4,261,876$
Compensated Absences The City's policies relating to compensated absences are described in Note 1. The Governmental Activities’ liability, at June 30, 2017, will be paid in future years from the General Fund, Vehicle Maintenance Fund, and Building Occupancy Fund in amounts of $2,523,700, $36,568 and $56,151 respectively. Total compensated absences at June 30, 2017, were $2,616,419.

CITY OF BREA, CALIFORNIA
NOTES TO BASIC FINANCIAL STATEMENTS JUNE 30, 2017
68
NOTE 8 – LONG-TERM LIABILITIES (CONTINUED)
b. Business-Type Activities Long-Term Liabilities
A summary of changes in business-type activities long-term debt for the year ended June 30, 2017 is noted below:
Beginning Ending Due WithinBalance Additions Deletions Balance One Year
Water Revenue Bonds:2009 Water Revenue Bonds 22,850,000$ -$ (570,000)$ 22,280,000$ 590,000$ 2010 Water Revenue Bonds 10,425,000 - (540,000) 9,885,000 125,000 2014 Water Revenue Bonds 18,300,000 - (315,000) 17,985,000 325,000
Compensated absences 218,289 248,650 (201,878) 265,061 198,796 Totals 51,793,289$ 248,650$ (1,626,878)$ 50,415,061$ 1,238,796$
Unamortized bond discount (281,080) Unamortized bond premium 1,962,683
52,096,664$
Water Revenue Bonds 2009 Water Revenue Bonds
In May 2009, the Brea Public Financing Authority issued $25,800,000 of 2009 Water Revenue Bonds structured into two series. The $12,855,000 2009 Water Revenue Refunding Bond Series A and the $12,945,000 2009 Water Revenue Bonds, Series B. The proceeds from Series A bonds was used to current refund all of the remaining outstanding 1998 Water Revenue Bonds and proceeds from the Series B Bonds financed the acquisition of additional water rights and various capital projects relating to the Water System. Proceeds were also used to fund a debt service reserve fund and pay cost of issuance expenses.
Series A bonds consist of $12,855,000 serial bonds and term bonds. Bonds maturing in the years 2010 through 2027 are serial bonds payable in remaining annual installments of $590,000 to $930,000 and bear interest at 2.0% to 4.75%. Bonds maturing July 1, 2029, in the amount of $1,375,000 are term bonds and bear interest at 4.75%. Series B bonds consist of $12,945,000 term bonds. Bonds mature from 2029 through 2039 in annual installments of $525,000 to $1,495,000 and bear interest at 6.75%.
The required reserve for the 2009 Water Revenue Bonds is $1,560,937. As of June 30, 2017, the reserve was $1,904,469 being held in the Water Fund of the City of Brea. The outstanding balance at June 30, 2017, was $22,280,000.
2010 Water Revenue Bonds
In April 2010, the Brea Public Financing Authority issued $12,295,000 of water revenue bonds into two series. Both Series A and B were issued to finance a portion of the costs of the installation of photovoltaic energy systems and energy efficient improvements at the City. Proceeds were also used to fund a debt service reserve fund and pay issuance costs and capitalized interest on the bonds through the end of the construction phase.

CITY OF BREA, CALIFORNIA
NOTES TO BASIC FINANCIAL STATEMENTS JUNE 30, 2017
69
NOTE 8 – LONG-TERM LIABILITIES (CONTINUED)
b. Business-Type Activities Long-Term Liabilities (Continued)
2010 Water Revenue Bonds (Continued)
Series A bonds consisted of $2,410,000 of tax exempt serial bond maturing on July 1 of each year beginning in 2012 through 2016, and has been paid in full. Series B bonds consisted of $9,885,000 of federally taxable “Build America Bonds”, $2,195,000 of these bonds are serial bonds maturity on July 1 of each year beginning in 2017 through 2025. Annual principal installments range from $125,000 to $935,000. Interest payments are due July 1 and January 1 of each year and range from 4.37% to 5.99%. The remaining $7,690,000 are term bonds due maturing on July 1, 2030 and July 1, 2036 in the amounts of $2,685,000 and $5,005,000. The Series B bonds are also subject to mandatory sinking fund requirements. These “Build America Bonds” under Section 54AA(g)(1) of the Tax Code make the Authority eligible for cash subsidy payments from the United States Treasury equal to 35% of the interest payable on the bonds. These are referred to as “refundable credits” in the bond indenture and are pledged for the payment of the bonds.
The required reserve for the 2010 Water Revenue Bonds, Series B is $758,076. As of June 30, 2017, the reserve amount was $1,347,765. The outstanding balance at June 30, 2017 was $9,885,000.
2014 Water Revenue Bonds
In August 2014, the Brea Community Benefit Financing Authority issued $18,555,000 of 2014 Water Revenue Bonds. The proceeds will be used to repay interfund loans made by the City of Brea to its Water Utility Fund from other available funds for the purchase of water rights completed in May 2014 for the benefit of the City’s water system. Proceeds were also used to pay cost of issuance expenses.
The bonds consisted of $9,440,000 serial bonds maturing in the years 2015 to 2034, payable July 1 in annual installments of $255,000 to $700,000 and bear interest at 3.50% to 5.00%. Bonds maturing July 1, 2039, in the amount of $4,005,000 are term bonds and bear interest at 5.00%. Bonds maturing July 1, 2044, in the amount of $5,110,000 are term bonds and bear interest at 5.00%. The outstanding balance at June 30, 2017, was $17,985,000.
Water Revenue Bonds Debt Coverage Requirement
The City has covenanted that gross revenues (including interest revenue and excluding connection fees) less operation and maintenance costs as defined in the bond document shall be at least 1.25 times the sum of all debt service on all parity obligations. Gross revenues for the year ended June 30, 2017, were $19,194,816. Operation and maintenance costs for the year ended June 30, 2017, were $9,865,661, excluding depreciation. This resulted in a debt coverage ratio of 2.47 for the year ended June 30, 2017.

CITY OF BREA, CALIFORNIA
NOTES TO BASIC FINANCIAL STATEMENTS JUNE 30, 2017
70
NOTE 8 – LONG-TERM LIABILITIES (CONTINUED)
b. Business-Type Activities Long-Term Liabilities (Continued)
Pledged Revenues
Future net revenues of the Water Utility Fund for each year’s debt service payment are pledged until the extinguishment of the debt in 2044 and are not available for other uses. Remaining principal and interest payments on this debt as of June 30, 2017 was $91,965,853.
The debt service schedules of these Water Revenue Bonds are as follows:
Year Ending June 30: Principal Interest Total
2018 1,040,000$ 2,741,609$ 3,781,609$ 2019 1,100,000 2,698,827 3,798,827 2020 1,165,000 2,652,304 3,817,304 2021 1,235,000 2,600,695 3,835,695 2022 1,310,000 2,543,596 3,853,596
2023-2027 7,850,000 11,696,980 19,546,980 2028-2032 10,670,000 9,248,957 19,918,957 2033-2037 13,845,000 5,565,653 19,410,653 2038-2042 8,720,000 1,820,857 10,540,857 2043-2045 3,215,000 246,375 3,461,375
Total 50,150,000$ 41,815,853$ 91,965,853$
Compensated Absences
The City's policies relating to compensated absences are described in Note 1. This liability at June 30, 2017, will be paid in future years by the enterprise funds. Total compensated absences at June 30, 2017, were $265,061.
c. Debt Without Government Commitment
Assessment District Bonds
The special assessment bonds are secured by valid assessment liens upon certain lands within the special assessment district and are not direct liabilities of the City and, accordingly, are not included in the accompanying general purpose financial statements. The City has no obligation beyond the balances in the designated agency funds for any delinquent assessment district bond payments. If delinquencies occur beyond the amounts held in the reserve funds created from bond proceeds, the City has no duty to pay the delinquency out of any available funds of the City. Neither the full faith and credit nor taxing power of the City is pledged to the payment of the bonds. The City acts solely as an agent for those paying assessments and for the bondholders.

CITY OF BREA, CALIFORNIA
NOTES TO BASIC FINANCIAL STATEMENTS JUNE 30, 2017
71
NOTE 8 – LONG-TERM LIABILITIES (CONTINUED)
c. Debt Without Government Commitment (Continued) In June 2005, the Brea Public Financing Authority issued $15,405,000 Brea Public Financing Authority 2005 Series A Local Agency Revenue Bonds for and on behalf of the City of Brea Community Facilities District No. 1997-1 (Olinda Heights Public Improvements) and the Brea Olinda Unified School District (BOUSD) Community Facilities District No. 95-1 (Olinda Heights). $6,665,000 of the City of Brea Community Facilities District Bonds were for a current refunding of the Community Facilities District No. 1997-1 (Olinda Heights Public Improvements) 1998 Special Tax Bonds. The bonds were issued pursuant to the Mello-Roos Community Facilities Act of 1982, and are payable from the proceeds of annual special tax to be levied on property. The bonds mature from 2006 to 2028, with remaining annual installments ranging from $275,000 to $430,000 per year. The interest rates on the bonds range from 3.750% to 4.375%. The outstanding balance at June 30, 2017, was $4,150,000. The remaining $6,310,000 of bonds outstanding relate to the BOUSD Community Facilities District No. 95-1 (Olinda Heights), and are not part of the City. Refer to the separately prepared financial statements of the BOUSD for further information.
In December 2009, the City of Brea on behalf of the City of Brea Community Facilities District No. 2008-2 issued $8,145,000 in bonds known as the Brea Plaza Area Public Improvements 2009 Special Tax Bonds to finance acquisition and construction of certain public capital improvements in Brea Plaza. Proceeds were used to pay administrative expenses of the Community Facilities District, bond issuance costs, and capitalized interest on the bonds through the end of the construction. These bonds are not obligations of the City and will be paid solely from special tax revenues levied on certain property within the Community Facilities District. The bonds mature from 2012 to 2039, with remaining annual installments including sinking fund requirements ranging from $90,000 to $765,000 per year. The remaining interest rates on the bonds range from 5.75% to 7.375%. The outstanding balance at June 30, 2017, was $7,830,000. In February 2014, the City issued on behalf of the Community Facilities District No. 1996-1 (Downtown Brea Public Improvements) $1,630,000 aggregate principal of 2014 Special Tax Refunding Bonds to currently refund in full the Community Facilities District No. 1996-1 (Downtown Brea Public Improvements) 1997 Special Tax Bonds. The bonds were issued pursuant to the Mello-Roos Community Facilities Act of 1982 and are payable from the proceeds of an annual special tax levied on property within the District. The bonds mature from 2014 to 2021, with remaining annual installments ranging from $205,000 to $225,000 per year. The annual interest rate on the bonds is 2.580%. The outstanding balance at June 30, 2017, was $1,075,000.
NOTE 9 – DEFINED BENEFIT PENSION PLAN
a. Plan Description
The City of Brea contributes to the California Public Employees Retirement System (PERS), an agent multiple-employer public employee defined benefit pension plan. PERS provides retirement and disability benefits, annual cost-of-living adjustments and death benefits to plan members and beneficiaries. PERS acts as a common investment and administrative agent for participating public entities within the State of California. Benefit provisions and all other requirements are established by state statute and City ordinance. Copies of PERS’ annual financial report may be obtained from its executive office: 400 P Street, Sacramento, California 95814.

CITY OF BREA, CALIFORNIA
NOTES TO BASIC FINANCIAL STATEMENTS JUNE 30, 2017
72
NOTE 9 – DEFINED BENEFIT PENSION PLAN (CONTINUED)
b. Benefits Provided
CalPERS provides service retirement and disability benefits, annual cost of living adjustments and death benefits to plan members, who must be public employees and beneficiaries. Benefits are based on years of credited service, equal to one year of full time employment. Members with five years of total service are eligible to retire at age 50 with statutorily reduced benefits. All members are eligible for non-duty disability benefits after 10 years of service. The death benefit is one of the following: the Basic Death Benefit, the 1957 Survivor Benefit, or the Optional Settlement 2W Death Benefit. The cost of living adjustments for each plan are applied as specified by the Public Employees’ Retirement Law.
Tier 1* Tier 2 PEPRA (Tier 3)September 17, 1999 to
Hire date Prior to September 17, 1999 December 31, 2012 and January 1, 2013 and afterNon-PEPRA hired on or
after January 1, 2013Benefit formula 2.0% @ 55 2.0% @ 55 2.0% @ 62Benefit vestingschedule 5 years service 5 years service 5 years serviceBenefit payments monthly for life monthly for life monthly for lifeRetirement age minimum 50 years minimum 50 years minimum 52 yearsMonthly benefits, as 1.426% - 2.418% 1.426% - 2.418% 1.000% - 2.500%a % of eligible 50 yrs - 63 years, 50 yrs - 63 years, 52 yrs - 67+ yrs,compensation respectively respectively respectivelyRequired employeecontribution rates 7.000% 7.000% 5.750%Required employercontribution rates 17.052% 17.052% 5.711%
* Closed to new entrants
Miscellaneous Plan
Tier 1* Tier 2* Tier 3 PEPRA (Tier 4)On June 30, 1984 September 17, 2011 to
Hire date Prior to June 30, 1984 and prior to December 31, 2012 and January 1, 2013 and afterSeptember 17, 2011 Non-PEPRA hired on or
after January 1, 2013Benefit formula 3.0% @ 50 3.0% @ 50 2.0% @ 50 2.7% @ 57Benefit vestingschedule 5 years service 5 years service 5 years service 5 years serviceBenefit payments monthly for life monthly for life monthly for life monthly for lifeRetirement age minimum 50 years minimum 50 years minimum 50 years minimum 50 yearsMonthly benefits, as 3.000% 3.000% 2.000% - 2.700% 2.000% - 2.700%a % of eligible 50 yrs 50 yrs 50 yrs - 55 yrs, 50 yrs - 57+ yrs,compensation respectively respectivelyRequired employeecontribution rates 9.000% 9.000% 9.000% 10.250%Required employercontribution rates 46.798% 46.798% 46.798% 10.453%
* Closed to new entrants
Safety Plan

CITY OF BREA, CALIFORNIA
NOTES TO BASIC FINANCIAL STATEMENTS JUNE 30, 2017
73
NOTE 9 – DEFINED BENEFIT PENSION PLAN (CONTINUED)
c. Employees Covered
At June 30, 2015, the following employees were covered by the benefit terms of the Plans:
Miscellaneous SafetyDescription Plan Plan
Inactive employees or beneficiaries currently receiving benefits 261 203Inactive employees entitled to but not yet receiving benefits 266 72Active employees 196 100
Total 723 375
Number of members
d. Contributions
Section 20814(c) of the California Public Employees’ Retirement Law (PERL) requires that the employer contribution rates for all public employers be determined on an annual basis by the actuary and shall be effective on the July 1 following notice of a change in the rate. Funding contributions for both plans are determined annually on an actuarial basis as of June 30 by CalPERS. The actuarially determined rate is the estimated amount necessary to finance the costs of benefits earned by employees during the year, with an additional amount to finance any unfunded accrued liability. The City is required to contribute the difference between the actuarially determined rate and the contribution rate of employees.
The employer contributions during the year ended June 30, 2017 were $2,279,397 and $5,863,082 for the Miscellaneous Plan and the Safety Plan, respectively.
e. Actuarial Methods and Assumptions Used to Determine Total Pension Liability
The total pension liability in the June 30, 2015 actuarial valuations were determined using the following actuarial assumptions:
Miscellaneous SafetyValuation Date June 30, 2015 June 30, 2015Measurement Date June 30, 2016 June 30, 2016Actuarial Cost Method Entry-Age Normal Cost Method Entry-Age Normal Cost MethodActuarial Assumptions:
Discount Rate 7.65% 7.65%Inflation 2.75% 2.75%Salary increases 3.3% to 14.2% by Entry, Age and
Service3.3 to 14.2 percent by Entry, Age
and Service
Investment Rate of Return 7.65% 7.65%
Mortality Table** Derived using CalPERS' Membership Data for all Funds
Derived using CalPERS' Membership Data for all Funds
**The mortality table used was developed based on 2014 CalPERS's Experience Study. The table includes
20 years of mortality improvements using Society of Actuaries Scale AA.

CITY OF BREA, CALIFORNIA
NOTES TO BASIC FINANCIAL STATEMENTS JUNE 30, 2017
74
NOTE 9 – DEFINED BENEFIT PENSION PLAN (CONTINUED) e. Actuarial Methods and Assumptions Used to Determine Total Pension Liability (Continued)
The long-term expected rate of return on pension plan investments was determined using a building-block method in which best-estimate ranges of expected future real rates of return (expected returns, net of pension plan investment expense and inflation) are developed for each major asset class. In determining the long-term expected 7.65 percent rate of return on pension plan investments, CalPERS took into account both short-term and long-term market return expectations as well as the expected pension fund cash flows. Such cash flows were developed assuming that both members and employers will make their required contributions on time and as scheduled in all future years. Using historical returns of all the funds’ asset classes, expected compound (geometric) returns were calculated over the short-term (first 10 years) and the long-term (11-60 years) using a building-block approach. Using the expected nominal returns for both short-term and long-term, the present value of benefits was calculated for each fund. The expected rate of return was set by calculating the single equivalent expected return that arrived at the same present value of benefits for cash flows as the one calculated using both short-term and long-term returns. The expected rate of return was then set equivalent to the single equivalent rate calculated above and rounded down to the nearest one quarter of one percent. The target allocation and best estimates of arithmetic real rates of return for each major asset class are the same for each Plan. These geometric rates of return net of administrative expenses are summarized in the following table:
New Strategic Real Return Real ReturnAsset Class Allocation Years 1 - 10 (1) Years 11+ (2)Global Equity 51.00% 5.25% 5.71%Global Fixed Income 20.00 0.99 2.43Inflation Sensitive 6.00 0.45 3.36Private Equity 10.00 6.83 6.95Real Estate 10.00 4.50 5.13Infrastructure and Forestland 2.00 4.50 5.09Liquidity 2.00 -0.55 -1.05
(1) An expected inflation of 2.5% used for this period (2) An expected inflation of 3.0% used for this period
f. Discount Rate
The discount rate used to measure the total pension liability was 7.65 percent. The projection of cash flows used to determine the discount rate assumed that employee contributions will be made at the current contribution rate and that the City’s contributions will be made at rates equal to the difference between actuarially determined contributions rates and the employee rate. Based on those assumptions, each pension plan’s fiduciary net position was projected to be available to make all projected future benefit payments of current active and inactive employees. To determine whether the municipal bond rate should be used in the calculation of a discount rate for each plan, CalPERS stress tested plans that would most likely result in a discount rate that would be different from the actuarially assumed discount rate. Based on the testing of the plans, the tests revealed the assets would not run out. Therefore, the current 7.65 percent discount rate is appropriate and the use of the municipal bond rate calculation is not deemed necessary. The long-term expected discount rate of 7.65 percent is applied to all plans in the Public Employees Retirement Fund (PERF). The stress test results are presented in a detailed report that can be obtained at CalPERS’ website.

CITY OF BREA, CALIFORNIA
NOTES TO BASIC FINANCIAL STATEMENTS JUNE 30, 2017
75
NOTE 9 – DEFINED BENEFIT PENSION PLAN (CONTINUED)
g. Changes in the Net Pension Liability
The changes in Net Pension Liability for each Plan follows:
Miscellaneous PlanTotal Pension
LiabilityPlan Fiduciary Net
PositionNet Pension
Liability/(Asset)Balance at June 30, 2015 120,807,599$ 94,276,177$ 26,531,422$ Changes in the year:
Service Cost 2,046,427 - 2,046,427 Interest on the total pension liability 9,044,787 - 9,044,787
Differences between actual and expected experience (950,961) - (950,961) Contribution - employer - 2,403,298 (2,403,298) Contribution - employee - 1,071,389 (1,071,389) Net Investment Income - 510,663 (510,663) Benefit payments, including refunds of employee contributions (5,294,666) (5,294,666) - Administrative expense - (57,456) 57,456 Net changes 4,845,587 (1,366,772) 6,212,359
Balance at June 30, 2016 125,653,186$ 92,909,405$ 32,743,781$
Increase (Decrease)
Safety PlanTotal Pension
LiabilityPlan Fiduciary Net
PositionNet Pension
Liability/(Asset)Balance at June 30, 2015 224,431,525$ 156,303,305$ 68,128,220$ Changes in the year:
Service Cost 2,745,588 - 2,745,588 Interest on the total pension liability 16,654,242 - 16,654,242 Differences between expected and actual experience (2,403,349) - (2,403,349) Contribution - employer - 4,627,179 (4,627,179) Contribution - employee - 973,955 (973,955) Net Investment Income - 746,473 (746,473) Benefit payments, including refunds of employee contributions (11,396,941) (11,396,941) - Administrative expenses - (95,259) 95,259 Net changes 5,599,540 (5,144,593) 10,744,133
Balance at June 30, 2016 230,031,065$ 151,158,712$ 78,872,353$
Increase (Decrease)

CITY OF BREA, CALIFORNIA
NOTES TO BASIC FINANCIAL STATEMENTS JUNE 30, 2017
76
NOTE 9 – DEFINED BENEFIT PENSION PLAN (CONTINUED)
h. Sensitivity of the Net Pension Liability to Changes in the Discount Rate
The following presents the net pension liability of each Plan, calculated using the discount rate of 7.65%, as well as what the net pension liability would be if it were calculated using a discount rate that is 1% point lower (6.65%) or 1% point higher (8.65%) than the current rate:
1% Decrease Current Discount 1% Increase(6.65%) Rate (7.65%) (8.65%)
Miscellaneous Plan's net pension liability 49,365,967$ 32,743,781$ 18,968,370$
Safety Plan's net pension liability 109,266,132 78,872,353 53,802,837
Total Net Pension Liability 158,632,099$ 111,616,134$ 72,771,207$
i. Pension Plan Fiduciary Net Position
Detailed information about each pension plan’s fiduciary net position is available in the separately issued CalPERS financial reports. See CalPERS website for additional information.
j. Pension Expense and Deferred Outflows and Deferred Inflows of Resources Related to Pensions
For the year ended June 30, 2017, the City recognized pension expense of $1,851,059 for the Miscellaneous Plan and $4,814,533 for the Safety Plan. As of June 30, 2017, the City reported deferred outflows of resources and deferred inflows of resources related to pensions from the following sources:
Miscellaneous Plan
Deferred Outflows of Resources
Deferred Inflows of Resources
Contributions made after the measurement date 2,279,397$ -$ Difference between expected and actual experience - (1,061,341) Change in assumptions (555,491) Net difference between projected and actual earningson pension plan investments 5,055,819 -
Miscellaneous Plan Total 7,335,216 (1,616,832)
Safety PlanContributions made after the measurement date 5,863,082 - Difference between expected and actual experience - (2,204,277) Change in assumptions - (1,141,175) Net difference between projected and actual earningson pension plan investments 8,308,977 -
Safety Plan Total 14,172,059 (3,345,452)
Total 21,507,275$ (4,962,284)$

CITY OF BREA, CALIFORNIA
NOTES TO BASIC FINANCIAL STATEMENTS JUNE 30, 2017
77
NOTE 9 – DEFINED BENEFIT PENSION PLAN (CONTINUED) j. Pension Expense and Deferred Outflows and Deferred Inflows of Resources Related to Pensions
(Continued)
Amounts reported as deferred outflows of resources and deferred inflows of resources are amortized in pension expense for the year the gain or loss occurs, except for contributions subsequent to the measurement period of $2,279,397 and $5,863,082 for the Miscellaneous and Safety Plans, respectively, which will be recognized as a reduction of the net pension liability during the fiscal year ending June 30, 2018. The amortization period differs depending on the source of the gain or loss. Differences between projected and actual investment earnings are amortized on a 5-year straight-line basis and all other amounts are amortized over the average expected remaining service lives of all members that are provided with benefits. As of the June 30, 2016 measurement date, the expected average remaining service lifetime is 2.7 years for the Miscellaneous Plan and 2.8 years for the Safety Plan. Deferred outflows and inflows of resources related to pensions will be recognized in pension expense as follows:
Miscellaneous Plan Safety PlanDeferred Deferred
Fiscal year ending Outflows/(Inflows) Outflows/(Inflows)June 30, of Resources of Resources
2018 (663,584)$ (1,537,766)$ 2019 460,156 434,346 2020 2,319,285 3,872,494 2021 1,323,130 2,194,451 Total 3,438,987$ 4,963,525$
NOTE 10 – OTHER POST-EMPLOYMENT BENEFITS Plan Description In addition to providing pension benefits, the City provides medical insurance for certain employees after they separate from the City, through a single-employer defined benefit plan as provided under the City's contractual agreements with members from each bargaining unit. Members who retire from the City on or after attaining the age of 50 with at least five years of service are eligible for these benefits. A separate annual financial report is not issued. Funding Policy The City funds retiree healthcare benefits on a pay-as-you-go basis, paying a maximum of $350 per month for each retirees’ benefits from City funds as they are due with no pre-funding for future years. The City recognizes expenditures for its share of the annual premiums as these benefits become due. For fiscal year ended June 30, 2017, the total contributions made to the plan were $1,188,789 and include $825,789 paid by the City for benefits of 209 retired employees, and implied subsidy of $363,000. The City has not established an irrevocable trust for the purpose of accumulating assets for plan benefits.

CITY OF BREA, CALIFORNIA
NOTES TO BASIC FINANCIAL STATEMENTS JUNE 30, 2017
78
NOTE 10 – OTHER POST-EMPLOYMENT BENEFITS (CONTINUED) Annual OPEB Cost and Net OPEB Obligation
The City’s annual other post-employment benefit (OPEB) cost is calculated based on the annual required contribution of the employer (ARC), an amount actuarially determined in accordance with the parameters of GASB Statement 45. The ARC represents a level of funding that, if paid on an ongoing basis, is projected to cover normal cost each year and amortize any unfunded actuarial liabilities over a period not to exceed thirty years.
The following table shows the components of the City’s annual OPEB cost for the year, the amount actually contributed to the plan, and changes in the City’s net OPEB obligation:
Annual required contribution 2,560,000$ Interest on net OPEB obligation 190,000 Adjustments to annual required contributions (471,000) Annual OPEB cost (expense) 2,279,000 Contributions made (including premiums paid) (1,188,789) Increase in net OPEB obligation 1,090,211 Net OPEB obligation - beginning of year 5,652,602 Net OPEB obligation - end of year 6,742,813$
The City’s annual OPEB cost, the percentage of annual OPEB cost contributed to the plan, and the net OPEB obligation for the year ended June 30, 2017, and the two preceding years were as follows:
Percentage of Annual
Fiscal Annual OPEB Cost OPEB Cost Net OPEB Year OPEB Cost Contributed Contributed Obligation
6/30/2015 1,479,000$ 817,075$ 55.25% 4,925,213$ 6/30/2016 1,548,000 820,611 53.01% 5,652,602 6/30/2017 2,279,000 1,188,789 52.16% 6,742,813
Funded Status and Funding Progress The funded status of the plan as of June 30, 2015, the Plan’s most recent actuarial valuation date, was as follows:
Actuarial accrued libility (AAL) 27,256,000$ Actuarial value of Plan assets - Unfunded acturial accrued liability (UAAL) 27,256,000$ Funded ratio (actuarial value of Plan assets/AAL) 0%Covered Payroll (active Plan participants) 25,182,000$ UAAL as a percentage of covered payroll 108.2%

CITY OF BREA, CALIFORNIA
NOTES TO BASIC FINANCIAL STATEMENTS JUNE 30, 2017
79
NOTE 10 – OTHER POST-EMPLOYMENT BENEFITS (CONTINUED) The required contribution is based on projected pay-as-you-go financing requirements with additional amount to prefund benefits as determined annually by the City under an actuarial valuation. Actuarial valuations of an ongoing plan involve estimates of the value of reported amounts and assumptions about the probability of occurrence of events far into the future. Examples include assumptions about future employment, mortality, and the healthcare cost trends. Amounts determined regarding the funded status of the plan and the annual required contributions of the employer are subject to continual revision as actual results are compared with past expectations and new estimates are made about the future. The schedule of funding progress, presented as required supplementary information following the notes to the financial statements, presents multi-year trend information about whether the actuarial value of Plan assets is increasing or decreasing over time relative to the actuarial accrued liabilities for benefits.
Projections of benefits for financial reporting purposes are based on the substantive plan (the plan as understood by the employer and the plan members) and include the types of benefits provided at the time of each valuation and the historical pattern of sharing of benefit costs between the employer and plan members to that point. The actuarial methods and assumptions used include techniques that are designed to reduce the effects of short-term volatility in actuarial accrued liabilities and the actuarial value of assets, consistent with the long-term perspective of the calculations. The actuarial valuation, dated June 30, 2015, used the Entry Age Normal actuarial cost method, a discount rate of 3.75% which is the long-term expected rate of return on the City’s investment fund, an annual general inflation rate of 2.75%, and an annual aggregate payroll increase of 3%. Annual healthcare cost trend increase by 7.5% beginning in 2019, reduced to an ultimate rate of 4% after 2076. The unfunded accrued actuarial liability (UAAL) is being amortized over a closed 22-year period as a level percentage of payroll. As of the actuarial valuation date, the City had 292 active participants and 209 retirees receiving benefits.
NOTE 11 – SELF-INSURANCE PROGRAM The City is a member of the California Insurance Pool Authority (CIPA). CIPA, a consortium of 11 cities in Los Angeles County and Orange County, California, that was established to pool resources, share risks, purchase excess insurance and to share costs for professional risk management and claims administration. At June 30, 2017, the City was self-insured for workers' compensation up to $400,000 per occurrence and general liability and auto liability insurance up to $350,000 per occurrence. The coverage for general and auto liability extends to $20,000,000 per occurrence with a $20,000,000 annual pooled aggregate. Member agencies may be assessed the difference between funds available and the $20,000,000 annual pooled aggregate in proportion to their annual premium. During the past three fiscal years, none of the above programs of protection have had settlements or judgments that exceeded pooled or insured coverage. There have been no significant reductions in pooled or insured liability coverage from coverage in the prior year. At June 30, 2017, $4,497,191 has been accrued for general liability and workers' compensation claims in the Internal Service Risk Management Fund. These amounts represent estimates of amounts to be paid for reported claims and incurred but not yet reported claims based upon past experience, modified for current trends and information. While the ultimate amount of losses incurred through June 30, 2017, is dependent on future developments, based upon information from the City Attorney, the City's claims administrators and others involved with the administration of the programs, City management believes the accrual is adequate to cover such losses.

CITY OF BREA, CALIFORNIA
NOTES TO BASIC FINANCIAL STATEMENTS JUNE 30, 2017
80
NOTE 11 – SELF-INSURANCE PROGRAM (CONTINUED) Changes in the claims liability amounted to the following for the years ended June 30:
Claims and judgements at June 30, 2015 4,208,326$ Claims payments (2,390,133) Claims incurred and changes in estimates 2,402,727
Claims and judgements at June 30, 2016 4,220,920 Claims payments (1,634,136) Claims incurred and changes in estimates 1,910,407
Claims and judgements at June 30, 2017 4,497,191$
NOTE 12 – FUND BALANCE CLASSIFICATIONS Fund balances in the governmental funds as of June 30, 2017, have been classified as follows:
Special Revenue Capital
Fund Projects Fund Non-majorHousing Capital Governmental
General Successor Improvements Funds TotalNonspendable:
Advances to other funds 373,703$ -$ -$ -$ 373,703$ Prepaid costs 38,956 - - - 38,956
Total nonspendable 412,659 - - - 412,659
Restricted:Debt service 296,368 - - - 296,368 Prop 172 662,501 - - - 662,501 COPS 58,238 - - - 58,238 Lighting and maintenance districts 330,335 - - - 330,335 Low and moderate income housing asset - 20,662,864 - - 20,662,864
Gas tax - - - 1,335,665 1,335,665 Narcotic enforcement asest seizure - - - 188,336 188,336 Air quality improvement - - - 234,625 234,625 Park development - - - 914,492 914,492
Measure M - - - 2,133,387 2,133,387 Affordable housing trust - - - 2,459,297 2,459,297 Blackstone CFD - - - 2,238,749 2,238,749 La Floresta CFD - - - 147,554 147,554
Taylor-Morrison CFD - - - 86,052 86,052 Capital and mitigation improvement - - - 5,002,402 5,002,402 Storm drain - - - 256,400 256,400 Capital projects - - 9,005,509 - 9,005,509 Pension stabilization 6,854,304 - - - 6,854,304
Total restricted 8,201,746 20,662,864 9,005,509 14,996,959 52,867,078
Assigned to:General Plan Maintenance Fee 677,547 - - - 677,547 Brea War Memorial 47,652 - - - 47,652 Community Benefit and Economic Development 455,210 - - - 455,210 OPEB fund 155,103 - - - 155,103 Community center 830,937 - - - 830,937 Capital Asset replacement 9,149,623 - - - 9,149,623
Total assigned 11,316,072 - - - 11,316,072 Unassigned
General fund 14,077,609 - - - 14,077,609 Non-major governmental funds - - - (19,272) (19,272)
Total unassigned 14,077,609 - - (19,272) 14,058,337
Total 34,008,086$ 20,662,864$ 9,005,509$ 14,977,687$ 78,654,146$

CITY OF BREA, CALIFORNIA
NOTES TO BASIC FINANCIAL STATEMENTS JUNE 30, 2017
81
NOTE 13 – RESTATEMENTS OF PRIOR YEAR FINANCIAL STATEMENTS The City has restated certain balances within the Water Enterprise Fund and Business-Type Activities as described below. Further the Integrated Law and Justice Agency of Orange County (ILJAOC) agency fund has been restated to include capital assets. The restatement resulted in the following adjustments to net position (or due to external parties) as of July 1, 2016:
Business-type Water Utility ILJAOC
Activities Fund Agency FundBeginning of year, as previously reported:
Net position 51,977,823$ 40,796,141$ Due to external parties/other agencies 2,772,194$
(425,598) (425,598)
- - -
4,228,155 4,228,155 -
- - 728,190
Beginning of year, as restated:Net position 55,780,380$ 44,598,698$
Due to external parties/other agencies 3,500,384$
Effect of reclassifying a capital improvement project placed into service in 2013, but not transferred out of construction in progress.
Effect of reclassifying the City's preferred stock in Cal Domestic Water Company ($8,444,404) from Other Investments (now "Equity in California Domestic Water Company") to Water Rights within Capital Asset.
Effect of equity method investment application using consolidated activity of California Domestic Water Company, including the activity of Cadway, a wholly-owned subsidiary of California Domestic Water Company.
Effect of reporting ILJAOC's capital assets within the agency fund as of July 1, 2016
The pro-forma effect of the restatement on impacted balances is shown below:
June 30, 2016 June 30, 2016Previously Reported Restatement Restated
Business Type Activities:Capital Assets:
Land 2,074,536$ -$ 2,074,536$ Water Rights (fee title and preferred stock) 23,931,020 8,444,404 32,375,424 Contruction-in-progress 2,978,617 (2,837,322) 141,295
Total Capital Assets, not depreciated 28,984,173$ 5,607,082$ 34,591,255$
Capital assets being depreciated - Infrastructure 106,994,026$ 2,837,322$ 109,831,348$ Less: accumulated depreciation - Infrastructure (50,395,386) (425,598) (50,820,984)
Total capital assets being depreciated, net 56,696,376$ 2,411,724$ 59,108,100$
Other investments - renamed Equity in California Domestic Water Company 15,606,946$ (4,216,249)$ 11,390,697$
Water Utility Fund:Capital assets - net of accumulated depreciation 71,217,086$ 8,018,806$ 79,235,892$ Other investments - renamed Equity in California Domestic Water Company 15,606,946 (4,216,249) 11,390,697
ILJAOC Agency fund:Capital assets - net of accumulated depreciation -$ 728,190$ 728,190$ Due to external parties/other agencies 2,772,194 728,190 3,500,384

CITY OF BREA, CALIFORNIA
NOTES TO BASIC FINANCIAL STATEMENTS JUNE 30, 2017
82
NOTE 13 – RESTATEMENTS OF PRIOR YEAR FINANCIAL STATEMENTS (CONTINUED) The restatements for the Water Enterprise Fund and Business-Type Activities impacted the results of operations for the year ended June 30, 2016 as follows:
June 30, 2016 June 30, 2016Previously Reported Restatement Restated
Business Type Activities:Change in Net position 6,207,120$ (968,473)$ 5,238,647$
Water Utility Fund:
Change in Net position 5,299,639 (968,473) 4,331,166
Refer to notes 4 and 7 for further details on the California Domestic Water Company activity and related capital asset activity, respectively. See further details on ILJAOC at Note 16.
NOTE 14 – CONSTRUCTION AND OTHER SIGNIFICANT COMMITMENTS The following material construction and other significant commitments existed at June 30, 2017:
ExpendituresContract to date as of Remaining
Project Name Amount June 30, 2017 CommitmentsCapital Improvements Fund:57 Freeway & Lambert Road Interchange Improvement Project 3,420,000$ 3,049,491$ 370,509$ The Tracks At Brea Trail Project - EPA RLF 1,153,000 285,194 867,806 Super Block I Parking Structure 8,381,880 4,139,102 4,242,778 Computer Aided Dispatch/Records Management System 860,379 403,524 456,855 Kraemer Boulevard & Lambert Road (Phase 3) Pavement Rehabilitation 2,011,118 - 2,011,118 Laurel Elementary Magnet/Lagos de Moreno Park Upgrades 1,799,000 - 1,799,000 Tracks at Brea Trail Project - Segment 4 3,496,433 - 3,496,433 Central Avenue & Tamarack Avenue Intersection Improvement 470,824 - 470,824
Total 21,592,634$ 7,877,311$ 13,715,323$
The last four construction contracts did not start construction until 2017-18
Further, as described in Note 17, the City annually contributes amounts to the Successor Agency for debt service.
NOTE 15 – CONTINGENCIES The City is a defendant in several pending lawsuits of a nature common to many similar jurisdictions. City management estimates that the potential claims against the City not covered by insurance resulting from such litigation would not materially affect the financial position of the City. The City incurs various costs under federal and state grant reimbursement programs and records the related revenue and receivables for grant claims. Such grant claims are subject to final audit by federal and state agencies.

CITY OF BREA, CALIFORNIA
NOTES TO BASIC FINANCIAL STATEMENTS JUNE 30, 2017
83
NOTE 15 – CONTINGENCIES (CONTINUED) As of the date of the report, management has asserted they are revising and memorializing certain provisions related to the water rights acquired through preferred stock in the California Domestic Water Company. The effect of changes, if any, as a result of these agreements, will be reflected in future reporting periods, when known. Refer to Note 4 for further details. NOTE 16 – JOINTLY GOVERNED ORGANIZATIONS Integrated Law and Justice Agency of Orange County (ILJAOC) The City is a member of the Integrated Law and Justice Agency of Orange County (ILJAOC), along with 24 other cities and local law enforcement agencies. The purpose of ILJAOC is to facilitate and share criminal justice information and data among the member agencies. The Agency has a twelve member Board of Directors. The City was appointed to serve as Treasurer/Controller, and assumed administrative responsibilities of ILJAOC. Therefore the activities of ILJAOC are reported as an Agency fund of the City. During the year ended June 30, 2017, the City paid $12,274 to ILJAOC for its share of operating and replacement costs. Separately prepared financial statements for ILJAOC are available on the City’s website.
NOTE 17 – SUCCESSOR AGENCY OF THE FORMER REDEVELOPMENT AGENCY On December 29, 2011, the California Supreme Court upheld Assembly Bill X1 26 (the Bill) that provides for the dissolution of all redevelopment agencies in the State of California. This action impacted the reporting entity of the City that previously had reported a redevelopment agency within the reporting entity of the City as a blended component unit. The Bill provides that upon dissolution of a redevelopment agency, either the City or another unit of local government will agree to serve as the “successor agency” to hold the assets until they are distributed to other units of state and local government. On August 25, 2011, the City Council elected to become the Successor Agency for the former redevelopment agency in accordance with the Bill as part of City resolution number 2011-085. Each year, the successor agency is allocated revenue in the amount that is necessary to pay the estimated annual installment payments on enforceable obligations of the former redevelopment agency until all enforceable obligations of the prior redevelopment agency have been paid in full, and all assets have been liquidated. Management believes, in consultation with legal counsel, that the obligations of the former redevelopment agency due to the City are valid enforceable obligations payable by the successor agency trust under the requirements of the Bill. The City’s position on this issue is not a position of settled law and there is considerable legal uncertainty regarding this issue. It is reasonably possible that a legal determination may be made at a later date by an appropriate judicial authority that would resolve this issue unfavorably to the City.

CITY OF BREA, CALIFORNIA
NOTES TO BASIC FINANCIAL STATEMENTS JUNE 30, 2017
84
NOTE 17 – SUCCESSOR AGENCY OF THE FORMER REDEVELOPMENT AGENCY (CONTINUED) In accordance with the timeline set forth in the Bill (as modified by the California Supreme Court on December 29, 2011) all redevelopment agencies in the State of California were dissolved and ceased to operate as a legal entity as of February 1, 2012. After the date of dissolution, the assets and activities of the dissolved redevelopment agency are reported in a fiduciary fund (private purpose trust fund) in the financial statements of the City. a. Cash and investments
Cash and investments reported in the accompanying financial statements consisted of the following:
Cash and Investments 1,806,091$ Cash and Investments with fiscal agent 28,580,065
30,386,156$
b. Deferred Loans
The City (through the former redevelopment agency) has made long term loans to various developers and organizations to stimulate development in the City and remove blight in designated project areas. The outstanding balance at June 30, 2017, is as follows:
Rehabilitation loans 12,000$ Developer/ Organization Loans: Brea Improv 318,759 Brea Olinda Unified School Disctrict 1,708,555
2,039,314$
c. Long-Term Debt
A description of long-term debt outstanding (excluding defeased debt) of the Successor Agency as of June 30, 2017, follows:
Beginning Ending Due Within
Balance Additions Repayments Retirements Balance One YearTax Allocation Bonds
2003 Tax Allocation Bonds 27,853,872$ 596,546$ -$ $ - 28,450,418$ -$ 2008 Tax Allocation Bonds Series A 13,215,000 - (955,000) (12,260,000) - - 2008 Tax Allocation Bonds Series B 1,540,000 - (90,000) (1,450,000) - - 2011 Tax Allocation Bonds Series A 24,382,882 1,479,851 (25,000) - 25,837,733 73,391 2011 Tax Allocation Bonds Series B 10,035,000 - (95,000) - 9,940,000 100,000 2013 Tax Allocation Bonds 81,800,000 - (6,920,000) - 74,880,000 7,130,000 2016 Tax Allocation Bond Series A - 10,425,000 - - 10,425,000 1,150,000 2016 Tax Allocation Bond Series B - 1,540,000 - - 1,540,000 155,000
Subtotal - Tax Allocation Bonds 158,826,754 14,041,397 (8,085,000) (13,710,000) 151,073,151 8,608,391
Lease Revenue Bonds2004 Refunding Lease Revenue Bonds 1,880,000 - (285,000) - 1,595,000 295,000 2010 Refunding Lease Revenue Bonds 5,545,000 - (835,000) - 4,710,000 870,000
Subtotal -Lease Revenue Bonds 7,425,000 - (1,120,000) - 6,305,000 1,165,000 Total 166,251,754$ 14,041,397$ (9,205,000)$ (13,710,000)$ 157,378,151 9,773,391$
Unamortized bond discounts and premiums 8,299,295 165,677,446$

CITY OF BREA, CALIFORNIA
NOTES TO BASIC FINANCIAL STATEMENTS JUNE 30, 2017
85
NOTE 17 – SUCCESSOR AGENCY OF THE FORMER REDEVELOPMENT AGENCY (CONTINUED)
c. Long-Term Debt (Continued) Tax Allocation Bonds
2003 Tax Allocation Bonds
In July 2003, the former Brea Redevelopment Agency issued $120,497,866 principal amount of 2003 Redevelopment Project AB Tax Allocation Bonds. The proceeds were used to: 1) current refund the Agency’s Brea Redevelopment Agency 1993 Tax Allocation Refunding Bonds, 2) pay the costs of additional redevelopment activities with respect to Project Area AB, 3) pay the cost of a reserve fund security instrument, and 4) pay costs of issuance related to the bonds.
Bonds in the years 2014 to 2026 are current interest bonds payable with no annual installments, while bonds maturing in the years 2028 to 2030 are capital appreciation bonds payable August 1 in annual installments of $2,151,714 to $1,801,707. Bonds maturing in the years 2027, 2031 and 2032, in the amount of $16,475,000 are term bonds.
The current interest bonds bear interest at 4.450% due February 1 and August 1, of each year. The term bonds bear interest at 4.45% and are due August 1, 2032. The capital appreciation bonds have a face value of $22,640,000. By their nature, there is no regular interest payments associated with capital appreciation bonds. The "interest" on the debt results from the difference between the amounts paid by the investors when the debt was issued and the significantly larger value at maturity. The $22,640,000 of face value capital appreciation bonds were initially recorded at the amount of proceeds received, $5,987,866. Each year, the outstanding balance is increased for the accretion of interest associated with the bonds.
A financial guaranty insurance policy has been issued and, accordingly, no cash reserve balance is required. Bond payments are secured by a first pledge on all of the tax revenues on parity with the 2011 and 2013 bonds.
In December 2013, the Successor Agency issued the 2013 Tax Allocation Refunding Bonds to redeem the current interest bonds and term bonds outstanding balance of the 2003 Tax Allocation Bonds. Upon issuance of the 2013 Bonds, a portion of the sale proceeds of the 2013 Bonds was transferred to the 2003 Escrow Fund. On the redemption date, moneys deposited in the escrow funds was used to pay the redemption price for the refunded bonds. As a result, except for the capital appreciation bonds, the liability for current interest bonds and term bonds has been removed. The outstanding balance of the capital appreciation bonds at June 30, 2017, was $28,450,418.
2011 Tax Allocation Bonds, Series A
In June 2011, the former Brea Redevelopment Agency issued $18,839,323 principal amount of Brea Redevelopment Agency 2011 Tax Allocation Bonds, Series A. The proceeds were used to: 1) refund all of the Agency’s remaining outstanding 2001 Subordinate Tax Allocation Refunding Bonds, Series B, 2) finance projects benefiting the Agency’s Redevelopment Project AB, 3) fund a reserve account, and 4) pay costs of issuance.

CITY OF BREA, CALIFORNIA
NOTES TO BASIC FINANCIAL STATEMENTS JUNE 30, 2017
86
NOTE 17 – SUCCESSOR AGENCY OF THE FORMER REDEVELOPMENT AGENCY (CONTINUED)
c. Long-Term Debt (Continued)
Bonds maturing in the years 2031 are current interest bonds payable August 1 in one installment of $4,315,000, while bonds maturing in the years 2013 to 2036, are capital appreciation bonds payable August 1 in annual installments of $28,489 to $1,958,307. The Series A Capital Appreciation Bonds maturing on August 1, 2025 and August 1, 2034 are subject to special mandatory redemption in whole by the Agency on July 1, 2025 and May 15, 2034, respectively, at redemption price equal to 100 percent of the accreted value of the Series A Capital Appreciation Bonds to be redeemed, without premium. The current interest bonds maturing on August 1, 2031, are subject to redemption in whole or in part at the option of the Agency from any available source of funds. The capital appreciation bonds maturing on or after August 1, 2022, are subject to redemption in whole or in part at the option of the Agency, from any available source of funds. The current interest bonds bear interest at 5.00% due February 1 and August 1, of each year. The capital appreciation bonds have a face value of $57,725,000. By their nature, there is no regular interest payments associated with capital appreciation bonds. The "interest" on the debt results from the difference between the amounts paid by the investors when the debt was issued and the significantly larger value at maturity. The $57,725,000 of face value capital appreciation bonds were initially recorded at the amount of proceeds received, $14,524,323. Each year, the outstanding balance is increased for the accretion of interest associated with the bonds. Series A bonds are secured by a pledge of and lien on all the surplus tax revenues. The bonds are further secured by a required cash reserve of $1,883,932 deposited with the trustee. As of June 30, 2017, the reserve was $1,930,234.
Bond payments are secured by a first pledge on all of the tax revenues on parity with 2003 and 2013 bonds. The outstanding balance at June 30, 2017, was $25,837,733.
2011 Taxable Tax Allocation Housing Bonds, Series B
In June 2011, the former Brea Redevelopment Agency issued $10,295,000 principal amount of Brea Redevelopment Agency 2011 Taxable Tax Allocation Housing Bonds, Series B. The proceeds were used to: 1) finance projects in the Agency’s low and moderating income housing program of benefit to the project area, 2) fund a reserve account, and 3) pay costs of issuance. Series B bonds consist of $5,045,000 serial bonds maturing in the years 2013 to 2025, payable August 1 in remaining annual installments of $100,000 to $1,735,000. The bonds bear interest at 2.126% to 6.862%. Bonds maturing in the year 2026 to 2029, in the amount of $5,250,000 are term bonds and bear interest at 7.392%. The Series B Bonds maturing on August 1, 2025 are subjected to special mandatory redemption in whole by the Agency on July 1, 2025, at redemption price equal to 100 percent of the principal amount, together with accrued interest, without premium.

CITY OF BREA, CALIFORNIA
NOTES TO BASIC FINANCIAL STATEMENTS JUNE 30, 2017
87
NOTE 17 – SUCCESSOR AGENCY OF THE FORMER REDEVELOPMENT AGENCY (CONTINUED)
c. Long-Term Debt (Continued)
Serial bonds maturing on or after August 1, 2022, are subject to redemption in whole or in part at the option of the Agency from any available source of funds. Term bonds are subject to mandatory redemption in part by lot on August 1, 2026, August 1, 2027, August 1, 2028 and August 1, 2029, in the amount of $1,410,000, $1,515,000 $1,625,000, $700,000, respectively, from sinking fund payments made by the Agency. Series B bonds are secured by a pledge of and lien on housing tax revenues. The bonds are further secured by a required cash reserve of $1,029,500 deposited with the trustee. As of June 30, 2017, the reserve was $1,033,643. Bond payments are secured by a first pledge on all of the tax revenues on parity with 2003 and 2013 bonds. The outstanding balance at June 30, 2017, was $9,940,000.
2013 Tax Allocation Refunding Bonds
In December 2013, the Successor Agency to the Brea Redevelopment Agency issued its $96,620,000 Successor Agency to the Brea Redevelopment Agency Redevelopment Project AB 2013 Tax Allocation Refunding Bonds to refund the outstanding balance of the Brea Redevelopment Agency 2001 Tax Allocation Refunding Bonds, Series A in the amount of $36,205,000 and to refund the current interest bonds and term bonds outstanding of the 2003 Tax Allocation Bonds in the amount of $68,390,000. Upon issuance of the 2013 Bonds, a portion of the sale proceeds of the 2013 Bonds was transferred to the 2001A Escrow Fund and to the 2003 Escrow Fund. On the Redemption Date, moneys deposited in the Escrow Funds were used to pay the redemption price for the Refunded Bonds. The difference between the reacquisition price and carrying value of the refunded debt resulted in a deferred loss on refunding. The balance as of June 30, 2017 of $1,144,217 is reported as a deferred outflow of resources, and will be amortized over the life of the new debt as a component of interest expense. Bonds Maturing in the years 2014 to 2026 are payable in August 1, of each year with annual installments ranging from $1,500,000 to $8,595,000. The remaining interest rates on the bonds was 5.00%. A financial guaranty insurance policy has been issued and, accordingly, no cash reserve balance is required. Bond payments are secured by a first pledge on all tax revenues on parity with the 2003 and 2011 Tax Allocation Bonds. The outstanding balance at June 30, 2017, was $74,880,000.

CITY OF BREA, CALIFORNIA
NOTES TO BASIC FINANCIAL STATEMENTS JUNE 30, 2017
88
NOTE 17 – SUCCESSOR AGENCY OF THE FORMER REDEVELOPMENT AGENCY (CONTINUED)
c. Long-Term Debt (Continued)
2016 Tax Allocation Refunding Bonds, Series A and B
In November 2016, the Successor Agency to the Brea Redevelopment Agency issued its 2016 Tax Exempt Tax Allocation Refunding Bonds, Series A and 2016 Taxable Tax Allocation Refunding Bonds, Series B in the amount of $10,425,000 and $1,540,000 respectively. The proceeds of the bonds were used to currently refund the Public Financing Authority’s outstanding 2008 Tax Exempt Tax Allocation Revenue Bonds, Series A in the amount of $12,260,000 and to advance refund the outstanding 2008 Tax Allocation Revenue Bonds, Series B in the amount of $1,450,000. As of June 30, 2017, the 2008 Tax Allocation Revenue Bonds, Series B balance outstanding was $1,450,000, but considered legally defeased for financial reporting purposes. The difference between the reacquisition price and carrying value of the refunded debt is reported as a deferred outflow of resources as of June 30, 2017 totaling $542,921. This amount will be amortized over the life of the refunded debt, as a component of interest expense. The refunding provided for a cumulative savings of $3,634,966 over the life of the bonds, resulting in an economic gain of $3,353,905 net of other funds to fund the redemption, or 27.4 percent of the refunded principal. The Series A Serial Bonds totaling $10,425,000 have principal repayments ranging from $915,000 to $1,150,000 with interest rates ranging from 2.00% to 4.00%. The outstanding balance at June 30, 2017 was $10,425,000. The Series B Serial Bonds totaling $1,540,000 have principal repayment ranging from $145,000 to $165,000 with interest rates ranging from 1.25% to 3.00%. The outstanding balance at June 30, 2017 was $1,540,000. A financial guaranty insurance policy has been issued and, accordingly, no cash reserve balance is required. The debt service schedules of these Tax Allocation Bonds are as follows:
Year Ending June 30, Principal Interest Total
Payment 2018 8,628,018$ 5,579,068$ 14,207,086$ 2019 8,846,493 5,092,285 13,938,778 2020 9,087,692 4,697,715 13,785,407 2021 9,494,745 4,278,818 13,773,563 2022 9,921,267 3,843,419 13,764,686
2023 - 2027 55,369,101 16,655,297 72,024,398 2028 - 2032 37,283,137 19,877,462 57,160,599 2033 - 2037 12,442,698 25,493,385 37,936,083
Total 151,073,151$ 85,517,449$ 236,590,600$

CITY OF BREA, CALIFORNIA
NOTES TO BASIC FINANCIAL STATEMENTS JUNE 30, 2017
89
NOTE 17 – SUCCESSOR AGENCY OF THE FORMER REDEVELOPMENT AGENCY (CONTINUED) c. Long-Term Debt (Continued)
Pledged Revenues – Tax Allocation Bonds
The Successor Agency pledged, as security for bonds issued, either directly or through the Financing Authority, a portion of tax increment revenue (including Low and Moderate Income Housing set-aside and pass through allocations) that it receives. The bonds issued were to provide financing for various capital projects, accomplish Low and Moderate Income Housing projects and to defease previously issued bonds. Assembly Bill X1 26 provided that upon dissolution of the Redevelopment Agency, property taxes allocated to redevelopment agencies no longer are deemed tax increment but rather property tax revenues and will be allocated first to successor agencies to make payments on the indebtedness incurred by the dissolved redevelopment agency. Total principal and interest remaining on the debt is $236,590,600, with annual debt service requirements as indicated above. For the current year, the total property tax revenue recognized by the Successor Agency for the payment of indebtedness incurred by the dissolved redevelopment agency was $18,131,944 and the debt service obligation was $14,541,063.
Refunding Lease Revenue Bonds
2004 Refunding Lease Revenue Bonds
The $4,330,000 principal amount of the 2004 Refunding Lease Revenue Bonds was issued by the Brea Public Financing Authority in November 2004, to advance refund the Brea Public Financing Authority’s 1995 Lease Revenue Bonds.
Bonds maturing in the years 2005 to 2021 are serial bonds payable in remaining annual installments ranging from $295,000 to $345,000. The bonds bear remaining interest of 3.875% to 4.500%. Bonds maturing on or after July 1, 2015, may be called before maturity and redeemed at the option of the Authority in whole or in part on any date after July 1, 2014, at a redemption price equal to 100% of the principal amount of the bonds redeemed. Bonds are payable from the lease payments to be made by the City of Brea for the subleasing of certain real property pursuant to a lease agreement dated November 1, 2004. A financial guarantee insurance policy has been issued, and accordingly, no cash reserve balance is required to be established. Simultaneously, the City and the Agency entered into the Fourth Supplement to the Amended and Restated Reimbursement Agreement. The outstanding balance at June 30, 2017, was $1,595,000.
2010 Refunding Lease Revenue Bonds
The $9,460,000 principal amount of the 2010 Refunding Lease Revenue Bonds was issued by the Brea Public Financing Authority in December 2010, to refund the Brea Public Financing Authority’s 1998 Lease Revenue Refunding Bonds. Bonds maturing in the years 2011 to 2021 are serial bonds payable in remaining annual installments ranging from $870,000 to $1,015,000. The bonds bear interest at 2% to 4%, due semi-annually on January 1 and July 1. Bonds maturing on July 1, 2021, may be redeemed at the option of the Authority in whole or in part on any date after July 1, 2020, at a redemption price equal to 100% of the principal amount of the bonds redeemed.

CITY OF BREA, CALIFORNIA
NOTES TO BASIC FINANCIAL STATEMENTS JUNE 30, 2017
90
NOTE 17 – SUCCESSOR AGENCY OF THE FORMER REDEVELOPMENT AGENCY (CONTINUED) d. Long-Term Debt (Continued)
Bonds are payable from the lease payments to be made by the City of Brea for the right to use and occupy certain property pursuant to a lease agreement dated December 1, 1998, and further amended by Amended and Restated Sublease Agreement dated December 1, 2010. Simultaneously, the City and the Agency entered into the Fourth Supplement to the Amended and Restated Reimbursement Agreement.
The outstanding balance at June 30, 2017, was $4,710,000. The debt service schedules of these Lease Revenue Bonds are as follows:
Year Ending June 30, Principal Interest Total
Payment 2018 1,165,000$ 229,611$ 1,394,611$ 2019 1,210,000 182,484 1,392,484 2020 1,260,000 133,275 1,393,275 2021 1,310,000 81,669 1,391,669 2022 1,360,000 27,631 1,387,631 Total 6,305,000$ 654,670$ 6,959,670$
Pledged Revenues – Lease Refunding Bonds
The Successor Agency pledged, as security for the lease revenue bonds issued, direct General Fund contribution and indirect tax increment revenue via a lease reimbursement agreement. The bonds issued were to defease previously issued bonds. Assembly Bill X1 26 provided that upon dissolution of the Redevelopment Agency, property taxes allocated to redevelopment agencies no longer are deemed tax increment but rather property tax revenues and will be allocated first to successor agencies to make payments on the indebtedness incurred by the dissolved redevelopment agency. Total principal and interest remaining on the debt is $6,959,670 with annual debt service requirements as indicated above. For the current year, the General Fund contribution was $1,394,769 and total property tax revenue recognized by the Successor Agency for the payment of indebtedness incurred by the dissolved redevelopment agency was $18,131,944. The debt service obligation on the lease revenue bonds for the current year was $1,394,769.
Multifamily Housing Revenue Bonds
In July 2010, the Agency on behalf of Tonner Hills Housing Partners, LP (the “Borrower”), was authorized to issue $5,858,319 and $7,741,681 Brea Redevelopment Agency Multifamily Housing Revenue Bonds (Tonner Hills Apartment Homes) 2010 Series A-1 and A-2, respectively, for the purpose of providing funding necessary for the acquisition, construction and equipping of a 94-unit multifamily rental housing project in the City. The Agency and the Borrower also entered into a non-interest bearing loan agreement in amount of $1,200,000 (See Note 5). These bonds are not the obligations of the Agency and will be paid solely from future rent revenue. The outstanding balance is determined when a construction draw requisition is submitted to the bank for payment, limited up to the authorized amounts for each of the series. Currently, the bonds are only paying interest to bondholder for debt service payment. When the bonds are converted, then the Borrower will pay principal and interest per bond conversion. The outstanding balance at June 30, 2017, was $3,759,052 and $0 for Series A-1 and Series A-2, respectively.

CITY OF BREA, CALIFORNIA
NOTES TO BASIC FINANCIAL STATEMENTS JUNE 30, 2017
91
NOTE 17 – SUCCESSOR AGENCY OF THE FORMER REDEVELOPMENT AGENCY (CONTINUED)
e. Insurance
The Successor Agency of the former Redevelopment Agency is covered under the insurance policy of the City of Brea at June 30, 2017.
f. Other Significant Commitments
Owner Participation Agreement
In 1987, the Brea Redevelopment Agency entered into an owner participation agreement with the owners of the Brea Mall. This agreement obligates the Agency to pay the owners 80% of the tax increment revenues generated by the Brea Mall above the 1987-1988 base year tax increment, plus $15,000. The agreement's term is for 33 years beginning the year ended June 30, 1990. The tax increment revenue sharing payments are senior to bond payments. The amount paid by the Agency as a result of this agreement for the fiscal year ended June 30, 2017, was $1,575,641. Future minimum payments for the next 5 years are estimated as follows:
Year Ending June 30, Amount
2018 1,581,169$ 2019 1,626,662 2020 1,673,065 2021 1,720,395 2022 1,768,673 Total 8,369,964$
g. Deficit Net Position
As of June 30, 2017, the Agency had a deficit net position of $132,923,573. This will be reduced with future receipt of distributions from the Redevelopment Property Tax Trust Fund from the County.
NOTE 18 – SUBSEQUENT EVENTS
On November 1, 2017, the Successor Agency to the Brea Redevelopment Agency issued 2017 Tax Allocation Refunding Bonds, Series A and B, in the amount of $32,838,802 and $13,070,000 respectively. The proceeds were used to refunding the current interest bonds for the 2003 Tax Allocation Refunding Bonds and the entire remaining amounts for the 2011 Tax Allocation Revenue Bonds, Series A and B. On November 15, 2017, the City issued on behalf of the City of Brea Community Facilities District No. 2008-2, $8,555,000 of 2017 Special Tax Refunding Bonds, which are special assessment district debt, not debt of the City. The proceeds were used to refund the City of Brea Community Facilities District No. 2008-2 2009 Special Tax Bonds.
In October 2017, the Successor Agency sold a property in the amount of $800,000 to the City of Brea. The property was purchased by the City from resources within the Housing Successor Fund.

92
This page intentionally left blank.

REQUIRED SUPPLEMENTARY INFORMATION

This page intentionally left blank.

CITY OF BREA, CALIFORNIA
MISCELLANEOUS PLAN SCHEDULE OF CHANGES IN THE NET
PENSION LIABILITY AND RELATED RATIOS LAST TEN YEARS* AS OF JUNE 30, 2017
93
2017 2016 2015Total Pension Liability
Service cost 2,046,427$ 2,062,984$ 2,192,940$ Interest on the total pension liability 9,044,787 8,692,445 8,386,263 Differences between actual and expected experience (950,961) (1,784,268) - Changes in assumptions - (2,142,611) - Benefit payments, including refunds of employee contributions (5,294,666) (5,086,167) (4,468,721)
Net change in total pension liability 4,845,587 1,742,383 6,110,482 Total pension liability- beginning 120,807,599 119,065,216 112,954,734 Total pension liability- ending (a) 125,653,186$ 120,807,599$ 119,065,216$
Plan fiduciary net positionContributions- employer 2,403,298$ 2,132,083$ 1,969,185$ Contributions- employee 1,071,389 1,087,960 1,140,919 Net investment income 510,663 2,130,803 14,101,824 Benefit payments, including refunds of employee contributions (5,294,666) (5,086,167) (4,468,721) Administrative expense (57,456) (106,071) -
Net change in plan fiduciary net position (1,366,772) 158,608 12,743,207 Plan fiduciary net position- beginning 94,276,177 94,117,569 81,374,362 Plan fiduciary net position- ending (b) 92,909,405$ 94,276,177$ 94,117,569$
Net pension liability- ending (a) - (b) 32,743,781$ 26,531,422$ 24,947,647$
Plan fiduciary net position as a percentage of the total pension liability 73.94% 78.04% 79.05%
Covered payroll 15,474,119$ 15,043,603$ 14,843,300$
Net pension liability as percentage of covered payroll 211.60% 176.36% 168.07%
Measurement Period June 30, 2016 June 30, 2015 June 30, 2014
* Fiscal year 2015 was the 1st year of implementation, therefore only three years are shown.
Covered Payroll: In accordance with GASB Statement No. 82, Pension Issues - An Amendment of GASB Statements No. 67, No. 68, and No. 73, covered payroll ave been restated to show covered payroll based on pensionable earnings.
Changes of Assumptions: In 2016 there were no changes. In 2015, amounts reported reflect an adjustment of the discount rate from 7.5 % (net of administrative expense) to 7.65% (without a reduction for pension plan administrative expense). In 2014, amounts reported were based on the 7.5% discount rate.
Benefits Changes: The figures above do not include any liability impact that may have resulted from plan changes that occurred after the June 30, 2015 valuation date. This applies to voluntary benefit changes as well as any other offers of Two Years' Additional Service Credit (a.k.a. Golden Handshakes).

CITY OF BREA, CALIFORNIA
SAFETY PLAN SCHEDULE OF CHANGES IN THE NET PENSION
LIABILITY AND RELATED RATIOS LAST TEN YEARS* AS OF JUNE 30, 2017
94
2017 2016 2015Total Pension Liability
Service cost 2,745,588$ 2,865,433$ 3,080,297$ Interest 16,654,242 16,223,231 15,749,580 Difference Between expected and Actual Experience (2,403,349) (2,307,435) - Changes in Assumptions - (3,994,113) - Benefit payments, including refunds of employee contributions (11,396,941) (10,585,623) (10,108,174)
Net change in total pension liability 5,599,540 2,201,493 8,721,703 Total pension liability- beginning 224,431,525 222,230,032 213,508,329 Total pension liability- ending (a) 230,031,065$ 224,431,525$ 222,230,032$
Plan fiduciary net positionContributions- employer 4,627,179$ 3,591,767$ 3,655,839$ Contributions- employee 973,955 1,084,088 1,024,137 Net investment income 746,473 3,517,885 24,058,889 Benefit payments, including refunds of employee contributions (11,396,941) (10,585,623) (10,108,174) Adminstrative expenses (95,259) (175,877) -
Net change in plan fiduciary net position (5,144,593) (2,567,760) 18,630,691 Plan fiduciary net position- beginning 156,303,305 158,871,065 140,240,374 Plan fiduciary net position- ending (b) 151,158,712$ 156,303,305$ 158,871,065$
Net pension liability- ending (a) - (b) 78,872,353$ 68,128,220$ 63,358,967$
Plan fiduciary net position as a percentage of the total pension liability 65.71% 69.64% 71.49%
Covered payroll** 10,168,516$ 9,980,447$ 9,919,059$
Net pension liability as percentage of covered payroll 775.65% 682.62% 638.76%
Measurement Period June 30, 2016 June 30, 2015 June 30, 2014
* Fiscal year 2015 was the 1st year of implementation, therefore only three years are shown.
Changes of Assumptions: In 2016 there were no changes. In 2015, amounts reported reflect an adjustment of the discount rate from 7.5 % (net of administrative expense) to 7.65% (without a reduction for pension plan administrative expense). In 2014, amounts reported were based on the 7.5% discount rate.
Benefits Changes: The figures above do not include any liability impact that may have resulted from plan changes that occurred after the June 30, 2015 valuation date. This applies to voluntary benefit changes as well as any other offers of Two Years' Additional Service Credit (a.k.a. Golden Handshakes).
**Covered Payroll: In accordance with GASB Statement No. 82, Pension Issues - An Amendment of GASB Statements No. 67, No. 68, and No. 73, covered payroll have been restated to show covered payroll based on pensionable earnings.

CITY OF BREA, CALIFORNIA
SCHEDULE OF PLAN CONTRIBUTIONS LAST TEN YEARS*
FOR THE YEAR ENDED JUNE 30, 2017
95
2017 2016 2015 2014
Miscellaneous PlanActuarially determined contributions 2,279,397$ 2,403,298$ 2,132,083$ 1,969,185$ Contributions in relation to the actuarially determined contribution (2,279,397) (2,403,298) (2,132,083) (1,969,185) Contribution deficiency (excess) - - - -
Covered payroll** 16,716,903 15,474,119 15,043,603 14,843,300
Contributions as a percentage of covered payroll 13.64% 15.53% 14.17% 13.27%
2017 2016 2015 2014
Safety PlanActuarially determined contributions 5,863,082$ 4,627,179$ 3,591,767$ 3,655,839$ Contributions in relation to the actuarially determined contribution (5,863,082) (4,627,179) (3,591,767) (3,655,839) Contribution deficiency (excess) - - - -
Covered payroll** 10,703,998 10,168,516 9,980,447 9,919,059
Contributions as a percentage of covered payroll 54.77% 45.50% 35.99% 36.86%
* Fiscal year 2015 was the 1st year of implementation, therefore only four years are shown.
Notes to Schedule: Miscellaneous and Safety Plans
Valuation Date:The actuarial methods and assumptions used to set the actuarially determined contribution for FY 2016-17 were from the June 30, 2014 funding valuation report.
Actuarial cost method Entry Age Normal Cost MethodAmortization method Level percent of payrollAsset valuation method Market valueInflation 2.75%Salary increases Varies by Entry Age and ServicePayroll Growth 3.00%Investment Rate of Return 7.5%, net of pension plan investment and administrative expenses, including inflation
Retirement ageMortaliaty
Note:
The probabilities of Retirement are based on the 2010 CalPERS Experience Study for the period from 1997 to 2007The probabilities of mortality are based on the 2010 CalPERS Experience Study for the period from 1997 to 2007. Pre-retirement and Post-retirement mortality rates include 5 years of projected mortality improvement using Scale AA published by the Society of Actuaries.
**Covered Payroll : In accordance with GASB Statement No. 82, Pension Issues - An Amendment of GASB Statements No. 67, No. 68, and No. 73, covered payroll have been restated to show covered payroll based on pensionable earnings.

CITY OF BREA, CALIFORNIA
OTHER POST-EMPLOYMENT BNEFIT PLAN SCHEDULE OF FUNDING PROGRESS FOR THE YEAR ENDED JUNE 30, 2017
See accompanying note to required supplementary information.
96
Actuarial UAAL as aActuarial Accrued Unfunded Percentage of
Actuarial Value of Liability AAL Funded Covered CoveredValuation Assets (AAL) (UAAL) Ratio Payroll Payroll
Date (a) (b) (b-a) (a/b) ( c ) (b-a)/c)
6/30/2011 -$ 18,197,000$ 18,197,000$ 0.0% 24,983,000$ 72.80%6/30/2013 - 20,560,000 20,560,000 0.0% 26,674,000 77.10%6/30/2015 - 27,256,000 27,256,000 0.0% 25,182,000 108.24%
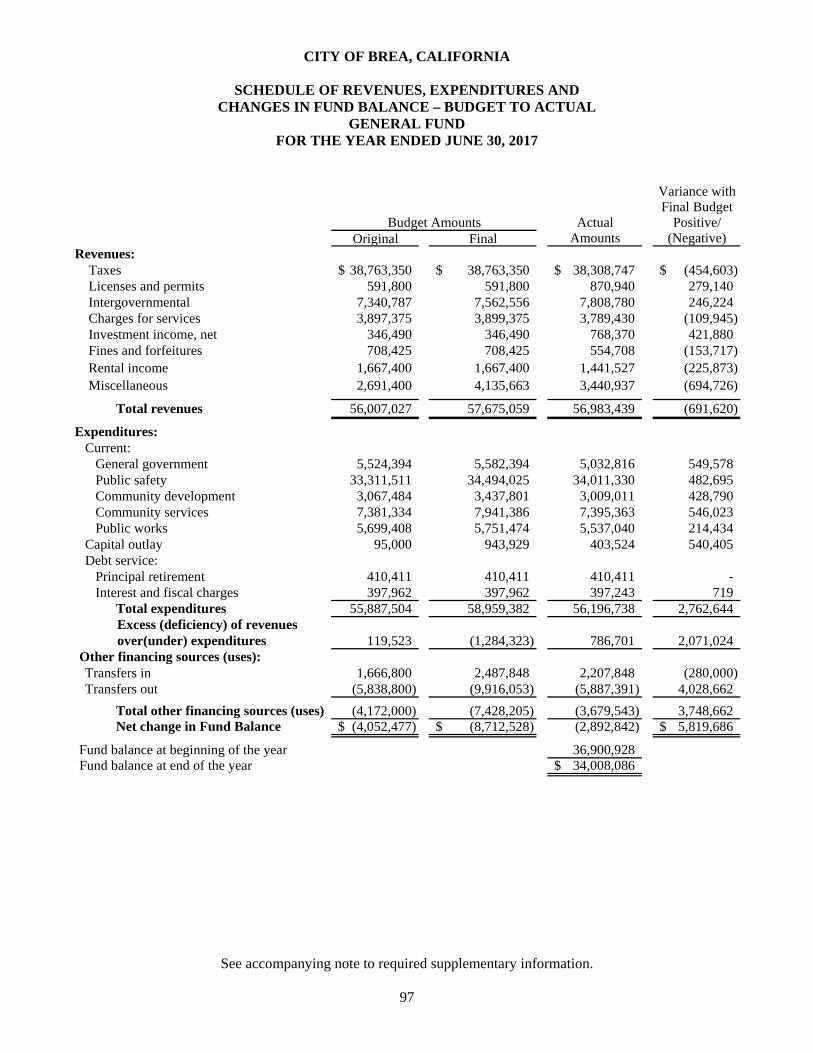
CITY OF BREA, CALIFORNIA
SCHEDULE OF REVENUES, EXPENDITURES AND CHANGES IN FUND BALANCE – BUDGET TO ACTUAL
GENERAL FUND FOR THE YEAR ENDED JUNE 30, 2017
See accompanying note to required supplementary information.
97
Variance withFinal Budget
Actual Positive/Original Final Amounts (Negative)
Revenues: Taxes 38,763,350$ 38,763,350$ 38,308,747$ (454,603)$ Licenses and permits 591,800 591,800 870,940 279,140
Intergovernmental 7,340,787 7,562,556 7,808,780 246,224 Charges for services 3,897,375 3,899,375 3,789,430 (109,945) Investment income, net 346,490 346,490 768,370 421,880
Fines and forfeitures 708,425 708,425 554,708 (153,717) Rental income 1,667,400 1,667,400 1,441,527 (225,873) Miscellaneous 2,691,400 4,135,663 3,440,937 (694,726)
Total revenues 56,007,027 57,675,059 56,983,439 (691,620)
Expenditures:Current:
General government 5,524,394 5,582,394 5,032,816 549,578 Public safety 33,311,511 34,494,025 34,011,330 482,695 Community development 3,067,484 3,437,801 3,009,011 428,790 Community services 7,381,334 7,941,386 7,395,363 546,023 Public works 5,699,408 5,751,474 5,537,040 214,434
Capital outlay 95,000 943,929 403,524 540,405 Debt service:
Principal retirement 410,411 410,411 410,411 - Interest and fiscal charges 397,962 397,962 397,243 719
Total expenditures 55,887,504 58,959,382 56,196,738 2,762,644 Excess (deficiency) of revenues over(under) expenditures 119,523 (1,284,323) 786,701 2,071,024 Other financing sources (uses):Transfers in 1,666,800 2,487,848 2,207,848 (280,000) Transfers out (5,838,800) (9,916,053) (5,887,391) 4,028,662
Total other financing sources (uses) (4,172,000) (7,428,205) (3,679,543) 3,748,662 Net change in Fund Balance (4,052,477)$ (8,712,528)$ (2,892,842) 5,819,686$
Fund balance at beginning of the year 36,900,928 Fund balance at end of the year 34,008,086$
Budget Amounts

CITY OF BREA, CALIFORNIA
SCHEDULE OF REVENUES, EXPENDITURES AND CHANGES IN FUND BALANCE – BUDGET TO ACTUAL
HOUSING SUCCESSOR FUND FOR THE YEAR ENDED JUNE 30, 2017
See accompanying note to required supplementary information.
98
Variance with
Final Budget
Positive/Original Final Amounts (Negative)
Revenues:Investment income, net 51,000$ 51,000$ 322,507$ 271,507$ Other revenues 1,779,287 1,779,287 1,867,260 87,973
Total revenues 1,830,287 1,830,287 2,189,767 359,480
Expenditures:Community Development 285,812 285,812 277,504 8,308
Net change in Fund Blanace 1,544,475$ 1,544,475$ 1,912,263 367,788$
Fund balance at beginning of the year 18,750,601 Fund balance at end of the year 20,662,864$
Budget Amounts

CITY OF BREA, CALIFORNIA
NOTE TO REQUIRED SUPPLEMENTARY INFORMATION YEAR ENDED JUNE 30, 2017
99
Budget Information
General Budget Policies
The City adheres to the following procedures in establishing the budgetary data reflected in its financial statements: 1. In May of each year, the City Manager submits to the City Council a proposed financial plan with an
annual operating budget for the upcoming fiscal year commencing July 1. The operating budget includes proposed expenditures and the sources of financing.
2. Public hearings are conducted at City Council meetings to obtain taxpayer comments. 3. On or before July 1, the financial plan for the fiscal year is adopted by Council action.
4. The City Manager is authorized to transfer funds appropriated with respect to those classifications
designated as other services and material and supplies within the same department. The City Manager may transfer appropriated funds from any classification within other expenditure categories to the capital outlay classification within the same department only; however, any revisions that alter the total expenditures of any department must be approved by the City Council. Activities of the General Fund, Special Revenue Funds, Capital Projects Funds and Debt Service Funds are included in the annual appropriated budget. As an additional internal control mechanism, project-length financial plans are adopted for the Capital Improvement Program.
5. Formal budgetary integration is employed as a management control device during the year for the governmental funds.
6. Legally adopted budgets for all governmental funds are established on a basis consistent with
generally accepted accounting principles (GAAP). For the current fiscal year, the HOME Program special revenue fund had no adopted budget.
Excess of Expenditures Over Appropriation
For purposes of evaluating legal compliance at the budgetary level of control (that is, the level at which expenditures cannot legally exceed the appropriated amount), control is established at the department level within the General Fund and at the fund level for total expenditures and transfers out for all other budgeted funds.

100
The page intentionally left blank.

SUPPLEMENTARY INFORMATION

The page intentionally left blank.

101
MAJOR CAPITAL PROJECTS FUNDS Capital Projects Funds Capital Improvements Fund The Capital Improvements Fund is used to account for the costs of constructing street improvements, parks and other public improvements not normally included within the other Capital Projects Funds. Financing is provided by Federal and State Grant Revenues and interfund transfers from the Special Revenue Funds and General Fund.

102
This page intentionally left blank.

CITY OF BREA, CALIFORNIA
SCHEDULE OF REVENUES, EXPENDITURES AND CHANGES IN FUND BALANCE – BUDGET AND ACTUAL
CAPITAL IMPROVEMENTS FUND YEAR ENDED JUNE 30, 2017
103
Variance with
Final BudgetActual Positive/
Original Final Amounts (Negative)
Revenues:Intergovernmental 13,000,561$ 13,447,655$ 533,669$ (12,913,986)$ Charges for services 337,000 337,000 1,521,150 1,184,150 Investment income, net 200,000 200,000 8,186 (191,814)
Developer contributions 1,738,892 1,488,892 535 (1,488,357)
Other revenues - 571,230 14,303 (556,927)
Total revenues 15,276,453 16,044,777 2,077,843 (13,966,934)
Expenditures:
Current:General government 350,502 350,502 561,790 (211,288)
Capital Outlay 40,212,827 49,843,161 14,404,865 35,438,296 Total expenditures 40,563,329 50,193,663 14,966,655 35,227,008
Excess (deficiency) of revenues over(under) expenditures (25,286,876) (34,148,886) (12,888,812) 21,260,074
Other financing sources (uses): Transfers in 17,625,873 24,444,048 7,874,546 (16,569,502) Net change in fund balance (7,661,003)$ (9,704,838)$ (5,014,266) 4,690,572$
Fund balance at beginning of the year 14,019,775 Fund balance at end of the year 9,005,509$
Budget Amounts

104
NON-MAJOR GOVERNMENTAL FUNDS Non-major Special Revenue Funds Special revenue funds are used to account for and report the proceeds of specific revenue sources that are restricted or committed to expenditures for specified purposes other than debt services or capital projects. The City of Brea has the following non-major Special Revenue Funds: Gas Tax Fund This fund is used to account for revenues received and expenditures made for street improvements and street maintenance. Financing is provided by the City’s share of state gasoline taxes made pursuant to the California State Constitution and authorized by the State Legislature. Narcotics Enforcement Asset Seizure Fund This fund is used to account for revenues seized by the Police Department during narcotic investigations. Air Quality Improvement Fund This fund is used to account for revenues received from vehicle registration fees and restricted for improvement of air quality. Park Development Fund This fund is used to account for revenues received and expenditures made for park development and improvement. The primary source of revenue is park development fees collected from developers under the State of California’s Quimby Act. Measure M Fund This fund is used to account for ½ cent sales tax restricted for expenditure for road maintenance and street expenditures. Affordable Housing Trust Fund This fund is used to account for revenues received and expenditures made for the development of low to moderate income housing. The primary source of revenue is fees collected from developers. Community Development Block Grant Fund This fund is used to account for the revenues received and expenditures made for the City’s Community Development Block Grant Program. Financing is provided under an agreement with the County of Orange whereby the City is a secondary recipient of funds made available from the U.S. Department of Housing and Urban Development under the Housing and Community Development Act of 1974 and 1977.

105
Non-major Special Revenue Funds (Continued) HOME Program Fund This fund is used for the revenues received and expenditures made for housing rehabilitation. Financing is provided under an agreement with the County of Orange whereby the City is a secondary recipient of funds made available from the U.S. Department of Housing and Urban Development. Blackstone Community Facilities District 2008-1 Fund The fund is used to account for the collection of special taxes and expenditure for police, fire, maintenance and general city services including park maintenance and open space. La Floresta Community Facilities District 2011-1 Fund This fund is used to account for the collection of special taxes and expenditure for police, fire, maintenance and general city services. Taylor Morrison Community Facilities District 2013-1 Fund This fund is used to account for the collection of special taxes and expenditures for police, fire, maintenance and general city services. Non-major Capital Projects Funds Capital projects funds are used to account for and report financial resources that are restricted, committed, or assigned to expenditures for capital outlays, including the acquisition or construction of capital facilities and other assets. The City of Brea has the following non-major Capital Projects Funds: Capital and Mitigation Improvement Fund This fund is used to account for the revenues received and expenditures made for the City Council-designated Capital Improvement projects, as well as the implementation of measures designed to mitigate impacts related to development, and the operation of government facilities, including, but not limited to: traffic, noise, aesthetics, and open space preservation. Financing is provided by the July 14, 2009 Agreement between the City and County of Orange regarding the extension of the Olinda Alpha Landfill. Storm Drain Fund This fund is used to account for the financing and construction of storm drains throughout the City. Financing is provided by storm drain assessment fees. Midbury Assessment Authority Fund This fund is used to account for the collection and payment of neighborhood street improvements.

CITY OF BREA, CALIFORNIA
COMBINING BALANCE SHEET NON-MAJOR GOVERNMENTAL FUNDS
JUNE 30, 2017
106
NarcoticsEnforcement Air Quality Park
Gas Tax Asset Seizure Improvement DevelopmentAssets:
Cash and investments 1,335,665$ 180,217$ 220,436$ 914,492$ Receivables: Taxes - - - - Accounts - - - - Due from other funds Notes and loans - - - - Due from other governments - 8,119 14,189 - Advances to other funds - - - -
Total assets 1,335,665$ 188,336$ 234,625$ 914,492$
Liabilities, deferred inflows of resources and fund balances
Liabilities: Accounts payable -$ -$ -$ -$ Accrued liabilities - - - - Due to other governments - - - - Due to other funds - - - - Advances to other funds - - - -
Total liabilities - - - -
Deferred Inflows of Resources: Unavailable revenues - - - -
Fund balances (deficit):Restricted:
Community development projects - - - - Public safety - 188,336 - - Public works 1,335,665 - 234,625 - Capital projects - - - 914,492
Unassigned - - - -
Total fund balances (deficit) 1,335,665 188,336 234,625 914,492
Total liabilities, deferred inflows of resources and fund balances 1,335,665$ 188,336$ 234,625$ 914,492$
Special Revenue Funds

107
Assets:Cash and investmentsReceivables: Taxes AccountsDue from other funds Notes and loansDue from other governmentsAdvances to other funds
Total assets
Liabilities, deferred inflows of resources and fund balances
Liabilities: Accounts payable Accrued liabilities Due to other governments Due to other funds Advances to other funds
Total liabilities
Deferred Inflows of Resources: Unavailable revenues
Fund balances (deficit):Restricted:
Community development projectsPublic safetyPublic worksCapital projects
Unassigned
Total fund balances (deficit)
Total liabilities, deferred inflows of resources and fund balances
CommunityAffordable Development HOME
Measure M Housing Trust Block Grant Program
1,967,277$ 2,246,297$ 51,519$ -$
- - - - - - - -
- 213,000 1,598,500 35,241 166,743 - 2,692 -
- - - -
2,134,020$ 2,459,297$ 1,652,711$ 35,241$
-$ -$ 58,320$ -$ 633 - - -
- - 1,598,809 35,241 - - - - - - - -
633 - 1,657,129 35,241
- - 2,692 -
- 2,459,297 - - - - - -
2,133,387 - - - - - - - - - (7,110) -
2,133,387 2,459,297 (7,110) -
2,134,020$ 2,459,297$ 1,652,711$ 35,241$
Special Revenue Funds
Continued

CITY OF BREA, CALIFORNIA
COMBINING BALANCE SHEET NON-MAJOR GOVERNMENTAL FUNDS
JUNE 30, 2017
108
Assets:Cash and investmentsReceivables: Taxes AccountsDue from other funds Notes and loansDue from other governmentsAdvances to other funds
Total assets
Liabilities, deferred inflows of resources and fund balances
Liabilities: Accounts payable Accrued liabilities Due to other governments Due to other funds Advances to other funds
Total liabilities
Deferred Inflows of Resources: Unavailable revenues
Fund balances (deficit):Restricted:
Community development projectsPublic safetyPublic worksCapital projects
Unassigned
Total fund balances (deficit)
Total liabilities, deferred inflows of resources and fund balances
Blackstone La Floresta Taylor -CFD CFD Morrison CFD
2,231,844$ 147,431$ 85,967$
16,677 3,139 85 1,217 - -
- - - - - - - - -
2,249,738$ 150,570$ 86,052$
3,003$ -$ -$ 7,986 3,016 -
- - - - - - - - -
10,989 3,016 -
- - -
- - - - - -
2,238,749 147,554 86,052 - - - - - -
2,238,749 147,554 86,052
2,249,738$ 150,570$ 86,052$
Special Revenue Funds

109
Assets:Cash and investmentsReceivables: Taxes AccountsDue from other funds Notes and loansDue from other governmentsAdvances to other funds
Total assets
Liabilities, deferred inflows of resources and fund balances
Liabilities: Accounts payable Accrued liabilities Due to other governments Due to other funds Advances to other funds
Total liabilities
Deferred Inflows of Resources: Unavailable revenues
Fund balances (deficit):Restricted:
Community development projectsPublic safetyPublic worksCapital projects
Unassigned
Total fund balances (deficit)
Total liabilities, deferred inflows of resources and fund balances
TotalCapital and NonmajorMitigation Governmental
Improvement Storm Drain Midbury Funds
4,558,614$ 256,400$ 6,041$ 14,202,200$
- - - 19,901 - - - 1,217
- - - 1,846,741 - - - 191,743
443,788 - - 443,788
5,002,402$ 256,400$ 6,041$ 16,705,590$
-$ -$ -$ 61,323$ - - - 11,635 - - - 1,634,050 - - - - - - 18,203 18,203
- - 18,203 1,725,211
- - - 2,692
- - - 2,459,297 - - - 188,336 - - - 6,176,032
5,002,402 256,400 - 6,173,294 - - (12,162) (19,272)
5,002,402 256,400 (12,162) 14,977,687
5,002,402$ 256,400$ 6,041$ 16,705,590$
Capital Projects Funds

CITY OF BREA, CALIFORNIA
COMBINING STATEMENT OF REVENUES, EXPENDITURES AND CHANGES IN FUND BALANCES
NON-MAJOR GOVERNMENTAL FUNDS FOR THE YEAR ENDED JUNE 30, 2017
110
NarcoticsEnforcement Air Quality Park
Gas Tax Asset Seizure Improvement DevelopmentRevenues:
Taxes -$ -$ -$ -$ Intergovernmental 842,253 - 55,817 - Charges for services - - - 878,367 Investment income, net 758 1,051 (445) (12,747) Fines and forfeitures - 42,768 - - Other revenues - - - -
Total revenues 843,011 43,819 55,372 865,620
Expenditures: Current: General government - - - - Public safety - 224,278 - - Community development - - - - Public works - - - - Total expenditures - 224,278 - -
Excess (deficiency) of revenues over (under) expenditures 843,011 (180,459) 55,372 865,620
Other financing sources (uses):Transfers out (794,702) (1,422) (38,562) (34,452)
Net change in fund balances 48,309 (181,881) 16,810 831,168
Fund balances (deficit), beginning of year 1,287,356 370,217 217,815 83,324
Fund balances (deficit), end of year 1,335,665$ 188,336$ 234,625$ 914,492$
Special Revenue Funds

111
Revenues:
Taxes IntergovernmentalCharges for servicesInvestment income, net Fines and forfeituresOther revenues
Total revenues
Expenditures: Current: General government Public safety Community development Public works Total expenditures
Excess (deficiency) of revenues over (under) expenditures
Other financing sources (uses):Transfers out
Net change in fund balances
Fund balances (deficit), beginning of year
Fund balances (deficit), end of year
CommunityAffordable Development HOME
Measure M Housing Trust Block Grant Program
944,742$ -$ -$ -$ - - 265,750 - - - - -
(419) (260) - - - - - - - 139,750 - -
944,323 139,490 265,750 -
- - - - - - - - - - 184,080 -
20,043 - - - 20,043 - 184,080 -
924,280 139,490 81,670 -
(831,508) - (29,037) -
92,772 139,490 52,633 -
2,040,615 2,319,807 (59,743) -
2,133,387$ 2,459,297$ (7,110)$ -$
Special Revenue Funds
Continued
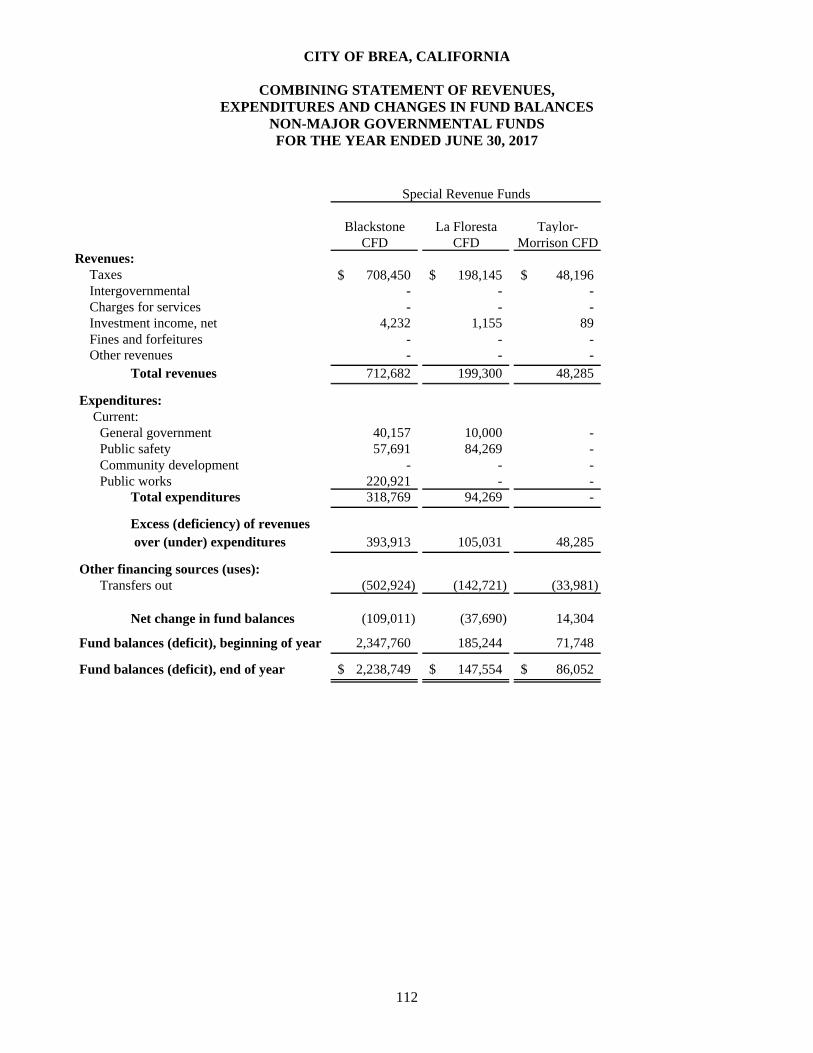
CITY OF BREA, CALIFORNIA
COMBINING STATEMENT OF REVENUES, EXPENDITURES AND CHANGES IN FUND BALANCES
NON-MAJOR GOVERNMENTAL FUNDS FOR THE YEAR ENDED JUNE 30, 2017
112
Revenues:
Taxes IntergovernmentalCharges for servicesInvestment income, net Fines and forfeituresOther revenues
Total revenues
Expenditures: Current: General government Public safety Community development Public works Total expenditures
Excess (deficiency) of revenues over (under) expenditures
Other financing sources (uses):Transfers out
Net change in fund balances
Fund balances (deficit), beginning of year
Fund balances (deficit), end of year
Blackstone La Floresta Taylor-CFD CFD Morrison CFD
708,450$ 198,145$ 48,196$ - - - - - -
4,232 1,155 89 - - - - - -
712,682 199,300 48,285
40,157 10,000 - 57,691 84,269 -
- - - 220,921 - - 318,769 94,269 -
393,913 105,031 48,285
(502,924) (142,721) (33,981)
(109,011) (37,690) 14,304
2,347,760 185,244 71,748
2,238,749$ 147,554$ 86,052$
Special Revenue Funds

113
Revenues:
Taxes IntergovernmentalCharges for servicesInvestment income, net Fines and forfeituresOther revenues
Total revenues
Expenditures: Current: General government Public safety Community development Public works Total expenditures
Excess (deficiency) of revenues over (under) expenditures
Other financing sources (uses):Transfers out
Net change in fund balances
Fund balances (deficit), beginning of year
Fund balances (deficit), end of year
Capital Projects Funds TotalCapital and Nonmajor Mitigation Governmental
Improvement Storm Drain Midbury Funds
-$ -$ 7,694$ 1,907,227$ - - - 1,163,820 - - - 878,367
8,265 44 27 1,750 - - - 42,768
566 - - 140,316 8,831 44 7,721 4,134,248
- - 455 50,612 - - - 366,238 - - - 184,080 - - - 240,964 - - 455 841,894
8,831 44 7,266 3,292,354
(237,169) - - (2,646,478)
(228,338) 44 7,266 645,876
5,230,740 256,356 (19,428) 14,331,811
5,002,402$ 256,400$ (12,162)$ 14,977,687$

CITY OF BREA, CALIFORNIA
SCHEDULE TO REVENUES, EXPENDITURES AND CHANGES IN FUND BALANCE - BUDGET AND ACTUAL
GAS TAX SPECIAL REVENUE FUND FOR THEYEAR ENDED JUNE 30, 2017
114
Variance withFinal Budget
Actual Positive/Original Final Amounts (Negative)
Revenues:Intergovernmental 891,500$ 891,500$ 842,253$ (49,247)$ Investment income, net 10,000 10,000 758 (9,242)
Total revenues 901,500 901,500 843,011 (58,489)
Excess of revenues over expenditures 901,500 901,500 843,011 (58,489)
Other financing sources (uses):Transfers out (1,563,500) (1,869,368) (794,702) 1,074,666
Net change in fund balance (662,000)$ (967,868)$ 48,309 1,016,177$
Fund balance at beginning of the year 1,287,356
Fund balance at end of the year 1,335,665$
Budget Amounts

CITY OF BREA, CALIFORNIA
SCHEDULE TO REVENUES, EXPENDITURES AND CHANGES IN FUND BALANCE - BUDGET AND ACTUAL
NARCOTICS ENFORCEMENT ASSET SEIZURE SPECIAL REVENUE FUND FOR THE YEAR ENDED JUNE 30, 2017
115
Variance withFinal Budget
Actual Positive/Original Final Amounts (Negative)
Revenues:Investment income, net 4,000$ 4,000$ 1,051$ (2,949)$ Fines and forfeitures 175,000 175,000 42,768 (132,232)
Total revenues 179,000 179,000 43,819 (135,181)
Expenditures:Current:
Public safety 501,640 511,636 224,278 287,358 Excess (deficiency) of revenues over(under) expenditures (322,640) (332,636) (180,459) 152,177
Other financing sources (uses):Transfers out - (1,422) (1,422) -
Net change in fund balance (322,640)$ (334,058)$ (181,881) 152,177$
Fund balance at beginning of the year 370,217
Fund balance at end of the year 188,336$
Budget Amounts

CITY OF BREA, CALIFORNIA
SCHEDULE TO REVENUES, EXPENDITURES AND CHANGES IN FUND BALANCE - BUDGET AND ACTUAL
AIR QUALITY IMPROVEMENT SPECIAL REVENUE FUND FOR THE YEAR ENDED JUNE 30, 2017
116
Variance withFinal Budget
Actual Positive/Original Final Amounts (Negative)
Revenues:Intergovernmental 44,000$ 44,000$ 55,817$ 11,817$ Investment income, net 1,200 1,200 (445) (1,645)
Total revenues 45,200 45,200 55,372 10,172
Excess of revenues over expenditures 45,200 45,200 55,372 10,172
Other financing sources (uses):Transfers out (50,000) (100,000) (38,562) 61,438
Net change in fund balance (4,800)$ (54,800)$ 16,810 71,610$
Fund balance at beginning of the year 217,815
Fund balance at end of the year 234,625$
Budget Amounts

CITY OF BREA, CALIFORNIA
SCHEDULE TO REVENUES, EXPENDITURES AND CHANGES IN FUND BALANCE - BUDGET AND ACTUAL
PARK DEVELOPMENT SPECIAL REVENUE FUND FOR THE YEAR ENDED JUNE 30, 2017
117
Variance withFinal Budget
Actual Positive/Original Final Amounts (Negative)
Revenues:Charges for services 1,061,715$ 1,061,715$ 878,367$ (183,348)$ Investment income, net 2,500 2,500 (12,747) (15,247)
Total revenues 1,064,215 1,064,215 865,620 (198,595)
Excess of revenues over expenditures 1,064,215 1,064,215 865,620 (198,595)
Other financing sources (uses):Transfers out (366,473) (1,175,925) (34,452) 1,141,473
Net change in fund balance 697,742$ (111,710)$ 831,168 942,878$
Fund balance at beginning of the year 83,324
Fund balance at end of the year 914,492$
Budget Amounts

CITY OF BREA, CALIFORNIA
SCHEDULE TO REVENUES, EXPENDITURES AND CHANGES IN FUND BALANCE - BUDGET AND ACTUAL
MEASURE M SPECIAL REVENUE FUND FOR THE YEAR ENDED JUNE 30, 2017
118
Variance withFinal Budget
Actual Positive/Original Final Amounts (Negative)
Revenues:Taxes 978,413$ 978,413$ 944,742$ (33,671)$ Investment income, net 5,000 5,000 (419) (5,419)
Total revenues 983,413 983,413 944,323 (39,090)
Expenditures:Current: Public works 32,239 32,239 20,043 12,196
Excess (deficiency) of revenues over(under) expenditures 951,174 951,174 924,280 26,894
Other financing sources (uses):Transfers out (2,661,000) (2,752,013) (831,508) 1,920,505
Net change in fund balance (1,709,826)$ (1,800,839)$ 92,772 1,947,399$
Fund balance at beginning of the year 2,040,615
Fund balance at end of the year 2,133,387$
Budget Amounts

CITY OF BREA, CALIFORNIA
SCHEDULE TO REVENUES, EXPENDITURES AND CHANGES IN FUND BALANCE - BUDGET AND ACTUAL
AFFORDABLE HOUSING TRUST SPECIAL REVENUE FUND FOR THE YEAR ENDED JUNE 30, 2017
119
Variance withFinal Budget
Actual Positive/Original Final Amounts (Negative)
Revenues:Investment income, net 35,000$ 35,000$ (260)$ (35,260)$ Other revenues 120,000 120,000 139,750 19,750
Total revenues 155,000 155,000 139,490 (15,510)
Expenditures:Current:
Community development 100,000 150,000 - 150,000
Net change in fund balance 55,000$ 5,000$ 139,490 134,490$
Fund balance at beginning of the year 2,319,807
Fund balance at end of the year 2,459,297$
Budget Amounts

CITY OF BREA, CALIFORNIA
SCHEDULE TO REVENUES, EXPENDITURES AND CHANGES IN FUND BALANCE - BUDGET AND ACTUAL
COMMUNITY DEVELOPMENT BLOCK GRANT SPECIAL REVENUE FUND FOR THE YEAR ENDED JUNE 30, 2017
120
Variance with
Final BudgetActual Positive/
Original Final Amounts (Negative)Revenues:
Intergovernmental 294,000$ 453,145$ 265,750$ (187,395)$
Expenditures:Current:
Community development 180,000 339,145 184,080 155,065 Excess (deficiency) of revenues over(under) expenditures 114,000 114,000 81,670 (32,330)
Other financing sources (uses):Transfers out (114,000) (179,576) (29,037) 150,539
Net change in fund balance -$ (65,576)$ 52,633 118,209$
Fund balance at beginning of the year (59,743)
Fund balance at end of the year (7,110)$
Budget Amounts

CITY OF BREA, CALIFORNIA
SCHEDULE TO REVENUES, EXPENDITURES AND CHANGES IN FUND BALANCE - BUDGET AND ACTUAL
BLACKSTONE CFD SPECIAL REVENUE FUND FOR THE YEAR ENDED JUNE 30, 2017
121
Variance withFinal Budget
Actual Positive/Original Final Amounts (Negative)
Revenues:Taxes 537,700$ 537,700$ 708,450$ 170,750$ Investment income, net 27,000 27,000 4,232 (22,768)
Total revenues 564,700 564,700 712,682 147,982
Expenditures:Current:
General government - - 40,157 (40,157) Public safety 56,505 56,505 57,691 (1,186) Public works 281,681 287,881 220,921 66,960
Total expenditures 338,186 344,386 318,769 25,617
Excess (deficiency) of revenues over(under) expenditures 226,514 220,314 393,913 173,599
Other financing sources (uses):Transfers out - (502,924) (502,924) -
Net change in fund balance 226,514 (282,610) (109,011) 173,599
Fund balance at beginning of the year 2,347,760
Fund balance at end of the year 2,238,749$
Budget Amounts

CITY OF BREA, CALIFORNIA
SCHEDULE TO REVENUES, EXPENDITURES AND CHANGES IN FUND BALANCE - BUDGET AND ACTUAL
LA FLORESTA CFD SPECIAL REVENUE FUND FOR THE YEAR ENDED JUNE 30, 2017
122
Variance with
Final BudgetActual Positive/
Original Final Amounts (Negative)Revenues:
Taxes 175,000$ 175,000$ 198,145$ 23,145$ Investment income, net 3,000 3,000 1,155 (1,845)
Total revenues 178,000 178,000 199,300 21,300
Expenditures:Current:
General government 5,000 6,640 10,000 (3,360) Public safety 84,758 84,758 84,269 489 Public works 2,872 2,872 - 2,872
Total expenditures 92,630 94,270 94,269 1
Excess (deficiency) of revenues over(under) expenditures 85,370 83,730 105,031 21,301
Other financing sources (uses):Transfers out - (142,721) (142,721) -
Net change in fund balance 85,370 (58,991) (37,690) 21,301
Fund balance at beginning of the year 185,244
Fund balance at end of the year 147,554$
Budget Amounts

CITY OF BREA, CALIFORNIA
SCHEDULE TO REVENUES, EXPENDITURES AND CHANGES IN FUND BALANCE - BUDGET AND ACTUAL
TAYLOR-MORRISON CFD SPECIAL REVENUE FUND FOR THE YEAR ENDED JUNE 30, 2017
123
Variance withFinal Budget
Actual Positive/Original Final Amounts (Negative)
Revenues:Taxes 45,650$ 45,650$ 48,196$ 2,546$ Investment income, net 200 200 89 (111)
Total revenues 45,850 45,850 48,285 2,435
Excess of revenues over expenditures 45,850 45,850 48,285 2,435
Other financing sources (uses):Transfers out - (33,981) (33,981) -
Net change in fund balance 45,850$ 11,869$ 14,304 2,435$
Fund balance at beginning of the year 71,748
Fund balance at end of the year 86,052$
Budget Amounts

CITY OF BREA, CALIFORNIA
SCHEDULE TO REVENUES, EXPENDITURES AND CHANGES IN FUND BALANCE - BUDGET AND ACTUAL
CAPITAL AND MITIGATION IMPROVEMENT CAPITAL PROJECTS FUND FOR THE YEAR ENDED JUNE 30, 2017
124
Variance withFinal Budget
Actual Positive/Original Final Amounts (Negative)
Revenues:Investment income, net 30,000$ 30,000$ 8,265$ (21,735)$ Other revenues - - 566 566
Total revenues 30,000 30,000 8,831 (21,169)
Excess of revenues over expenditures 30,000 30,000 8,831 (21,169)
Other financing sources (uses):Transfers out (978,100) (1,155,072) (237,169) 917,903
Net change in fund balance (948,100)$ (1,125,072)$ (228,338) 896,734$
Fund balance at beginning of the year 5,230,740
Fund balance at end of the year 5,002,402$
Budget Amounts

CITY OF BREA, CALIFORNIA
SCHEDULE TO REVENUES, EXPENDITURES AND CHANGES IN FUND BALANCE - BUDGET AND ACTUAL
STORM DRAIN CAPITAL PROJECTS FUND FOR THE YEAR ENDED JUNE 30, 2017
125
Variance withFinal Budget
Actual Positive/Original Final Amounts (Negative)
Revenues:Investment income, net 2,500$ 2,500$ 44$ (2,456)$
Net change in fund balance 2,500$ 2,500$ 44 (2,456)$
Fund balance at beginning of the year 256,356
Fund balance at end of the year 256,400$
Budget Amounts

CITY OF BREA, CALIFORNIA
SCHEDULE TO REVENUES, EXPENDITURES AND CHANGES IN FUND BALANCE - BUDGET AND ACTUAL
MIDBURY CAPITAL PROJECTS FUND FOR THE YEAR ENDED JUNE 30, 2017
126
Variance withFinal Budget
Actual Positive/Original Final Amounts (Negative)
Revenues:Taxes 7,718$ 7,718$ 7,694$ (24)$ Investment income, net 100 100 27 (73)
Total revenues 7,818 7,818 7,721 (97)
Expenditures:Current:
General government 468 468 455 13 Net change in fund balance 7,350$ 7,350$ 7,266 84$
Fund balance at beginning of the year (19,428)
Fund balance at end of the year (12,162)$
Budget Amounts

127
NON-MAJOR PROPRIETARY FUNDS
Urban Runoff Fund The fund is used to account for the City’s urban runoff operations, which are financed and operated in a manner similar to a private enterprise. The costs (expenses, including depreciation) of providing these services to the general public on a continuing basis are financed or recovered primarily through user charges. Sanitation Fund The fund is used to account for the City’s refuse collection and street sweeping operations, which are operated in a manner similar to a private enterprise. User charges finance the operations of this fund. Information Technology External Support Fund This fund is used to account for the operations of the Information Technology Division’s contractual information technology services to other agencies. The costs (expenses including depreciation) of providing these services to participating cities on a continuing basis are financed or recovered primarily through user charges.

CITY OF BREA, CALIFORNIA
COMBINING STATEMENT OF NET POSITION NON-MAJOR PROPRIETARY FUNDS
JUNE 30, 2017
128
InformationTechnology
ExternalUrban Runoff Sanitation Support Total
Assets:Current assets:
Cash and investments 511,779$ -$ 692,248$ 1,204,027$ Accounts
Accounts receivable 65,323 607,808 329,952 1,003,083 Due from other governments - 22,784 - 22,784
Total current assets 577,102 630,592 1,022,200 2,229,894 Noncurrent:
Capital assets - net ofaccumulated depreciation 2,265 - - 2,265
Total assets 579,367 630,592 1,022,200 2,232,159
Deferred outflows of resources:Deferred pension related items 39,840 171,823 582,344 794,007
Liabilities:Current liabilities:
Accounts payable 3,655 208,906 3,586 216,147 Accrued liabilities 3,587 19,153 59,575 82,315 Due to other funds - 439,894 - 439,894 Compensated absences, due within one year - 11,666 80,144 91,811
Total current liabilities 7,242 679,619 143,305 830,167 Noncurrent:
Compensated absences, due in more than one year - 3,889 26,715 30,604 Net pension liability 286,160 2,037,373 2,336,735 4,660,268
Total noncurrent liabilities 286,160 2,041,262 2,363,450 4,690,872
Total liabilities 293,402 2,720,881 2,506,755 5,521,038
Deferred inflows of resources:Deferred pension related items 38,824 394,509 12,740 446,073
Net position (deficit):Net investment in capital assets 2,265 - - 2,265 Unrestricted 284,716 (2,312,975) (914,951) (2,943,210)
Total net position (deficit) 286,981$ (2,312,975)$ (914,951)$ (2,940,945)$

CITY OF BREA, CALIFORNIA
COMBINING STATEMENT OF REVENUES, EXPENSES AND CHANGES IN FUND NET POSITION
NON-MAJOR PROPRIETARY FUNDS FOR THE YEAR ENDED JUNE 30, 2017
129
InformationTechnology
External Urban Runoff Sanitation Support Total
Operating revenues:Charges for services 398,630$ 2,704,917$ 1,959,634$ 5,063,181$ Other revenues 13,456 879,236 - 892,692
Total operating revenues 412,086 3,584,153 1,959,634 5,955,873
Operating expenses:Personnel services 227,772 606,083 1,470,371 2,304,226 Maintenance and operation 148,130 2,441,821 253,038 2,842,989 Depreciation expense 938 - - 938 Total operating expenses 376,840 3,047,904 1,723,409 5,148,153 Operating income (loss) 35,246 536,249 236,225 807,720
Nonoperating revenues (expenses):Intergovernmental revenues - 34,154 - 34,154 Interest expense (434) (324) (641) (1,399)
Total nonoperating revenues (expenses) (434) 33,830 (641) 32,755
Income (loss) before contributions and transfers 34,812 570,079 235,584 840,475
Transfers:Transfers out (7,540) (465,000) (50,000) (522,540)
Change in net position 27,272 105,079 185,584 317,935
Net position (deficit) at beginning of year 259,709 (2,418,054) (1,100,535) (3,258,880)
Net position (deficit) at end of year 286,981$ (2,312,975)$ (914,951)$ (2,940,945)$

CITY OF BREA, CALIFORNIA
COMBINING STATEMENT OF CASH FLOWS NON-MAJOR PROPRIETARY FUNDS
FOR THE YEAR ENDED JUNE 30, 2017
130
InformationTechnology
ExternalUrban Runoff Sanitation Support Total
Cash flows from operating activities:Cash received from customers and users 406,976$ 3,564,809$ 1,989,573$ 5,961,358$ Cash payments to suppliers for goods and services (387,281) (3,028,277) (1,722,147) (5,137,705) Cash payments to employees for services (3,563) (105,362) (35,909) (144,834)
Net cash provided by operating activities 16,132 431,170 231,517 678,819
Cash flows from non-capital financing activities:Cash transfers out (7,540) (465,000) (50,000) (522,540) Intergovernmental revenues - 34,154 - 34,154
Net cash provided by (used for) noncapital financing activities (7,540) (430,846) (50,000) (488,386)
Cash flows from investing activities:Interest received (434) (324) (641) (1,399)
Net cash provided by (used for) investing activities (434) (324) (641) (1,399)
Net increase in cash and cash equivalents 8,158 - 180,876 189,034
Cash and Cash Equivalents at Beginning of Year 503,621 - 511,372 1,014,993 Cash and Cash Equivalents at End of Year 511,779$ -$ 692,248$ 1,204,027$
Reconciliation of operating income (loss) to net cashprovided by (used for) operating activities:
Operating income (loss) 35,246$ 536,249$ 236,225$ 807,720$ Adjustments to reconcile operating income (loss) to net cash provided by (used for) operating activities:
Depreciation 938 - - 938 (Increase) decrease in accounts receivable (5,110) 3,440 (329,952) (331,622) (Increase) decrease in due from other governments - (22,784) 359,891 337,107 Increase (decrease) in accounts payable (11,500) 15,276 (1,804) 1,972 Increase in accrued liabilities 121 4,351 3,066 7,538 (Decrease) in due to other funds - (90,273) - (90,273) Increase in compensated absences - 1,089 20,569 21,658 (Decrease) in net pension liability (3,563) (16,178) (56,478) (76,219)
Total adjustments (19,114) (105,079) (4,708) (128,901) Net cash provided by (used for) operating activities 16,132$ 431,170$ 231,517$ 678,819$
Non-cash investing, capital and financing activities: There was no non-cash investing, capital or financing activities during the year.

131
INTERNAL SERVICE FUNDS Risk Management Fund This fund is used to account for the costs of operating a self-insurance program for general liability, workers’ compensation, long-term disability and unemployment compensation. Such costs to other departments are billed at a predetermined rate set annually during the budget process. Vehicle Maintenance Fund This fund was created to account for the costs of operating a maintenance facility for automotive equipment used by other City departments. Such costs to other departments are billed at a predetermined cost per mile charge that includes depreciation. This charge is set annually during the budget process. The Vehicle Maintenance Fund is responsible for financing replacement vehicles, as necessary. Building Occupancy Fund This fund is used to account for the costs of operating a building maintenance program for City facilities. Such costs to other departments are billed at a predetermined rate set annually during the budget process.

CITY OF BREA, CALIFORNIA
COMBINING STATEMENT OF NET POSITION INTERNAL SERVICE FUNDS
JUNE 30, 2017
132
Risk Vehicle Building TotalsManagement Replacement Occupancy 2017
Assets:Current assets:
Cash and investments 4,558,357$ 1,253,987$ 493,909$ 6,306,253$ Receivables: Accounts 2,889 4,923 - 7,812
Total current assets 4,561,246 1,258,910 493,909 6,314,065
Noncurrent assets:Advances to other funds 866,118 - - 866,118 Capital assets, net of accumulated depreciation - 4,080,667 1,462,480 5,543,147
Total noncurrent assets 866,118 4,080,667 1,462,480 6,409,265 Total assets 5,427,364 5,339,577 1,956,389 12,723,330
Deferred outflows of resources:Deferred pension related items 72,814 227,964 271,730 572,508
Liabilities:Current liabilities:
Accounts payable 31,027 121,068 111,901 263,996 Accrued liabilities 6,847 19,097 29,816 55,760 Accrued Interest - - 2,598 2,598 Compensated absences, due within one year - 27,426 42,113 69,539 Claims and judgments, due within one year 1,753,904 - - 1,753,904 Capital leases, due within one year - - 168,315 168,315
Total current liabilities 1,791,778 167,591 354,743 2,314,112
Non-current liabilities:Compensated absences, due in more than one year - 9,142 14,038 23,180 Claims and judgments, due in more than one year 2,743,287 - - 2,743,287 Net pension liability 365,823 1,241,135 1,335,892 2,942,850
Total non-current liabilities 3,109,110 1,250,277 1,349,930 5,709,317
Total liabilities 4,900,888 1,417,868 1,704,672 8,023,428
Deferred inflows of resources:Deferred pension related items 29,476 117,489 95,859 242,824
Net position:Net investment in capital assets - 4,080,667 1,462,480 5,543,147 Unrestricted 569,814 (48,483) (1,034,892) (513,561)
Total net position 569,814$ 4,032,184$ 427,588$ 5,029,586$

CITY OF BREA, CALIFORNIA
COMBINING STATEMENT OF REVENUES, EXPENSES AND CHANGES IN NET POSITION
INTERNAL SERVICE FUNDS FOR THE YEAR ENDED JUNE 30, 2017
133
Risk Vehicle Building Management Maintenance Occupancy Total
Operating revenues:Charge for service 2,901,534$ 2,286,231$ 2,485,854$ 7,673,619$ Other revenues 451,083 49,328 75,797 576,208
Total operating revenues 3,352,617 2,335,559 2,561,651 8,249,827
Operating expenses:Personnel services 169,126 595,861 732,764 1,497,751 Maintenance and operation 1,277,471 1,028,285 1,511,572 3,817,328 Claims and judgements 1,935,696 - - 1,935,696 Depreciation expense - 672,357 119,470 791,827 Total operating expenses 3,382,293 2,296,503 2,363,806 8,042,602 Operating income (loss) (29,676) 39,056 197,845 207,225
Nonoperating revenues (expenses):Interest expense (7,511) (1,106) (11,707) (20,324) Gain (loss) on disposal of capital assets - (6,704) - (6,704)
Total nonoperating revenues (expenses) (7,511) (7,810) (11,707) (27,028)
Income (loss) before transfers (37,187) 31,246 186,138 180,197
Transfers:Transfers in - 88,882 - 88,882 Transfers out (100,000) (411,992) - (511,992)
Total transfers (100,000) (323,110) - (423,110)
Change in net position (137,187) (291,864) 186,138 (242,913)
Net position at beginning of Year 707,001 4,324,048 241,450 5,272,499
Net position at end of year 569,814$ 4,032,184$ 427,588$ 5,029,586$

CITY OF BREA, CALIFORNIA
COMBINING STATEMENT OF CASH FLOWS INTERNAL SERVICE FUNDS
FOR THE YEAR ENDED JUNE 30, 2017
134
Risk Vehicle BuildingManagement Maintenance Occupancy Total
Cash flows from operating activities:Cash received from users and departments 3,355,092$ 2,526,913$ 2,575,590$ 8,457,595$ Cash payments to suppliers for goods and services (1,790,253) (1,533,494) (2,222,482) (5,546,229) Cash payments to employees for services (1,714,643) (204,642) (42,980) (1,962,265)
Net cash provided by (used for) operating activities (149,804) 788,777 310,128 949,101
Cash flows from non-capital financing activities:Cash transfers out (100,000) (411,992) - (511,992) Cash transfers in - 88,882 - 88,882 Advances received from other funds 574,677 - - 574,677
Net cash provided by (used for) noncapital financing activities 474,677 (323,110) - 151,567
Cash flows from capital and related financing activities:
Acquisition and construction of capital assets - (470,363) (5,460) (475,823) Proceeds from sale of capital assets - 53,059 - 53,059 Principal and interest paid on long-term debt (7,511) - (174,972) (182,483)
Net cash provided by (used for) capital and related financing activities (7,511) (417,304) (180,432) (605,247)
Cash flows from investing activities:Interest received - (1,106) - (1,106)
Net cash provided by (used for) - (1,106) - (1,106) investing activities
Net increase (decreased) in cash and cash equivalents 317,362 47,257 129,696 494,315
Cash and Cash Equivalents at Beginning of Year 4,240,995 1,206,730 364,213 5,811,938 Cash and Cash Equivalents at End of Year 4,558,357$ 1,253,987$ 493,909$ 6,306,253
Reconciliation of operating income to net cashprovided by (used for) operating activities:Operating income (loss) (29,676)$ 39,056$ 197,845$ 207,225$
Adjustments to reconcile operating income (loss) net cash provided by (used for) operating activities:
Depreciation - 672,357 119,470 791,827 Decrease in accounts receivable 2,475 3,421 - 5,896 Increase (decrease) in accounts payable (392,342) 93,303 1,650 (297,389) Increase (decrease) in accrued liabilities 8 (2,651) 3,354 711 Increase in claims and judgements 276,271 - - 276,271 Increase in compensated absences - 3,225 12,289 15,514 (Decrease) in net pension liability (6,540) (19,934) (24,480) (50,954)
Total adjustments (120,128)$ 749,721$ 112,283$ 741,876$ Net cash provided by (used for) operating activities (149,804)$ 788,777$ 310,128$ 949,101$
Non-cash investing, capital and financing activities: There was no non-cash investing, capital or financing activities during the year.

135
AGENCY FUNDS Bexley Assessment District 2001-1 Fund This fund was created to account for collection and payment of neighborhood sewer improvements. Hillside Open Space Education Coalition This fund is used to account for the funds received to educate the public as to the importance of hillside preservation. Downtown Community Facilities District 1996-1 Fund This fund is used to account for the collection and payment to the holders of the 2014 Special Tax Bonds. Olinda Heights Community Facilities District 1997-1 Fund This fund is used to account for the collection and payment to the holders of the 2005 Special Tax Bonds. Brea Plaza Community Facilities District 2008-02 Fund This fund is used to account for the collection and payment to the holders of the 2009 Special Tax Bonds. Integrated Law and Justice Agency of Orange County (ILJAOC) Fund This fund is used to account for the collection and payment related to a joint venture agreement with several other public agencies of Orange County. The City acts as a treasurer for the ILJAOC.

CITY OF BREA, CALIFORNIA
COMBINING BALANCE SHEET AGENCY FUNDS
JUNE 30, 2017
136
Hillside OpenSpace
EducationBexley Coalition Downtown
Assets:Cash and investments -$ 536,884$ 260,732$ Receivables: Accounts 9,936 - - Taxes - - - Due from other governments - - - Restricted assets: Cash and investments with fiscal agents - - 163,319 Capital assets: Capital assets, net of accumulated depreciation - - -
Total assets 9,936$ 536,884$ 424,051$
Liabilities:Accounts payable -$ -$ 1,245$ Accrued liabilities - 536,884 424 Due to the City of Brea 9,936 - - Due to external parties/other agencies - - 422,382
Total liabilities 9,936$ 536,884$ 424,051$

137
OlindaHeights Brea Plaza ILJAOC Total
369,750$ 386,788$ 3,365,333$ 4,919,487$
- - 7,723 17,659 9,007 - - 9,007
- - 19,065 19,065
465,154 837,908 - 1,466,381
- - 468,006 468,006
843,911$ 1,224,696$ 3,860,127$ 6,899,605$
32$ 59$ 276,855$ 278,191$ 1,060 587 - 538,955
- - - 9,936 842,819 1,224,050 3,583,272 6,072,523
843,911$ 1,224,696$ 3,860,127$ 6,899,605$

CITY OF BREA, CALIFORNIA
COMBINING STATEMENT OF CHANGES IN ASSETS AND LIABILITIES
AGENCY FUNDS FOR THE YEAR ENDED JUNE 30, 2017
138
BalanceJuly 1, 2016, as restated Additions Deletions
Balance June 30, 2017
Receivables:Accounts 19,111$ 1,515$ 10,690$ 9,936$
Due to City of Brea 19,111$ 12,126$ 21,301$ 9,936$
Cash and investments 536,842$ 8,106$ 8,064$ 536,884$
Accrued liabilities 536,842$ 8,106$ 8,064$ 536,884$
Cash and investments 263,607$ 260,048$ 262,923$ 260,732$ Restricted assets:
Cash and investments with fiscal agents 163,087 225,482 225,250 163,319 Total Assets 426,694$ 485,530$ 488,173$ 424,051$
Accounts payable 1,205$ 21,104$ 21,064$ 1,245$ Accrued liabilities 426 424 426 424 Due to external parties/other agencies 425,063 260,230 262,911 422,382
Total Liabilities 426,694$ 281,758$ 284,401$ 424,051$
Cash and investments 336,624$ 521,077$ 487,951$ 369,750$ Receivables:
Taxes 11,899 9,007 11,899 9,007 Restricted assets:
Cash and investments with fiscal agents 467,302 448,282 450,430 465,154 Total Assets 815,825$ 978,366$ 950,280$ 843,911$
Accounts payable 33$ 9,657$ 9,658$ 32$ Accrued liabilities 1,066 1,060 1,066 1,060 Due to external parties/other agencies 814,726 524,514 496,421 842,819
Total Liabilities 815,825$ 535,231$ 507,145$ 843,911$
Liabilities
Assets
Bexley
Assets
Liabilities
Hillside Open Space Education Coalition
Assets
Liabilities
Downtown
Assets
Liabilities
Olinda Heights
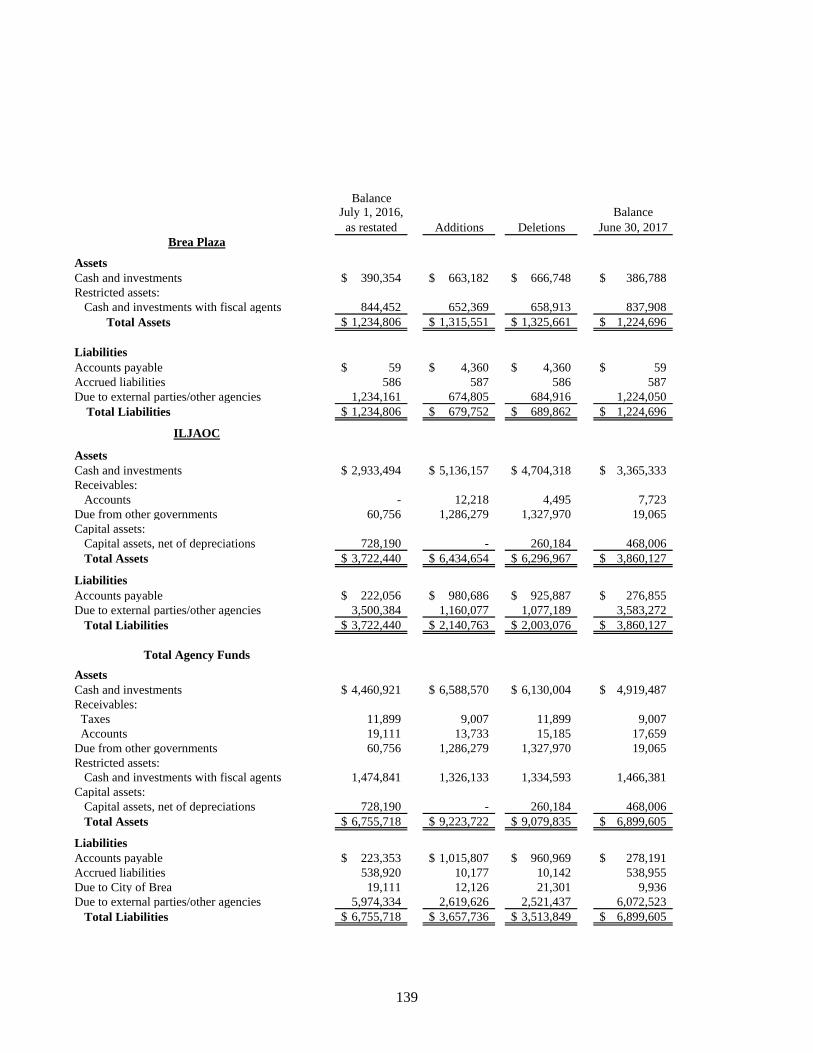
139
BalanceJuly 1, 2016,
as restated Additions DeletionsBalance
June 30, 2017
Cash and investments 390,354$ 663,182$ 666,748$ 386,788$ Restricted assets:
Cash and investments with fiscal agents 844,452 652,369 658,913 837,908 Total Assets 1,234,806$ 1,315,551$ 1,325,661$ 1,224,696$
Accounts payable 59$ 4,360$ 4,360$ 59$ Accrued liabilities 586 587 586 587 Due to external parties/other agencies 1,234,161 674,805 684,916 1,224,050
Total Liabilities 1,234,806$ 679,752$ 689,862$ 1,224,696$
Cash and investments 2,933,494$ 5,136,157$ 4,704,318$ 3,365,333$ Receivables:
Accounts - 12,218 4,495 7,723 Due from other governments 60,756 1,286,279 1,327,970 19,065 Capital assets:
Capital assets, net of depreciations 728,190 - 260,184 468,006 Total Assets 3,722,440$ 6,434,654$ 6,296,967$ 3,860,127$
Accounts payable 222,056$ 980,686$ 925,887$ 276,855$ Due to external parties/other agencies 3,500,384 1,160,077 1,077,189 3,583,272
Total Liabilities 3,722,440$ 2,140,763$ 2,003,076$ 3,860,127$
Cash and investments 4,460,921$ 6,588,570$ 6,130,004$ 4,919,487$ Receivables: Taxes 11,899 9,007 11,899 9,007 Accounts 19,111 13,733 15,185 17,659 Due from other governments 60,756 1,286,279 1,327,970 19,065 Restricted assets:
Cash and investments with fiscal agents 1,474,841 1,326,133 1,334,593 1,466,381 Capital assets:
Capital assets, net of depreciations 728,190 - 260,184 468,006 Total Assets 6,755,718$ 9,223,722$ 9,079,835$ 6,899,605$
Accounts payable 223,353$ 1,015,807$ 960,969$ 278,191$ Accrued liabilities 538,920 10,177 10,142 538,955 Due to City of Brea 19,111 12,126 21,301 9,936 Due to external parties/other agencies 5,974,334 2,619,626 2,521,437 6,072,523
Total Liabilities 6,755,718$ 3,657,736$ 3,513,849$ 6,899,605$
Liabilities
Total Agency Funds
Assets
Liabilities
Brea Plaza
Assets
Liabilities
ILJAOC
Assets

140
This page intentionally left blank.

STATISTICAL SECTION

This page intentionally left blank.

141
STATISTICAL SECTION This part of the City of Brea’s comprehensive annual financial report presents detailed information as a context for understanding what the information in the financial statements, note disclosures, and required supplementary information says about the City's overall financial health. Contents Financial Trends
These schedules contain trend information to help the reader understand how the City's financial performance and well-being have changed over time.
Revenue Capacity
These schedules contain information to help the reader assess the factors affecting the City's ability to generate its property and sales taxes.
Debt Capacity These schedules present information to help the reader assess the affordability of the City's current levels of outstanding debt and the City's ability to issue additional debt in the future.
Demographic and Economic Information These schedules offer demographic and economic indicators to help the reader understand the environment within which the City's financial activities take place.
Operating Information
These schedules contain information about the City's operations and resources to help the reader understand how the City's financial information relates to the services the City provides and the activities it performs.
Sources: Unless otherwise noted, the information in these schedules is derived from the comprehensive annual financial reports for the relevant year.

142
This page intentionally left blank.

CIT
Y O
F B
RE
A
NE
T P
OS
ITIO
N B
Y C
OM
PO
NE
NT
LA
ST
TE
N F
ISC
AL
YE
AR
S(A
ccru
al b
asis
of
acco
un
tin
g)
Fis
cal Y
ear
Fis
cal Y
ear
Fis
cal Y
ear
Fis
cal Y
ear
Fis
cal Y
ear
Fis
cal Y
ear
Fis
cal Y
ear
Fis
cal Y
ear
Fis
cal Y
ear
Fis
cal Y
ear
2007
-08
2008
-09
2009
-10
2010
-11
2011
-12
2012
-13
2013
-14
2014
-15
2015
-16
2016
-17
Gov
ernm
enta
l Act
iviti
es
Net
inve
stm
ent i
n ca
pita
l ass
ets
44,7
51,7
94$
43
,350
,936
$
49,3
13,2
84$
40
,774
,347
$
36,8
46,3
17$
16
5,03
1,65
4$
164,
750,
324
$
158,
976,
819
$
165,
493,
107
$ 17
0,54
8,46
7$
R
estr
icte
d43
,477
,959
46,2
71,0
92
62
,325
,348
73,8
00,7
55
26
,596
,796
53,3
79,6
27
48
,418
,876
56,8
83,7
53
54
,629
,374
52,8
67,0
78
Unr
estr
icte
d(2
5,45
9,51
9)
(2
1,20
3,64
2)
(3
4,37
2,60
2)
(3
3,27
7,96
8)
15
7,12
9,17
9
29,0
28,1
79
30
,997
,188
(64,
027,
907)
(58,
217,
717)
(57,
154,
376)
Tot
al g
over
nmen
tal a
ctiv
ities
net
pos
ition
62,7
70,2
34$
68
,418
,386
$
77,2
66,0
30$
81
,297
,134
$
220,
572,
292
$ 24
7,43
9,46
0$
244,
166,
388
$
151,
832,
665
$
161,
904,
764
$ 16
6,26
1,16
9$
Bus
ines
s-ty
pe A
ctiv
ities
N
et in
vest
men
t of c
apita
l ass
ets
42,9
60,0
60$
44
,774
,355
$
45,6
90,8
42$
27
,869
,296
$
36,1
07,8
09$
36
,804
,832
$
31,3
96,9
04$
33
,367
,826
$
33,1
74,0
74$
42
,091
,695
$
R
estr
icte
d2,
623,
071
1,
885,
573
-
7,
028,
848
5,
217,
299
7,
411,
252
5,
213,
677
6,
203,
193
6,
165,
829
5,
641,
012
Unr
estr
icte
d6,
930,
527
6,
368,
112
7,
101,
987
13
,592
,110
7,69
5,07
7
6,02
3,88
5
19,6
03,0
41
8,
603,
346
12
,637
,920
14,3
92,9
25
Tot
al b
usin
ess-
type
act
iviti
es n
et p
ositi
on52
,513
,658
$
53,0
28,0
40$
52
,792
,829
$
48,4
90,2
54$
49
,020
,185
$
50,2
39,9
69$
56
,213
,622
$
48,1
74,3
65$
51
,977
,823
$
62,1
25,6
32$
Prim
ary
Gov
ernm
ent
N
et in
vest
men
t of c
apita
l ass
ets
87,7
11,8
54$
88
,125
,291
$
95,0
04,1
26$
68
,643
,643
$
72,9
54,1
26$
20
1,83
6,48
6$
196,
147,
228
$
192,
344,
645
$
198,
667,
181
$ 21
2,64
0,16
2$
R
estr
icte
d46
,101
,030
48,1
56,6
65
62
,325
,348
80,8
29,6
03
31
,814
,095
60,7
90,8
79
53
,632
,553
63,0
86,9
46
60
,795
,203
58,5
08,0
90
Unr
estr
icte
d(1
8,52
8,99
2)
(1
4,83
5,53
0)
(2
7,27
0,61
5)
(1
9,68
5,85
8)
16
4,82
4,25
6
35,0
52,0
64
50
,600
,229
(55,
424,
561)
(45,
579,
797)
(42,
761,
451)
Tot
al p
rimar
y go
vern
men
t net
pos
ition
115,
283,
892
$
121,
446,
426
$ 13
0,05
8,85
9$
12
9,78
7,38
8$
269,
592,
477
$ 29
7,67
9,42
9$
300,
380,
010
$
200,
007,
030
$
213,
882,
587
$ 22
8,38
6,80
1$
.
143

CIT
Y O
F B
RE
A
CH
AN
GE
S I
N N
ET
PO
SIT
ION
LA
ST
TE
N F
ISC
AL
YE
AR
S(A
ccru
al b
asis
of
acco
un
tin
g)
Fis
ca
l Y
ea
rF
isc
al
Ye
ar
Fis
ca
l Y
ea
rF
isc
al
Ye
ar
Fis
ca
l Y
ea
rF
isc
al
Ye
ar
Fis
ca
l Y
ea
rF
isc
al
Ye
ar
Fis
ca
l Y
ea
rF
isc
al
Ye
ar
20
07
-08
20
08
-09
20
09
-10
20
10
-11
20
11
-12
20
12
-13
20
13
-14
20
14
-15
20
15
-16
20
16
-17
Ex
pe
ns
es
:
Go
vern
me
nta
l act
iviti
es:
Ge
ne
ral g
ove
rnm
en
t1
0,1
79
,96
7$
11
,50
1,6
16
$
8
,51
6,3
91
$
7,5
30
,94
8$
9
,74
7,5
89
$
7
,49
5,1
85
$
7,3
52
,19
0$
7
,56
9,7
87
$
7,2
97
,65
2$
7,7
58
,27
6$
Pu
blic
sa
fety
34
,61
1,5
75
3
6,9
93
,79
9
35
,75
6,8
11
3
6,2
21
,22
1
39
,16
6,8
33
35
,84
9,2
88
3
1,4
08
,78
9
32
,40
9,7
27
3
1,3
72
,15
5
3
3,9
38
,46
9
Co
mm
un
ity D
eve
lop
me
nt
7,6
23
,15
8
9
,21
4,0
20
17
,21
3,9
48
1
1,0
56
,04
7
2,3
12
,83
0
2,6
15
,08
8
5
,20
1,5
69
2,8
36
,72
7
3
,01
0,9
78
3
,40
3,0
82
Co
mm
un
ity s
erv
ice
s6
,65
9,3
86
6,9
07
,22
8
6
,15
4,4
95
6,1
06
,12
8
6
,62
3,2
20
6
,62
2,3
32
7,0
23
,68
2
7
,44
1,0
12
7,2
67
,82
9
7,5
98
,66
6
Pu
blic
Wo
rks
8,8
36
,92
5
1
0,6
08
,00
1
7,0
75
,39
8
1
9,9
91
,03
4
15
,24
0,6
04
9,7
18
,84
1
1
0,0
92
,86
4
12
,36
7,0
78
1
3,5
44
,06
1
1
6,3
06
,54
2
Inte
rest
on
lon
g-t
erm
de
bt
9,1
42
,55
1
8
,77
9,3
00
9,6
07
,50
4
9
,22
8,0
93
2,4
14
,05
3
50
1,2
65
45
8,0
21
43
5,7
72
43
5,2
07
41
4,9
74
To
tal g
ove
rnm
en
tal a
ctiv
itie
s e
xpe
nse
s7
7,0
53
,56
2
84
,00
3,9
64
8
4,3
24
,54
7
90
,13
3,4
71
7
5,5
05
,12
9
6
2,8
01
,99
9
61
,53
7,1
15
6
3,0
60
,10
3
62
,92
7,8
82
69
,42
0,0
09
Bu
sin
ess
-typ
e a
ctiv
itie
s:
Urb
an
ru
n-o
ff1
74
,30
2
22
6,2
56
28
4,6
92
24
4,4
79
26
9,5
18
28
8,5
17
31
0,7
17
38
8,4
93
41
5,3
28
37
6,6
23
Wa
ter
util
ity1
1,1
95
,15
2
11
,27
2,7
67
1
4,0
25
,35
4
14
,06
7,7
72
1
5,5
12
,55
1
1
4,8
83
,42
5
16
,04
8,4
42
1
5,7
52
,82
2
14
,08
5,4
33
14
,88
2,4
43
Se
we
r u
tility
75
8,9
58
1
,30
7,7
33
1,0
73
,77
5
1
,08
0,1
34
1,2
27
,08
7
1,3
53
,55
2
1
,52
5,8
20
1,5
75
,73
8
1
,59
0,9
05
1
,63
0,3
19
Sa
nita
tion
2,3
48
,28
1
2
,44
4,0
76
2,4
86
,58
8
2
,56
5,3
24
2,7
06
,95
4
2,7
89
,28
9
2
,84
9,5
15
2,9
10
,84
0
2
,93
7,6
84
3
,04
5,3
08
Info
rma
tion
Te
chn
olo
gy
Ext
ern
al S
up
po
rt9
79
,15
7
1,3
29
,16
5
1
,95
8,1
40
1,2
30
,70
4
1
,26
9,8
00
1
,27
1,5
40
1,2
28
,91
9
1
,24
0,4
62
1,3
12
,89
9
1,7
24
,11
6
To
tal b
usi
ne
ss-t
ype
act
iviti
es
exp
en
ses
15
,45
5,8
50
1
6,5
79
,99
7
19
,82
8,5
49
1
9,1
88
,41
3
20
,98
5,9
10
20
,58
6,3
23
2
1,9
63
,41
3
21
,86
8,3
55
2
0,3
42
,24
9
2
1,6
58
,80
9
To
tal p
rim
ary
go
vern
me
nt
exp
en
ses
92
,50
9,4
12
$
1
00
,58
3,9
61
$
10
4,1
53
,09
6$
1
09
,32
1,8
84
$
96
,49
1,0
39
$
83
,38
8,3
22
$
8
3,5
00
,52
8$
84
,92
8,4
58
$
8
3,2
70
,13
1$
9
1,0
78
,81
8$
Pro
gra
m R
eve
nu
es
:
Go
vern
me
nta
l act
iviti
es:
Ch
arg
es
for
serv
ice
s:
Ge
ne
ral g
ove
rnm
en
t1
,03
6,4
21
$
1,0
13
,98
5$
7
30
,87
5$
4
33
,93
2$
2
,17
7,6
02
$
1
,89
0,7
49
$
1,6
31
,09
8$
1
,66
3,4
01
$
1,7
65
,91
3$
1,6
05
,81
6$
Pu
blic
sa
fety
12
,20
1,4
07
1
2,6
24
,89
1
13
,65
1,0
52
1
2,8
78
,40
2
13
,15
5,3
39
7,3
15
,92
5
1
,53
3,2
13
1,3
76
,55
3
1
,28
2,6
46
1
,29
7,0
25
Co
mm
un
ity D
eve
lop
me
nt
78
3,6
33
2
1,9
26
6
04
,56
5
5
67
,23
7
5
83
,33
9
1
,53
5,3
51
1,0
92
,04
1
9
98
,14
1
1
,57
7,9
64
2
,15
1,9
55
Co
mm
un
ity s
erv
ice
s3
,01
5,3
79
3,0
74
,71
7
3
,30
4,9
33
2,2
48
,60
3
1
,73
7,7
25
3
,63
8,0
56
4,6
72
,52
3
5
,64
0,4
12
3,0
21
,50
5
2,8
18
,71
8
Pu
blic
Wo
rks
48
4,0
85
4
90
,30
2
4
69
,53
3
2
,26
2,3
29
1,9
55
,18
8
1,6
88
,14
2
1
,90
9,4
09
1,7
06
,63
0
1
,25
7,1
68
1
,61
0,8
89
Op
era
ting
co
ntr
ibu
tion
s a
nd
gra
nts
8,2
79
,19
0
6
,36
2,5
17
5,1
11
,92
3
3
,54
2,7
33
6,3
64
,11
4
4,9
55
,21
3
3
,50
2,7
73
3,2
38
,36
6
3
,39
9,3
11
2
,63
2,7
18
Ca
pita
l co
ntr
ibu
tion
s a
nd
gra
nts
6,9
41
,24
9
6
,76
1,1
34
15
,64
0,5
54
4
,50
1,8
63
8,4
72
,77
8
3,4
95
,57
3
1
,18
7,6
23
3,9
08
,61
7
2
,33
6,9
84
5
,66
8,4
85
To
tal g
ove
rnm
en
tal a
ctiv
itie
s p
rog
ram
re
ven
ue
s3
2,7
41
,36
4
30
,34
9,4
72
3
9,5
13
,43
5
26
,43
5,0
99
3
4,4
46
,08
5
2
4,5
19
,00
9
15
,52
8,6
80
1
8,5
32
,12
0
14
,64
1,4
91
17
,78
5,6
06
Bu
sin
ess
-typ
e a
ctiv
itie
s:
Ch
arg
es
for
serv
ice
s:
Urb
an
ru
n-o
ff3
14
,76
2
32
9,1
43
33
3,7
60
35
1,1
23
37
7,9
50
36
1,3
21
38
0,2
56
38
4,5
23
40
2,2
05
41
2,0
86
Wa
ter
util
ity1
0,4
56
,50
7
10
,56
5,2
59
1
1,3
44
,69
7
11
,83
4,6
01
1
4,0
85
,13
3
1
6,4
01
,41
5
18
,81
3,3
73
1
8,2
42
,24
2
16
,52
0,3
62
20
,09
8,4
90
Se
we
r u
tility
1,7
76
,07
5
1
,87
5,0
14
1,8
94
,17
6
2
,00
8,5
07
1,9
32
,16
1
2,0
18
,40
5
2
,13
6,7
60
2,1
41
,42
2
2
,23
6,8
13
2
,32
2,7
56
Sa
nita
tion
2,8
44
,35
6
2
,95
9,5
36
3,0
37
,50
8
3
,13
8,1
25
3,1
58
,43
0
3,1
99
,13
5
3
,31
7,1
83
3,4
31
,01
3
3
,53
1,6
48
3
,58
4,1
53
Info
rma
tion
Te
chn
olo
gy
Ext
ern
al S
up
po
rt1
,02
6,6
09
1,6
79
,24
9
1
,54
6,0
20
1,6
42
,75
6
1
,67
6,5
77
1
,49
9,0
19
1,4
72
,73
0
1
,53
2,0
97
1,8
07
,30
5
1,9
59
,63
4
Op
era
ting
co
ntr
ibu
tion
s a
nd
gra
nts
-
-
-
11
,32
3
11
,32
3
11
,32
3
11
,37
1
-
1
1,3
71
5
25
,16
5
Ca
pita
l co
ntr
ibu
tion
s a
nd
gra
nts
19
2,5
27
2
14
,18
2
3
89
,90
5
-
-
-
1,2
09
,00
0
1
,52
1,0
00
-
-
To
tal b
usi
ne
ss-t
ype
act
iviti
es
pro
gra
m r
eve
nu
es
16
,61
0,8
36
1
7,6
22
,38
3
18
,54
6,0
66
1
8,9
86
,43
5
21
,24
1,5
74
23
,49
0,6
18
2
7,3
40
,67
3
27
,25
2,2
97
2
4,5
09
,70
4
2
8,9
02
,28
4
Pri
ma
ry g
ove
rnm
en
t p
rog
ram
re
ven
ue
s4
9,3
52
,20
0$
47
,97
1,8
55
$
5
8,0
59
,50
1$
45
,42
1,5
34
$
5
5,6
87
,65
9$
4
8,0
09
,62
7$
42
,86
9,3
53
$
4
5,7
84
,41
7$
39
,15
1,1
95
$
46
,68
7,8
90
$
144

CIT
Y O
F B
RE
A
CH
AN
GE
S I
N N
ET
PO
SIT
ION
LA
ST
TE
N F
ISC
AL
YE
AR
S(A
ccru
al b
asis
of
acco
un
tin
g)
Ne
t (E
xp
en
se
)/R
eve
nu
e:
Go
vern
me
nta
l act
iviti
es
(44
,31
2,1
98
)$
(5
3,6
54
,49
2)
$
(4
4,8
11
,11
2)
$
(6
3,6
98
,37
2)
$
(4
1,0
59
,04
4)
$
(3
8,2
82
,99
0)
$
(4
6,0
08
,43
5)
$
(4
4,5
27
,98
3)
$
(4
8,2
86
,39
1)
$
(5
1,6
34
,40
3)
$
Bu
sin
ess
-typ
e a
ctiv
itie
s1
,15
4,9
86
1,0
42
,38
6
(1
,28
2,4
83
)
(2
01
,97
8)
2
55
,66
4
2
,90
4,2
95
5,3
77
,26
0
5
,38
3,9
42
4,1
67
,45
5
7,2
43
,47
5
To
tal p
rim
ary
go
vern
me
nt
ne
t e
xpe
nse
(43
,15
7,2
12
)$
(5
2,6
12
,10
6)
$
(4
6,0
93
,59
5)
$
(6
3,9
00
,35
0)
$
(4
0,8
03
,38
0)
$
(3
5,3
78
,69
5)
$
(4
0,6
31
,17
5)
$
(3
9,1
44
,04
1)
$
(4
4,1
18
,93
6)
$
(4
4,3
90
,92
8)
$
Ge
ne
ral
Re
ven
ue
s a
nd
Oth
er
Ch
an
ge
s i
n N
et
Po
sit
ion
:
Go
vern
me
nta
l act
iviti
es:
Ta
xes Pro
pe
rty
taxe
s3
4,2
87
,28
9$
34
,58
0,1
06
$
3
1,7
65
,51
4$
35
,48
0,2
31
$
3
1,9
74
,08
0$
1
2,3
20
,88
9$
13
,31
4,7
58
$
1
4,6
27
,07
3$
16
,65
6,0
50
$
17
,88
7,9
84
$
Tra
nsi
en
t o
ccu
pa
ncy
ta
xes
1,3
13
,82
2
1
,21
3,3
62
1,1
76
,27
9
1
,22
7,1
68
1,2
80
,63
1
1,4
01
,14
0
1
,51
3,1
60
1,5
91
,83
9
1
,60
5,5
90
1
,71
6,1
80
Sa
les
taxe
s1
8,0
82
,98
8
16
,49
2,2
09
1
5,0
65
,20
7
16
,91
8,5
23
1
9,2
48
,77
1
1
9,3
15
,10
4
20
,65
7,9
18
2
0,5
72
,65
5
21
,61
1,8
73
21
,20
0,5
98
Fra
nch
ise
ta
xes
1,4
54
,01
0
1
,51
3,4
68
1,4
80
,28
6
1
,70
7,4
97
1,7
06
,63
1
1,6
93
,96
4
1
,68
2,2
74
1,6
25
,87
2
1
,58
9,9
50
1
,68
0,2
93
Bu
sin
ess
lice
nse
s ta
xes
1,0
71
,52
8
1
,07
9,2
60
1,0
35
,03
2
9
48
,18
4
9
75
,74
2
9
85
,39
1
1
,05
4,0
54
1,0
35
,22
0
1
,10
1,9
15
1
,07
8,5
09
Oth
er
taxe
s4
28
,93
3
37
1,0
63
39
6,6
76
37
9,6
39
55
5,2
91
69
0,8
40
86
0,5
20
97
7,0
74
79
7,4
75
39
2,0
75
Mo
tor
veh
icle
in li
eu
22
4,3
81
1
83
,02
6
1
63
,47
5
1
84
,31
1
7
0,2
27
7
1,8
47
6
8,8
46
6
9,9
78
7
2,5
51
7
5,3
98
Use
of
mo
ne
y a
nd
pro
pe
rty
1,6
63
,41
8
1
,42
5,9
66
2,0
12
,56
5
4
,05
4,9
82
1,2
42
,18
4
60
3,0
10
80
2,9
74
68
6,7
57
1,6
02
,07
6
1,1
10
,88
6
Ga
in o
n s
ale
of
ass
ets
-
-
-
-
-
6,9
23
76
,46
1
31
,39
6
83
,13
9
(1,7
31
)
Co
ntr
ibu
tion
s to
pe
rma
ne
nt
fun
ds
-
-
-
-
1
,32
2,8
91
-
-
-
-
-
Oth
er
1
,75
6,3
52
1,6
87
,27
8
5
67
,31
0
1
,67
5,4
28
1,1
77
,78
1
2,8
20
,33
5
1
,81
2,1
59
1,7
13
,16
3
3
,89
1,5
52
9
,72
5,2
01
E
xtra
ord
ina
ry g
ain
on
dis
solu
tion
of
Re
de
velo
pm
en
t A
ge
ncy
1-
-
-
-
11
9,6
86
,95
4
21
,52
2,3
03
-
(94
4,3
92
)
-
-
Tra
nsf
ers
(16
9,9
31
)
92
0,5
57
(3,5
88
)
5,1
53
,51
4
1
,09
3,0
19
3
,25
6,8
62
89
2,2
39
1,5
25
,97
9
1
,59
0,5
27
1
,12
5,4
15
To
tal g
ove
rnm
en
tal a
ctiv
itie
s 6
0,1
12
,79
0
59
,46
6,2
95
5
3,6
58
,75
6
67
,72
9,4
77
1
80
,33
4,2
02
6
4,6
88
,60
8
42
,73
5,3
63
4
3,5
12
,61
4
50
,60
2,6
98
55
,99
0,8
08
Bu
sin
ess
-typ
e a
ctiv
itie
s:
Use
of
mo
ne
y a
nd
pro
pe
rty
48
5,0
70
3
92
,55
3
9
72
,85
4
1
,05
2,9
16
41
5,2
56
54
,87
1
12
5,9
99
15
1,3
48
30
3,5
14
(23
,07
7)
Oth
er
6
80
,26
6
-
7
0,8
30
-
95
2,0
30
1,3
20
,69
9
1
,36
2,6
33
58
0,0
62
40
1,5
66
25
0,2
69
Tra
nsf
ers
16
9,9
31
(9
20
,55
7)
3
,58
8
(5
,15
3,5
14
)
(1
,09
3,0
19
)
(3
,25
6,8
62
)
(8
92
,23
9)
(1
,52
5,9
79
)
(1
,59
0,5
27
)
(1
,12
5,4
15
)
To
tal b
usi
ne
ss-t
ype
act
iviti
es
1,3
35
,26
7
(5
28
,00
4)
1
,04
7,2
72
(4,1
00
,59
8)
27
4,2
67
(1,8
81
,29
2)
59
6,3
93
(79
4,5
69
)
(88
5,4
47
)
(8
98
,22
3)
To
tal p
rim
ary
go
vern
me
nt
61
,44
8,0
57
$
5
8,9
38
,29
1$
54
,70
6,0
28
$
6
3,6
28
,87
9$
18
0,6
08
,46
9$
62
,80
7,3
16
$
4
3,3
31
,75
6$
42
,71
8,0
45
$
4
9,7
17
,25
1$
5
5,0
92
,58
5$
Ch
an
ge
in
Ne
t P
os
itio
n:
Go
vern
me
nta
l act
iviti
es
15
,80
0,5
92
$
5
,81
1,8
03
$
8,8
47
,64
4$
4
,03
1,1
05
$
13
9,2
75
,15
8$
26
,40
5,6
18
$
(3
,27
3,0
72
)$
(1
,01
5,3
69
)$
2
,31
6,3
07
$
4
,35
6,4
05
$
Bu
sin
ess
-typ
e a
ctiv
itie
s2
,49
0,2
53
51
4,3
82
(23
5,2
11
)
(4,3
02
,57
6)
52
9,9
31
1,0
23
,00
3
5
,97
3,6
53
4,5
89
,37
3
3
,28
2,0
08
6
,34
5,2
52
To
tal p
rim
ary
go
vern
me
nt
18
,29
0,8
45
$
6
,32
6,1
85
$
8,6
12
,43
3$
(2
71
,47
1)
$
1
39
,80
5,0
89
$
2
7,4
28
,62
1$
2,7
00
,58
1$
3
,57
4,0
04
$
5,5
98
,31
5$
10
,70
1,6
57
$
1 Du
rin
g t
he
fis
cal y
ea
r e
nd
ed
Ju
ne
30
, 2
01
2,
the
ass
ets
, lia
bili
ties
an
d f
un
d b
ala
nce
s o
f th
e B
rea
Re
de
velo
pm
en
t A
ge
ncy
we
re t
ran
sfe
rre
d t
o t
he
Su
cce
sso
r A
ge
ncy
on
Fe
bru
ary
1,
20
12
, a
s a
re
sult
of
the
dis
solu
tion
of
Re
de
de
vlo
pm
en
t A
ge
nci
es
in C
alif
orn
ia.
145

CIT
Y O
F B
RE
A
FU
ND
BA
LA
NC
ES
- G
OV
ER
NM
EN
TA
L F
UN
DS
LA
ST
TE
N F
ISC
AL
YE
AR
S(M
od
ifie
d a
ccru
al b
asis
of
acco
un
tin
g) F
isca
l Yea
rF
isca
l Yea
rF
isca
l Yea
rF
isca
l Yea
rF
isca
l Yea
rF
isca
l Yea
rF
isca
l Yea
rF
isca
l Yea
rF
isca
l Yea
rF
isca
l Yea
r
2007
-08
2008
-09
2009
-10
2010
-11
120
11-1
22
2012
-13
320
13-1
420
14-1
520
15-1
620
16-1
7G
ener
al F
und
R
eser
ved
2,32
2,13
7$
1,38
0,67
7$
785,
545
$
-$
-$
-$
-
$
-$
-$
-$
U
nres
erve
d19
,831
,412
20
,855
,888
21
,339
,180
-
-
-
-
-
-
-
Non
spen
dabl
e-
-
-
36
2,04
9
1,
580,
778
1,
675,
150
1,
096,
665
85
6,59
1
61
5,60
5
412,
659
Res
tric
ted
-
-
-
870,
294
926,
483
1,19
1,58
5
1,16
1,49
4
1,39
2,80
0
7,44
8,01
6
8,
201,
746
C
omm
itted
-
-
-
7,04
8,28
5
6,54
6,80
9
7,49
6,89
5
8,64
9,21
0
8,61
6,21
8
9,09
1,62
3
-
Ass
igne
d-
-
-
79
8,91
5
59
0,61
3
66
7,69
6
80
0,85
7
57
3,06
4
59
0,81
5
11,3
16,0
72
U
nass
igne
d-
-
-
16
,998
,367
21,0
75,7
61
21
,224
,287
21,0
46,6
57
23
,586
,834
19,1
54,8
69
14,0
77,6
09
T
otal
gen
eral
fund
22,1
53,5
49$
22,2
36,5
65$
22,1
24,7
25$
26,0
77,9
10$
30
,720
,444
$
32,2
55,6
13$
32
,754
,883
$
35,0
25,5
07$
36
,900
,928
$
34
,008
,086
$
All
Oth
er G
over
nmen
tal F
unds
R
eser
ved
38,4
14,6
00$
28,0
11,2
13$
47,4
77,0
75$
-$
-$
-$
-
$
-$
-$
-$
U
nres
erve
d, r
epor
ted
in:
Spe
cial
rev
enue
fund
s8,
441,
729
10
,753
,310
9,
623,
245
-
-
-
-
-
-
-
C
apita
l pro
ject
s fu
nds
17,8
93,7
45
32,3
41,6
56
22,7
96,4
32
-
-
-
-
-
-
-
Deb
t ser
vice
fund
s18
,483
,272
17
,927
,243
12
,049
,980
-
-
-
-
-
-
-
N
onsp
enda
ble
-
-
-
21,7
11,0
76
-
-
18,2
12,0
52
18
,067
,123
-
-
Res
tric
ted
-
-
-
70,2
55,5
97
25
,670
,313
52,1
88,0
42
29
,045
,330
28,7
21,7
40
47
,181
,358
44
,665
,332
A
ssig
ned
-
-
-
9,91
5,99
6
1,70
5,41
3
-
-
-
-
-
Una
ssig
ned
-
-
-
(335
,374
)
(5
4,14
1)
(1
44,6
52)
(8
9,97
1)
(7
8,49
7)
(7
9,17
1)
(19,
272)
T
otal
all
othe
r go
vern
men
tal f
unds
83,2
33,3
46$
89,0
33,4
22$
91,9
46,7
32$
101,
547,
295
$
27,3
21,5
85$
52
,043
,390
$
47,1
67,4
11$
46
,710
,366
$
47,1
02,1
87$
44,6
46,0
60$
1 D
urin
g th
e fis
cal y
ear
ende
d Ju
ne 3
0, 2
011,
the
City
ado
pted
GA
SB
Sta
tem
ent 5
4 w
hich
est
ablis
hed
new
cat
egor
ies
for
fund
bal
ance
.
2 D
urin
g th
e fis
cal y
ear
ende
d Ju
ne 3
0, 2
012,
the
asse
ts, l
iabi
litie
s (c
urre
nt a
nd lo
ng-t
erm
deb
t obl
igat
ions
) an
d fu
nd b
alan
ces
of th
e fo
rmer
Bre
a R
edev
elop
men
t Age
ncy
wer
e tr
ansf
erre
d
to
the
Suc
cess
or A
genc
y on
Feb
ruar
y 1,
201
2, a
s a
resu
lt of
the
diss
olut
ion
of r
edev
elop
men
t age
ncie
s in
Cal
iforn
ia.
3 D
urin
g th
e fis
cal y
ear
ende
d Ju
ne 3
0, 2
013,
the
Suc
cess
or A
genc
y tr
ansf
erre
d to
the
City
of B
rea
the
hous
ing
asse
ts o
f the
form
er B
rea
Red
evel
opm
ent A
genc
y.
146

CIT
Y O
F B
RE
A
CH
AN
GE
S IN
FU
ND
BA
LA
NC
ES
- G
OV
ER
NM
EN
TA
L F
UN
DS
LA
ST
TE
N F
ISC
AL
YE
AR
S(M
od
ifie
d a
ccru
al b
asis
of
acco
un
tin
g)
Fis
cal Y
ear
Fis
cal Y
ear
Fis
cal Y
ear
Fis
cal Y
ear
Fis
cal Y
ear
Fis
cal Y
ear
Fis
cal Y
ear
Fis
cal Y
ear
Fis
cal Y
ear
Fis
cal Y
ear
2007
-08
2008
-09
2009
-10
2010
-11
2011
-12
2012
-13
2013
-14
2014
-15
2015
-16
2016
-17
Rev
enu
es:
Tax
es58
,184
,372
$
56
,253
,190
$
55
,174
,409
$
53
,658
,443
$
52,9
65,1
61$
33,4
64,5
85$
35,6
21,1
19$
37,4
53,7
70$
40,5
26,3
09$
40,2
15,9
74$
Lice
nses
and
per
mits
389,
220
496,
386
468,
491
502,
449
468,
154
48
5,11
3
608,
664
64
5,05
4
782,
250
87
0,94
0
Inte
rgov
ernm
enta
l8,
114,
101
6,20
8,97
63,
678,
295
9,06
5,30
9
9,05
7,15
4
7,
391,
599
5,92
1,19
8
7,
992,
057
10,5
35,1
71
9,50
6,26
8
C
ontr
ibut
ions
-
-
13
,400
,000
-
6,
012,
024
2,29
9,56
8
19
9,81
1
497,
304
2,
080
53
5
C
harg
es fo
r se
rvic
es13
,946
,450
15,0
41,7
1814
,754
,248
17,5
78,1
36
16
,383
,685
12,3
86,9
85
7,41
6,27
9
8,
125,
141
5,45
1,45
2
6,
188,
947
Use
of m
one
y an
d pr
oper
ty 1
7,64
7,94
55,
219,
651
3,83
3,07
13,
625,
103
3,
212,
863
1,79
7,84
9
2,
580,
210
2,37
9,06
5
2,
778,
480
2,54
2,34
1
F
ines
and
forf
eitu
res
2,06
4,03
81,
834,
868
2,16
0,05
81,
823,
981
1,
811,
929
1,50
0,35
4
1,
067,
593
842,
001
79
0,24
7
597,
476
M
isce
llane
ous
2,54
9,66
92,
612,
448
2,56
6,83
63,
431,
088
5,
032,
030
5,37
7,48
4
2,
907,
555
3,02
5,88
3
2,
852,
006
5,46
2,81
6
T
otal
rev
enue
s
92,8
95,7
95
87,6
67,2
37
96,0
35,4
08
89,6
84,5
09
94
,943
,000
64,7
03,5
37
56,3
22,4
29
60,9
60,2
75
63,7
17,9
95
65,3
85,2
97
Exp
end
itu
res:
Gen
eral
Gov
ernm
ent
6,68
0,79
57,
125,
057
6,30
2,47
26,
199,
044
6,
889,
583
5,56
9,58
2
5,
479,
851
5,63
5,47
6
5,
751,
038
5,64
5,21
8
P
ublic
Saf
ety
34,3
81,7
6836
,548
,783
35,6
69,8
5534
,916
,663
36,9
25,6
86
35
,270
,155
31
,461
,089
31
,340
,804
33
,095
,380
34
,377
,568
D
evel
opm
ent S
ervi
ces
27,
568,
746
9,17
7,58
05,
177,
066
-
-
-
-
-
-
-
Com
mun
ity D
evel
opm
ent
2-
-
-
6,58
1,51
3
2,21
3,50
2
2,
669,
989
5,20
6,91
4
2,
853,
942
3,19
1,32
5
3,
470,
595
Com
mun
ity S
ervi
ces
5,98
2,07
06,
470,
313
6,10
8,15
35,
808,
160
5,
930,
685
6,14
1,74
6
6,
450,
201
6,75
0,90
9
7,
048,
955
7,39
5,36
3
M
aint
enan
ce S
ervi
ces
24,
299,
500
6,93
5,00
54,
201,
954
-
-
-
-
-
-
-
Pub
lic W
orks
2-
-
-
4,55
0,48
7
4,71
5,75
9
4,
769,
385
4,92
5,15
5
5,
200,
858
5,45
6,27
7
5,
778,
004
Cap
ital O
utla
y22
,321
,493
7,60
1,07
613
,152
,533
26,0
27,0
11
12
,901
,819
6,89
6,43
2
7,
350,
289
8,12
9,44
1
9,
372,
430
14,8
08,3
89
Deb
t ser
vice
:P
rinci
pal r
etire
men
t7,
716,
246
7,26
8,93
48,
476,
465
8,40
2,94
3
9,02
1,23
5
36
8,46
0
350,
000
37
0,00
0
618,
132
41
0,41
1
Inte
rest
and
fisc
al c
harg
es8,
800,
953
7,90
0,65
28,
899,
460
8,98
0,76
3
4,24
6,12
2
46
0,87
8
439,
402
41
6,79
2
420,
772
39
7,24
3
Deb
t iss
uanc
e co
sts
-
72
0,00
214
5,96
164
9,83
0
-
-
-
-
-
-
Pas
s-th
roug
h ag
reem
ent p
aym
ents
2,19
3,50
6
2,
564,
792
3,43
7,85
4
2,
537,
558
45
7,81
2
-
-
-
-
-
SE
RA
F p
aym
ent
-
-
8,98
3,76
6
1,
849,
599
-
-
-
-
-
-
Tot
al e
xpen
ditu
res
99,9
45,0
7792
,312
,194
100,
555,
539
106,
503,
571
83
,302
,203
62,1
46,6
27
61,6
62,9
01
60,6
98,2
22
64,9
54,3
09
72,2
82,7
91
Exc
ess
(def
icie
ncy)
of r
even
ues
over
(un
der)
exp
endi
ture
s(7
,049
,282
)
(4
,644
,957
)
(4
,520
,131
)
(1
6,81
9,06
2)11
,640
,797
2,55
6,91
0(5
,340
,472
)26
2,05
3(1
,236
,314
)(6
,897
,494
)O
ther
Fin
anci
ng
So
urc
es (
Use
s):
Tra
nsfe
rs in
31,6
16,0
7527
,097
,193
23,2
68,4
0933
,603
,347
11,0
74,8
21
6,
904,
709
5,89
0,55
2
6,
507,
993
4,37
8,33
3
10
,082
,394
T
rans
fers
out
(33,
120,
756)
(25,
761,
520)
(23,
361,
808)
(28,
816,
796)
(10,
207,
113)
(4
,733
,798
)
(4
,934
,249
)
(4
,956
,467
)
(2,8
26,8
81)
(8,5
33,8
69)
Sal
e of
cap
ital a
sset
s-
-
-
-
-
6,85
0
7,46
0
-
-
-
C
apita
l lea
ses
-
32
7,37
6
-
-
-
-
-
-
1,
952,
104
-
Lo
ng-t
erm
deb
t iss
ued
-
20
,925
,000
7,
415,
000
38,5
94,3
23
-
-
-
-
-
-
Ref
unde
d de
bt r
edee
med
-
(1
2,06
0,00
0)
-
(1
3,18
5,00
0)
-
-
-
-
-
-
Bon
d pr
emiu
m-
-
-
351,
694
-
-
-
-
-
-
B
ond
disc
ount
-
-
-
(1
74,7
57)
-
-
-
-
-
-
Tot
al o
ther
fina
ncin
g so
urce
s (u
ses)
(1,5
04,6
81)
10,5
28,0
49
7,32
1,60
1
30
,372
,811
867,
708
2,
177,
761
963,
763
1,
551,
526
3,50
3,55
6
1,
548,
525
Ext
raor
dina
ry g
ain
on d
isso
lutio
n of
Red
evel
opm
ent A
genc
y3, 4
-
-
-
-
(82,
091,
681)
21
,522
,303
-
-
-
-
Net
cha
nge
in fu
nd b
alan
ces
(8,5
53,9
63)
$
5,88
3,09
2$
2,
801,
470
$
13,5
53,7
49$
(6
9,58
3,17
6)$
26,2
56,9
74$
(4,3
76,7
09)
$
1,81
3,57
9$
2,
267,
242
$
(5,3
48,9
69)
$
Deb
t ser
vice
as
a pe
rcen
tage
of
nonc
apita
l exp
endi
ture
s21
.28%
18.7
6%20
.05%
20.1
0%17
.30%
1.52
%1.
43%
1.41
%1.
87%
1.41
%1 B
egin
ning
fisc
al y
ear
ende
d Ju
ne 3
0, 2
010,
the
amou
nt r
epor
ted
is a
com
bina
tion
of in
vest
men
t and
ren
tal i
ncom
e.2 E
ffect
ive
July
1, 2
010,
the
Dev
elop
men
t and
Mai
nten
ance
Ser
vice
s D
epar
tmen
ts w
ere
elim
inat
ed a
nd th
e C
omm
unity
Dev
elop
men
t and
Pub
lic W
orks
Dep
artm
ents
wer
e cr
eate
d du
e to
the
City
of B
rea'
s re
orga
niza
tion
plan
.
as
a r
esul
t of t
he d
isso
lutio
n of
red
evel
opm
ent a
genc
ies
in C
alifo
rnia
.
3 Dur
ing
the
fisca
l yea
r en
ded
June
30,
201
2, th
e as
sets
, lia
bilit
ies
(cur
rent
and
long
-ter
m d
ebt o
blig
atio
ns)
and
fund
bal
ance
s of
the
Bre
a R
edev
elop
men
t Age
ncy
wer
e tr
ansf
erre
d to
the
Suc
cess
or A
genc
y on
Feb
ruar
y 1,
201
2,
4 D
urin
g th
e fis
cal y
ear
ende
d Ju
ne 3
0, 2
013,
the
Suc
cess
or A
genc
y tr
ansf
erre
d to
the
City
of B
rea
the
hous
ing
asse
ts o
f the
form
er B
rea
Red
evel
opm
ent A
genc
y.
147

CITY OF BREA
ASSESSED VALUE AND ESTIMATED ACTUAL VALUE OF TAXABLE PROPERTYLAST TEN FISCAL YEARS
Fiscal TotalYear Taxable Total
Ended Residential Commercial Industrial Other Assessed Direct
June 30 Property Property Property Property 1 Value 2 Tax Rate
2008 3,369,302,387 1,178,077,438 730,088,623 1,528,851,283 6,806,319,731 0.17402
2009 3,420,432,796 1,535,537,061 1,161,803,074 917,687,313 7,035,460,244 0.17402
2010 3,319,962,213 1,554,892,370 1,199,008,537 905,419,292 6,979,282,412 0.17402
2011 3,579,683,419 1,548,534,540 1,135,559,625 753,830,318 7,017,607,902 0.17402
2012 3,637,044,394 1,543,677,299 1,077,624,463 723,537,802 6,981,883,958 0.17402
2013 3,805,741,803 1,544,954,532 1,145,495,173 682,982,424 7,179,173,932 0.17402
2014 3,927,143,843 1,569,625,782 1,112,039,475 839,411,616 7,448,220,716 0.17402
2015 4,377,268,712 1,580,151,775 1,167,513,932 826,734,462 7,951,668,881 0.17402
2016 4,945,219,822 1,670,210,797 1,168,849,914 740,725,273 8,525,005,806 0.17402
2017 5,359,064,633 1,725,644,969 1,264,334,778 775,342,859 9,124,387,239 0.17402
1 Other property includes recreational, institutional, vacant, and miscellaneous property.2 Tax-exempt property is excluded from the total taxable assessed value.
NOTE:
Sources: HdL Coren & Cone; Orange County Assessor
In 1978 the voters of the State of California passed Proposition 13 which limited property taxes to a total maximumrate of 1% based upon the assessed value of the property being taxed. Each year, the assessed value of propertymay be increased by an "inflation factor" (limited to a maximum increase of 2%). With few exceptions, property isonly reassessed at the time that it is sold to a new owner. At that point, the new assessed value is reassessed at thepurchase price of the property sold. The assessed valuation data shown above represents the only data currentlyavailable with respect to the actual market value of taxable property and is subject to the limitations described above.
In 1978 the voters of the State of California passed Proposition 13 which limited property taxes to a total maximumrate of 1% based upon the assessed value of the property being taxed. Each year, the assessed value of propertymay be increased by an "inflation factor" (limited to a maximum increase of 2%). With few exceptions, property isonly reassessed at the time that it is sold to a new owner. At that point, the new assessed value is reassessed at thepurchase price of the property sold. The assessed valuation data shown above represents the only data currentlyavailable with respect to the actual market value of taxable property and is subject to the limitations described above.
148

CIT
Y O
F B
RE
A
DIR
EC
T A
ND
OV
ER
LA
PP
ING
PR
OP
ER
TY
TA
X R
AT
ES
LA
ST
TE
N F
ISC
AL
YE
AR
S
Fis
cal Y
ear
Fis
cal Y
ear
Fis
cal Y
ear
Fis
cal Y
ear
Fis
cal Y
ear
Fis
cal Y
ear
Fis
cal Y
ear
Fis
cal Y
ear
Fis
cal Y
ear
Fis
cal Y
ear
2007
-08
2008
-09
2009
-10
2010
-11
2011
-12
2012
-13
2013
-14
2014
-15
2015
-16
2016
-17
City
Dire
ct R
ates
:C
ity o
f Bre
a0.
1290
2$
0.12
902
$
0.
1290
2$
0.12
902
$
0.12
902
$
0.
1290
2$
0.12
902
$
0.
1290
2$
0.
1290
2$
0.12
902
$
City
of B
rea
Par
amed
ics
Tax
10.
0450
0
0.04
500
0.
0450
0
0.04
500
0.04
500
0.04
500
0.04
500
0.
0450
0
0.
0450
0
0.04
500
Tot
al C
ity D
irect
Rat
e0.
1740
2
0.17
402
0.
1740
2
0.17
402
0.17
402
0.17
402
0.17
402
0.
1740
2
0.
1740
2
0.17
402
Ove
rlapp
ing
Rat
es:
Bre
a-O
linda
Uni
fied
Sch
ool D
istr
ict G
ener
al F
und
0.44
000
0.
4399
0
0.43
990
0.
4399
0
0.
4399
0
0.
4399
0
0.
4399
0
0.43
990
0.43
990
0.
4399
0
Bre
a-O
linda
Uni
fied
Sch
ool D
istr
ict B
onds
0.02
241
0.
0227
0
0.02
285
0.
0242
6
0.
0236
7
0.
0236
5
0.
0247
0
0.02
528
0.02
292
0.
0229
8
N
OC
Com
mun
ity C
olle
ge G
ener
al F
und
0.06
700
0.
0666
0
0.06
660
0.
0666
0
0.
0666
0
0.
0666
0
0.
0666
0
0.06
660
0.06
660
0.
0666
0
NO
C C
omm
unity
Col
lege
Bon
ds0.
0150
2
0.01
493
0.
0166
2
0.01
758
0.01
742
0.01
902
0.01
704
0.
0170
4
0.
0170
4
0.01
704
E
duca
tiona
l Rev
enue
Aug
men
tatio
n F
und
0.18
300
0.
1826
0
0.18
260
0.
1826
0
0.
1826
0
0.
1826
0
0.
1826
0
0.18
260
0.18
260
0.
1826
0
Ora
nge
Cou
nty
Dep
artm
ent o
f Edu
catio
n0.
0390
0
0.03
910
0.
0391
0
0.03
910
0.03
910
0.03
910
0.03
910
0.
0391
0
0.
0391
0
0.03
910
O
rang
e C
ount
y F
lood
Con
trol
Dis
tric
t 0.
0190
0
0.01
888
0.
0188
0
0.01
880
0.01
880
0.01
888
0.01
888
0.
0188
8
0.
0188
8
0.01
888
O
rang
e C
ount
y G
ener
al F
und
0.05
900
0.
0589
0
0.05
890
0.
0589
0
0.
0589
0
0.
0589
0
0.
0589
0
0.05
890
0.05
890
0.
0589
0
Ora
nge
Cou
nty
Har
bors
, Bea
ches
& P
arks
0.01
460
0.
0145
9
0.01
459
0.
0145
9
0.
0145
9
0.
0145
9
0.
0145
9
0.01
459
0.01
459
0.
0145
9
Ora
nge
Cou
nty
Libr
ary
Dis
tric
t 0.
0159
0
0.01
592
0.
0159
2
0.01
592
0.01
592
0.01
592
0.01
592
0.
0159
2
0.
0159
2
0.01
592
O
rang
e C
ount
y S
anita
tion
Dis
tric
t Tw
o O
pera
ting
0.03
100
0.
0308
0
0.03
080
0.
0308
0
0.
0308
0
0.
0308
0
0.
0308
0
0.03
080
0.03
080
0.
0308
0
Ora
nge
Cou
nty
Tra
nspo
rtat
ion
Aut
horit
y0.
0027
0
0.00
268
0.
0026
8
0.00
268
0.00
268
0.00
268
0.00
268
0.
0026
8
0.
0026
8
0.00
268
O
rang
e C
ount
y V
ecto
r C
ontr
ol0.
0011
0
0.00
107
0.
0010
7
0.00
107
0.00
107
0.00
107
0.00
107
0.
0010
7
0.
0010
7
0.00
107
M
etro
polit
an W
ater
Dis
tric
t 0.
0045
0
0.00
430
0.
0043
0
0.00
370
0.00
370
0.00
350
0.00
350
0.
0035
0
0.
0035
0
0.00
350
Tot
al D
irect
Rat
e1.
0882
5$
1.08
699
$
1.08
875
$
1.
0905
2$
1.
0897
7$
1.09
123
$
1.
0903
0$
1.09
088
$
1.08
852
$
1.
0885
8$
1 The
City
of B
rea
Par
amed
ic T
ax r
ate
is p
er $
100
of a
sses
sed
valu
e.
NO
TE
S:
Sou
rce:
HdL
Cor
en &
Con
e, O
rang
e C
ount
y A
sses
sor
Com
bine
d T
ax R
olls
In19
78,
Cal
iforn
iavo
ters
pass
edP
ropo
sitio
n13
whi
chse
tsth
epr
oper
tyta
xra
teat
a1.
00%
fixed
amou
nt.
Thi
s1.
00%
issh
ared
byal
ltax
ing
agen
cies
for
whi
chth
esu
bjec
tpr
oper
tyre
side
sw
ithin
.In
addi
tion
toth
e1.
00%
fixed
amou
nt,
prop
erty
owne
rsar
ech
arge
dta
xes
asa
perc
enta
geof
asse
ssed
prop
erty
valu
esfo
rth
epa
ymen
tofb
onde
dde
btan
dpr
oper
tyta
xov
errid
es.
. The
Red
evel
opm
entA
genc
yta
xra
teis
not
pres
ente
dab
ove
inth
atpr
oper
tyw
ithin
the
proj
ect
area
issu
bjec
tto
ata
xra
teof
1.04
95%
,whi
chin
clud
esth
eP
ropo
sitio
n13
prop
erty
tax
rate
of1.
00%
and
the
appl
icab
levo
ter
appr
oved
debt
.
In19
78,
Cal
iforn
iavo
ters
pass
edP
ropo
sitio
n13
whi
chse
tsth
epr
oper
tyta
xra
teat
a1.
00%
fixed
amou
nt.
Thi
s1.
00%
issh
ared
byal
ltax
ing
agen
cies
for
whi
chth
esu
bjec
tpr
oper
tyre
side
sw
ithin
.In
addi
tion
toth
e1.
00%
fixed
amou
nt,
prop
erty
owne
rsar
ech
arge
dta
xes
asa
perc
enta
geof
asse
ssed
prop
erty
valu
esfo
rth
epa
ymen
tofb
onde
dde
btan
dpr
oper
tyta
xov
errid
es.
The
Red
evel
opm
ent
Age
ncy
tax
rate
isno
tpr
esen
ted
abov
ein
that
prop
erty
with
inth
epr
ojec
tar
eais
subj
ect
toa
tax
rate
of1.
0495
%,
whi
chin
clud
esth
eP
ropo
sitio
n13
prop
erty
tax
rate
of1.
00%
and
the
appl
icab
levo
ter
appr
oved
debt
.
149

CIT
Y O
F B
RE
A
PR
INC
IPA
L P
RO
PE
RT
Y T
AX
PA
YE
RS
CU
RR
EN
T Y
EA
R A
ND
TE
N Y
EA
RS
AG
O
3E+
09
Tax
able
T
axab
le
Ass
esse
dA
sses
sed
Tax
pay
erV
alu
eR
ank
Val
ue
Ran
k
Ret
ail P
rope
rty
Tru
st24
4,44
0,77
7$
1
2.63
%20
0,59
1,87
1$
15.
32%
Ole
n P
oint
e B
rea
LLC
137,
339,
115
21.
48%
117,
681,
040
4
2.15
%
AB
S C
A-O
DC
2 LL
C13
0,45
6,27
8
3
1.40
%
CR
E B
rea
Val
enci
a LL
C11
1,67
7,50
0
4
1.20
%
FW
CA
-Bre
a M
arke
tpla
ce L
LC10
4,38
8,10
1
5
1.12
%85
,869
,618
7
2.29
%
Bec
kman
Cou
lter
Inc.
99
,034
,367
61.
07%
97,7
21,2
11
52.
36%
Bre
a U
nion
Pla
za II
LLC
77,9
08,1
86
7
0.84
%74
,431
,577
8
1.80
%
ICE
Hol
ding
s LL
C
53,8
47,8
88
8
0.58
%47
,189
,817
10
1.14
%
Mer
cury
Cas
ualty
Com
pany
52,6
01,5
73
9
0.57
%
BP
AP
Wes
t 135
& 1
45 L
LC51
,270
,125
100.
55%
Acq
uipo
rt B
rea
LP11
9,17
3,65
8
32.
88%
New
Alb
erts
on's
Inc
134,
327,
246
2
3.46
%
Equ
ity O
ffice
Pro
pert
ies
55,1
76,9
15
91.
47%
La F
lore
sta
86,7
00,0
00
62.
09%
1,06
2,96
3,91
0$
11.4
4%1,
018,
862,
953
$
24.9
6%
The
am
ount
s sh
own
abov
e in
clud
e as
sess
ed v
alue
dat
a fo
r bo
th th
e C
ity a
nd th
e R
edev
elop
men
t Age
ncy.
Sou
rces
: H
dL C
oren
& C
one,
Cou
nty
of O
rang
e A
sses
sor's
Offi
ce
To
tal C
ity
Tax
able
To
tal C
ity
Tax
able
Ass
esse
d V
alu
eA
sses
sed
Val
ue
Fis
cal Y
ear
Fis
cal Y
ear
2016
-17
2007
-08
Per
cen
tag
e o
fP
erce
nta
ge
of
150

CITY OF BREA
PROPERTY TAX LEVIES AND COLLECTIONSLAST TEN FISCAL YEARS
FiscalYear Taxes Levied Collections
Ended for the Percentage in Subsequent PercentageJune 30 Fiscal Year Amount of Levy Years Amount of Levy
2008 34,675,457 34,287,289 98.88 370,616 34,657,905 99.95
2009 34,655,751 34,504,139 99.56 354,837 34,858,976 100.59
2010 33,304,101 32,620,080 97.95 252,721 32,872,801 98.70
2011 34,970,273 35,335,027 101.04 145,204 35,480,231 101.46
2012 32,242,292 31,678,555 98.25 295,525 31,974,080 99.17
20131 12,449,282 12,125,387 97.40 195,502 12,320,889 98.97
2014 13,412,523 13,173,993 98.22 140,765 13,314,758 99.27
2015 14,720,458 14,481,121 98.37 145,952 14,627,073 99.37
2016 16,669,635 16,489,408 98.92 166,642 16,656,050 99.92
2017 17,274,771 16,771,004 97.08 172,238 16,943,242 98.08
NOTE:
The amounts presented include property taxes and Redevelopment Agency tax increment. This schedule also includes amounts collected by the City and Redevelopment Agency that were passed-through to other agencies.
Source: County of Orange Auditor Controller's Office
Collected within theFiscal Year of the Levy Total Collections to Date
1 Beginning Feburary 1, 2012, the property tax revenues of the former Brea Redevelopment Agency are now accounted for in the Successor Agency to the Brea Redevelopment Agency.
151

CIT
Y O
F B
RE
A
TA
XA
BL
E S
AL
ES
BY
CA
TE
GO
RY
LA
ST
TE
N F
ISC
AL
YE
AR
S
Cat
ego
ry20
0820
0920
1020
1120
1220
1320
14
2015
2016
2017
Dep
artm
ent S
tore
s2,
983,
783
$
2,
759,
775
$
2,
950,
535
$
3,
037,
419
$
3,
158,
876
$
3,
060,
495
$
3,
000,
876
$
3,
020,
454
$
2,
959,
079
$
2,
827,
804
$
R
esta
uran
t1,
765,
436
1,
595,
896
1,
556,
835
1,
679,
527
1,
902,
210
2,
004,
400
2,
082,
644
2,
159,
263
2,
258,
542
2,
305,
596
Li
ght I
ndus
try
1,66
6,22
5
1,48
5,57
5
1,49
7,01
6
1,85
4,80
4
1,71
3,50
4
1,75
9,29
7
2,14
2,29
8
2,04
9,52
7
2,17
1,91
7
2,15
8,76
1
Bui
ldin
g M
ater
ials
-Who
lesa
le1,
125,
562
1,
105,
874
1,
061,
908
1,
348,
297
1,
346,
742
1,
622,
498
1,
676,
631
1,
799,
592
2,
051,
748
2,
116,
119
A
ppar
el S
tore
s1,
798,
551
1,
525,
844
1,
443,
568
1,
581,
487
1,
661,
679
1,
755,
021
1,
697,
734
1,
732,
123
1,
696,
435
1,
676,
921
M
isce
llane
ous
Ret
ail
1,72
2,73
6
1,44
0,36
6
1,28
7,07
4
1,37
2,51
2
1,56
0,44
6
1,60
0,59
9
1,70
7,98
3
1,77
9,00
9
1,65
2,69
7
1,55
8,41
3
Fur
nitu
re/A
pplia
nce
673,
297
534,
043
558,
615
683,
424
764,
254
708,
157
686,
308
801,
114
763,
158
810,
168
Ser
vice
Sta
tions
739,
166
734,
678
649,
050
917,
704
998,
449
991,
760
1,00
1,72
4
844,
593
712,
761
674,
913
Foo
d M
arke
ts35
4,15
9
26
1,52
9
26
9,15
0
26
3,46
2
27
1,68
0
28
4,28
8
35
8,91
7
35
8,91
7
46
9,42
0
48
8,16
5
B
uild
ing
Mat
eria
ls-R
etai
l37
5,24
8
32
6,52
0
32
8,47
2
36
6,25
3
34
5,83
2
45
0,63
1
45
0,01
3
44
6,27
8
47
0,34
0
47
2,17
8
H
eavy
Indu
stry
371,
096
382,
130
309,
395
391,
235
369,
982
498,
859
346,
253
356,
465
408,
035
359,
099
Aut
o S
ales
-New
2,93
8
1,90
8
769
16
0
247
26
2
330,
614
315,
306
288,
732
441,
956
Oth
er2,
733,
598
2,
289,
386
1,
925,
965
2,
135,
394
2,
084,
482
1,
798,
200
1,
774,
919
1,
805,
690
1,
922,
933
1,
927,
869
T
otal
16,3
11,7
95
$
14,4
43,5
24$
13
,838
,352
$
15,6
31,6
78$
16
,178
,383
$
16,5
34,4
67$
17
,256
,914
$
17,4
68,3
31$
17
,825
,797
$
17,8
17,9
62$
Not
e: T
otal
s do
not
incl
ude
port
ion
of S
tate
and
Cou
nty
pool
as
wel
l as
the
impa
ct o
f the
Sta
te T
riple
Flip
.
Sou
rce:
Mun
iSer
vice
s
152

CIT
Y O
F B
RE
A
RA
TIO
OF
OU
TS
TA
ND
ING
DE
BT
BY
TY
PE
LA
ST
TE
N F
ISC
AL
YE
AR
SB
usi
nes
s-T
ype
Act
ivit
ies
Fis
cal Y
ear
Lea
seT
ota
lW
ater
To
tal
Per
cen
tag
eE
nd
ed T
ax A
lloca
tio
nR
even
ue
Cap
ital
G
ove
rnm
enta
lR
even
ue
Pri
mar
yo
f P
erso
nal
Deb
t
Jun
e 30
Bo
nd
s 4
, 5B
on
ds 5
Lea
ses 2
, 7A
ctiv
itie
sB
on
ds1,
3, 6
Go
vern
men
tIn
com
e 8 P
er C
apit
a 8
2008
181,
975,
649
15
,310
,000
3,
552,
175
200,
837,
824
14,9
75,0
0021
5,81
2,82
4
11.1
7%5,
384
2009
188,
442,
073
14
,495
,000
2,
993,
624
205,
930,
697
25,8
00,0
0023
1,73
0,69
7
11.4
3%5,
768
2010
178,
909,
196
16
,485
,000
6,
716,
146
202,
110,
342
38,0
95,0
0024
0,20
5,34
2
11.4
6%5,
949
2011
197,
967,
628
15
,360
,000
6,
106,
031
219,
433,
659
37,7
60,0
0025
7,19
3,65
9
13.1
0%6,
419
2012
-
2,
760,
000
5,16
1,90
2
7,
921,
902
37,2
65,0
0045
,186
,902
2.
21%
1,10
4
2013
-
2,
760,
000
4,65
9,56
4
7,
419,
564
36,3
25,0
0043
,744
,564
2.
10%
1,05
7
2014
-
2,
760,
000
4,16
9,40
9
6,
929,
409
35,3
50,0
0042
,279
,409
1.
83%
997
2015
-
2,
760,
000
3,65
2,69
0
6,
412,
690
52,8
90,0
0059
,302
,690
2.
48%
1,36
9
2016
-
2,
760,
000
4,83
3,07
1
7,
593,
071
53,3
25,4
9560
,918
,566
2.
41%
1,39
4
2017
-
2,
760,
000
4,26
1,87
6
7,
021,
876
50,1
50,0
0057
,171
,876
2.
26%
1,29
3
5 F
or th
e fis
cal y
ear
ende
d Ju
ne 3
0, 2
012,
out
stan
ding
long
term
deb
ts o
f the
Bre
a R
edev
elop
men
t Age
ncy
wer
e tr
ansf
erre
d to
the
Suc
cess
or A
genc
y on
F
ebru
ary
1, 2
012,
as
a re
sult
of d
isso
lutio
n of
red
evel
opm
ent a
genc
ies
in C
alifo
rnia
.
NO
TE
: D
etai
ls r
egar
ding
the
outs
tand
ing
debt
can
be
foun
d in
the
note
s of
the
finan
cial
sta
tem
ents
.
4 F
or th
e fis
cal y
ear
ende
d Ju
ne 3
0, 2
011,
the
Bre
a R
edev
elop
men
t Age
ncy
issu
ed o
ver
$29
mill
ion
of ta
x al
loca
tion
bond
s.
6 F
or th
e fis
cal y
ear
ende
d Ju
ne 3
0, 2
015,
the
Bre
a C
omm
unity
Ben
efit
Fin
anci
ng A
utho
rity
issu
ed o
ver
$18
mill
ion
of w
ater
rev
enu
e bo
nds.
8 S
ee th
e S
ched
ule
of D
emog
raph
ic a
nd E
cono
mic
Sta
tistic
s fo
r pe
rson
al in
com
e an
d po
pula
tion
data
.
Go
vern
men
tal A
ctiv
itie
s
1 F
or th
e fis
cal y
ear
ende
d Ju
ne 3
0, 2
009,
the
Bre
a P
ublic
Fin
anci
ng A
utho
rity
issu
ed $
12,8
55,0
00 in
wat
er r
even
ue r
efun
ding
bon
ds
and
$12,
945,
000
in n
ew m
oney
bon
ds.
2 F
or th
e fis
cal y
ear
ende
d Ju
ne 3
0, 2
010,
the
City
of B
rea
ente
red
into
a le
ase-
purc
hase
agr
eem
ent f
or $
4,58
0,00
0.
7 F
or th
e fis
cal y
ear
ende
d Ju
ne 3
0, 2
016,
the
City
of B
rea
ente
red
into
a le
ase
purc
hase
agr
eem
ent f
or $
1,95
2,10
4.
3 F
or th
e fis
cal y
ear
ende
d Ju
ne 3
0, 2
010,
the
Bre
a P
ublic
Fin
anci
ng A
utho
rity
issu
ed o
ver
$12
mill
ion
of w
ater
rev
enue
bon
ds.
153

CIT
Y O
F B
RE
A
RA
TIO
OF
NE
T G
EN
ER
AL
BO
ND
ED
DE
BT
OU
TS
TA
ND
ING
LA
ST
TE
N F
ISC
AL
YE
AR
S
Fis
cal Y
ear
Lea
seP
erce
nta
ge
of
En
ded
Tax
Allo
cati
on
Rev
enu
eR
estr
icte
d f
or
Net
Ass
esse
d V
alu
eP
er
Jun
e 30
Bo
nd
s 1,
2B
on
ds
2T
ota
l D
ebt
Ser
vice
2B
on
ded
Deb
to
f P
rop
erty
3C
apit
a 4
2008
181,
975,
649
15
,310
,000
19
7,28
5,64
9
3,18
8,03
1
194,
097,
618
2.85
%4,
477
2009
185,
442,
073
14
,495
,000
19
9,93
7,07
3
3,71
3,38
2
196,
223,
691
2.79
%4,
592
2010
178,
909,
196
16
,485
,000
19
5,39
4,19
6
3,75
8,77
6
191,
635,
420
2.75
%4,
629
2011
197,
967,
628
15
,360
,000
21
3,32
7,62
8
6,64
7,62
8
206,
680,
000
2.95
%5,
247
2012
-
2,
760,
000
2,76
0,00
0
30
1,97
2
2,
458,
028
0.04
%60
2013
-
2,
760,
000
2,76
0,00
0
29
1,13
0
2,
468,
870
0.03
%60
2014
-
2,
760,
000
2,76
0,00
0
29
3,71
3
2,
466,
287
0.03
%58
2015
-
2,
760,
000
2,76
0,00
0
26
4,63
6
2,
495,
364
0.03
%58
2016
-
2,
760,
000
2,76
0,00
0
26
9,45
3
2,
490,
547
0.03
%57
2017
-
2,
760,
000
2,76
0,00
0
26
5,70
7
2,
494,
293
0.03
%57
1 F
or th
e fis
cal y
ear
ende
d Ju
ne 3
0, 2
011,
the
Red
evel
omen
t Age
ncy
issu
ed o
ver
$29
mill
ion
of ta
x al
loca
tion
bond
s in
Jun
e, 2
011,
whi
ch in
clud
ed
ov
er $
22 m
illio
n in
new
bon
ds r
esul
ting
in th
e in
crea
se2
F
or th
e fis
cal y
ear
ende
d Ju
ne 3
0, 2
012,
out
stan
ding
long
term
deb
ts o
f the
Bre
a R
edev
elop
men
t Age
ncy
wer
e tr
ansf
erre
d to
the
Suc
cess
or A
genc
y
on
Feb
ruar
y 1,
201
2, a
s a
resu
lt of
dis
solu
tion
of R
edev
elop
men
t Age
ncie
s in
Cal
iforn
ia.
3 S
ee s
ched
ule
of A
sses
sed
Val
ue a
nd E
stim
ated
Act
ual V
alue
of T
axab
le P
rope
rty
for
prop
erty
val
ue d
ata.
4 P
opul
atio
n da
ta c
an b
e fo
und
in s
ched
ule
of D
emog
raph
ic a
nd E
cono
mic
Sta
tistic
s.
NO
TE
: D
etai
ls r
egar
ding
the
City
's o
utst
andi
ng d
ebt c
an b
e fo
und
in th
e no
tes
to th
e fin
anci
al s
tate
men
ts.
Gen
eral
Bo
nd
ed D
ebt
Ou
tsta
nd
ing
154

CITY OF BREA
DIRECT AND OVERLAPPING GOVERNMENTAL ACTIVITIES DEBTAS OF JUNE 30, 2017
City Assessed Valuation: 9,116,002,399$
Estimated Estimated SharePercentage Debt of Overlapping
Applicable 1 Outstanding DebtOverlapping Debt Repaid with Property Taxes:
Metropolitan Water District 0.352 74,905,000$ 263,666$ North Orange County Joint Community College District 7.706 240,284,001 18,516,285 Brea-Olinda Unified School District 94.539 14,814,029 14,005,035 Placentia-Yorba Linda Unified School District 1.276 242,284,159 3,091,546 Rowland Unified School District 0.149 243,811,554 363,279 Fullerton Joint Union High School District 1.952 126,837,910 2,475,876 Fullerton School District 0.008 34,680,458 2,774 La Habra City School District 11.027 21,991,369 2,424,988 City of Brea Community Facilities Districts 100 13,055,000 13,055,000 Brea-Olinda Unified School District Community 100 6,310,000 6,310,000
Facilities District No. 95-1Total overlapping debt repaid with property taxes 1,018,973,480 60,508,449
Overlapping Other Debt:Orange County General Fund Obligation 1.736 227,516,000$ 3,949,678$ Orange County Pension Obligations Bonds 1.736 386,762,539 6,714,198 Orange County Board of Education Certificates of Participation 1.736 14,440,000 250,678 North Orange Regional Occupation Program Certificates of Participation 7.917 9,910,000 784,575 Brea-Olinda Unified School District Certificates of Participation 94.539 18,410,000 17,404,630 Placentia-Yorba Linda Unified School District Certificates of 1.276 95,540,355 1,219,095
ParticipationRowland Unified School District Certificates of Participation 0.149 5,000,000 7,450 Fullerton Joint Union High School District Certificates of Participation 1.952 19,920,000 388,838 Fullerton School District Certificates of Participation 0.008 5,165,000 413 Total overlapping general fund debt 30,719,555 2
Total overlapping debt 91,228,004$
Lease Revenue Bonds 2,760,000$ Capital Leases 4,261,876 Total City of Brea Direct Debt 7,021,876$
Combined total direct and overlapping debt 98,249,880$ 3
1
2
3
NOTE:
Source: California Municipal Statistics, Inc.
City of Brea Direct Debt:
Excludes tax and revenue anticipation notes, enterprise revenue, mortgage revenue and tax allocation bonds.
Percentage of overlapping agency's assessed valuation located within the boundaries of the city.
Percentage of overlapping agency's assessed valuation located within the boundaries of the City.
Overlapping governments are those that coincide, at least in part, with the geographic boundaries of the City. This schedule estimates the portion ofoutstanding debt of those overlapping governments that is borne by the residents and businesses of the City of Brea. This process recognizes that,when considering the government's ability to issue and repay long-term debt, the entire debt burden borne by the residents and businesses should betaken into account. However, this does not imply that every taxpayer is a resident, and therefore responsible for repaying the debt, of eachoverlapping government.
Previously classified Orange County Sanitation District certificates of participation have been reclassified as districtPercentage of overlapping agency's assessed valuation located within the boundaries of the city.
Overlapping governments are those that coincide, at least in part, with the geographic boundaries of the City. This schedule estimates the portion ofoutstanding debt of those overlapping governments that is borne by the residents and businesses of the City of Brea. This process recognizes that, whenconsidering the government's ability to issue and repay long-term debt, the entire debt burden borne by the residents and businesses should be taken intoaccount. However, this does not imply that every taxpayer is a resident, and therefore responsible for repaying the debt, of each overlappinggovernment.
Percentage of overlapping agency's assessed valuation located within the boundaries of the City.
Overlapping governments are those that coincide, at least in part, with the geographic boundaries of the City. This schedule estimates the portion ofoutstanding debt of those overlapping governments that is borne by the residents and businesses of the City of Brea. This process recognizes that,when considering the government's ability to issue and repay long-term debt, the entire debt burden borne by the residents and businesses should betaken into account. However, this does not imply that every taxpayer is a resident, and therefore responsible for repaying the debt, of eachoverlapping government.
Previously classified Orange County Sanitation District certificates of participation have been reclassified as district
155

CIT
Y O
F B
RE
A
LE
GA
L D
EB
T M
AR
GIN
INF
OR
MA
TIO
NL
AS
T T
EN
FIS
CA
L Y
EA
RS
Fis
cal Y
ear
Fis
cal Y
ear
Fis
cal Y
ear
Fis
cal Y
ear
Fis
cal Y
ear
Fis
cal Y
ear
Fis
cal Y
ear
Fis
cal Y
ear
Fis
cal Y
ear
Fis
cal Y
ear
2007
-08
2008
-09
2009
-10
2010
-11
2011
-12
2012
-13
2013
-14
2014
-15
2015
-16
2016
-17
Ass
esse
d va
lue
6,80
6,31
9,73
1$
7,
035,
460,
244
$
6,97
9,28
2,41
2$
6,
979,
282,
412
$
7,32
8,30
3,02
2$
7,
556,
214,
577
$
7,81
5,15
7,06
9$
8,
026,
908,
085
$
8,53
2,57
6,96
7$
9,
116,
002,
399
$
De
bt l
imit:
3.7
5%
of
a
sses
sed
valu
e25
5,23
6,99
0
263,
829,
759
26
1,72
3,09
0
261,
723,
090
27
4,81
1,36
3
283,
358,
047
29
3,06
8,39
0
301,
009,
053
31
9,97
1,63
6
341,
850,
090
Tot
al n
et d
ebt a
pplic
able
to li
mit
Tot
al g
ener
al o
blig
atio
n bo
nded
deb
t-
Less
net
ass
ets
in d
ebt s
ervi
ce f
und
-
Tot
al a
mou
nt o
f de
bt a
pplic
able
to d
ebt l
imit
-$
Lega
l deb
t mar
gin
341,
850,
090
$
NO
TE
:U
nder
stat
efin
ance
law
,th
eC
ityof
Bre
a's
outs
tand
ing
gen
eral
oblig
atio
nde
btsh
oul
dn
ote
xce
ed3.
75pe
rcen
tof
tota
las
sess
edpr
oper
tyva
lue.
By
law
,the
gene
ralo
blig
atio
nde
btsu
bjec
tto
the
limita
tion
ma
ybe
offs
etb
yam
ount
sse
tasi
defo
rre
payi
ngge
nera
lobl
igat
ion
bond
s.
156

CIT
Y O
F B
RE
A
PL
ED
GE
D R
EV
EN
UE
CO
VE
RA
GE
LA
ST
TE
N F
ISC
AL
YE
AR
S
Fis
cal
Yea
rL
ess:
Net
En
ded
Tax
Gro
ssO
per
atin
gA
vaila
ble
Jun
e 30
Incr
emen
t 5,
6P
rin
cip
al 6
Inte
rest
6C
ove
rag
e 6
Rev
enu
es 1
Exp
ense
s 2
Rev
enu
eP
rin
cip
al 3
Inte
rest
4C
ove
rag
e
2008
23,5
00,0
00
6,34
5,00
0
7,94
7,20
7
1.64
10,4
10,0
74
8,77
4,94
1
1,
635,
133
76
5,00
0
816,
508
1.
03
2009
23,5
00,0
00
5,79
5,00
0
7,13
2,48
1
1.82
10,3
44,7
71
9,12
3,21
4
1,
221,
557
79
0,00
0
552,
885
0.
91
2010
20,0
62,1
46
6,95
0,00
0
8,18
2,91
6
1.33
11,5
63,3
25
10,4
71,5
57
1,09
1,76
8
-
1,
359,
105
0.80
2011
19,8
54,1
55
6,96
0,00
0
7,89
5,70
4
1.34
11,8
74,6
13
10,5
10,8
21
1,36
3,79
2
335,
000
1,
291,
835
0.84
2012
-
-
-
-
13,6
59,1
42
11,1
96,3
71
2,46
2,77
1
495,
000
1,
536,
324
1.21
2013
-
-
-
-
15,6
39,6
30
10,7
00,7
31
4,93
8,89
9
940,
000
1,
548,
591
1.98
2014
-
-
-
-
18,2
04,8
36
11,8
73,9
94
6,33
0,84
2
975,
000
1,
540,
597
2.52
2015
-
-
-
-
17,8
03,7
55
10,6
85,1
47
7,11
8,60
8
1,01
5,00
0
2,
351,
374
2.11
2016
-
-
-
-
16,4
89,0
77
9,16
2,03
8
7,
327,
039
1,
315,
000
2,34
8,73
7
2.
00
2017
-
-
-
-
19,1
94,8
16
9,86
5,66
1
9,
329,
155
1,
425,
000
2,38
1,87
3
2.
45
1 2 3 4 5 6
Tax
Allo
cati
on
Bo
nd
sW
ater
Rev
enu
e B
on
ds
Deb
t S
ervi
ceD
ebt
Ser
vice
Gro
ssre
venu
esex
clud
eco
nnec
tion
fees
.
Ope
ratin
gex
pens
esdo
not
incl
ude
inte
rest
orde
prec
iatio
n.
InM
ay20
09,
the
Bre
aP
ublic
Fin
anci
ngA
utho
rity
issu
edov
er$1
2.9
mill
ion
ofw
ater
reve
nue
refu
ndin
gbo
nds,
whi
chre
fund
edth
e19
98W
ater
Rev
enue
Ref
undi
ngB
onds
resu
lting
inno
prin
cipa
lpay
men
tdu
ein
July
1,20
09.
Inte
rest
expe
nse
isne
tof
the
Bui
ldA
mer
ica
Bon
dsin
tere
stre
fund
cred
its.
Beg
inni
ngfis
caly
ear
ende
dJu
ne30
,20
10,
tax
incr
emen
tis
net
ofta
xin
crem
ent
reve
nue
shar
ing
paym
ents
.
For
the
fisca
lyea
ren
ded
June
30,
2012
,ou
tsta
ndin
glo
ngte
rmde
bts
ofth
eB
rea
Red
evel
opm
ent
Age
ncy
wer
etr
ansf
erre
dto
the
Suc
cess
orA
genc
yon
Feb
ruar
y1,
2012
,as
are
sult
ofdi
ssol
utio
nof
rede
velo
pmen
tag
enci
esin
Cal
iforn
ia.
InM
ay20
14,
the
Bre
aC
omm
unity
Fin
anci
ngA
utho
rity
issu
edov
er$1
8m
illio
nof
wat
erre
venu
ebo
nds.
NO
TE
:D
etai
lsre
gard
ing
the
City
'sou
tsta
ndin
gde
btca
nbe
foun
din
the
note
sto
the
finan
cial
stat
emen
ts.
Gro
ssre
venu
esex
clud
eco
nnec
tion
fees
.
Ope
ratin
gex
pens
esdo
not
incl
ude
inte
rest
orde
prec
iatio
n.
InM
ay20
09,
the
Bre
aP
ublic
Fin
anci
ngA
utho
rity
issu
edov
er$1
2.9
mill
ion
ofw
ater
reve
nue
refu
ndin
gbo
nds,
whi
chre
fund
edth
e19
98W
ater
Rev
enue
Ref
undi
ngB
onds
resu
lting
inno
prin
cipa
lpay
men
tdu
ein
July
1,20
09.
Inte
rest
expe
nse
isne
tof
the
Bui
ldA
mer
ica
Bon
dsin
tere
stre
fund
cred
its.
Beg
inni
ngfis
caly
ear
ende
dJu
ne30
,20
10,
tax
incr
emen
tis
net
ofta
xin
crem
ent
reve
nue
shar
ing
paym
ents
.
For
the
fisca
lyea
ren
ded
June
30,
2012
,ou
tsta
ndin
glo
ngte
rmde
bts
ofth
eB
rea
Red
evel
opm
ent
Age
ncy
wer
etr
ansf
erre
dto
the
Suc
cess
orA
genc
yon
Feb
ruar
y1,
2012
,as
are
sult
ofdi
ssol
utio
nof
rede
velo
pmen
tag
enci
esin
Cal
iforn
ia.
NO
TE
:D
etai
lsre
gard
ing
the
City
'sou
tsta
ndin
gde
btca
nbe
foun
din
the
note
sto
the
finan
cial
stat
emen
ts.
157

CITY OF BREA
DEMOGRAPHIC AND ECONOMIC STATISTICSLAST TEN FISCAL YEARS
Fiscal Year Personal Per CapitaEnded Income Personal Unemployment
June 30 Population 1 (in thousands) Income 2 Rate 3
2008 40,081 1,932,265 48,209 4.1%
2009 40,176 2,027,401 50,463 7.2%
2010 40,377 2,095,324 51,894 6.2%
2011 40,065 1,963,986 49,020 6.6%
2012 40,932 2,040,992 49,863 6.0%
2013 41,394 2,087,913 50,440 5.2%
2014 42,397 2,311,442 54,519 4.2%
2015 43,328 2,387,199 55,096 3.9%
2016 43,710 2,524,209 57,749 3.4%
2017 44,214 2,744,407 62,071 3.1%
Sources: 1 City Community Development, Planning Division2 Per capita income for Orange County; U.S. Department of Commerce, Bureau of Economic Analysis3 State of California Employment Development Department - Labor Market Information Division
158

CITY OF BREA
PRINCIPAL EMPLOYERSCURRENT FISCAL YEAR AND TEN YEARS AGO
Percent of Percent ofTotal City Total City
Employer Employees Rank Employment 1 Employees Rank Employment
Mercury Insurance Group 1,650 1 7.67% 3,000 1 14.22%
Bank of America2 1,500 2 6.98% 1,500 3 7.11%
Albertson's, Inc. 1,273 3 5.92% 1,200 4 5.69%
Beckman Coulter, Inc. 1,034 4 4.81% 3,000 2 14.22%
Brea Olinda Unified School District 947 5 4.40% 500 6 2.37%
Kirkhill - TA Company 841 6 3.91% 700 5 3.32%
Veterinary Pet Insurance Co. 460 7 2.14%
Bristol Industries 410 8 1.91%
Peterson Brothers Construction 361 9 1.68%
Avery Dennison Adminstrative 271 10 450 9 2.13%
Harte-Hanks Communications 500 7 2.37%
Capital Group 400 10 1.90%
ITT Hartford Insurance Group 450 8 2.13%
Total 7,097 31.75% 8,700 41.24%
1 Based upon the Employment Development Department's estimate of 21,500 residents employed in 2017 out of atotal population of 44,214.2 Unable to confirm, used last year number.
Source: City of Brea Business License Division and calls to businesses.
Fiscal FiscalYear Year
2016-17 2007-08
159

CIT
Y O
F B
RE
A
FU
LL
-TIM
E E
QU
IVA
LE
NT
CIT
Y E
MP
LO
YE
ES
BY
FU
NC
TIO
NL
AS
T T
EN
FIS
CA
L Y
EA
RS
Fu
nct
ion
2008
2009
2010
2011
2012
2013
2014
2015
2016
2017
Gen
eral
Gov
ernm
ent
68
69
56
57
57
59
58
59
60
59
Pub
lic S
afet
y22
6
22
6
21
1
21
3
21
3
21
2
16
7
15
8
15
8
15
9
Dev
elop
men
t Ser
vice
s32
33
29
--
--
--
-
Com
mun
ity D
evel
opm
ent1
--
-20
20
20
21
21
21
23
Com
mun
ity S
ervi
ces
50
52
48
39
48
52
52
52
55
56
Mai
nten
ance
Ser
vice
s38
42
32
--
--
--
-
Pub
lic W
orks
2-
--
37
39
42
41
42
45
47
Wat
er U
tility
16
14
16
16
14
15
17
17
17
15
Sew
er U
tility
4
4
6
6
6
6
6
6
6
6
San
itatio
n2
2
2
2
2
2
2
2
2
4
Mob
ile D
ata
Sys
tem
1
1
--
--
--
--
Ext
erna
l Inf
orm
atio
n T
echn
olog
y3-
-9
9
9
9
10
10
10
12
Tot
al43
7
44
3
40
9
39
9
40
8
41
7
37
3
36
7
37
4
38
1
1 P
rior
to F
Y20
11, C
omm
unity
Dev
elop
men
t was
rep
orte
d un
der
Dev
elop
men
t Ser
vice
s fu
nctio
n.2 P
rior
to F
Y20
11, P
ublic
Wor
ks w
as r
epor
ted
unde
r M
aint
enan
ce S
ervi
ces
func
tion.
3 P
rior
to F
Y20
10, E
xter
nal I
nfor
mat
ion
Tec
hnol
ogy
Ser
vice
s w
as r
epor
ted
unde
r G
ener
al G
over
nmen
t fun
ctio
n.
Sou
rce:
City
of B
rea
Ado
pted
Bud
get a
nd S
uppl
emen
ts to
the
Ado
pted
Bud
get.
160

CITY OF BREA
OPERATING INDICATORS BY FUNCTIONLAST TEN FISCAL YEARS
2008 2009 2010 2011 2012 2013 2014 2015 2016 2017Function:Police
Calls dispatched 19,334 22,232 22,231 23,071 24,650 22,810 22,412 23,026 24,359 26,027 Crime reports 5,585 7,076 5,475 4,726 4,491 4,450 4,207 4,490 4,798 4,881 Moving citations 8,335 7,123 9,192 9,024 8,215 5,573 3,272 3,426 2,483 2,409 Parking citations 14,836 14,118 20,639 15,469 16,034 10,651 11,178 10,057 10,528 10,467
WaterNumber of customer accounts 11,842 11,863 11,953 11,878 12,095 12,258 12,637 12,951 13,153 13,224 Average daily consumption (millions of gallons) 10.79 9.26 8.83 8.53 9.39 9.77 10.30 9.54 7.86 7.71 Water samples taken 1,753 624 624 627 672 840 624 686 732 780
SewersFeet of sewer mains root cut/chemically treated 2,410 - - - - - - - - -
Development Services 5
Permits issued 1,096 1,218 979 - - - - - - - Inspections conducted 4,945 4,850 4,628 - - - - - - -
Traffic signals maintained 4 50 51 51 - - - - - - - Infrastructure improv. projects administered 14 12 13 - - - - - - -
Community DevelopmentPermits issued - - - 1,097 1,180 1,404 1,418 1,561 2,072 2,170 Inspections conducted - - - 4,316 5,030 5,604 7,955 7,997 6,903 6,833
Maintenance Services 5
Square feet of graffiti removal 11,232 12,755 15,048 - - - - - - -Streetsweeping miles 26,341 22,943 20,777 - - - - - - -Trees pruned per year 2,642 2,706 2,906 - - - - - - -
Public WorksSquare feet of graffiti removal - - - 12,528 9,576 10,944 7,713 4,545 3,609 6,950 Streetsweeping miles - - - 20,609 18,398 19,365 19,494 20,128 20,333 21,060 Trees pruned per year - - - 2,702 2,806 3,136 2,069 3,408 3,275 2,830
Traffic signals maintained 2, 4 - - - 51 52 52 52 52 53 56 Infrastructure improv. projects administered - - - 9 17 6 9 10 8 8
Culture and RecreationGallery promotions and mailings 42,151 43,962 21,647 26,903 22,934 18,500 18,500 18,500 14,800 14,800 Gallery attendance 6,004 7,495 6,934 7,081 11,693 9,596 10,674 10,042 12,807 10,175 Theatre annual program brochures mailed 23,313 24,532 35,053 37,848 37,843 32,359 44,517 26,258 34,670 31,853 Theatre attendance 16,419 17,742 13,964 11,983 12,829 12,516 12,889 12,926 50,476 47,832
General governmentAccounts payable warrants issued 8,624 7,772 6,233 6,043 8,182 7,872 7,829 8,599 7,569 7,154
1 The reporting methodology employed beginning fiscal year 2007-08 was changed; going forward, this methodology will remain consistent for the sake
of comparability.
2 Figure corrected with fiscal year 2011-12 CAFR.
3 Beginning in fiscal year 2007-08, the reported streetsweeping miles included curb miles from the City's backup sweeper which was not included in the prior fiscal year.
4 Doesn't include five flashing beacons the City maintains
5 Beginning in fiscal year 2010-11, function classified as Public Works or Community Development.
Source: City of Brea
161

CIT
Y O
F B
RE
A
CA
PIT
AL
AS
SE
T S
TA
TIS
TIC
S B
Y F
UN
CT
ION
LA
ST
TE
N F
ISC
AL
YE
AR
S
2008
2009
2010
2011
2012
2013
2014
2015
2016
2017
Fun
ctio
n:P
ublic
Saf
ety Pol
ice
stat
ions
1
1
1
1
1 1
1
1
1
1
Fire
sta
tions
4
4
4
4
4 4
4
4
4
4
Hig
hway
s an
d st
reet
sM
iles
of s
tree
ts11
9
119
11
9
119
11
9
119
12
0
120
12
1
121
Str
eet l
ight
s3,
388
3,38
8
3,
388
3,38
8
3,
388
3,38
8
3,
401
3,40
1
3,
452
3,45
2
Wat
erN
umbe
r of
wat
er w
ells
1
1
1
1
1 1
1
1
1
1
N
umbe
r of
res
ervo
irs6
6 6
6
6
6
7
7
7
7
Mile
s of
line
s &
mai
ns16
7
167
16
7
167
16
7
167
16
7
19
719
7
212
Sew
erM
iles
of s
anita
ry s
ewer
s11
0
110
11
0
110
11
0
110
11
1
111
11
2
112
Mile
s of
sto
rm d
rain
s25
25
25
25
25 25
26
26
27
27
Cul
ture
and
Rec
reat
ion
Num
ber
of p
arks
10
11 11
11
11
12
13
13
13
13
N
umbe
r of
oth
er fa
cilit
ies
7
7
7
7
7 7
7
7
7
7
Sou
rce:
City
of B
rea
162

OTHER REPORTS

This page intentionally left blank.

25231 Paseo De Alicia, Suite 100, Laguna Hills, CA 92653 P 949.768.0833 F 949.768.8408 W vtdcpa.com
163
INDEPENDENT AUDITORS’ REPORT ON INTERNAL CONTROL OVER FINANCIAL REPORTING AND ON COMPLIANCE AND OTHER MATTERS BASED ON AN AUDIT OF
FINANCIAL STATEMENTS PERFORMED IN ACCORDANCE WITH GOVERNMENT AUDITING STANDARDS
To the Members of the City Council City of Brea, California
We have audited, in accordance with the auditing standards generally accepted in the United States of America and the standards applicable to financial audits contained in Government Auditing Standards issued by the Comptroller General of the United States, the financial statements of the governmental activities, the business-type activities, each major fund, and the aggregate remaining fund information of City of Brea, California (City), as of and for the year ended June 30, 2017, and the related notes to the financial statements, which collectively comprise the City’s basic financial statements, and have issued our report thereon dated May 31, 2018. Our report included an emphasis of matter regarding the City’s restatement and disclosures of transactions with California Domestic Water Company. We also included an emphasis of matter regarding the City’s restatement of Construction in Progress. Lastly, our report included an emphasis of matter regarding the City’s adoption of Governmental Accounting Standards Board (GASB) Statement No. 82, Pension Issues – An Amendment of GASB Statements No. 67, No. 68, and No. 73, as of July 1, 2016.
Internal Control over Financial Reporting
In planning and performing our audit of the financial statements, we considered the City’s internal control over financial reporting (internal control) to determine the audit procedures that are appropriate in the circumstances for the purpose of expressing our opinions on the financial statements, but not for the purpose of expressing an opinion on the effectiveness of the City’s internal control. Accordingly, we do not express an opinion on the effectiveness of the City’s internal control.
Our consideration of internal control was for the limited purpose described in the preceding paragraph and was not designed to identify all deficiencies in internal control that might be material weaknesses or significant deficiencies and therefore, material weaknesses or significant deficiencies may exist that have not been identified. However, as described in the accompanying schedule of findings and responses, we identified certain deficiencies in internal control that we consider to be material weaknesses and significant deficiencies.
A deficiency in internal control exists when the design or operation of a control does not allow management or employees, in the normal course of performing their assigned functions, to prevent, or detect and correct, misstatements on a timely basis. A material weakness is a deficiency, or a combination of deficiencies, in internal control, such that there is a reasonable possibility that a material misstatement of the entity’s financial statements will not be prevented, or detected and corrected on a timely basis. We consider the deficiencies described in the accompanying schedule of findings and responses as items 2017-001, 2017-003, and 2017-004 to be material weaknesses.

164
A significant deficiency is a deficiency, or a combination of deficiencies, in internal control that is less severe than a material weakness, yet important enough to merit attention by those charged with governance. We consider the deficiencies described in the accompanying schedule of findings and responses as items 2017-002 to be a significant deficiency.
Compliance and Other Matters
As part of obtaining reasonable assurance about whether the City’s financial statements are free from material misstatement, we performed tests of its compliance with certain provisions of laws, regulations, contracts, and grant agreements, noncompliance with which could have a direct and material effect on the determination of financial statement amounts. However, providing an opinion on compliance with those provisions was not an objective of our audit, and accordingly, we do not express such an opinion. The results of our tests disclosed instances of noncompliance or other matters that are required to be reported under Government Auditing Standards and which are described in the accompanying schedule of findings and responses as item 2017-005.
City’s Response to Findings
The City’s response to the findings identified in our audit is described in the accompanying schedule of findings and responses. The City’s response was not subjected to the auditing procedures applied in the audit of the financial statements and, accordingly, we express no opinion on it.
Purpose of this Report
The purpose of this report is solely to describe the scope of our testing of internal control and compliance and the results of that testing, and not to provide an opinion on the effectiveness of the entity’s internal control or on compliance. This report is an integral part of an audit performed in accordance with Government Auditing Standards in considering the City’s internal control and compliance. Accordingly, this communication is not suitable for any other purpose.
Laguna Hills, California May 31, 2018

CITY OF BREA, CALIFORNIA
SCHEDULE OF FINDINGS AND RESPONSES JUNE 30, 2017
165
Finding Number 2017-001
FINANCIAL REPORTING AND CLOSING
Criteria:
There should be sufficient procedures in place to allow for the proper classification and timely reporting of financial information in accordance with generally accepted accounting principles. Management is responsible for the basic financial statements and all accompanying information as well as all representations contained therein and for the fair presentation of the financial statements in conformity with U.S. generally accepted accounting principles. This requires management to work through a year-end closing process to accumulate, reconcile, and summarize information for inclusion in the annual financial statements. The year-end closing process includes the review and/or reconciliation of all balances within the City’s general ledger. Accounts must be reviewed for proper cutoff, classification, presentation, and appropriate disclosure in the financial statements. These processes should be completed on a timely manner to ensure the accurate and timely presentation of the financial information.
Condition:
During the audit, we identified adjustments, which were posted as part of the audit, for the following:
Transactions between the City and California Domestic Water Company (CDWC) to reflect the equityinvestment of the consolidated entity (which included Cadway).
Capital assets of $2.8 million from Construction-in-progress to Infrastructure. Opening net position/fund balance for the prior year audited financial statements. Net Pension Liability and related Deferred Outflows of Resources, Deferred Inflows of Resources, and
Pension Expense. The market value adjustment on the PARS investment account.
In addition, we noted the City proposed 25 financial statement journal entries, and 16 budget adjustment journal entries after providing the trial balance to the auditors for the audit.
Lastly, the City’s practice is to construct assets within the Capital Improvements Fund, and transfer back to the Water and Sewer fund when complete. Only the hard costs are capitalized within the Capital Improvements Fund, resulting in the residual labor costs being expensed in the Capital Improvements Fund. The Water and Sewer funds should classify these residual labor costs as operating expenses, not transfers out. Further, the Sanitation Fund currently records the collection of Franchise Fees from the City’s contract refuse hauling company. These amounts are then transferred out from the Sanitation Fund to the General Fund, but should be reflected as revenues of the General Fund.
Context:
The condition was noted during our audit of the City for the year ended June 30, 2017.
Effect:
Journal entries were posted, and adjustments made to the financial statements, in order to fairly present the financial statements.

CITY OF BREA, CALIFORNIA SCHEDULE OF FINDINGS AND RESPONSES JUNE 30, 2017
166
Cause: The City’s procedures did not allow for the proper classification or timely reporting of information required for financial reporting. Recommendation: We recommend the City review its closing policies and procedures to ensure amounts are properly classified, properly reported in a timely manner, and disclosed appropriately in the financial statements. Views of Responsible Officials and Planned Corrective Actions: The City’s audit process started later than anticipated due to a delay in securing a new audit contract. Additionally, there was turnover in accounting staff; duties transitioned from other department to accounting and projects during the fiscal year which required extensive involvement from accounting staff. Therefore, staff was still recording year-end closing entries when the trial balance was provided to the auditors for the year-end audit work, resulting in a number of entries to be posted to the trial balance. Lastly, year-end budget adjustments, if needed, are not prepared for City Council consideration until after the books are closed each year. Accounting division procedures will be updated to include weekly, monthly, quarterly and year-end checklists along with specific deadlines to ensure items timely financial recording and review of classification issues as necessary. The work plan will include a deadline for year-end audit work to be completed at least two weeks prior to the beginning of the final audit field work in order for management to review; make any necessary adjustments and/or confer with the auditor regarding any classification issues. Staff will meet at least monthly to review status on the work plan. As it relates to recommendations regarding certain City accounting practices, the FY 2018-19 Proposed Operating Budget which is scheduled for a public hearing and consideration of adoption on June 19, 2018, includes the recommended accounting change for refuse franchise fees. Additionally, staff will revisit its policies as it relates to labor or any other Capital Improvement Project costs that are not capitalized. For future years, any material amounts determined to not be capitalized will be reclassified as operating expenses in the applicable fund. Finding Number 2017-002 BANK RECONCILIATIONS Criteria: Reconciliations should be performed and reviewed on a timely basis. Condition: We noted the April 2017 bank reconciliation was performed and reviewed approximately four months later in August 2017. Further, there were unreconciled differences noted as of the end of the month which were carried over until the June 2017 bank reconciliation. We also noted the June 2017 bank reconciliation was initially performed and reviewed in August 2017 with unreconciled differences. The updated bank reconciliation was completed in October 2017 to reflect additional adjustments and record the unreconciled differences.

CITY OF BREA, CALIFORNIA SCHEDULE OF FINDINGS AND RESPONSES JUNE 30, 2017
167
Context: The condition was noted during our review of the internal controls over the treasury process. Effect: As a key internal control, reconciliations that are not prepared and reviewed on a timely basis weaken the internal control environment. Cause: The City did not consistently perform, reconcile, and review bank reconciliations on a timely basis. Recommendation: We recommend the City evaluate policies and implement procedures over bank reconciliations to ensure the bank reconciliations are performed and reviewed on a timely basis, typically with 30 days of the previous month end. Views of Responsible Officials and Planned Corrective Actions: City procedures include completing bank reconciliation within 30 days. Ten out of twelve months were completed timely. It is noted that certain City practices can result in quite a bit of time spent on reconciling at month-end and in some cases, the need to carry forward reconciling items pending resolution. Carry forward items are cleared the following month. Staff is reviewing all procedures related to banking transaction monitoring in order to streamline where possible and reduce the amount of time needed for reconciliation at month end. Finding Number 2017-003 VENDOR CREATION, PROCUREMENT AND DISBURSEMENTS Criteria: Procurement policies and processes should be periodically reviewed and updated. System controls to segregate individuals who add, edit and remove vendors from the system from those that process purchase orders or disbursements should be maintained. Further, approval of disbursements should be performed by individuals with proper authority. Condition: As of June 30, 2017, the City was in the process of updating its Purchasing Ordinance and Policies. This process was completed on November 21, 2017. However, the procurement policy in place as of June 30, 2017 was created in 1987. Both Procurement and Accounts Payable employees have access to add and modify vendors. There is no review process of vendor changes, aside from an accountant’s review of warrant proof list each check run. We further noted one disbursement where the invoice was not approved by an individual with the appropriate approval authority.

CITY OF BREA, CALIFORNIA SCHEDULE OF FINDINGS AND RESPONSES JUNE 30, 2017
168
Context: The condition was noted during our procedures over the internal controls related to vendor creation, procurement and cash disbursements. Effect: The City’s procurement policies are outdated. Unauthorized vendors may be added to the system, or unauthorized changes to vendor information could go undetected. Lastly, disbursements have not consistently been approved by the proper individuals prior to disbursement of funds. Cause: The City’s policies and processes over vendor creation, procurement and disbursements is not properly updated, designed, or followed by City employees. Recommendation: We recommend that the City review and update its procurement policies, which was performed subsequent to year end. The City should segregate controls over vendor creation and edit functions from those that process disbursements. For disbursements, the City should ensure proper approvals are obtained over payments prior to disbursements. Views of Responsible Officials and Planned Corrective Actions: Vendor Creation – As noted, the City has vendor creation and payment segregated; however, in order to maintain efficient operations, accounts payable staff needs to be able to update mailing addresses and other vendor information. This requires access to the master vendor maintenance file. Therefore, the City will include a vendor change report as part of the weekly review of account payable invoices for payment to mitigate any impact to internal controls. Procurement – The City’s procurement policies were updated on November 21, 2017 and effective as of December 21, 2017. Additionally, these policies and procedures are scheduled to be updated every 3-5 years. Disbursements – The weekly review of accounts payable invoices will also include verification of authorizations for payments in excess of $25,000. Finding Number 2017-004 JOURNAL ENTRIES Criteria: There should be sufficient segregation of duties over journal entries, including authorization, custody of assets, and recordkeeping (posting to the general ledger). This includes secondary review of all journal entries posted to the system.

CITY OF BREA, CALIFORNIA SCHEDULE OF FINDINGS AND RESPONSES JUNE 30, 2017
169
Condition: We noted two journal entries had only a preparer signature, with no evidence of secondary review. Context: The condition was noted during our review of the internal controls over the journal entry processes. Effect: Journal entries may be posted without secondary review, and not posted in a timely manner, resulting in additional effort to close the City’s accounting records. Cause: The City’s process does not properly ensure a separate preparer and reviewer for all journal entries. Recommendation: We recommend that the City review the procedures over journal entries to ensure timely review and posting to the general ledger. Views of Responsible Officials and Planned Corrective Actions: City staff has indicated that these journal entries were properly reviewed; however, it was an oversight that the reviewer’s initials were not on the documentation. In order to assure that all parties have properly documented their involvement in the journal entry preparation and review, the person posting the journal entries will be responsible for assuring all initials are present before posting. Finding Number 2017-005 DEBT FILINGS Criteria: The City is required comply with continuing disclosure and filing requirements related to debt. Condition: The City submitted debt filings after the due date. Context: The condition was noted during our testwork over debt covenant requirements. Effect: The required filings were submitted past the required deadline.

CITY OF BREA, CALIFORNIA SCHEDULE OF FINDINGS AND RESPONSES JUNE 30, 2017
170
Cause: The City’s procedures did not allow for the timely reporting of bond filings. Recommendation: We recommend the City develop procedures, and prepare and submit required reports prior to the deadlines in accordance with debt agreements. Views of Responsible Officials and Planned Corrective Actions: The Continuing Disclosure reports were filed late. It is also noted that the City filed a notice of Failure to File report on the due date. Also, on October 18, 2017, the City filed Notices of Failure to File its continuing disclosure reports and Comprehensive Annual Financial Reports (CAFR) by the due date as required prior to issuing refunding bonds. These notices included information regarding the date filed. City will establish procedures and listing of all outstanding bonds noting the date the annual bond continuing disclosure reports are due to insure timely reporting as part of a listing of all financial reporting dates for the City. The Administrative Services Director, or Revenue and Budget Manager will review the list of financial reporting requirements on a monthly basis. Additionally, the accounting division work plan will include in January of each year, a review of the listing of the various bonds to insure timely filing of the annual bond reports.

25231 Paseo De Alicia, Suite 100, Laguna Hills, CA 92653 P 949.768.0833 F 949.768.8408 W vtdcpa.com
171
To the Members of the City Council City of Brea, California
We have audited the financial statements of the governmental activities, the business-type activities, each major fund, and the aggregate remaining fund information of the City of Brea, California, (City) for the year ended June 30, 2017. Professional standards require that we provide you with information about our responsibilities under generally accepted auditing standards, Government Auditing Standards, and the Uniform Guidance, as well as certain information related to the planned scope and timing of our audit. We have communicated such information in our letter to you dated August 15, 2017. We also met with the City’s Finance Committee on August 29, 2017 and March 8, 2018. Professional standards also require that we communicate to you the following information related to our audit.
Significant Audit Findings
Qualitative Aspects of Accounting Practices
Management is responsible for the selection and use of appropriate accounting policies. The significant accounting policies used by the City are described in Note 1 to the financial statements. As described in Note 1 to the financial statements, the City adopted Governmental Accounting Standards Board (GASB) Statement No. 82, Pension Issues – An Amendment of GASB Statements No. 67, No. 68, and No. 73, as of July 1, 2016.
As described in Note 4 to the financial statements, management has reported prior period adjustments for the equity investment in California Domestic Water Company (CDWC) to reflect the consolidated entity, including Cadway, Inc., a wholly-owned subsidiary of CDWC. Further, preferred stock of CDWC held by the City has been reclassified as “water rights” within capital assets.
All significant transactions have been recognized in the financial statements in the proper period.
Accounting estimates are an integral part of the financial statements prepared by management and are based on management’s knowledge and experience about past and current events and assumptions about future events. Certain accounting estimates are particularly sensitive because of their significance to the financial statements and because of the possibility that future events affecting them may differ significantly from those expected. The most sensitive estimates affecting the City’s financial statements were:
Management’s estimate of the:
The measurement of fair value of investments is based on observable market inputs andinformation from the City’s safekeeping custodian banks,
Amounts related to the City’s other postemployment benefit (OPEB) asset are based onactuarial valuations,
Amounts related to the net pension liability, deferred outflows of resources and deferredinflows of resources, pension expense, and the related disclosures, are based on actuarialvaluations.
We evaluated the key factors and assumptions used to develop these estimates in determining that they appeared reasonable in relation to the financial statements taken as a whole.

172
Certain financial statement disclosures are particularly sensitive because of their significance to financial statement users. The most sensitive disclosures affecting the financial statements were:
Note 3 to the financial statements discloses authorized investments, interest rate and credit risks, and fair value measurements.
Note 4 to the financial statements discloses the City’s activities with CDWC including water rights and equity in CDWC.
Note 9 to the financial statements discloses the City’s agent-multiple employer pension plan’s net pension liability, and related deferred inflows and outflows of resources, and pension expense. The valuation of the net pension liability and related deferred inflows and outflows are sensitive to the underlying actuarial assumptions used, including but not limited to, the investment rate of return and discount rates. As disclosed in Note 9, a 1% increase or decrease in the discount rate has a significant effect on the City’s net pension liability.
Note 13 to the financial statement discloses the City’s restatements of the prior year financial statements.
The financial statement disclosures are neutral, consistent, and clear.
Difficulties Encountered in Performing the Audit
Certain matters arose during the audit regarding the accounting treatment and disclosures of transactions with CDWC, including the equity method reporting of common stock and the treatment of the City’s preferred stock with CDWC. The completion of our audit was delayed to allow for management to provide additional information to address the accounting treatment and disclosures described in Notes 4, 13, and 15 to the financial statements, and the time for us to review and conclude on such information.
Corrected Misstatements
Professional standards require us to accumulate all known and likely misstatements identified during the audit, other than those that are clearly trivial, and communicate them to the appropriate level of management. Management has corrected all such misstatements. The following material misstatements detected as a result of audit procedures were corrected by management:
Transactions between the City and California Domestic Water Company (CDWC) wereadjusted to reflect the equity investment of the consolidated entity (which includedCadway). The adjustments posted were $4.2 million to beginning net position.
Capital assets of $2.8 million were restated from Construction-in-progress toInfrastructure.
Opening net position/fund balance for the prior year audited financial statements totaling$163 thousand related to a prior year proposed audit adjustment
Net Pension Liability and related Deferred Outflows of Resources, Deferred Inflows ofResources, and Pension Expense in the amounts of $6.2 million, $338 thousand, $938thousand and $7.5 million, respectively.
The market value adjustment on the PARS investment account in the amount of $373thousand.

173
Disagreements with Management
For purposes of this letter, a disagreement with management is a financial accounting, reporting, or auditing matter, whether or not resolved to our satisfaction, that could be significant to the financial statements or the auditor’s report. We report that there were no such disagreements.
Management Representations
We have requested certain representations from management that are included in the management representation letter dated May 31, 2018.
Management Consultations with Other Independent Accountants
In some cases, management may decide to consult with other accountants about auditing and accounting matters, similar to obtaining a “second opinion” on certain situations. If a consultation involves application of an accounting principle to the City’s financial statements or a determination of the type of auditor’s opinion that may be expressed on those statements, our professional standards require the consulting accountant to check with us to determine that the consultant has all the relevant facts. To our knowledge, there were no such consultations with other accountants.
Other Audit Findings or Issues
We generally discuss a variety of matters, including the application of accounting principles and auditing standards, with management each year prior to retention as the City’s auditors. However, these discussions occurred in the normal course of our professional relationship and our responses were not a condition to our retention.
Other Matters
We applied certain limited procedures to management’s discussion and analysis, schedule of changes in the net pension liability and related ratios for the Miscellaneous and Safety Plans, schedule of plan contributions for the Miscellaneous and Safety Plans, schedule of funding progress, and schedules of revenues, expenditures and changes in fund balance – budget and actual for the General fund and each major special revenue fund and related note, which are required supplementary information (RSI) that supplements the basic financial statements. Our procedures consisted of inquiries of management regarding the methods of preparing the information and comparing the information for consistency with management’s responses to our inquiries, the basic financial statements, and other knowledge we obtained during our audit of the basic financial statements. We did not audit the RSI and do not express an opinion or provide any assurance on the RSI.
We were engaged to report on the combining and individual nonmajor fund financial statements, budgetary comparison schedules, and the schedule of expenditures of federal awards, which accompany the financial statements but are not RSI. With respect to this supplementary information, we made certain inquiries of management and evaluated the form, content, and methods of preparing the information to determine that the information complies with accounting principles generally accepted in the United States of America, the method of preparing it has not changed from the prior period, and the information is appropriate and complete in relation to our audit of the financial statements. We compared and reconciled the supplementary information to the underlying accounting records used to prepare the financial statements or to the financial statements themselves.
We were not engaged to report on the introductory and statistical sections, which accompany the financial statements but are not RSI. Such information has not been subjected to the auditing procedures applied in the audit of the basic financial statements, and accordingly, we do not express an opinion or provide any assurance on it.

174
Restriction on Use
This information is intended solely for the use of the City Council and management of the City and is not intended to be, and should not be, used by anyone other than these specified parties.
Laguna Hills, California May 31, 2018