city as lab : introductory lecture
TRANSCRIPT
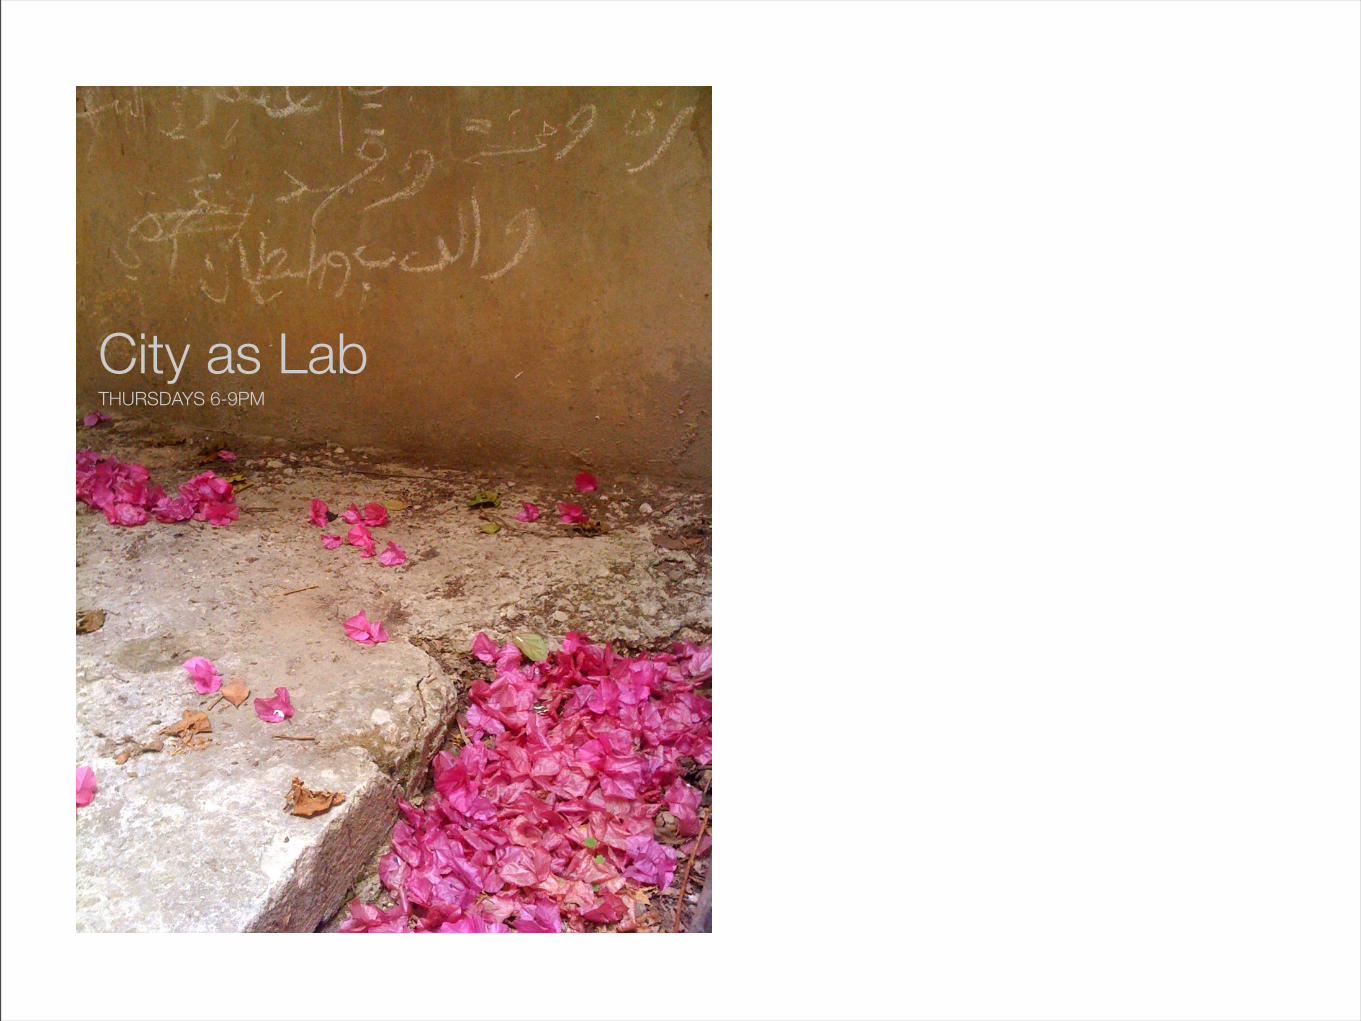
City as LabTHURSDAYS 6-9PM
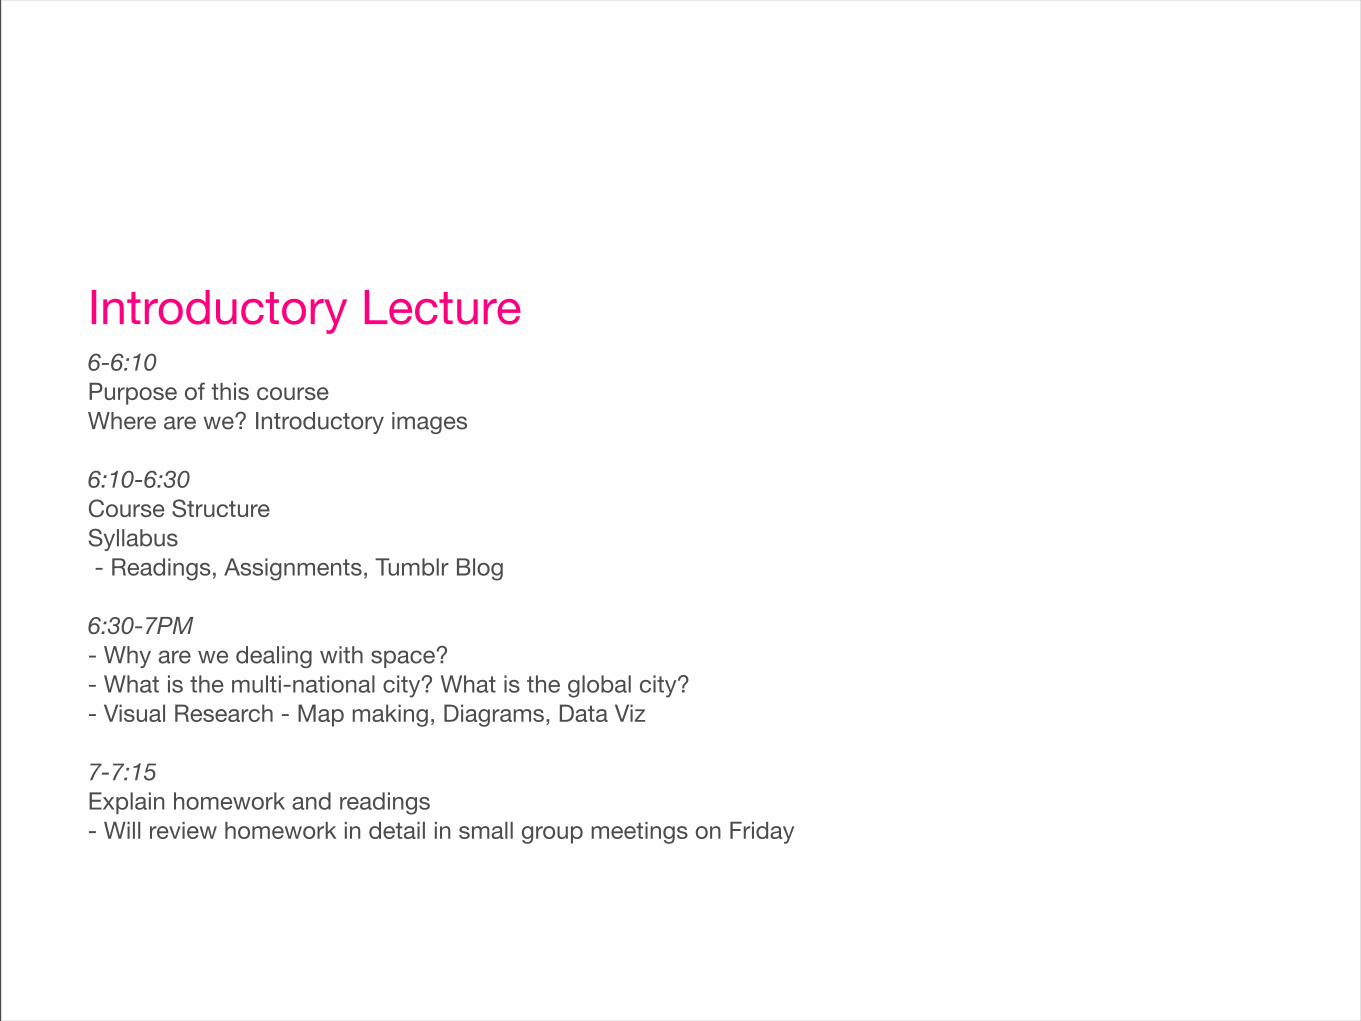
Introductory Lecture6-6:10Purpose of this courseWhere are we? Introductory images
6:10-6:30Course StructureSyllabus - Readings, Assignments, Tumblr Blog
6:30-7PM- Why are we dealing with space?- What is the multi-national city? What is the global city?- Visual Research - Map making, Diagrams, Data Viz
7-7:15Explain homework and readings- Will review homework in detail in small group meetings on Friday
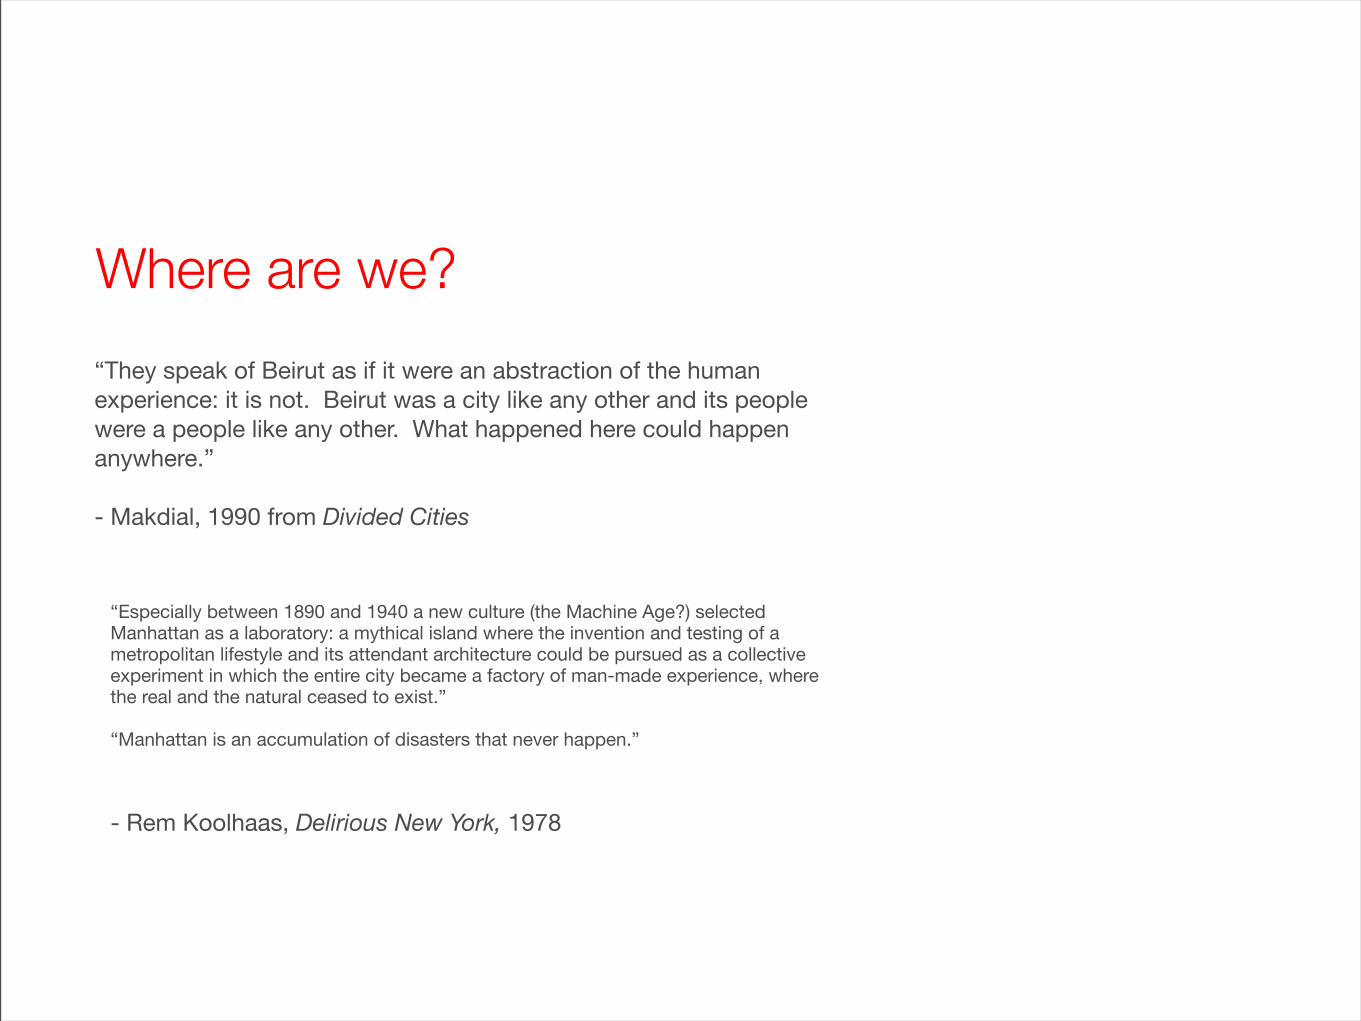
Where are we?
“They speak of Beirut as if it were an abstraction of the human experience: it is not. Beirut was a city like any other and its people were a people like any other. What happened here could happen anywhere.”
- Makdial, 1990 from Divided Cities
“Especially between 1890 and 1940 a new culture (the Machine Age?) selected Manhattan as a laboratory: a mythical island where the invention and testing of a metropolitan lifestyle and its attendant architecture could be pursued as a collective experiment in which the entire city became a factory of man-made experience, where the real and the natural ceased to exist.”
“Manhattan is an accumulation of disasters that never happen.”
- Rem Koolhaas, Delirious New York, 1978
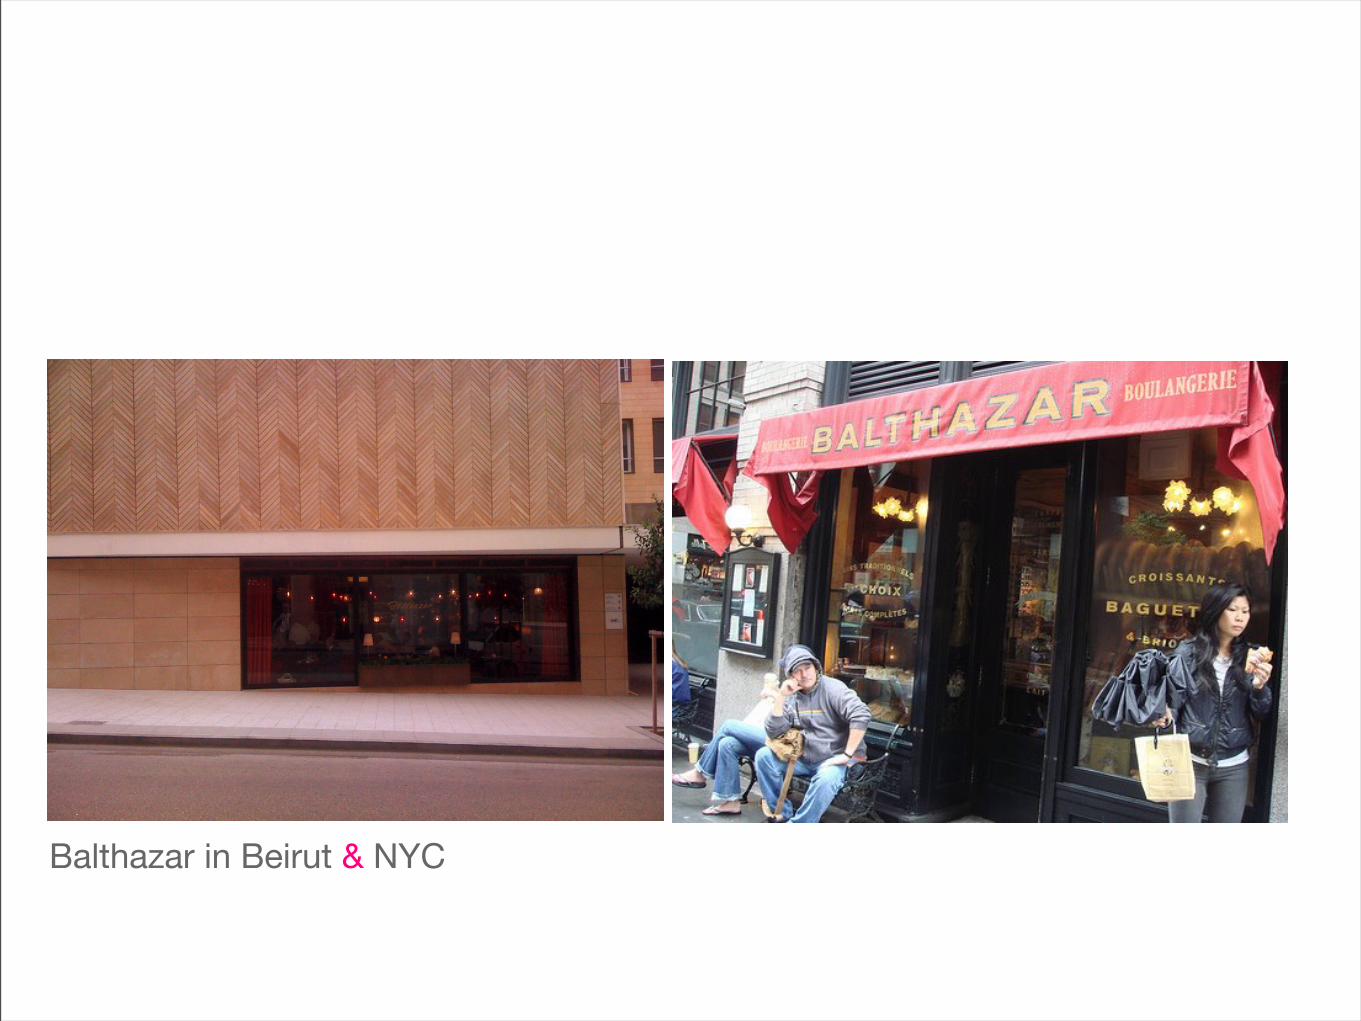
Balthazar in Beirut & NYC
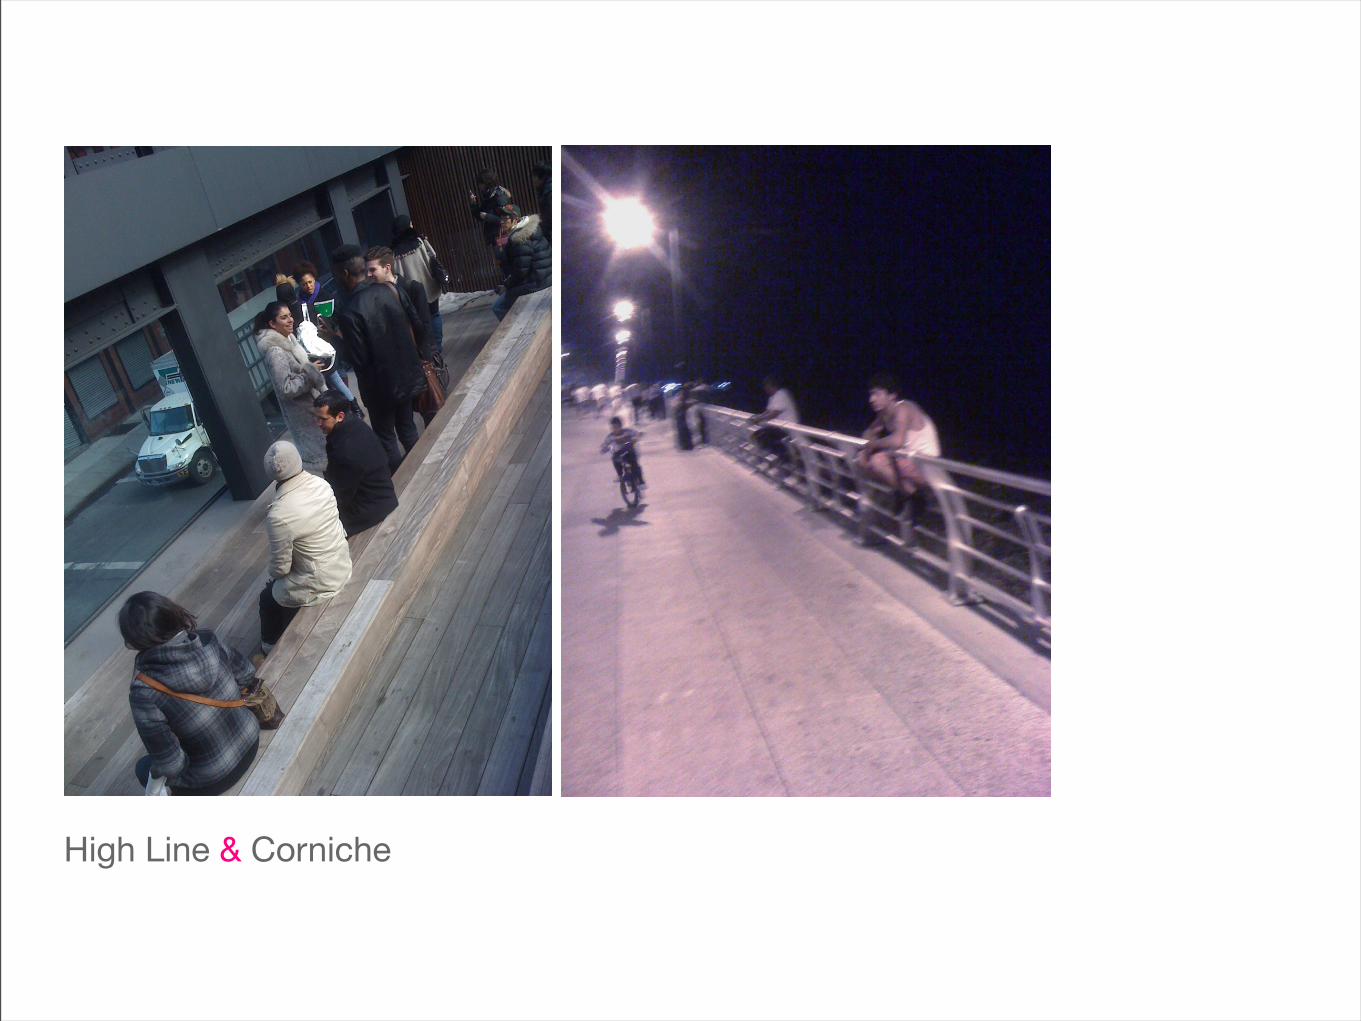
High Line & Corniche
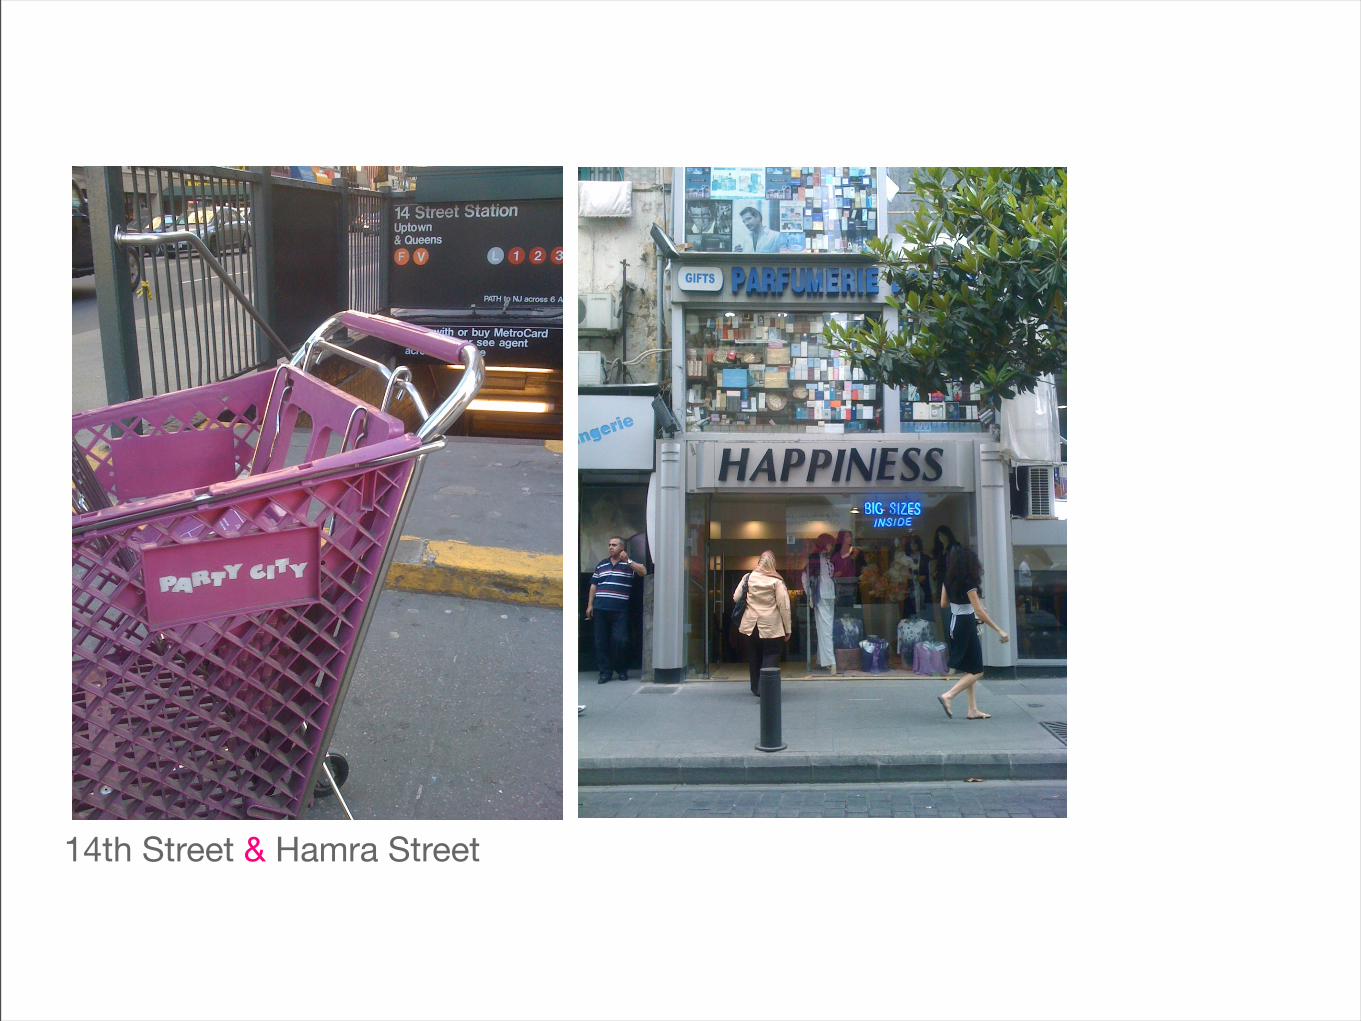
14th Street & Hamra Street
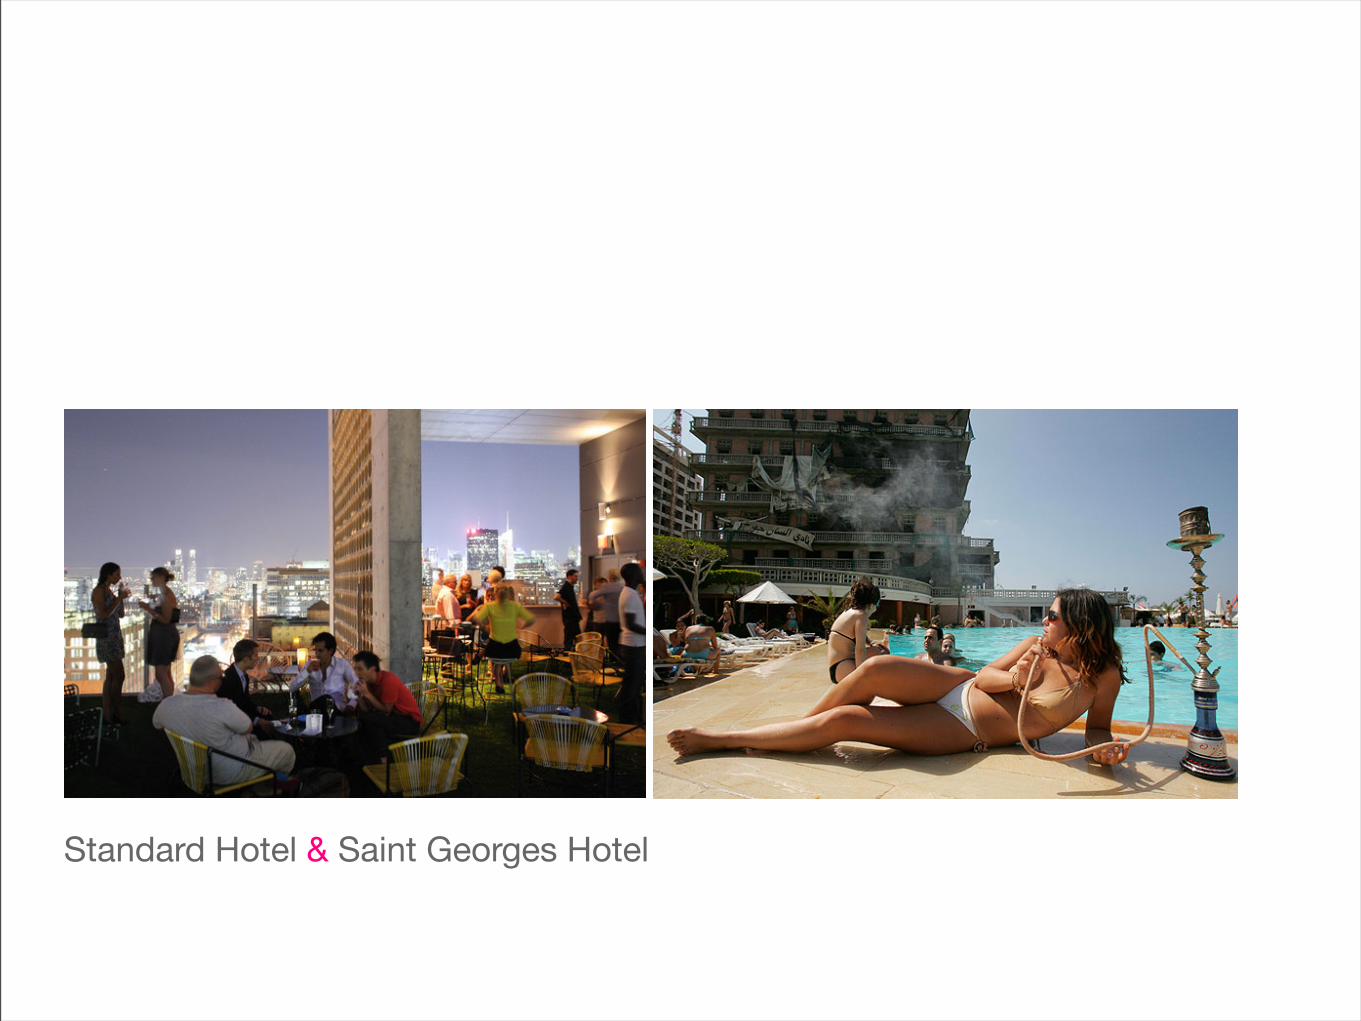
Standard Hotel & Saint Georges Hotel
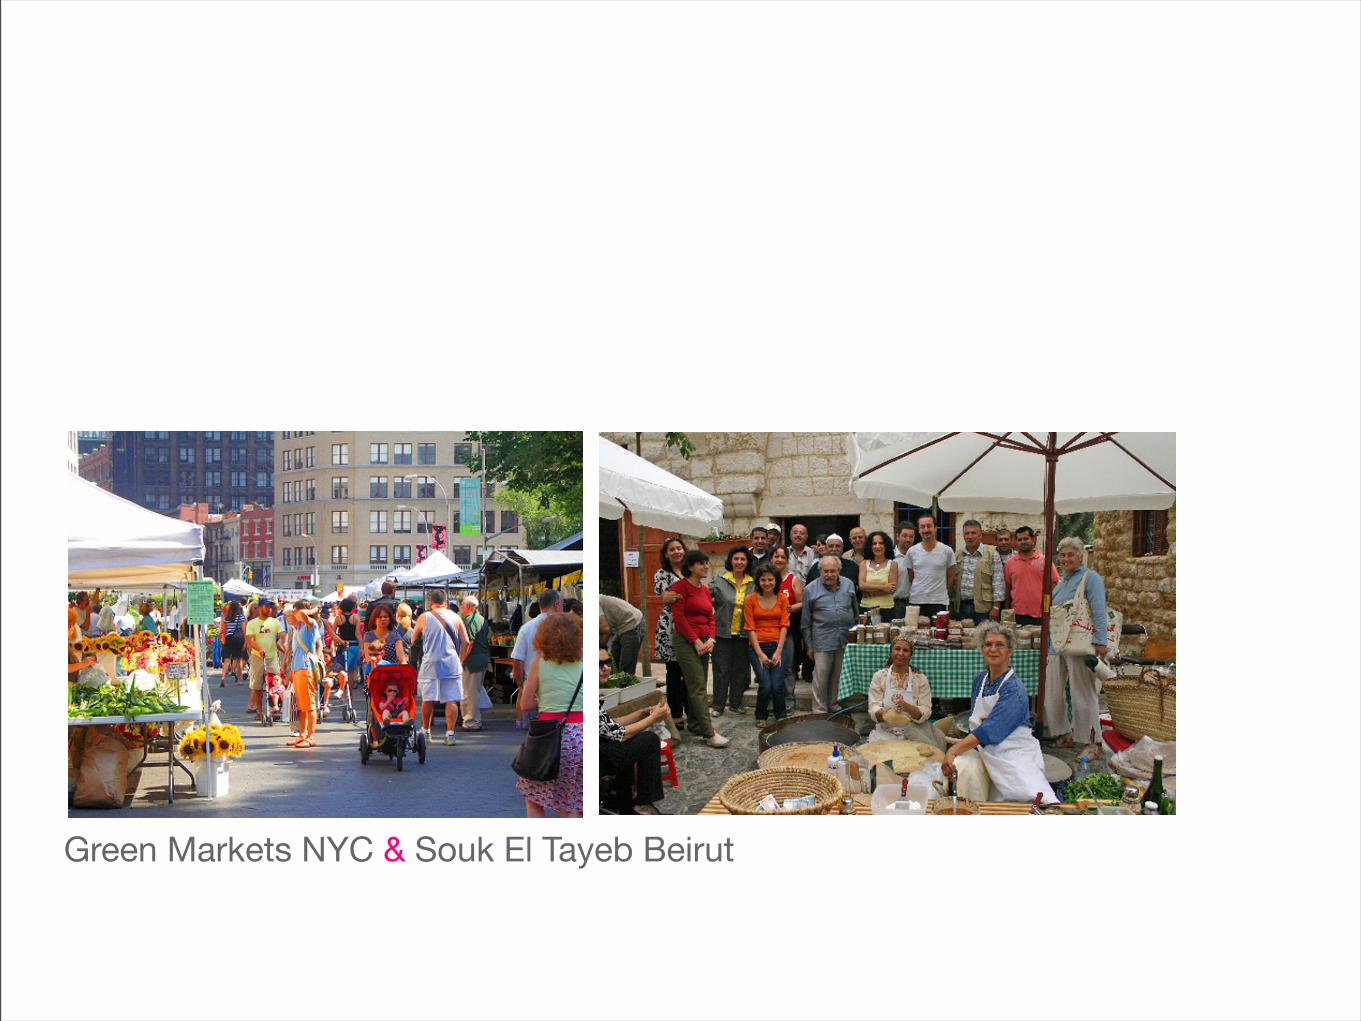
Green Markets NYC & Souk El Tayeb Beirut
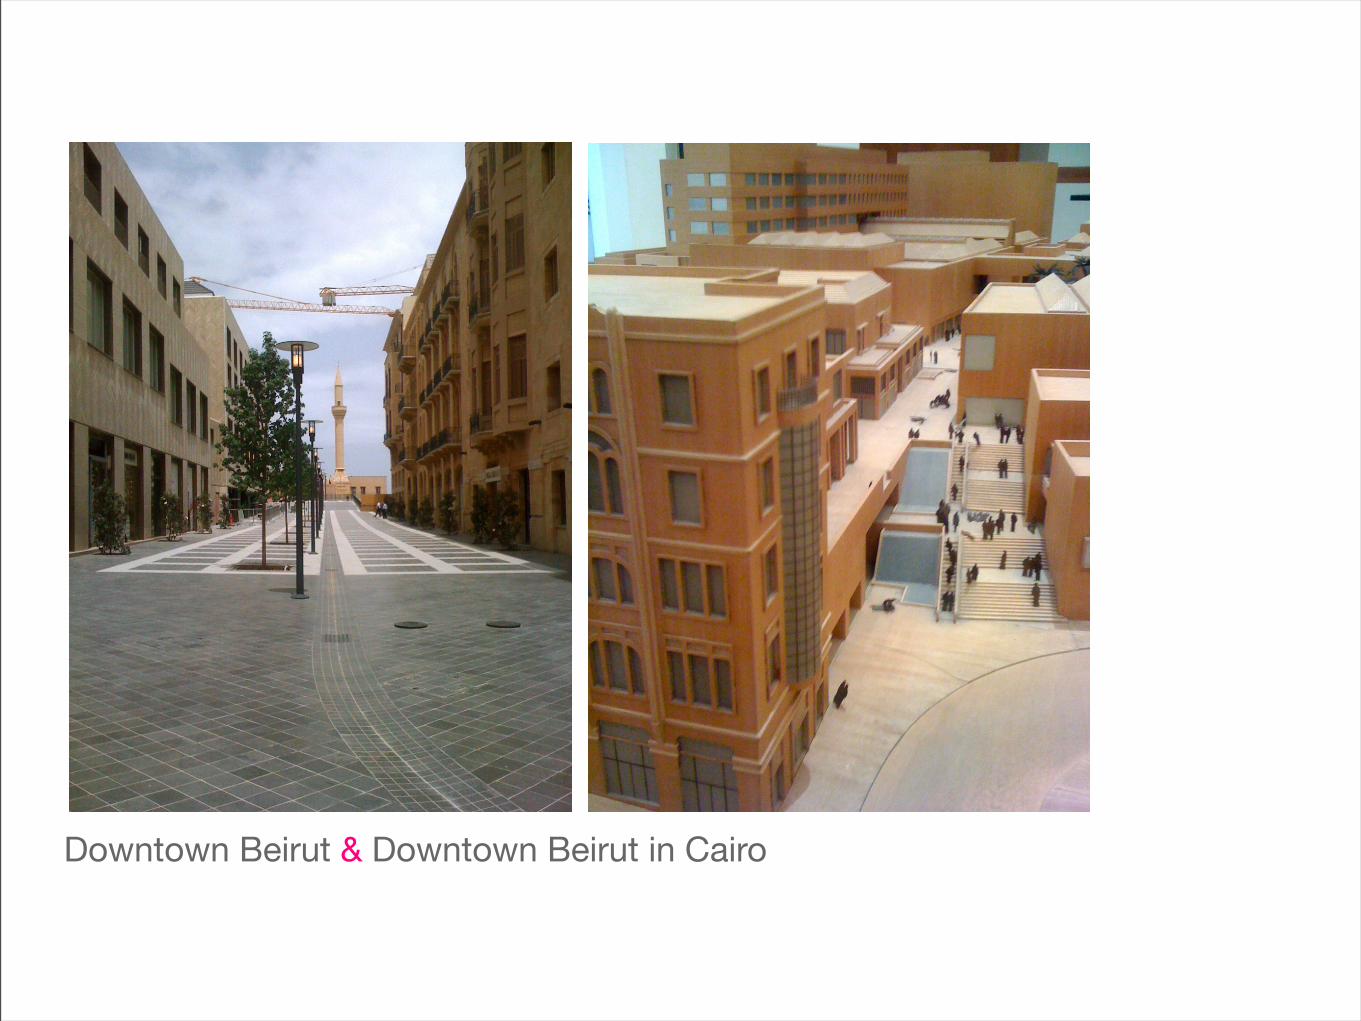
Downtown Beirut & Downtown Beirut in Cairo
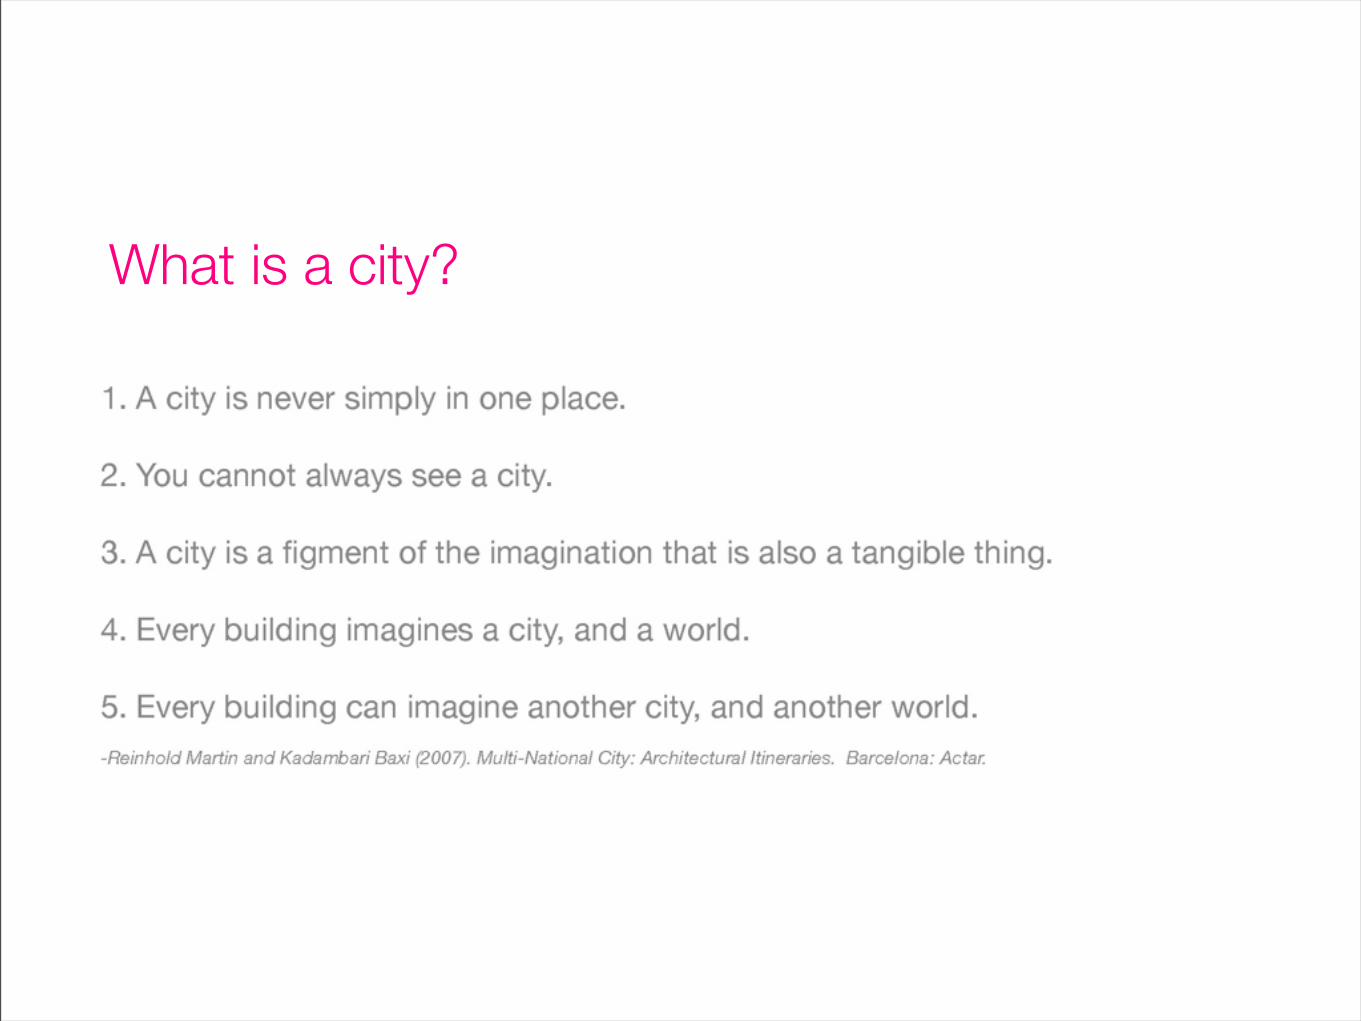
What is a city?
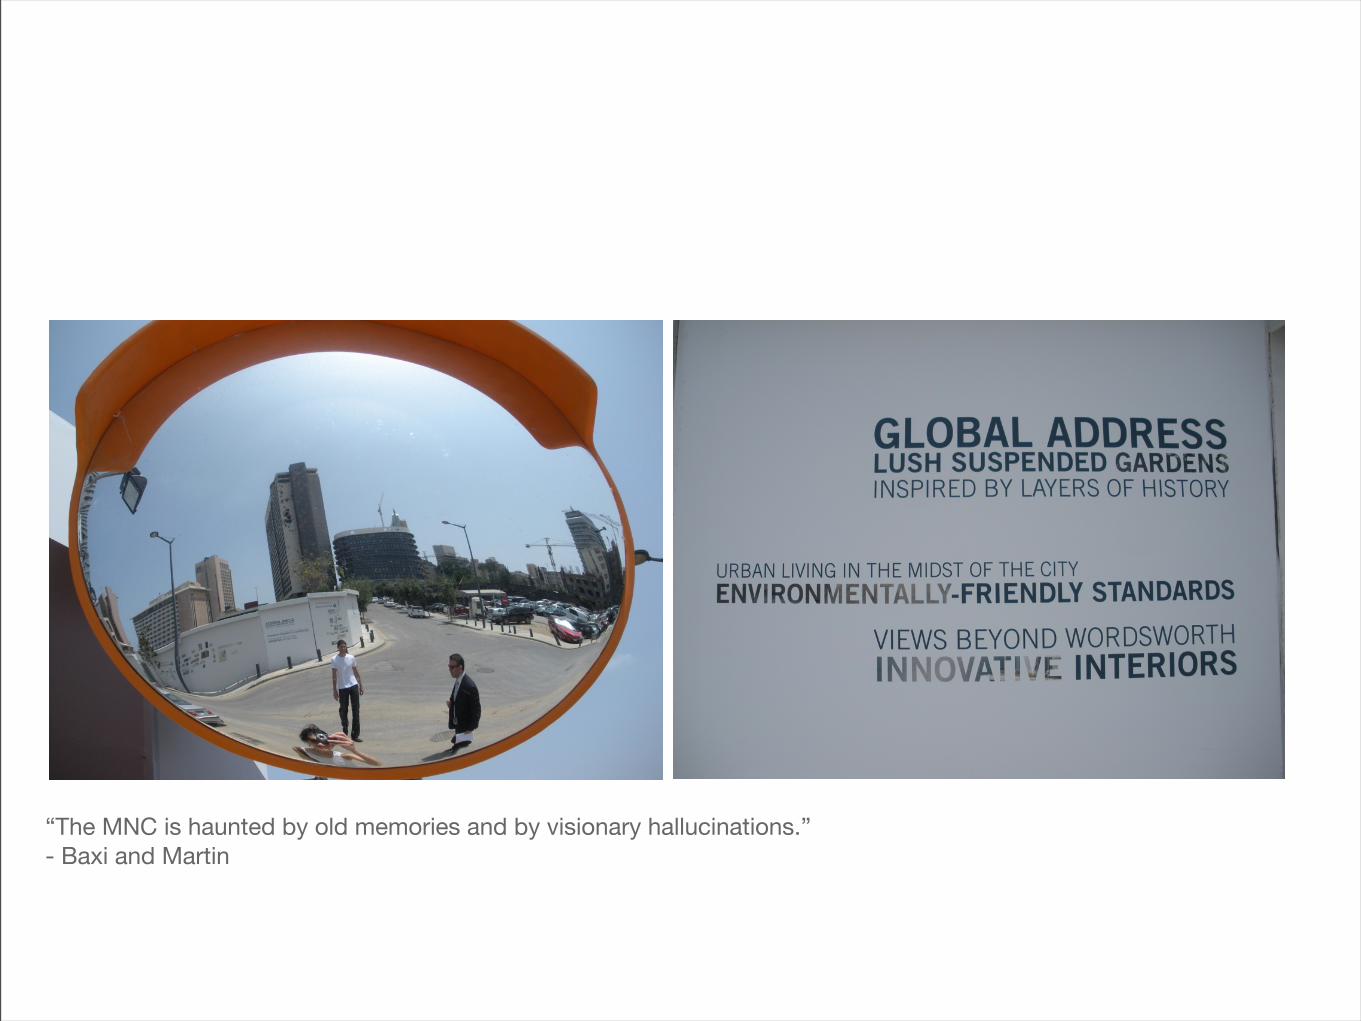
“The MNC is haunted by old memories and by visionary hallucinations.”- Baxi and Martin
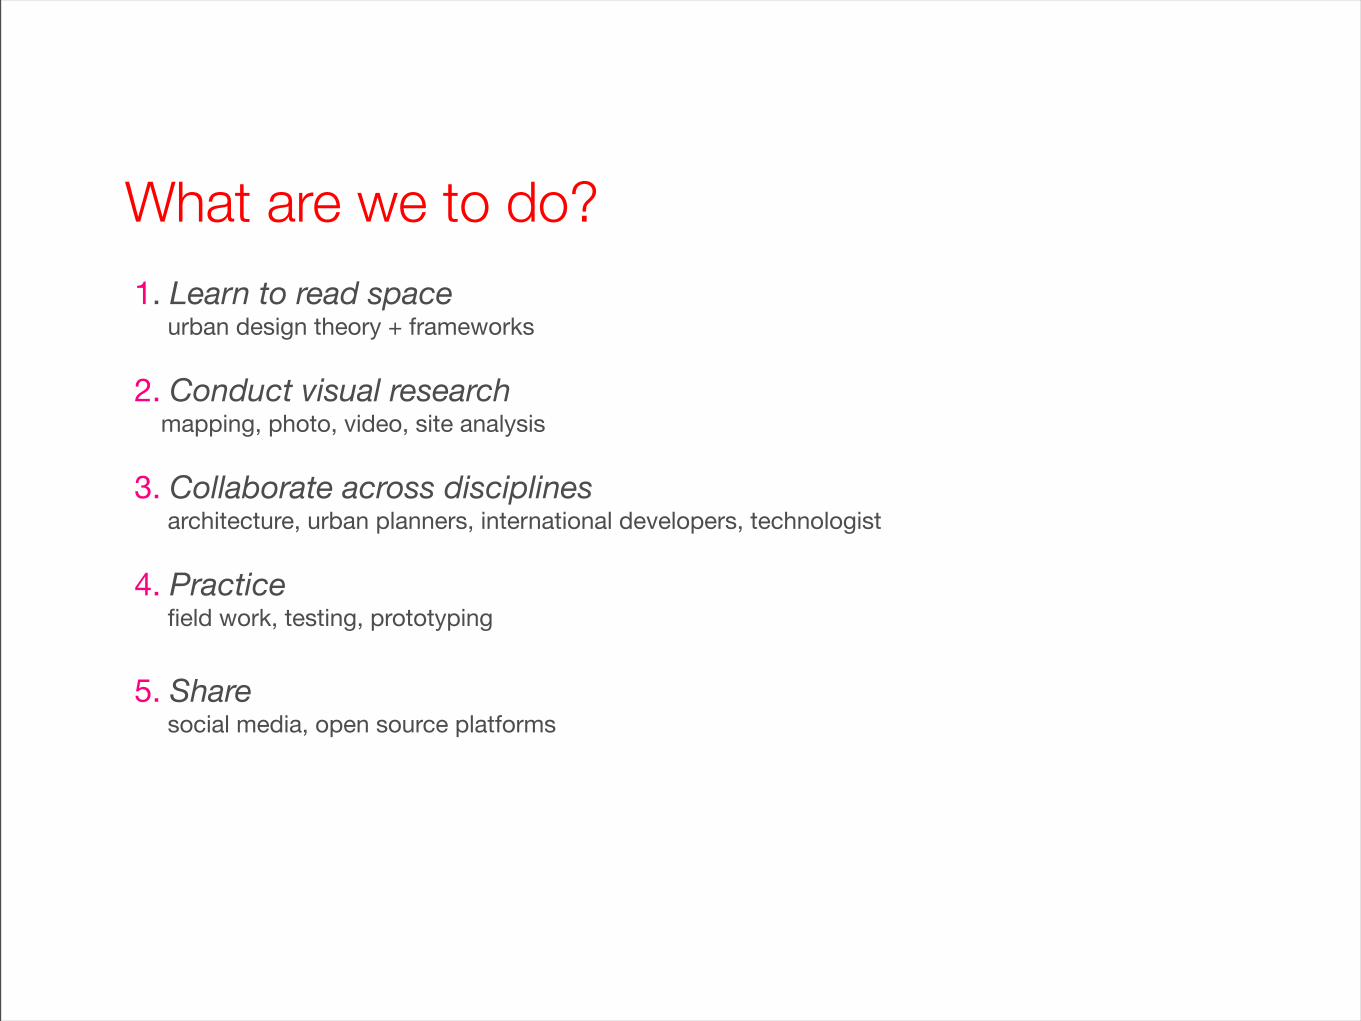
1. Learn to read space urban design theory + frameworks
2. Conduct visual research mapping, photo, video, site analysis
3. Collaborate across disciplines architecture, urban planners, international developers, technologist
4. Practice field work, testing, prototyping
5. Share social media, open source platforms
What are we to do?
Course StructureSyllabusReadingsAssignmentsTumblr Blog
How will we learn?
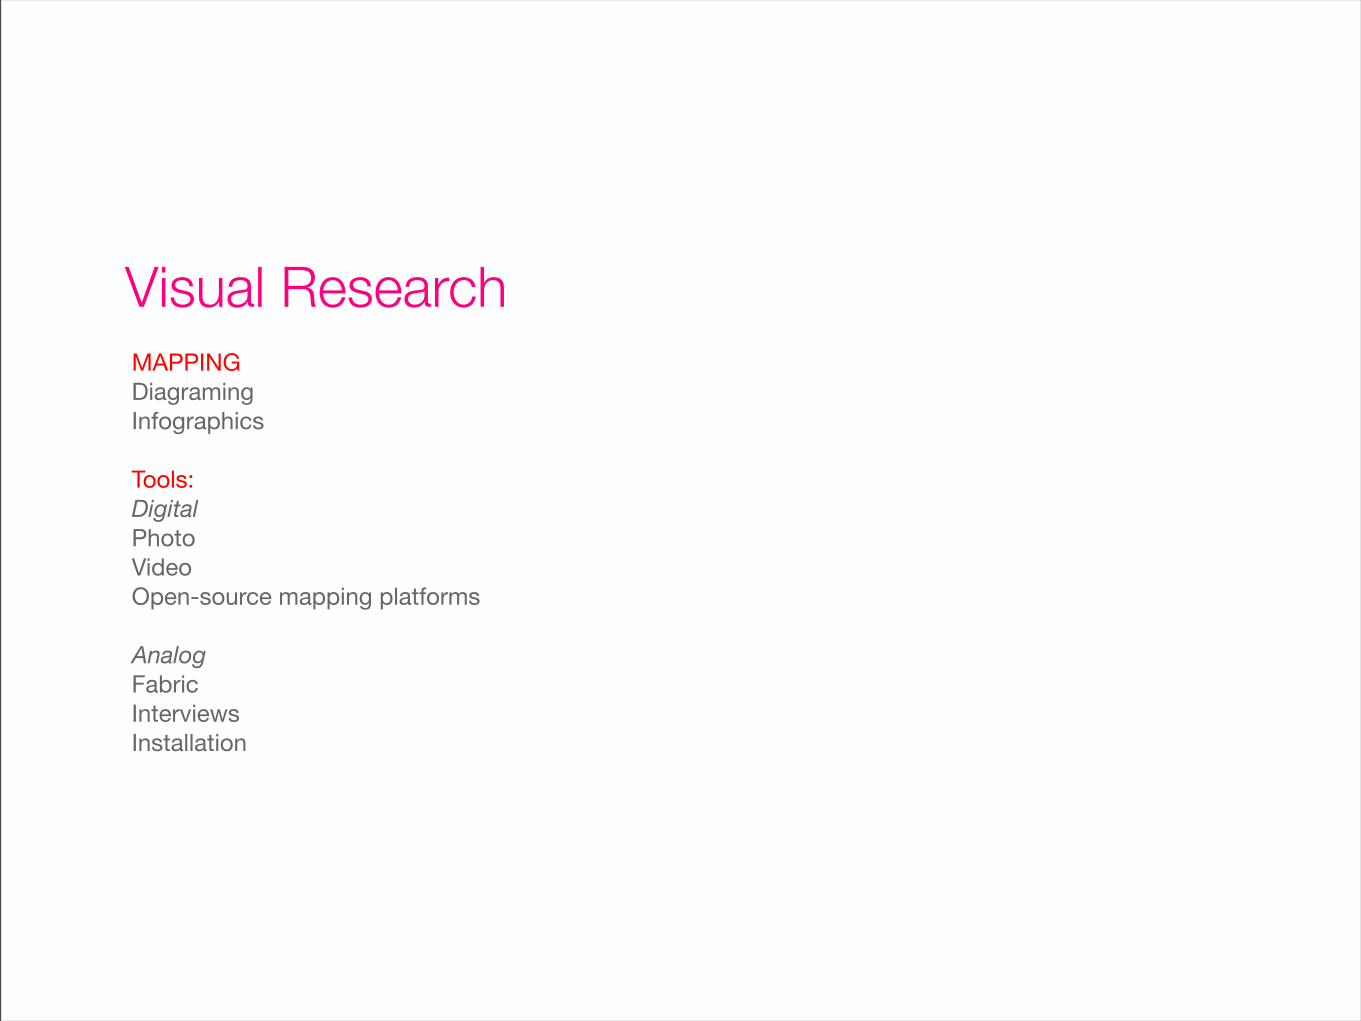
Visual ResearchMAPPINGDiagramingInfographics
Tools:DigitalPhotoVideoOpen-source mapping platforms
AnalogFabricInterviewsInstallation
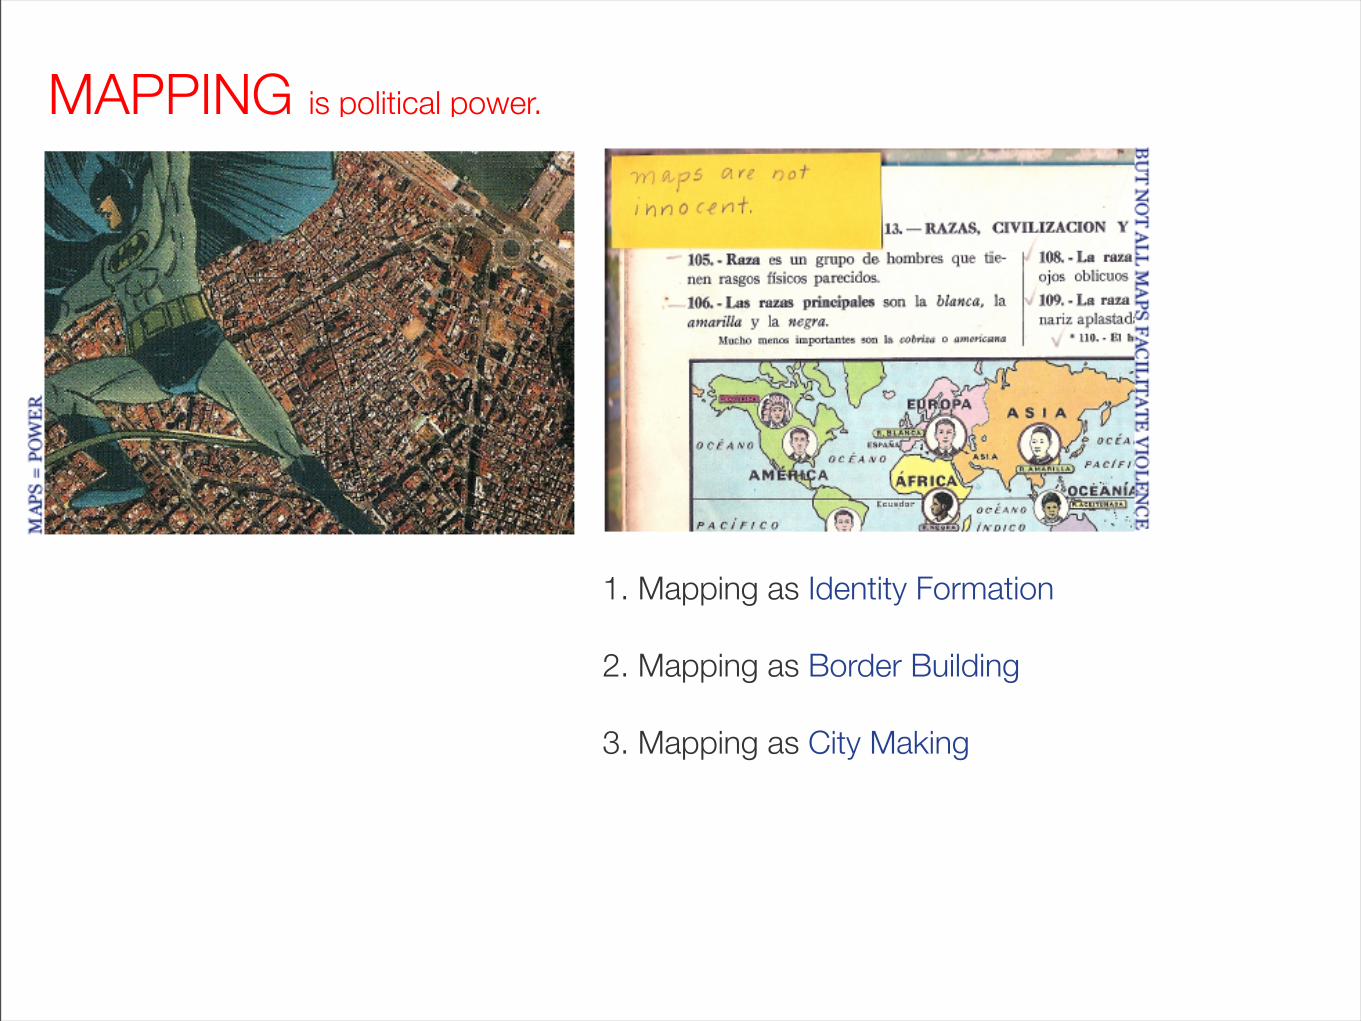
MAPPING is political power.
1. Mapping as Identity Formation
2. Mapping as Border Building
3. Mapping as City Making

What is the urban fabric?a participatory neighborhood fabric map
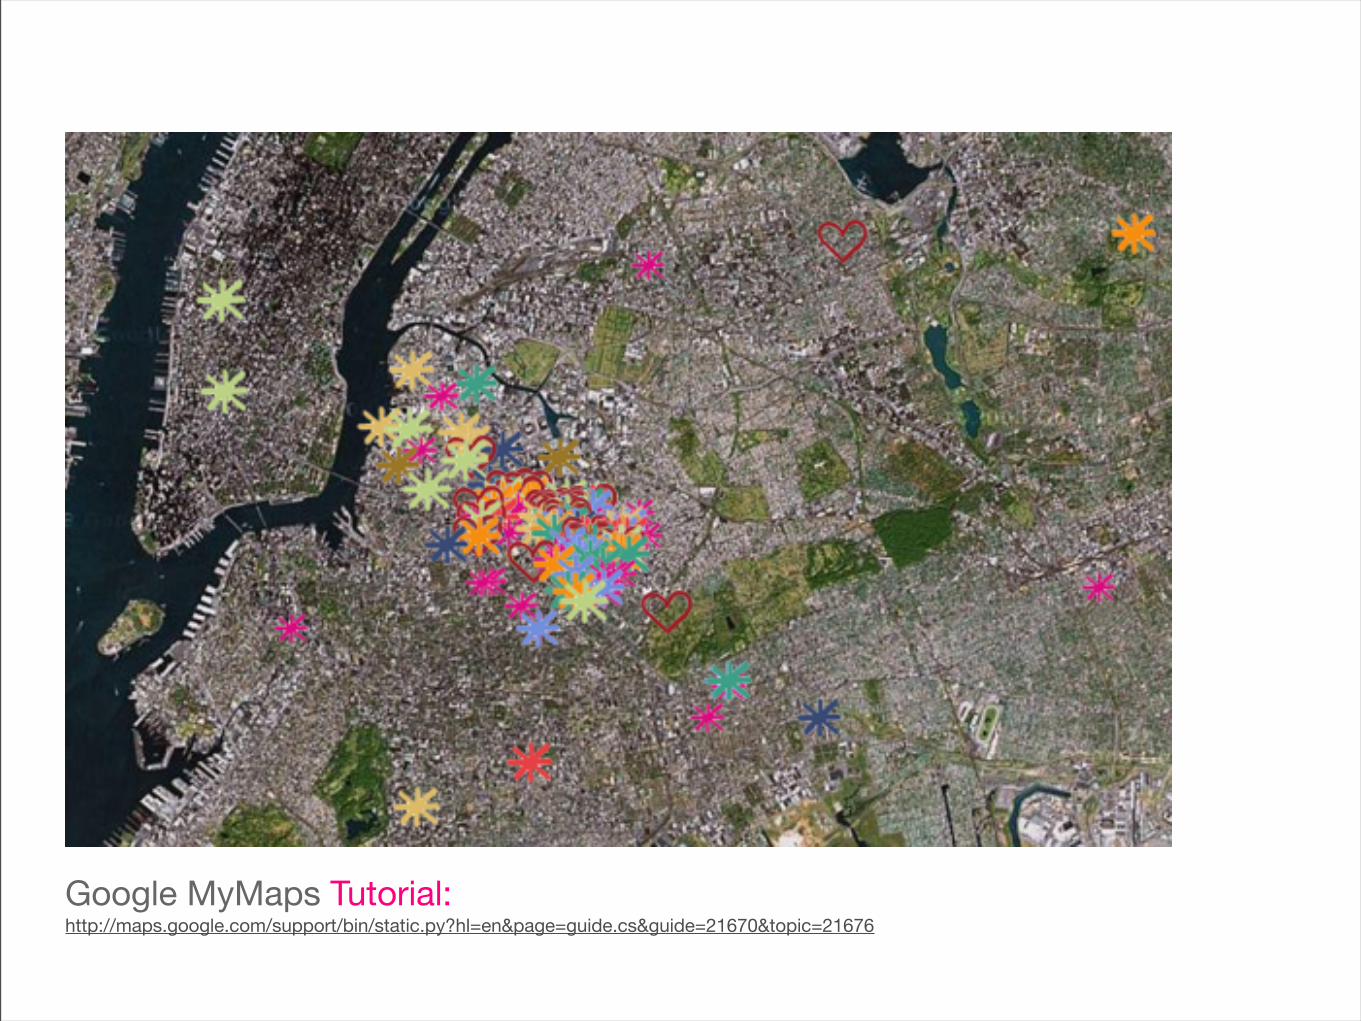
Google MyMaps Tutorial: http://maps.google.com/support/bin/static.py?hl=en&page=guide.cs&guide=21670&topic=21676
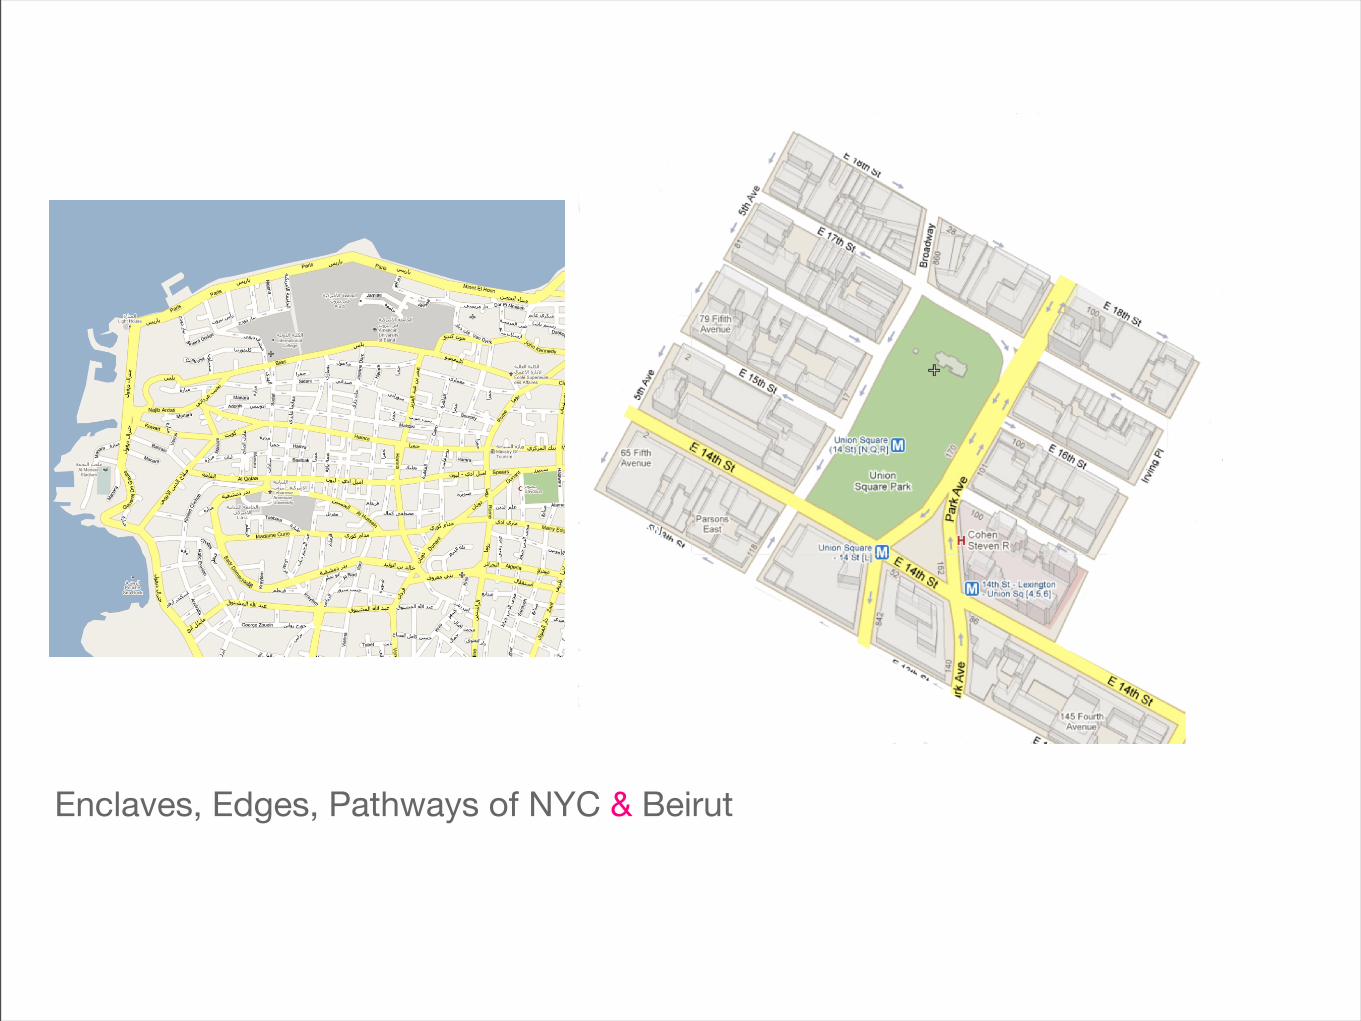
Enclaves, Edges, Pathways of NYC & Beirut

We will embroider parts of NYC & Beirut
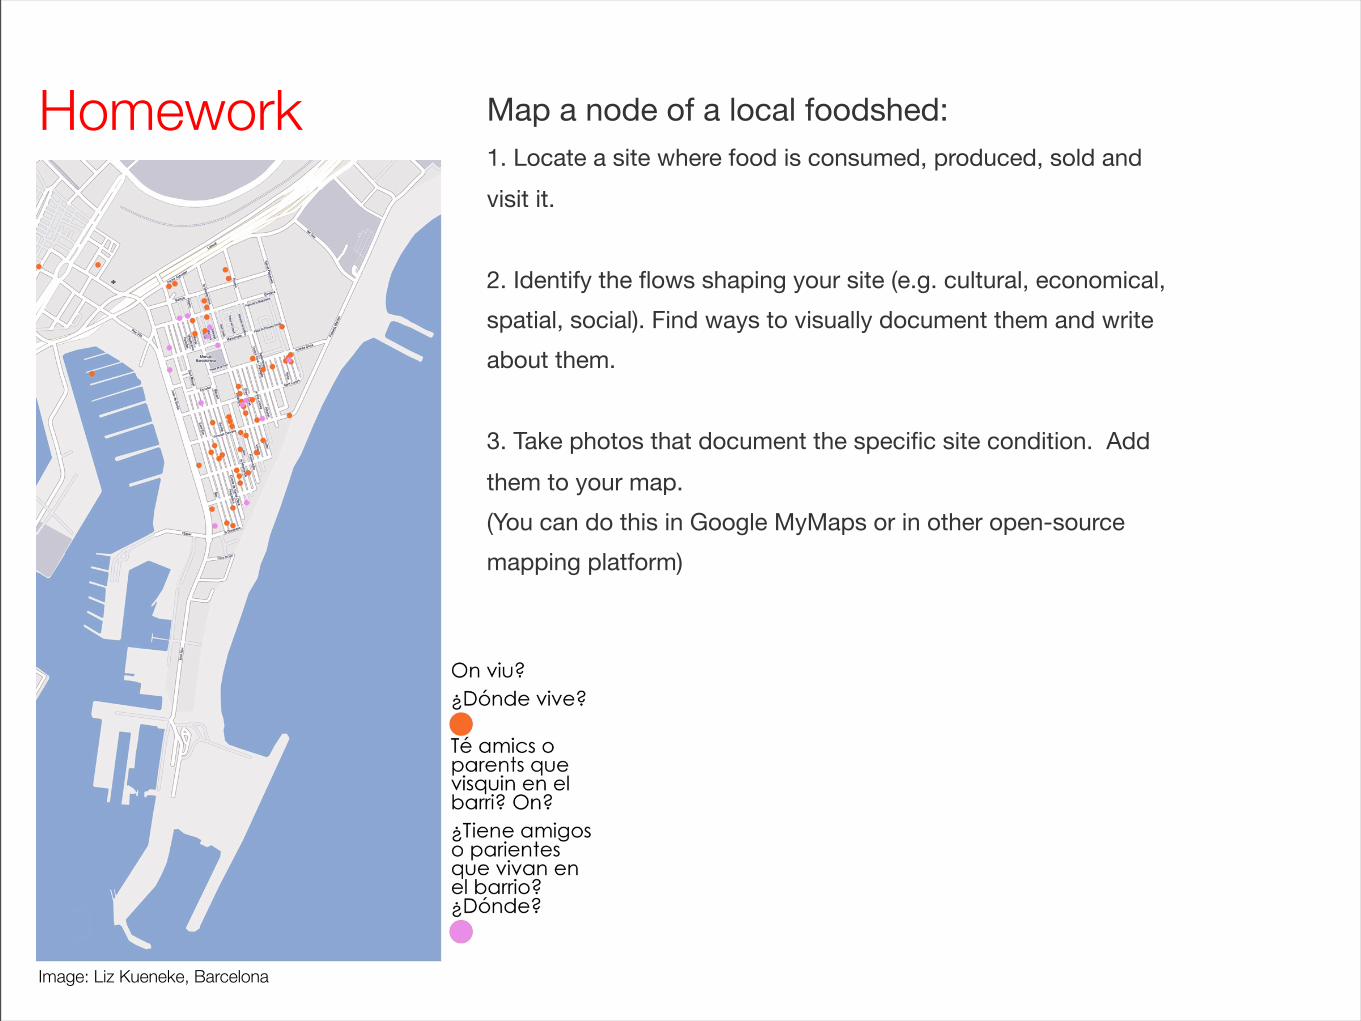
Homework Map a node of a local foodshed:1. Locate a site where food is consumed, produced, sold and
visit it.
2. Identify the flows shaping your site (e.g. cultural, economical,
spatial, social). Find ways to visually document them and write
about them.
3. Take photos that document the specific site condition. Add
them to your map.
(You can do this in Google MyMaps or in other open-source
mapping platform)
Image: Liz Kueneke, Barcelona