cineplex inc. reports fourth quarter and annual...
TRANSCRIPT

FOR IMMEDIATE RELEASE
CINEPLEX INC.Reports Fourth Quarter and Annual Results
TORONTO, Canada, February 15, 2017 (TSX: CGX) - Cineplex Inc. (“Cineplex”) today released its financial results for thethree months and year ended December 31, 2016. Unless otherwise specified, all amounts are in Canadian dollars.
Fourth Quarter Results
2016 2015Period over Period
Change (i)Total revenues $ 385.4 million $ 407.4 million -5.4%Attendance 17.9 million 20.4 million -12.0%Net income $ 23.3 million $ 76.8 million -69.6%Box office revenues per patron (“BPP”) (ii) $ 9.90 $ 9.63 2.8%Concession revenues per patron (“CPP”) (ii) $ 5.75 $ 5.58 3.0%Adjusted EBITDA (ii) $ 66.8 million $ 85.2 million -21.5%Adjusted EBITDA margin (ii) 17.3 % 20.9 % -3.6%Adjusted free cash flow (ii) $ 39.4 million $ 52.9 million -25.4%Adjusted free cash flow per common share ofCineplex (“Share”) (ii) $ 0.621 $ 0.837 -25.8%Earnings per Share attributable to owners ofCineplex (“EPS”) - basic $ 0.37 $ 1.22 -69.7%EPS excluding non-recurring items - basic (ii) $ 0.37 $ 0.64 -42.2%EPS - diluted $ 0.37 $ 1.20 -69.2%EPS excluding non-recurring items - diluted (ii) $ 0.37 $ 0.64 -42.2%
Full Year Results
2016 2015Period over Period
Change (i)Total revenues $ 1,478.3 million $ 1,370.9 million 7.8%Attendance 74.6 million 77.0 million -3.2%Net income $ 78.0 million $ 134.2 million -41.9%BPP (ii) $ 9.55 $ 9.23 3.5%CPP (ii) $ 5.65 $ 5.43 4.1%Adjusted EBITDA (ii) $ 234.0 million $ 249.8 million -6.3%Adjusted EBITDA margin (ii) 15.8 % 18.2 % -2.4%Adjusted free cash flow (ii) $ 155.9 million $ 157.2 million -0.9%Adjusted free cash flow per Share (ii) $ 2.456 $ 2.492 -1.4%EPS - basic $ 1.26 $ 2.13 -40.8%EPS excluding non-recurring items - basic (ii) $ 1.26 $ 1.56 -19.2%EPS - diluted $ 1.25 $ 2.12 -41.0%EPS excluding non-recurring items - diluted (ii) $ 1.25 $ 1.55 -19.4%
i. Period over period change calculated based on thousands of dollars except percentage and per share values. Changes in percentage amounts arecalculated as 2016 value less 2015 value.
ii. Adjusted EBITDA, adjusted EBITDA margin, adjusted free cash flow per common share of Cineplex, BPP, CPP and EPS excluding non-recurringitems are measures that do not have a standardized meaning under generally accepted accounting principles ("GAAP"). These measures as well asother non-GAAP financial measures reported by Cineplex are defined in the 'Non-GAAP Financial Measures' section at the end of this newsrelease.

“In 2016, total revenue increased 7.8% to $1.5 billion despite an attendance decrease of 3.2% compared to 2015, which featuredfive of the top eleven highest grossing films of all time. This increase in revenue was primarily due to the consolidation of PlayerOne Amusement Group (formerly Cineplex Starburst Inc.)” said Ellis Jacob, President and CEO, Cineplex.
“While our film entertainment results were impacted by the attendance decline, we accomplished a great deal in 2016 includingthe opening of our first location of The Rec Room in South Edmonton Common and three new theatres. Our cinema media anddigital place-based media businesses continued to grow, increasing 11.2% to $170.8 million versus the prior year. Player OneAmusement Group made two key acquisitions in the United States. Our adjusted EBITDA margins were negatively affected bythe impact of the lower attendance and costs attributable to our emerging businesses as we execute our diversification strategy.We are confident that these investments made in 2016 have Cineplex well positioned for meaningful growth in the future.”
“Looking ahead in 2017, we are encouraged by the film slate and we anticipate continued growth in our Film Entertainment andContent, Media and Amusement and Leisure businesses as we continue to build the company for the future.”
KEY DEVELOPMENTS IN 2016
The following describes certain key business initiatives undertaken and results achieved during 2016 in each of Cineplex’s corebusiness areas:
FILM ENTERTAINMENT AND CONTENT
Theatre Exhibition• Reported record annual box office revenues of $712.4 million, a 0.2% increase from 2015 due to the 3.5% increase in
BPP, partially offset by the 3.2% decrease in attendance.• BPP of $9.55 represents an annual record for Cineplex, benefiting from the continued expansion of premium offerings
across the circuit. The percentage of box office revenues from premium product was 46.1% in 2016, an all-time recordfor Cineplex, compared to the previous record of 38.9% reported in 2015.
• Opened three new theatres, Cineplex Cinemas Marine Gateway and VIP in Vancouver, British Columbia featuring 11auditoriums including three VIP and one UltraAVX auditorium; Cineplex Cinemas North Barrie in Barrie, Ontariofeaturing eight screens including an UltraAVX auditorium; and Cineplex Cinemas Kitchener and VIP in Kitchener, Ontariofeaturing 11 auditoriums including four VIP and one UltraAVX auditorium.
• Opened Canada’s first auditorium featuring the 4DX experience in Toronto, Ontario. The 4DX experience featuresspecially designed motion seats and in-auditorium environmental effects that are synchronized with the action on thescreen.
• Added the immersive technology Barco Escape in three auditoriums, featuring two additional side screens complementingthe main screen to create a panoramic viewing range for guests.
• Expanded Cineplex’s agreement with D-BOX, installing D-BOX in 34 additional auditoriums in 2016.
Theatre Food Service• Reported record annual theatre food service revenues of $421.2 million (0.7% increase from 2015) due to record
annual CPP of $5.65 (4.1% increase from 2015).• VIP Cinemas, which feature a specialty food menu, contributed to the growth of food service revenues, with the addition
of seven VIP auditoriums from two locations in 2016. • Also contributing to this growth was a shift in product mix from core concession offerings to premium items including
hot food sales at Outtakes, premium popcorn sales at Poptopia and yogurt sales at YoYo’s, all contributing to larger averagetransaction values in 2016 compared to 2015.
Alternative Programming• Featured numerous strong performing international films, including Cantonese, Hindi, Punjabi, Mandarin, Korean,
Filipino and Tamil language films in select markets across the country. • Partnered with the Canadian Broadcasting Corporation to offer screenings of The Tragically Hip: A National Celebration
to raise funds for the Canadian Cancer Society.
Digital Commerce • Launched fully transactional Cineplex Store apps for Xbox, Xbox One and Android platforms, allowing guests to rent,
buy and watch movies directly from their Xbox console in the comfort of their living rooms or from their Android devicesat home and on the go.
• Continued to develop the Cineplex Store user interface, improving the overall user experience.• As of December 31, 2016, the Cineplex mobile app had 16.1 million unique app downloads.

• Launched “Essential Accessibility” technology on Cineplex.com web platform to improve access for guests withdisabilities.
MEDIA• Reported record annual media revenues of $170.8 million, 11.2% higher than the previous record set in 2015 mainly as
a result of higher digital place-based media revenues.
Cinema Media• Cinema media revenues were a record $113.5 million in 2016 (0.9% higher than 2015) with the increase due to the impact
of new media initiatives more than offsetting the impact of declines in some traditional categories. • Rebranded two theatres to Scotiabank Theatres (in Ottawa and Winnipeg) as part of the expanded naming rights media
commitment between the Bank of Nova Scotia (“Scotiabank”) and Cineplex. These rebrandings bring the number ofScotiabank theatres across the circuit to ten, across eight provinces.
Digital Place-Based Media• Digital place-based media revenues of $57.3 million in 2016 represent an annual record, $16.1 million (39.2%) higher
than 2015. • Chosen to install, maintain and operate a leading edge digital display network at 21 Ivanhoe Cambridge shopping centres
across Canada. • Selected by American Dairy Queen Corporation (“DQ”) as the endorsed provider of in-store digital merchandising
solutions for the Dairy Queen system in the United States and Canada.• Selected by The Beer Store to help transition the brand onto a digital platform.
AMUSEMENT AND LEISURE
Amusement Solutions• Rebranded CSI as P1AG, unifying the previous businesses of CSI, Brady Starburst LLC (“BSL”), Premier Amusements
Inc., SAW and Tricorp under a single brand. • P1AG reported annual revenues of $109.0 million in 2016 ($10.4 million from Cineplex theatre gaming and $98.6 million
from all other sources of revenues). In the prior year period, Cineplex equity accounted for its 50% interest in CSI untilOctober 1, 2015 when it completed the acquisition of the remaining 50% of issued and outstanding equity that it did notalready own.
• Acquired the 20% of BSL that it did not previously own. • Acquired all of the issued and outstanding shares of Tricorp, a New Jersey-based leading provider of interactive video
games, redemption games and amusement services through revenue sharing agreements in the United States. • Acquired the assets of SAW, a Florida-based leading provider of coin-operated rides, amusement and redemption games
as well as bulk-vending equipment to hundreds of large-scale big box retailers, shopping centres and restaurant locations.
Location Based Entertainment• Opened the first location of The Rec Room at South Edmonton Commons in Edmonton, Alberta in September. The 60,000
square foot multi-level entertainment facility offers guests ‘Eats & Entertainment’, bringing together dining, gaming,technology and live entertainment experiences all under one roof.
• Cineplex has announced plans to build four additional locations, in Calgary, Alberta, a second location in Edmonton,Alberta at the iconic West Edmonton Mall and in Toronto, Ontario at the historic John Street Roundhouse across fromthe CN Tower all scheduled for openings in 2017 as well as a location in London, Ontario scheduled to open in 2018.
eSports• Cineplex and WorldGaming Network Limited Partnership (“WGN”) announced the signing of a comprehensive deal with
Sony Computer Entertainment Canada (“Sony”) making Sony the presenting sponsor of select national video gametournaments.
• During the year, WGN hosted the Canadian championships for Call of Duty: Black Ops III, Street Fighter V, and the firstmulti-player Canadian championships for Uncharted 4: A Thief’s End.
• Collegiate StarLeague (“CSL”), a subsidiary of WGN, announced a partnership with Riot Games to present the 2017season of CSL’s League of Legends collegiate league, called ‘uLoL Campus Series’, which will see over 500 collegesand universities in North America competing to qualify for the regional and national championships.
LOYALTY• Membership in the SCENE loyalty program increased 0.8 million members in 2016, reaching a membership of 8.1 million
at December 31, 2016.
CORPORATE• Effective with the May 2016 dividend, the board of directors of Cineplex (the “Board”) announced a monthly dividend
increase of 3.8% to $0.135 per Share ($1.62 on an annual basis) up from $0.13 per Share ($1.56 on an annual basis). • During the year Cineplex increased and extended its Credit Facilities (defined and discussed in Section 7.4, Credit
Facilities), increasing the Revolving Facility by $150.0 million with the Term Facility remaining unchanged, and extendedthe maturity date to April 26, 2021.
• In conjunction with the Credit Facilities, Cineplex entered into interest rate swap agreements with an aggregate principalamount of $200.0 million.
• Cineplex hosted its sixth annual National Community Day in October 2016 in support of WE, its national charitablepartner. In the past six years, Cineplex has raised $2.5 million on Community Days.
• Named one of Canadian Business magazine’s “25 Best Brands in Canada” based on consumer opinions of a company’sreputation. Named one of Strategy magazine’s 2016 Brands of the Year, based on companies’ with unique position in acategory and distinct brand image in the consumer’s mind.
OPERATING RESULTS FOR THE THREE MONTHS AND YEAR ENDED DECEMBER 31, 2016
Total revenues
Total revenues for the three months ended December 31, 2016 decreased $21.9 million (5.4%) to $385.4 million as compared tothe prior year period. Total revenues for the year ended December 31, 2016 increased $107.4 million (7.8%) to $1.5 billion ascompared to the prior year. A discussion of the factors affecting the changes in box office, food service, media and other revenuesfor the period is provided below.
Non-GAAP measures discussed throughout this MD&A, including adjusted EBITDA, adjusted free cash flow, attendance, BPP,premium priced product, same theatre metrics, CPP, film cost percentage, theatre food service cost percentage and theatre concessionmargin per patron are defined and discussed in the non-GAAP measures section of this news release.
Box office revenues
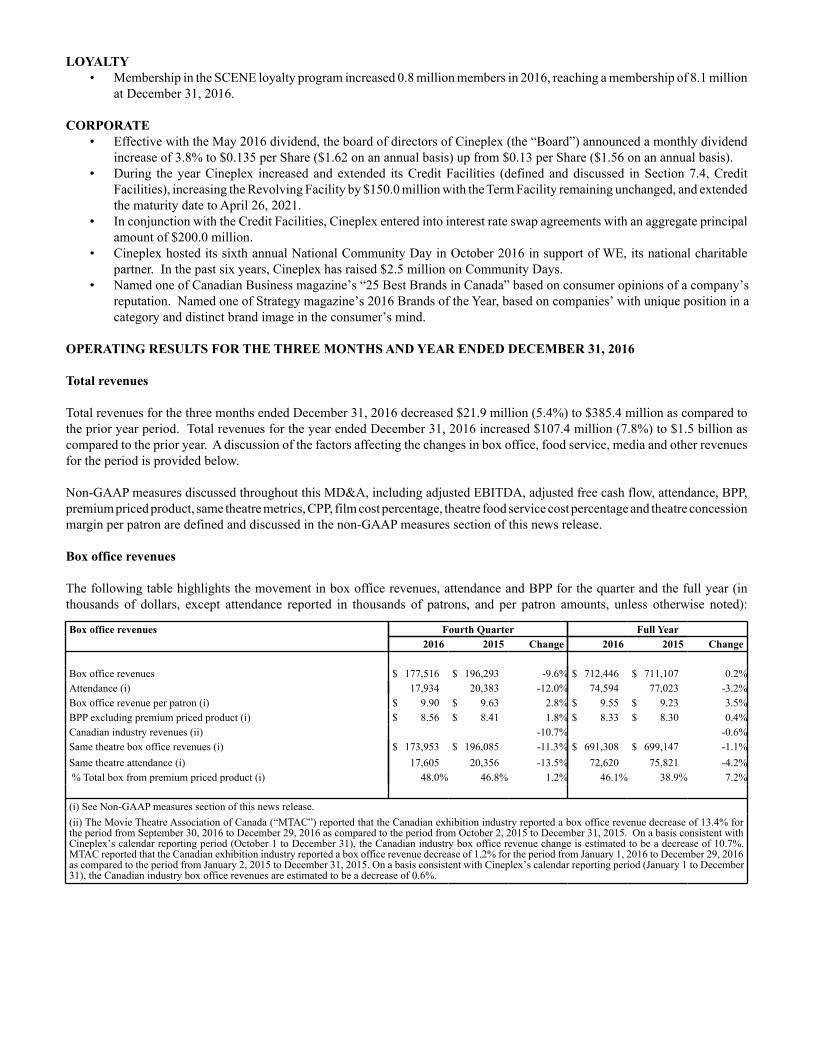
The following table highlights the movement in box office revenues, attendance and BPP for the quarter and the full year (inthousands of dollars, except attendance reported in thousands of patrons, and per patron amounts, unless otherwise noted):
Box office revenues Fourth Quarter Full Year2016 2015 Change 2016 2015 Change
Box office revenues $ 177,516 $ 196,293 -9.6% $ 712,446 $ 711,107 0.2%Attendance (i) 17,934 20,383 -12.0% 74,594 77,023 -3.2%Box office revenue per patron (i) $ 9.90 $ 9.63 2.8% $ 9.55 $ 9.23 3.5%BPP excluding premium priced product (i) $ 8.56 $ 8.41 1.8% $ 8.33 $ 8.30 0.4%Canadian industry revenues (ii) -10.7% -0.6%Same theatre box office revenues (i) $ 173,953 $ 196,085 -11.3% $ 691,308 $ 699,147 -1.1%Same theatre attendance (i) 17,605 20,356 -13.5% 72,620 75,821 -4.2%% Total box from premium priced product (i) 48.0% 46.8% 1.2% 46.1% 38.9% 7.2%
(i) See Non-GAAP measures section of this news release.(ii) The Movie Theatre Association of Canada (“MTAC”) reported that the Canadian exhibition industry reported a box office revenue decrease of 13.4% forthe period from September 30, 2016 to December 29, 2016 as compared to the period from October 2, 2015 to December 31, 2015. On a basis consistent withCineplex’s calendar reporting period (October 1 to December 31), the Canadian industry box office revenue change is estimated to be a decrease of 10.7%.MTAC reported that the Canadian exhibition industry reported a box office revenue decrease of 1.2% for the period from January 1, 2016 to December 29, 2016as compared to the period from January 2, 2015 to December 31, 2015. On a basis consistent with Cineplex’s calendar reporting period (January 1 to December31), the Canadian industry box office revenues are estimated to be a decrease of 0.6%.

Box office continuity Fourth Quarter Full YearBox Office Attendance Box Office Attendance
2015 as reported $ 196,293 20,383 $ 711,107 77,023Same theatre attendance change (26,502) (2,751) (29,506) (3,201)Impact of same theatre BPP change 4,370 — 21,676 —New and acquired theatres (i) 3,564 330 10,533 943Disposed and closed theatres (i) (209) (28) (1,364) (171)2016 as reported $ 177,516 17,934 $ 712,446 74,594(i) See non-GAAP measures section of this news release. Represents theatres opened, acquired, disposed or closed subsequent to the start of the prior yearcomparative period.
Fourth Quarter
Fourth Quarter 2016 Top Cineplex Films 3D%
Box Fourth Quarter 2015 Top Cineplex Films 3D%
Box1 Rogue One: A Star Wars Story a 16.1% 1 Star Wars: The Force Awakens a 22.0%2 Doctor Strange a 10.8% 2 Spectre 10.8%3 Fantastic Beasts and Where to Find Them a 9.3% 3 The Martian a 9.2%4 Moana a 5.6% 4 The Hunger Games: Mockingjay - Part 2 8.2%5 Trolls a 4.5% 5 Hotel Transylvania 2 a 4.3%
Box office revenues decreased $18.8 million, or 9.6%, to $177.5 million during the fourth quarter of 2016, compared to $196.3million recorded in the same period in 2015. The prior period is a tough comparator due to the record breaking success of StarWars: The Force Awakens which went on to become the highest grossing film of all-time in North America.
BPP for the three months ended December 31, 2016 was $9.90, a $0.27 increase from the prior year period and an all-time quarterlyrecord for Cineplex. The increase in BPP was due to the strong performance of premium product, which accounted for 48.0% ofbox office revenues in the current period, up from 46.8% in the prior year period. This increase was due to all top five films inthe current period being screened in 3D (compared to three of five in the prior period) as well as the increased number of UltraAVX,VIP and D-BOX locations in the current period.
Full Year
Full Year 2016 Top Cineplex Films 3D%
Box Full Year 2015 Top Cineplex Films 3D%
Box1 Rogue One: A Star Wars Story a 4.0% 1 Star Wars: The Force Awakens a 6.1%2 Deadpool 4.0% 2 Jurassic World a 5.5%3 Finding Dory a 3.5% 3 The Avengers: Age of Ultron a 4.2%4 Star Wars: The Force Awakens a 3.5% 4 Minions a 3.3%5 Captain America: Civil War a 3.4% 5 Furious 7 3.1%
Box office revenues for the year ended December 31, 2016 were $712.4 million, an increase of $1.3 million or 0.2% over the prioryear. This increase compared to the prior year is due to the higher BPP more than offsetting the impact of the lower attendance.The attendance decrease is due to the prior year being a tough comparator with the top five films in that period all ranking in thetop eleven highest grossing films of all-time.
Cineplex’s BPP for the year ended December 31, 2016 increased $0.32, or 3.5%, from $9.23 in 2015 to an annual record of $9.55in 2016. This increase was primarily due to stronger performing premium-priced offerings, which accounted for 46.1% of Cineplex’sbox office revenues in the year ended December 31, 2016, compared to 38.9% in 2015. This increase was due in part to expanded3D, VIP, UltraAVX, and D-BOX offerings across the circuit as well as the addition of 4DX in the current period.
Food service revenues
The following table highlights the movement in food service revenues, attendance and CPP for the quarter and the full year (inthousands of dollars, except attendance and same store attendance reported in thousands of patrons, and per patron amounts):

Food service revenues Fourth Quarter Full Year2016 2015 Change 2016 2015 Change
Food service - theatres $ 103,128 $ 113,799 -9.4% $ 421,226 $ 418,445 0.7%Food service - The Rec Room 2,407 — NM 2,694 — NMTotal food service revenues $ 105,535 $ 113,799 -7.3% $ 423,920 $ 418,445 1.3%
Attendance (i) 17,934 20,383 -12.0% 74,594 77,023 -3.2%CPP (i) $ 5.75 $ 5.58 3.0% $ 5.65 $ 5.43 4.1%Same theatre food service revenues (i) $ 100,671 $ 113,674 -11.4% $ 408,436 $ 411,289 -0.7%Same theatre attendance (i) 17,605 20,356 -13.5% 72,620 75,821 -4.2%
(i) See non-GAAP measures section of this news release
Theatre food service revenue continuity Fourth Quarter Full YearTheatre Food
Service AttendanceTheatre Food
Service Attendance2015 as reported $ 113,799 20,383 $ 418,445 77,023Same theatre attendance change (15,366) (2,751) (17,363) (3,201)Impact of same theatre CPP change 2,361 — 14,510 —New and acquired theatres (i) 2,459 330 6,259 943Disposed and closed theatres (i) (125) (28) (625) (171)2016 as reported $ 103,128 17,934 $ 421,226 74,594(i) See non-GAAP measures section of this news release. Represents theatres opened, acquired, disposed or closed subsequent to the start of the prior yearcomparative period.
Fourth Quarter
Food service revenues are comprised primarily of concession revenues, which includes food service sales at theatre locations.Food service revenues also include food and beverage sales at The Rec Room. Food service revenues decreased $8.3 million, or7.3% as compared to the prior year period due to the impact of the 12.0% decrease in attendance, partially offset by the impact ofthe 3.0% increase in CPP and the impact of The Rec Room. The operations of The Rec Room in Edmonton contributed $2.4 millionin the period, and these revenues are excluded from the CPP calculation.
CPP of $5.75 is an all-time quarterly record for Cineplex. Expanded offerings outside of core food service products, includingofferings at Cineplex’s VIP Cinemas and Outtakes locations, have contributed to increased visitation and higher average transactionvalues, resulting in the record CPP in the period.
Full Year
Food service revenues increased $5.5 million, or 1.3% as compared to the prior year due to the impact of the higher CPP morethan offsetting the impact of the lower attendance, resulting in record annual revenues of $423.9 million. CPP increased from$5.43 in 2015 to $5.65 in 2016, an annual record for Cineplex. The operations of The Rec Room in Edmonton contributed $2.7million to the revenue increase, and these revenues are excluded from the CPP calculation.
While the 10% SCENE discount and SCENE points issued on theatre food service purchases reduce individual transaction valueswhich impacts CPP, Cineplex believes that this loyalty program drives incremental visits and food service purchases, resulting inhigher overall food service revenues.
Media revenues
The following table highlights the movement in media revenues for the quarter and the full year (in thousands of dollars):
Media revenues Fourth Quarter Full Year2016 2015 Change 2016 2015 Change
Cinema media $ 37,065 $ 42,116 -12.0% $ 113,497 $ 112,479 0.9%Digital place-based media 15,655 13,142 19.1% 57,295 41,167 39.2%Total media revenues $ 52,720 $ 55,258 -4.6% $ 170,792 $ 153,646 11.2%

Fourth Quarter
Total media revenues decreased 4.6% to $52.7 million in the fourth quarter of 2016 compared to the prior year period. Thisdecrease was due to cinema media revenues, which were $5.1 million (12.0%) lower than the prior year period. Record resultsfor cinema media in the fourth quarter of 2015 due in part to the highly anticipated film Star Wars: The Force Awakens made fora tough comparator resulting in lower pre-show and Show-Time revenues, partially offset by growth in new media initiatives.
Digital place-based media revenues increased $2.5 million due to an expansion of the client base resulting in increased projectinstallation revenues, as well as advertising and other media revenue growth. During the quarter, Cineplex announced it had beenselected by Ivanhoe Cambridge to install, maintain and operate a leading edge digital display network at 21 Ivanhoe Cambridgeshopping centres across Canada. The rollout of this project in 2017 will result in project revenues as well as advertising and servicerevenues once the network is fully installed and operational.
Full Year
Total media revenues increased $17.1 million, or 11.2%, in the year ended December 31, 2016 compared to the prior year. Theincrease was primarily due to the record performance of the digital place-based media business, which reported growth of $16.1million (39.2%) from higher project installation, services and advertising revenue growth due to an expanded client base. Cinemamedia revenues increased $1.0 million (0.9%) compared to the prior year due to the impact of new media initiatives, partiallyoffset by lower pre-show revenues.
Other revenues
The following table highlights the movement in games and other revenues for the quarter and the full year (in thousands of dollars):
Other revenues Fourth Quarter Full Year2016 2015 Change 2016 2015 Change
Games - Cineplex exhibition (i) $ 2,502 $ 2,394 4.5% $ 10,384 $ 9,410 10.4%The Rec Room - amusement and gaming 2,163 — NM 2,367 — NMGames - P1AG excluding Cineplex exhibition (i) 29,072 21,183 37.2% 98,597 21,183 365.5%Other 15,928 18,445 -13.6% $ 59,820 $ 57,152 4.7%Total other revenues $ 49,665 $ 42,022 18.2% $ 171,168 $ 87,745 95.1%(i) Cineplex receives a venue revenue share on games revenues earned at in-theatre game rooms and XSCAPE entertainment centres. “Games - Cineplexexhibition” reports the total of this venue revenue share which is consistent with the historical presentation of Cineplex’s Games revenues. “Games - P1AGexcluding Cineplex exhibition” reflects P1AG’s gross gaming revenues, net of the venue revenue share paid to Cineplex reflected in “Games - Cineplexexhibition” above.
Fourth Quarter
Other revenues increased 18.2%, or $7.6 million, to $49.7 million in the fourth quarter of 2016 compared to the prior year periodprimarily due to higher P1AG revenues due in part to the Tricorp and SAW acquisitions in the period. Games revenues fromCineplex’s exhibition business increased despite the decrease in attendance primarily due to more XSCAPE locations operatingin the current period compared to the prior year period.
The decrease in Other of $2.5 million in the period was primarily due to lower revenues arising from enhanced guest serviceinitiatives due to the lower business volumes in the theatres in the period.
Full Year
Other revenues increased 95.1% from $87.7 million in 2015 to $171.2 million during 2016, primarily due to the consolidation ofCSI following Cineplex’s acquisition on October 1, 2015 of the 50% of CSI that it did not already own ($69.5 million) as well asthe higher P1AG revenues in the fourth quarter of 2016 compared to the prior year period.
Cineplex exhibition gaming revenues increased 10.4% in the year despite the lower attendance due to a higher number of XSCAPEentertainment centres open in the current year compared to the prior year. The increase in Other of $2.7 million was primarilyadditional revenues arising from enhanced guest service initiatives.

Film cost
The following table highlights the movement in film cost and the film cost percentage for the quarter and the full year (in thousandsof dollars, except film cost percentage):
Film cost Fourth Quarter Full Year2016 2015 Change 2016 2015 Change
Film cost $ 96,068 $105,210 -8.7% $ 389,602 $ 379,103 2.8%Film cost percentage (i) 54.1% 53.6% 0.5% 54.7% 53.3% 1.4%(i) See non-GAAP measures section of this news release.
Fourth Quarter
Film cost varies primarily with box office revenues, and can vary from quarter to quarter usually based on the relative strengthand concentration of the titles exhibited during the period. This is due to film cost terms varying by title. Film cost percentagein the fourth quarter of 2016 was 54.1%, a 0.5% increase from the prior year period.
Full Year
The full year increase in film cost expense was due to the 1.4% increase in film cost percentage.
Cost of food service
The following table highlights the movement in cost of food service for both theatres and The Rec Room for the quarter and thefull year (in thousands of dollars, except percentages and margins per patron):
Cost of food service Fourth Quarter Full Year2016 2015 Change 2016 2015 Change
Cost of food service - theatre $ 23,911 $ 24,836 -3.7% $ 95,114 $ 90,530 5.1%Cost of food service - The Rec Room 875 — NM 945 — NMTotal cost of food service $ 24,786 $ 24,836 -0.2% $ 96,059 $ 90,530 6.1%
Theatre concession cost percentage (i) 23.2% 21.8% 1.4% 22.6% 21.6% 1.0%Theatre concession margin per patron (i) $ 4.42 $ 4.36 1.4% $ 4.37 $ 4.26 2.6%
(i) See Section 17, Non-GAAP measures.
Fourth Quarter
Cost of food service at the theatres varies primarily with theatre attendance as well as the quantity and mix of offerings sold. Costof food service at The Rec Room varies primarily with the volume of guests who visit the location as well as the quantity and mixbetween food and beverage items sold.
The decrease in the theatre cost of food service as compared to the prior year period was due to the lower food service revenues,partially offset by the 1.4% increase in the concession cost percentage during the period. The increase in the concession costpercentage is due in part to the mix of food offerings. The addition of VIP theatres at two locations since the prior year periodhas contributed to the changing mix including more items outside of core concession offerings, which tend to have higher costs.
The theatre concession margin per patron increased 1.4% from $4.36 in the fourth quarter of 2015 to $4.42 in the same period in2016, reflecting the impact of the higher CPP during the period, partially offset by the impact of the higher theatre concession costpercentage.
Cost of food service at The Rec Room reflects the costs incurred at the South Edmonton Commons location during the period,which opened in mid-September 2016 and is therefore not included in the prior year comparatives.

Full Year
The increase in the theatre cost of food service as compared to the prior year was due to higher theatre food service revenues, aswell as the 1.0% increase in the theatre concession cost percentage during the year. The theatre concession margin per patronincreased from $4.26 in the prior year to $4.37 in the current year, reflecting the impact of the higher CPP in the current year.
Cost of food service at The Rec Room reflects the costs incurred at the South Edmonton location during the period, which openedin mid-September 2016 and is therefore not included in the prior year comparatives.
Despite the 10% discount offered to SCENE members and SCENE points offered on select offerings, which contributes to a higherconcession cost percentage, Cineplex believes the SCENE loyalty program drives incremental attendance and purchase incidencewhich increases food service revenues and CPP.
Depreciation and amortization
The following table highlights the movement in depreciation and amortization expenses during the quarter and full year (inthousands of dollars):
Depreciation and amortization expenses Fourth Quarter Full Year2016 2015 Change 2016 2015 Change
Depreciation of property, equipment and leaseholds $ 24,219 $ 20,981 15.4% $ 91,047 $ 80,079 13.7%Amortization of intangible assets and other 4,035 3,545 13.8% 14,894 9,260 60.8%Depreciation and amortization expenses as reported $ 28,254 $ 24,526 15.2% $ 105,941 $ 89,339 18.6%
The quarterly and annual increase in depreciation of property, equipment and leaseholds of $3.2 million and $11.0 million,respectively, is primarily due to the impact of equipment and leasehold improvements relating to assets acquired throughacquisitions, new theatre construction and digital place-based media asset additions.
The quarterly and annual increase in amortization of intangible assets and other are primarily due to intangible assets acquired inthe WGN and CSI transactions.
Loss on disposal of assets
The following table shows the movement in the loss on disposal of assets during the quarter and full year (in thousands of dollars):
Loss on disposal of assets Fourth Quarter Full Year2016 2015 Change 2016 2015 Change
Loss on disposal of assets $ 168 $ 899 -81.3% $ 1,570 $ 3,236 -51.5%
Gain on acquisition of business
The following table shows the gain on acquisition of business relating to Cineplex’s acquisition of the 50% interest in CSI in thefourth quarter of 2015 that it did not previously own. Cineplex previously equity-accounted for its interest in CSI. At the acquisitiondate, Cineplex recognized 100% of identifiable net assets of CSI. Cineplex’s existing interest was remeasured at fair value at theacquisition date, resulting in a gain on the equity interest of $7.4 million (in thousands of dollars):
Gain on acquisition of business Fourth Quarter Full Year2015 2014 Change 2015 2014 Change
Gain on acquisition of business $ — $ (7,447) NM $ — $ (7,447) NM
Other costs
Other costs include three main sub-categories of expenses, including theatre occupancy expenses, which capture the rent andassociated occupancy costs for Cineplex’s theatre operations; other operating expenses, which include the costs related to runningCineplex’s film entertainment and content, media, amusement and leisure as well as Cineplex’s ancillary businesses; and generaland administrative expenses, which includes costs related to managing Cineplex’s operations, including head office expenses.Please see the discussions below for more details on these categories. The following table highlights the movement in other costsfor the quarter and full year (in thousands of dollars):

Other costs Fourth Quarter Full Year2016 2015 Change 2016 2015 Change
Theatre occupancy expenses $ 49,581 $ 50,535 -1.9% $ 204,633 $ 203,356 0.6%Other operating expenses 134,683 123,329 9.2% 487,108 383,281 27.1%General and administrative expenses 13,803 18,514 -25.4% 68,189 68,752 -0.8%Total other costs $ 198,067 $ 192,378 3.0% $ 759,930 $ 655,389 16.0%
Theatre occupancy expenses
The following table highlights the movement in theatre occupancy expenses for the quarter and full year (in thousands of dollars):
Theatre occupancy expenses Fourth Quarter Full Year2016 2015 Change 2016 2015 Change
Rent $ 33,825 $ 33,970 -0.4% $ 136,393 $ 135,482 0.7%Other occupancy 16,540 17,086 -3.2% 71,474 71,014 0.6%One-time items (i) (784) (521) 50.5% (3,234) (3,140) 3.0%Total $ 49,581 $ 50,535 -1.9% $ 204,633 $ 203,356 0.6%(i) One-time items include amounts related to both theatre rent and other theatre occupancy costs. They are isolated here to illustrate Cineplex’s theatre rentand other theatre occupancy costs excluding these one-time, non-recurring items.
Theatre occupancy continuity Fourth Quarter Full YearOccupancy Occupancy
2015 as reported $ 50,535 $ 203,356Impact of new and acquired theatres 613 2,710Impact of disposed theatres (57) (333)Same store rent change (i) (416) (619)One-time items (263) (93)Other (831) (388)2016 as reported $ 49,581 $ 204,633(i) See Section 17, Non-GAAP measures.
Fourth Quarter
Theatre occupancy expenses decreased $1.0 million during the fourth quarter of 2016 compared to the prior year period. Thisdecrease was primarily due to lower same store rent expense ($0.4 million, $1.3 million due to lower non-cash rent expense partiallyoffset by $0.9 million in higher cash rent expense), the impact of higher one-time credits in the current period than the prior year($0.3 million), and lower real estate and common area maintenance taxes ($0.8 million). These decreases were partially offset bythe impact of new theatres net of disposed theatres ($0.6 million).
Full Year
The increase in theatre occupancy expenses of $1.3 million for 2016 compared to the prior year was primarily due to the impactof new and acquired theatres net of disposed theatres, partially offset by lower same theatre rent expenses due to lower non-cashrent expenses, the impact of higher one-time credits, and lower real estate and common area maintenance taxes.
Other operating expenses
The following table highlights the movement in other operating expenses during the quarter and the full year (in thousands ofdollars):

Other operating expenses Fourth Quarter Full Year2016 2015 Change 2016 2015 Change
Theatre payroll $ 35,768 $ 37,959 -5.8% $ 143,197 $ 141,257 1.4%Media 18,721 16,367 14.4% 69,120 55,831 23.8%P1AG 26,644 18,975 40.4% 86,809 18,975 357.5%The Rec Room (i) 2,976 — NM 3,333 — NMOther 50,574 50,028 1.1% 184,649 167,218 10.4%Other operating expenses $ 134,683 $ 123,329 9.2% $ 487,108 $ 383,281 27.1%
(i) Includes operating costs of The Rec Room location in Edmonton. Pre-opening costs relating to The Rec Room locations and overhead relating tomanagement of The Rec Room portfolio are included in the ‘Other’ line.
Other operating continuity Fourth Quarter Full YearOther Operating Other Operating
2015 as reported $ 123,329 $ 383,281Impact of new and acquired theatres 1,719 5,242Impact of disposed theatres (89) (444)Same theatre payroll change (i) (3,150) (742)Marketing change (490) 1,162Media change 2,354 13,289P1AG change 7,669 67,834Amusement and leisure, excluding P1AG 5,207 15,345Other (1,866) 2,1412016 as reported $ 134,683 $ 487,108(i) See non-GAAP measures section of this news release.
Fourth Quarter
Other operating expenses during the fourth quarter of 2016 increased $11.4 million or 9.2% compared to the prior year period.The increase is primarily due to higher amusement and leisure costs, including P1AG due in part to the acquisitions of Tricorpand SAW in the period as well as costs relating to the The Rec Room and WGN. Media costs were higher due to the increasedbusiness volumes in the digital place-based media business. These increases were partially offset by lower same theatre payrollcosts and lower costs in the Other line due to the lower business volumes in the film entertainment and content business in theperiod.
Full Year
For the year ended December 31, 2016, other operating expenses increased $103.8 million, primarily due to the inclusion of P1AG($67.8 million: $60.2 million due to the first three quarters where there was no comparative in the prior year period and theincremental $7.6 million in the fourth quarter due to the acquisitions of Tricorp and SAW as well as increased business volumes).Excluding P1AG, operating expenses increased $36.0 million, with the increase due to higher business volumes in the mediabusinesses, costs relating to WGN (which did not have a full period of operations in the prior year period) and The Rec Room.
General and administrative expenses
The following table highlights the movement in general and administrative (“G&A”) expenses during the quarter and the full year,including Share based compensation costs, and G&A net of these costs (in thousands of dollars):
G&A expenses Fourth Quarter Full Year2016 2015 Change 2016 2015 Change
G&A excluding LTIP and option plan expense $ 13,382 $ 13,959 -4.1% $ 58,217 $ 54,908 6.0%LTIP (i) 39 4,127 -99.1% 8,353 12,150 -31.3%Option plan 382 428 -10.7% 1,619 1,694 -4.4%G&A expenses as reported $ 13,803 $ 18,514 -25.4% $ 68,189 $ 68,752 -0.8%(i) LTIP includes the expense for the LTIP program as well as the expense for the executive and Board deferred share unit plans.

Fourth Quarter
G&A expenses decreased $4.7 million during the fourth quarter of 2016 compared to the prior year period primarily due to lowerLTIP expense ($4.1 million). The decrease in LTIP expense was due to the current period including an adjustment relating to thevariance in performance results for the full 2016 period.
Full Year
G&A expenses for 2016 decreased $0.6 million compared to the prior year, due to the $3.8 million decrease in LTIP expensepartially offset by higher head office payroll expenses.
EARNINGS BEFORE INTEREST, INCOME TAXES, DEPRECIATION AND AMORTIZATION (“EBITDA”) (seenon-GAAP measures section of this news release)
The following table presents EBITDA and adjusted EBITDA for the three months and year ended December 31, 2016 as comparedto the prior year period (in thousands of dollars, except adjusted EBITDA margin):
EBITDA Fourth Quarter Year to Date2016 2015 Change 2016 2015 Change
EBITDA $ 66,973 $ 121,542 -44.9% $ 233,871 $ 282,764 -17.3%Adjusted EBITDA $ 66,841 $ 85,163 -21.5% $ 234,009 $ 249,802 -6.3%Adjusted EBITDA margin 17.3% 20.9% -3.6% 15.8% 18.2% -2.4%
Adjusted EBITDA for the fourth quarter of 2016 decreased $18.3 million, or 21.5%, as compared to the prior year period, to $66.8million. This decrease as compared to the prior year period was due mainly to the weaker film product in the current periodresulting in lower attendance. Adjusted EBITDA margin, calculated as adjusted EBITDA divided by total revenues, was 17.3%in the current period, a decrease of 3.6% from 20.9% in the prior year period.
Adjusted EBITDA for the year ended December 31, 2016 decreased $15.8 million, or 6.3%, to $234.0 million as compared to$249.8 million the prior year due in part to the weaker film product in the current period resulting in lower attendance. AdjustedEBITDA margin was 15.8% in 2016 compared to 18.2% in 2015. In addition to the impact of the weaker film product, the adjustedEBITDA margin was impacted by higher costs attributable to Cineplex’s emerging businesses as it executes on its diversificationstrategy.
ADJUSTED FREE CASH FLOW (see non-GAAP measures section of this news release)
For the fourth quarter of 2016, adjusted free cash flow per common share of Cineplex was $0.62 as compared to $0.84 in the prioryear period. The declared dividends per common share of Cineplex were $0.41 in the fourth quarter of 2016 and $0.39 in the prioryear period. During the year ended December 31, 2016, Cineplex generated adjusted free cash flow per Share of $2.46, comparedto $2.49 per Share in the year ended December 31, 2015. Cineplex declared dividends per Share of $1.60 and $1.54, respectively,in each year. The payout ratios for these periods were approximately 65.1% and 61.8%, respectively.
NON-GAAP FINANCIAL MEASURES
EBITDA and Adjusted Free Cash FlowEBITDA and adjusted free cash flow are not measures recognized by GAAP and do not have standardized meanings in accordancewith such principles. Therefore, EBITDA and adjusted free cash flow may not be comparable to similar measures presented byother issuers. Management uses adjusted EBITDA and adjusted free cash flow to evaluate performance primarily because of thesignificant effect certain unusual or non-recurring charges and other items have on EBITDA from period to period.
EBITDA is calculated by adding back to net income, income tax expense, depreciation and amortization expense, and interestexpense net of interest income. Adjusted EBITDA is calculated by adjusting EBITDA for the change in fair value of financialinstrument, losses on disposal of assets, gain on acquisition of business, the equity income of CDCP, the non-controlling interests’share of adjusted EBITDA of WGN and BSL, and depreciation, amortization, interest and taxes of Cineplex’s other joint ventures.Adjusted EBITDA margin is calculated by dividing adjusted EBITDA by total revenues.
Adjusted free cash flow is a non-GAAP measure generally used by Canadian corporations, as an indicator of financial performanceand it should not be seen as a measure of liquidity or a substitute for comparable metrics prepared in accordance with GAAP.

For a detailed reconciliation of net income to EBITDA and adjusted EBITDA and from cash provided by operating activities toadjusted free cash flow, please refer to Cineplex’s management’s discussion and analysis filed on www.sedar.com.
Earnings per Share MetricsThe three months and year ended December 31, 2015 include the gain on business acquisition relating to CSI of $7.4 million andthe change in fair value of financial instrument relating to the adjustment to the contingent consideration from the 2013 acquisitionof EK3 of $29.1 million. Cineplex has presented basic and diluted earnings per share net of these two items to provide a morecomparable earnings per share metric between the current periods and prior year periods. In the non-GAAP measure, earnings isdefined as net income excluding both the gain on acquisition and the change in fair value of financial instrument.
Per Patron Revenue MetricsCineplex reviews per patron metrics as they relate to box office revenue and concession revenue such as BPP, CPP, BPP excludingpremium priced product, and concession margin per patron, as these are key measures used by investors to value and assessCineplex’s performance, and are widely used in the theatre exhibition industry. Management of Cineplex defines these metricsas follows:
Attendance: Attendance is calculated as the total number of paying patrons that frequent Cineplex’s theatres during the period.BPP: Calculated as total box office revenues divided by total paid attendance for the period.BPP excluding premium priced product: Calculated as total box office revenues for the period, less box office revenues from3D, UltraAVX, VIP and IMAX product; divided by total paid attendance for the period, less paid attendance for 3D, UltraAVX,VIP and IMAX product.CPP: Calculated as total theatre food service revenues divided by total paid attendance for the period.Premium priced product: Defined as 3D, UltraAVX, IMAX and VIP film product.Theatre concession margin per patron: Calculated as total theatre food service revenues less total theatre food service cost,divided by total paid attendance for the period.
Same Theatre AnalysisCineplex reviews and reports same theatre metrics relating to box office revenues, theatre food service revenues, theatre rentexpense and theatre payroll expense, as these measures are widely used in the theatre exhibition industry as well as other retailindustries.
Same theatre metrics are calculated by removing the results for all theatres that have been opened, acquired, closed or otherwisedisposed of subsequent to the start of the prior year comparative period. For the three months ended December 31, 2016 the impactof the four locations that have been opened or acquired and the one location that has been closed have been excluded, resultingin 161 theatres being included in the same theatre metrics. For the year ended December 31, 2016 the impact of the seven locationsthat have been opened or acquired and the three locations that have been closed have been excluded, resulting in 158 theatresbeing included in the same theatre metrics.
Cost of sales percentagesCineplex reviews and reports cost of sales percentages for its two largest revenue sources, box office revenues and food servicerevenues as these measures are widely used in the theatre exhibition industry. These measures are reported as film cost percentageand concession cost percentage, respectively, and are calculated as follows:
Film cost percentage: Calculated as total film cost expense divided by total box office revenues for the period.Theatre concession cost percentage: Calculated as total theatre food service costs divided by total theatre food service revenuesfor the period.
Certain information included in this news release contains forward-looking statements within the meaning of applicable securitieslaws. These forward-looking statements include, among others, statements with respect to Cineplex’s objectives, goals andstrategies to achieve those objectives and goals, as well as statements with respect to Cineplex’s beliefs, plans, objectives,expectations, anticipations, estimates and intentions. The words “may”, “will”, “could”, “should”, “would”, “suspect”,“outlook”, “believe”, “plan”, “anticipate”, “estimate”, “expect”, “intend”, “forecast”, “objective” and “continue” (or thenegative thereof), and words and expressions of similar import, are intended to identify forward-looking statements.
By their very nature, forward-looking statements involve inherent risks and uncertainties, including those described in Cineplex’sAnnual Information Form (“AIF”), Cineplex’s management’s discussion and analysis (“MD&A”) and in this news release. Thoserisks and uncertainties, both general and specific, give rise to the possibility that predictions, forecasts, projections and otherforward-looking statements will not be achieved. Certain material factors or assumptions are applied in making forward-lookingstatements and actual results may differ materially from those expressed or implied in such statements. Cineplex cautions readers
not to place undue reliance on these statements, as a number of important factors, many of which are beyond Cineplex’s control,could cause actual results to differ materially from the beliefs, plans, objectives, expectations, anticipations, estimates and intentionsexpressed in such forward-looking statements. These factors include, but are not limited to, risks generally encountered in therelevant industry, competition, customer, legal, taxation and accounting matters.
The foregoing list of factors that may affect future results is not exhaustive. When reviewing Cineplex’s forward-looking statements,readers should carefully consider the foregoing factors and other uncertainties and potential events. Additional information aboutfactors that may cause actual results to differ materially from expectations and about material factors or assumptions applied inmaking forward-looking statements may be found in the “Risks and Uncertainties” section of Cineplex’s MD&A.
Cineplex does not undertake to update or revise any forward-looking statements, whether as a result of new information, futureevents or otherwise, except as required by applicable Canadian securities law. Additionally, we undertake no obligation to commenton analyses, expectations or statements made by third parties in respect of Cineplex, its financial or operating results or itssecurities. All forward-looking statements in this news release are made as of the date hereof and are qualified by these cautionarystatements. Additional information, including Cineplex’s AIF and MD&A, can be found on SEDAR at www.sedar.com.
About Cineplex Inc.
Cineplex is one of Canada’s leading entertainment companies and operates one of the most modern and fully digitized motionpicture theatre circuits in the world. A top-tier Canadian brand, Cineplex operates numerous businesses including theatricalexhibition, food service, amusement gaming, alternative programming (Cineplex Events), Cineplex Media, Cineplex Digital Media,The Rec Room, and the online sale of home entertainment content through CineplexStore.com and on apps embedded in variouselectronic devices. Cineplex is also a joint venture partner in SCENE - Canada’s largest entertainment loyalty program.
Cineplex is headquartered in Toronto, Canada, and operates 164 theatres with 1,677 screens from coast to coast, servingapproximately 75 million guests annually through the following theatre brands: Cineplex Cinemas, Cineplex Odeon, CineplexVIP Cinemas, Galaxy Cinemas, SilverCity Cinemas and Scotiabank Theatres. Cineplex also owns and operates the UltraAVX,Poptopia and Outtakes brands. Cineplex trades on the Toronto Stock Exchange under the symbol CGX. More information isavailable at Cineplex.com. Further information can be found in the disclosure documents filed by Cineplex with the securitiesregulatory authorities, available at www.sedar.com.
You are cordially invited to participate in a teleconference call with the management of Cineplex (TSX: CGX) to review ourquarterly results. Ellis Jacob, President and Chief Executive Officer, Gord Nelson, Chief Financial Officer and PatMarshall, Investor Relations Officer will host the call. The teleconference call is scheduled for:
Wednesday February 15, 201710:00 a.m. Eastern Time
In order to participate in the conference call, please dial 416-849-1847 or outside of Toronto dial 1-800-274-0251 at least fiveto ten minutes prior to 10:00 a.m. Eastern Time. Please quote confirmation code 9252966 to access the call.
• If you cannot participate in the live mode, a replay will be available. Please dial 647-436-0148 or outside Toronto1-888-203-1112. Please use PIN 9876 and the replay passcode 236679 when prompted. You can also access the web addressURL to register and enter the PIN and code when prompted. Web address URL: Click Here
• The replay will begin at 1:00 p.m. Eastern Time on Wednesday February 15, 2017 and end at 1:00 p.m. Eastern Time onWednesday, February 22, 2017.
• Note that media will be participating in the call in listen-only mode.• Thank you in advance for your interest and participation.
- 30 -For further information:Gord Nelson Pat MarshallChief Financial Officer Vice President Communications and Investor Relations(416) 323-6602 (416) 323-6648

Cineplex Inc.Consolidated Balance Sheets (expressed in thousands of Canadian dollars)
December 31, December 31,2016 2015
Assets
Current assets
Cash and cash equivalents $ 33,553 $ 35,713
Trade and other receivables 115,903 121,398
Income taxes receivable 463 —
Inventories 21,412 19,691
Prepaid expenses and other current assets 10,856 10,025
182,187 186,827
Non-current assets
Property, equipment and leaseholds 564,879 533,192
Deferred income taxes 5,891 6,517
Fair value of interest rate swap agreements 756 —
Interests in joint ventures 35,487 35,288
Intangible assets 125,492 132,140
Goodwill 813,494 807,953
$ 1,728,186 $ 1,701,917

Cineplex Inc.Consolidated Balance Sheets … continued(expressed in thousands of Canadian dollars)
December 31, December 31,2016 2015
Liabilities
Current liabilitiesAccounts payable and accrued liabilities $ 204,725 $ 209,657Share-based compensation 8,958 9,742Dividends payable 8,575 8,238Income taxes payable 2,042 30,464Deferred revenue 172,140 159,568Current debt — 3,737Finance lease obligations 3,180 2,957Fair value of interest rate swap agreements 2,419 1,414
402,039 425,777
Non-current liabilitiesShare-based compensation 18,346 18,907Long-term debt 297,496 222,340Fair value of interest rate swap agreements 2,020 4,188Finance lease obligations 8,871 12,052Post-employment benefit obligations 7,932 7,296Other liabilities 125,560 131,874Deferred income taxes 11,210 6,283Convertible debentures 102,817 100,703
574,252 503,643
Total liabilities 976,291 929,420
Equity
Share capital 859,351 858,305Deficit (108,342) (86,296)Hedging reserves and other (3,170) (4,979)Contributed surplus 81 (491)Cumulative translation adjustment 1,175 934
Total equity attributable to owners of Cineplex 749,095 767,473
Non-controlling interests 2,800 5,024
Total equity 751,895 772,497$ 1,728,186 $ 1,701,917

Cineplex Inc.Consolidated Statements of Operations(expressed in thousands of Canadian dollars, except net income per share)
Three months ended December 31, Year ended December 31,
2016 2015 2016 2015
RevenuesBox office $ 177,516 $ 196,293 $ 712,446 $ 711,107Food service 105,535 113,799 423,920 418,445Media 52,720 55,258 170,792 153,646Other 49,665 42,022 171,168 87,745
385,436 407,372 1,478,326 1,370,943
ExpensesFilm cost 96,068 105,210 389,602 379,103Cost of food service 24,786 24,836 96,059 90,530Depreciation and amortization 28,254 24,526 105,941 89,339Loss on disposal of assets 168 899 1,570 3,236Gain on acquisition of business — (7,447) — (7,447)Other costs 198,067 192,378 759,930 655,389Share of income of joint ventures (626) (970) (2,706) (3,556)Interest expense 4,520 5,294 18,816 22,443Interest income (40) (52) (204) (186)Change in fair value of financial instrument — (29,076) — (29,076)
351,197 315,598 1,369,008 1,199,775
Income before income taxes 34,239 91,774 109,318 171,168
Provision for income taxesCurrent 8,378 15,190 26,231 37,026Deferred 2,533 (221) 5,096 (107)
10,911 14,969 31,327 36,919
Net income $ 23,328 $ 76,805 $ 77,991 $ 134,249
Attributable to:Owners of Cineplex $ 23,751 $ 77,172 $ 79,713 $ 134,697Non-controlling interests (423) (367) (1,722) (448)
Net income $ 23,328 $ 76,805 $ 77,991 $ 134,249
Basic net income per share attributable to owners ofCineplex $ 0.37 $ 1.22 $ 1.26 $ 2.13Diluted net income per share attributable to owners ofCineplex $ 0.37 $ 1.20 $ 1.25 $ 2.12

Cineplex Inc.Consolidated Statements of Comprehensive Income(expressed in thousands of Canadian dollars)
Three months ended December 31, Year ended December 31,
2016 2015 2016 2015
Net income $ 23,328 $ 76,805 $ 77,991 $ 134,249
Other comprehensive income (loss)Items that will be reclassified subsequently to net income:Income (loss) on hedging instruments 3,806 (189) 2,458 (2,163)Associated deferred income taxes (expense) recovery (1,020) 50 (649) 589Foreign currency translation adjustment 1,823 324 75 1,168Items that will not be reclassified to net income:Actuarial (losses) of post-employment benefit obligations (307) — (307) (24)Associated deferred income taxes recovery 82 — 82 6
Other comprehensive income (loss) 4,384 185 1,659 (424)
Comprehensive income $ 27,712 $ 76,990 $ 79,650 $ 133,825
Attributable to:Owners of Cineplex $ 54,428 $ 21,705 $ 81,538 $ 134,039Non-controlling interests (720) (81) (1,888) (214)
Comprehensive income $ 53,708 $ 21,624 $ 79,650 $ 133,825

Cineplex Inc.Consolidated Statements of Changes in Equity(expressed in thousands of Canadian dollars)For the years ended December 31, 2016 and 2015
Share capital
Contributedsurplus
Hedgingand other
reserves
Cumulativetranslationadjustment Deficit
Non-controlling
interests Total
Balance - January 1, 2016 $ 858,305 $ (491) $ (4,979) $ 934 $ (86,296) $ 5,024 $ 772,497
Net income — — — — 79,713 (1,722) 77,991Other comprehensive income — — 1,809 241 (225) (166) 1,659Total comprehensive income — — 1,809 241 79,488 (1,888) 79,650Dividends declared — — — — (101,534) — (101,534)Share option expense — 1,618 — — — — 1,618Issuance of shares on exercise of options 1,046 (1,046) — — — — —CSI non-controlling interests acquired — — — — — (336) (336)
Balance - December 31, 2016 $ 859,351 $ 81 $ (3,170) $ 1,175 $ (108,342) $ 2,800 $ 751,895
Balance - January 1, 2015 $ 854,073 $ 4,952 $ (3,405) $ — $ (123,771) $ — $ 731,849
Net income — — — — 134,697 (448) 134,249Other comprehensive (loss) — — (1,574) 934 (18) 234 (424)Total comprehensive income (1,574) 934 134,679 (214) 133,825Dividends declared — — — — (97,204) — (97,204)Share option expense — 1,694 — — — — 1,694Issuance of shares on exercise of options 4,232 (2,198) — — — — 2,034CSI non-controlling interests recognized onacquisition (note 2 c)
— — — — — 299 299WGN purchase obligation — (4,939) — — — — (4,939)WGN non-controlling interests recognized onacquisition — — — — — 4,939 4,939
Balance - December 31, 2015 $ 858,305 $ (491) $ (4,979) $ 934 $ (86,296) $ 5,024 $ 772,497

Cineplex Inc.Consolidated Statements of Cash Flows(expressed in thousands of Canadian dollars)
Three months ended December 31, Year ended December 31,2016 2015 2016 2015
Cash provided by (used in)Operating activitiesNet income $ 23,328 $ 76,805 $ 77,991 $ 134,249Adjustments to reconcile net income to net cash provided by operatingactivities
Depreciation and amortization of property, equipment and leaseholds, andintangible assets 28,254 24,526 105,941 89,339Amortization of tenant inducements, rent averaging liabilities and fairvalue lease contract liabilities (3,475) (1,882) (10,618) (7,832)Accretion of debt issuance costs and other non-cash interest, net 5 952 407 4,947Loss on disposal of assets 168 899 1,570 3,236Gain on acquisition of business — (7,447) — (7,447)Deferred income taxes 2,533 (221) 5,096 (107)Interest rate swap agreements - non-cash interest (528) 213 239 362Non-cash share-based compensation 381 428 1,618 1,694Change in fair value of financial instrument — (29,076) — (29,076)Accretion of convertible debentures 531 492 2,114 1,976Net change in interests in joint ventures (1,403) (2,636) (3,254) (4,860)
Tenant inducements 1,235 811 4,920 1,568Changes in operating assets and liabilities 80,385 92,482 (20,010) 42,545Net cash provided by operating activities 131,414 156,346 166,014 230,594
Investing activitiesProceeds from sale of assets — — 108 108Purchases of property, equipment and leaseholds (27,864) (23,094) (104,189) (95,979)Acquisition of businesses, net of cash acquired (31,675) (14,713) (32,082) (30,343)Intangible assets additions (1,321) (225) (1,931) (694)Net cash received from CDCP 684 680 3,054 1,843
Net cash (used in) investing activities (60,176) (37,352) (135,040) (125,065)
Financing activitiesDividends paid (25,715) (24,639) (101,197) (96,843)Borrowings under credit facilities, net (35,000) (84,932) 72,634 (6,932)Options exercised for cash — 2,034 — 2,034Payments under finance leases (760) (690) (2,957) (2,670)
Deferred financing fees — — (1,426) —
Net cash (used in) in financing activities (61,475) (108,227) (32,946) (104,411)
Effect of exchange rate differences on cash 105 151 (188) 228
Increase (decrease) in cash and cash equivalents 9,868 10,918 (2,160) 1,346
Cash and cash equivalents - Beginning of period 23,685 24,795 35,713 34,367
Cash and cash equivalents - End of period $ 33,553 $ 35,713 $ 33,553 $ 35,713
Supplemental informationCash paid for interest $ 2,745 $ 5,070 $ 13,584 $ 14,702Cash paid for income taxes, net $ 9,408 $ 2,784 $ 54,842 $ 16,458

Cineplex Inc.Consolidated Supplemental Information(Unaudited)(expressed in thousands of Canadian dollars)
Reconciliation to Adjusted EBITDA
Three months ended December 31, Year ended December 31,2016 2015 2016 2015
Net income $ 23,328 $ 76,805 $ 77,991 $ 134,249
Depreciation and amortization 28,254 24,526 105,941 89,339
Interest expense 4,520 5,294 18,816 22,443
Interest income (40) (52) (204) (186)
Current income tax expense 8,378 15,190 26,231 37,026
Deferred income tax expense (recovery) 2,533 (221) 5,096 (107)
EBITDA $ 66,973 $ 121,542 $ 233,871 $ 282,764
Change in fair value of financial instrument — (29,076) — (29,076)
Loss on disposal of assets 168 899 1,570 3,236
Gain on acquisition of business — (7,447) — (7,447)
CDCP equity income (i) (597) (952) (2,542) (1,672)
Non-controlling interests adjusted EBITDA of WGN and BSL 276 131 1,022 165
Depreciation and amortization - joint ventures (ii) 10 24 39 1,563
Joint venture taxes and interest (ii) 11 42 49 269
Adjusted EBITDA $ 66,841 $ 85,163 $ 234,009 $ 249,802
(i) CDCP equity income not included in adjusted EBITDA as CDCP is a limited-life financing vehicle that is funded by virtual print feescollected from distributors.
(ii) Includes the joint ventures with the exception of CDCP (see (i) above).

Cineplex Inc.Consolidated Supplemental Information(Unaudited)(expressed in thousands of Canadian dollars, except number of shares and per share data)
Adjusted Free Cash Flow
Three months ended December 31, Year ended December 31,2016 2015 2016 2015
Cash provided by operating activities $ 131,414 $ 156,346 $ 166,014 $ 230,594Less: Total capital expenditures net of proceeds on sale of assets (27,864) (23,094) (104,081) (95,871)
Standardized free cash flow 103,550 133,252 61,933 134,723
Add/(Less):Changes in operating assets and liabilities (i) (80,385) (92,482) 20,010 (42,545)Changes in operating assets and liabilities of joint ventures (i) 777 1,666 548 1,304Tenant inducements (ii) (1,235) (811) (4,920) (1,568)Principal component of finance lease obligations (760) (690) (2,957) (2,670)Growth capital expenditures and other (iii) 16,480 11,041 76,918 62,252Share of income of joint ventures, net of non-cash depreciation (iv) 50 84 252 3,716Non-controlling interest adjusted EBITDA of WGN and BSL 276 131 1,022 165 Net cash received from CDCP (iv) 684 680 3,054 1,843Adjusted free cash flow $ 39,437 $ 52,871 $ 155,860 $ 157,220
Average number of Shares outstanding 63,495,944 63,204,838 63,451,257 63,100,085
Adjusted free cash flow per Share $ 0.621 $ 0.837 $ 2.456 $ 2.492Dividends declared $ 0.405 $ 0.390 $ 1.600 $ 1.540
(i) Changes in operating assets and liabilities are not considered a source or use of adjusted free cash flow.(ii) Tenant inducements received are for the purpose of funding new theatre capital expenditures and are not considered a source of
adjusted free cash flow.(iii) Growth capital expenditures and other represent expenditures on Board approved projects, exclude maintenance capital
expenditures, and are net of proceeds on asset sales. Cineplex’s revolving facility is available to fund Board approved projects. (iv) Excludes the share of income of CDCP, as CDCP is a limited-life financing vehicle funded by virtual print fees collected from
distributors. Cash invested into CDCP, as well as cash distributions received from CDCP, are considered to be uses and sources ofadjusted free cash flow.