christopher p. liddell
TRANSCRIPT

Morgan Stanley Basic Materials Conference
February 24, 2005
Christopher P. LiddellSenior VP & CFOChristopher P. LiddellSenior VP & CFO

2
Forward Looking Statements
Statements on these slides or in this presentation that are not historical are forward-looking. These statements are subject to risks and uncertainties that could cause actual results to differ materially, including but not limited to, the strength of demand for the company’s products and changes in overall demand, the effects of competition from foreign and domestic producers, the level of housing starts, changes in the cost or availability of raw materials, unanticipated expenditures related to the cost of compliance with environmental and other governmental regulations, the ability of the company to continue to realize anticipated cost savings, performance of the company’s manufacturing operations, results of legal proceedings, changes related to international economic conditions and changes in currency exchange rates, particularly the relative value of the U.S. dollar to the Euro, economic conditions, specifically Brazil and Russia, the current military action in Iraq and the war on terrorism. We undertake no obligation to publicly update any forward-looking statements, whether as a result of new information, future events or otherwise. These and other factors that could cause or contribute to actual results differing materially from such forward looking statements are discussed in greater detail in the company's Securities and Exchange Commission filings

3
Statements Relating toNon-GAAP Financial Measures
During the course of this presentation, certain non-U.S. GAAP financial information will be presented. A reconciliation of those numbers to U.S. GAAP financial measures is available on the company’s website at www.internationalpaper.com under Investor Information

4
Agenda
International Paper Profile
Financial Performance
Driving Shareowner Value• Improving Our Business Profitability
• Making Portfolio Choices
• Maintaining Financial Discipline

5
International Paper Profile
Global paper and forest products company
80,000 employees worldwide
Focused on three core businesses
$26 billion in revenues
Operations in over 40 countries and selling products in more than 120 nations

6
Focus on Three Core BusinessesPaper
51% of 2004 Revenue
Paper
Number one uncoated papers position globally Largest coated paper producer in North Americaxpedx is the largest merchant distributor in the U.S.
Number one uncoated papers position globally Largest coated paper producer in North Americaxpedx is the largest merchant distributor in the U.S.

7
Focus on Three Core BusinessesPackaging
28% of 2004 Revenue
Packaging
Largest bleached board producer globallyNumber three containerboard position globallyStrong corrugated box businesses in U.S. and Europe
Largest bleached board producer globallyNumber three containerboard position globallyStrong corrugated box businesses in U.S. and Europe

8
Focus on Three Core BusinessesForest Products
17% of 2004 Revenue
ForestProducts
Number two largest private landowner in U.S.Significant lumber and plywood producer in U.S.Number two largest private landowner in U.S.Significant lumber and plywood producer in U.S.

9
U.S. forestlandsForest Products
0
2
4
6
8
10
12
14
1994 1996 1998 2000 2002 2004
Union Camp & Champion acquisitions
Acres (million)
6.1 6.1 6.4 6.3 5.97.1
12.110.4
9.08.3
6.8

10
Forest Products U.S. forestlands ownership by region
Northeast
Great Lakes
South
Total
Acreage0.3 MM
0.5 MM
6.0 MM
6.8 MM
Note: As of December 31, 2004

11
Forest Products Facilities fiber sourcing
Fiber drain basins surrounding IP’s paper millsin Louisiana, Mississippi, Texas and Arkansas

12
40%
SoftwoodFiber
Forest Products U.S. fiber self-sufficiency
30%
9%
HardwoodFiber
Total Fiber
IP supplied 30% of the 64 million tons of fiber
it consumed in 2004
3rd Party Fiber Purchases Fiber Self-Sufficiency

13
Financial Performance
14
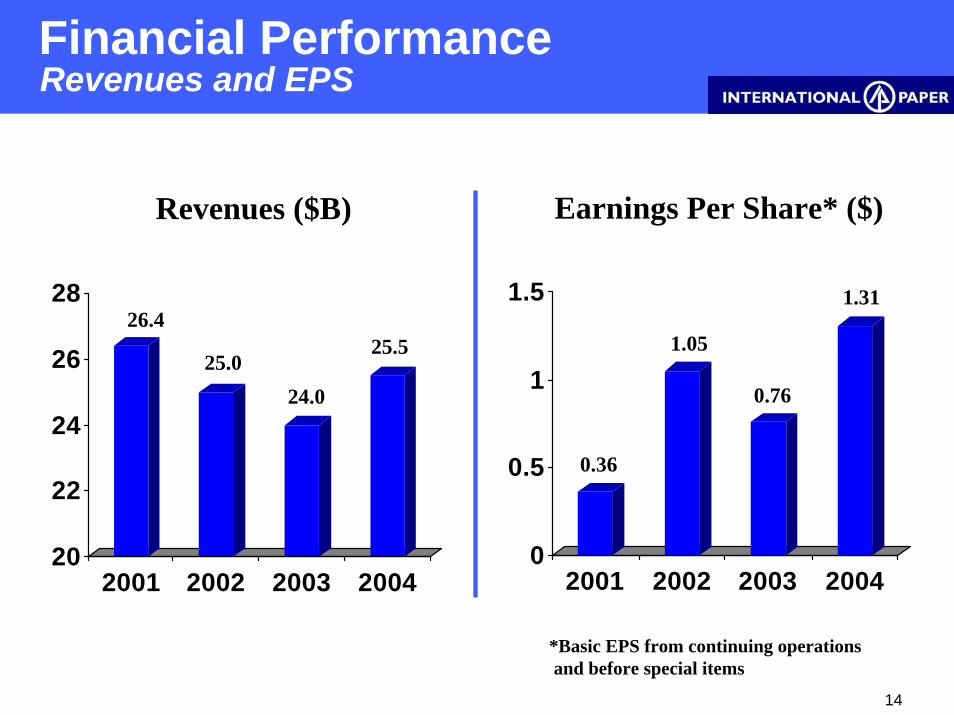
Financial Performance Revenues and EPS
20
22
24
26
28
2001 2002 2003 200420
22
24
26
28
2001 2002 2003 20040
0.5
1
1.5
2001 2002 2003 20040
0.5
1
1.5
2001 2002 2003 2004
26.4
25.024.0
25.5
0.36
1.05
0.76
1.31
Earnings Per Share* ($)Revenues ($B)
*Basic EPS from continuing operationsand before special items

15
$0.00
$0.30
$0.60
$0.90
$1.20
$1.50
$1.80
2003 Price Volume Cost/Mix RawMaterial
LandSales
Tax Rate Other 2004
Financial Performance
($.14)
EPS $ / Share
$.76
$.40
($.29)
Wood Costs ($0.10)Energy ($0.10)Other ($0.09)
Paper ($0.06) Packaging $0.06Wood Prod $0.28 Other $0.03
2004 EPS from cont. ops before special items
$.31
$1.31($.07)
$.32
Int. Expense $0.15 Corporate ($0.04)Other ($0.09)
2003 Tax Rate 20%2004 Tax Rate 26%
$.02

16
Financial Performance
($.14)
EPS $ / Share
$.76
$.40
($.29)
Wood Costs ($0.10)Energy ($0.10)Other ($0.09)
Paper ($0.06) Packaging $0.06Wood Prod $0.28 Other $0.03
2004 EPS from cont. ops before special items
$.31
$1.31($.07)
$.32
Int. Expense $0.15 Corporate ($0.04)Other ($0.09)
2003 Tax Rate 20%2004 Tax Rate 26%
$.02
$0.00
$0.30
$0.60
$0.90
$1.20
$1.50
$1.80
2003 Price Volume Cost/Mix RawMaterial
LandSales
Tax Rate Other 2004

17
-150
-100
-50
0
50
100
150
200
250
IndustrialPackagin
UncoatedPaper
Coated Paper
ConsumerPackaging
Pulp EuropeanPapers
WoodProducts
-150
-100
-50
0
50
100
150
200
250
IndustrialPackagin
UncoatedPaper
Coated Paper
ConsumerPackaging
Pulp EuropeanPapers
WoodProducts
Price impact by gradeFinancial Performance
EBIT ($MM)
210
150
90
30
At December run rate, EBIT generated from these key grades for a full year would
be $335 million higher than 2004 total
(5) (20)
(120)

18
Financial Performance
Demand environment is positive
2005 Demand environment
Product Demand drivers OutlookYWhite collar employmentUncoated papersG
Coated papers
Corrugated boxes
Lumber & plywood
Advertising pages
GDP (mfg. growth)
Catalog mailings
Non-durables production
Housing startsInterest rates
G
G
G
G
Y
Y
Direct mail

19
Financial Performance
($.14)
EPS $ / Share
$.76
$.40
($.29)
Wood Costs ($0.10)Energy ($0.10)Other ($0.09)
Paper ($0.06) Packaging $0.06Wood Prod $0.28 Other $0.03
2004 EPS from cont. ops before special items
$.31
$1.31($.07)
$.32
Int. Expense $0.15 Corporate ($0.04)Other ($0.09)
2003 Tax Rate 20%2004 Tax Rate 26%
$.02
$0.00
$0.30
$0.60
$0.90
$1.20
$1.50
$1.80
2003 Price Volume Cost/Mix RawMaterial
LandSales
Tax Rate Other 2004

20
Financial Performance
Cost environment remains challenging
2005 Cost environment
Wet weather
Cost drivers
Low inventory
Caustic soda
Natural gas, oil
Polyethylene
Pension expenseSupply chain spending
Wood
Cost Component
Chemicals
Y
R
Y
R
R
Outlook
Energy
RCorporateR

21
Driving Shareowner Value

22
Senior Management Compensation
Driven by results and aligned with shareowners
Aligned with shareowners
15%20%
Base Pay
65%
Long Term CompensationLong Term Compensation
• 100% external benchmark based
• 50% TSR vs. industrial peer group
• 50% ROI vs. global industry peer group
• 100% external benchmark based
• 50% TSR vs. industrial peer group
• 50% ROI vs. global industry peer group
Short Term Incentive PlanShort Term Incentive Plan• 50% ROI vs. global industry peer group
• 30% ROI vs. plan
• 20% performance drivers vs. plan
• 50% ROI vs. global industry peer group
• 30% ROI vs. plan
• 20% performance drivers vs. plan

23
Manufacturing Excellence Supply Chain Lower S&A/Other
SegmentingSolutionsNew Products
Targeted SegmentsMarket Recovery
Lower Costs& Create
Efficiencies
Lower Costs& Create
Efficiencies
Improve MixImprove Mix
Grow VolumesGrow Volumes
$1.6B
$0.7
($0.8)Higher Costs/Inflation
Target
Improving Our Businesses Non-price improvement
Gross Improvement $2.3
$1.5BNon-Price Improvement After Inflation
24
75%
80%
85%
2001 2002 2003 2004
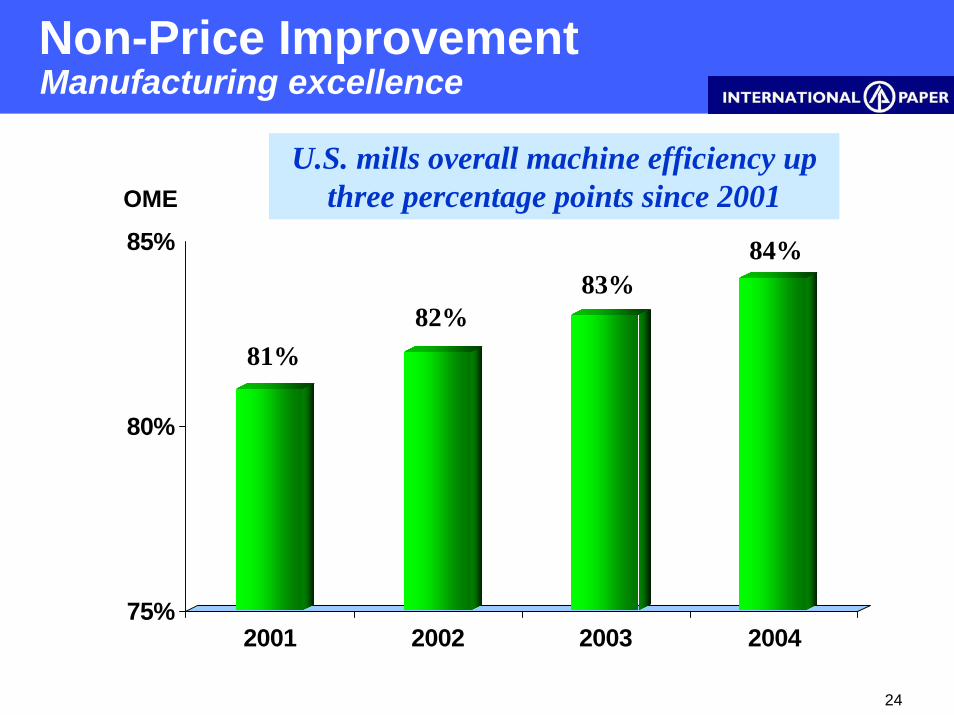
OMEU.S. mills overall machine efficiency up
three percentage points since 2001
Manufacturing excellenceNon-Price Improvement
81%82%
83%84%
25
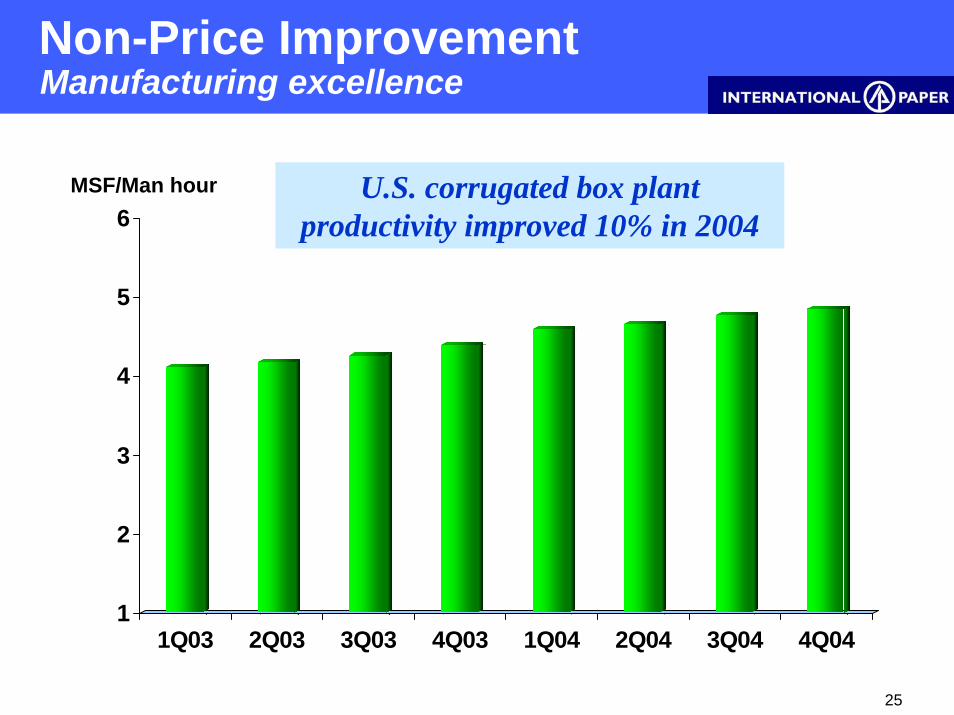
Manufacturing excellenceNon-Price Improvement
1
2
3
4
5
6
1Q03 2Q03 3Q03 4Q03 1Q04 2Q04 3Q04 4Q041
2
3
4
5
6
1Q03 2Q03 3Q03 4Q03 1Q04 2Q04 3Q04 4Q04
MSF/Man hour U.S. corrugated box plant productivity improved 10% in 2004

26
Supply chainNon-Price Improvement
Supply Chain Objectives
• Redefine how IP does business
• Improve customer service/win new business/grow revenue
• Reduce transportation, warehousing and procurement costs
• Implement common, standard “best practice”business processes
• Redefine how IP does business
• Improve customer service/win new business/grow revenue
• Reduce transportation, warehousing and procurement costs
• Implement common, standard “best practice”business processes

27
Supply chain project timelineNon-Price Improvement
2008200820042004 20052005 2009200920062006 20072007
IPG MillsIPG Mills Build / TestBuild / Test DeployDeploy
CPG MillsCPG Mills DeployDeployDesign / Build / TestDesign / Build / Test
IPG ConvertingIPG Converting Deploy Phase 2Deploy Phase 2Design / Build / Test / Phase 1Design / Build / Test / Phase 1
C&SCC&SC DeployDeployDesign / Build / TestDesign / Build / Test
P&CPP&CP DeployDeployDesign / Build / TestDesign / Build / Test
Fiber SupplyFiber Supply Design / Build / TestDesign / Build / Test DeployDeploy
CPG ConvertingCPG Converting DeployDeployDesign / Build / TestDesign / Build / Test
FPGFPG DeployDeployDesign / Build / TestDesign / Build / Test

28
Order Management
5%
Demand & Supply Planning
10%
Scheduling10%
Transportation & Warehousing
35%
Procurement 40%
Non-Price Improvement
Total annual gross benefit = $500 million
Supply chain benefits by category

29
Supply chainNon-Price Improvement
Supply Chain Objectives
• Redefine how IP does business
• Improve customer service/win new business/grow revenue
• Reduce transportation, warehousing and procurement costs
• Implement common, standard “best practice” business processes
• Redefine how IP does business
• Improve customer service/win new business/grow revenue
• Reduce transportation, warehousing and procurement costs
• Implement common, standard “best practice” business processes
30
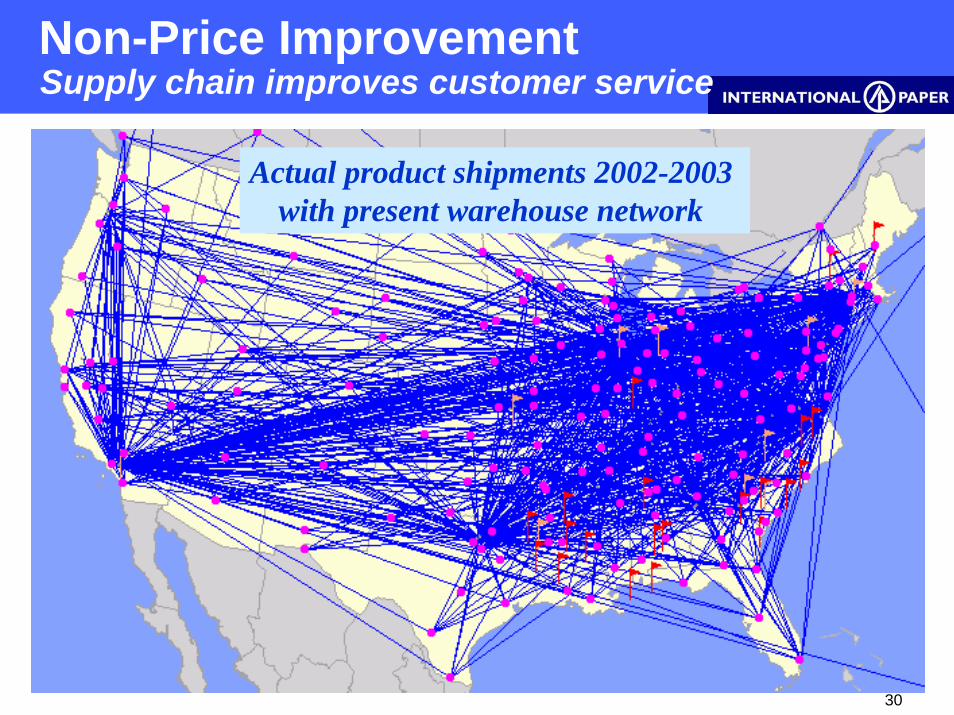
Actual product shipments 2002-2003 with present warehouse network
Non-Price ImprovementSupply chain improves customer service

31
Projected product shipments in 2006 following warehouse network optimization
Non-Price ImprovementSupply chain improves customer service

32
Value-added and mill branded cut-size have a significantly higher growth rate
and better margin than private label cut-size
0
2
4
6
8
10
Growth Rate Margin
Value-added Mill branded Private label
Private labelcut-size = 1.0
VolumeGrowth
% Margin Index
1.0
2.0
0.0
1.5
0.5
2.5
Non-Price ImprovementImprove mix

33
Segments Grades
Non-Price ImprovementGrow volume
Annual Volume Change‘04 vs. ‘03
Paper* 3%Uncoated Papers
5%Coated Papers
6%Pulp
Packaging 7%Containerboard
21%U.S. Container
11%Bleached Board
Forest Products 5%LumberPlywood (1%)
* U.S. operations only

34
0.0
1.0
2.0
3.0
2002 2003 20040.0
1.0
2.0
3.0
2002 2003 2004IP Legacy Operations Former Box USA Operations
Million tonsBox shipments grew 9% in 2004
due to customer and segment targeting
Grow Volume U.S. corrugated box business
+21% +9%+7%

35
(100)
(75)
(50)
(25)
0
(100)
(75)
(50)
(25)
0
Non-Price ImprovementHigher cost/inflation
EBIT ($)
(35) (35)(30)
(70)
(20)
Raw material costs negatively impact EBIT by $190 million 2004 versus 2003
Wood Chemicals/Other
Oil/Coal/Electricity
Natural Gas
Polyethylene

36
-1.5
-1
-0.5
0
0.5
1
1.5
2
-1.5
-1
-0.5
0
0.5
1
1.5
2
Non-Price Improvement Actual results versus target through 2004
1.10.8
0.50.3
1.5
1.1
(0.9)
(0.5)
1.0
0.2
$B
Cost Reduction
Improve Mix/ Grow Volume
Gross Improvement
Higher Costs/ Inflation
Net Improvement
Higher costs/inflation higher than projected
Actual Results 2003/2004NPI Target

37
Making Portfolio Choices
Proceeds ($MM)
640
60
1,100
TBD
250
TBD
TBD
Sold CHH Tissue (Cash to IP $150MM)
Sold minor W. European assets
Sold Weldwood of Canada
Sold 1.1 million acres in Maine/NH
Exploring sale of Specialty Papers
Selling Fine Papers (Project 1Q’05 close)
CHH exploring options for Forestlands
Sold CHH Tissue (Cash to IP $150MM)
Sold minor W. European assets
Sold Weldwood of Canada
Sold 1.1 million acres in Maine/NH
Exploring sale of Specialty Papers
Selling Fine Papers (Project 1Q’05 close)
CHH exploring options for Forestlands

38
Maintaining Financial Discipline
Optimize capital allocation
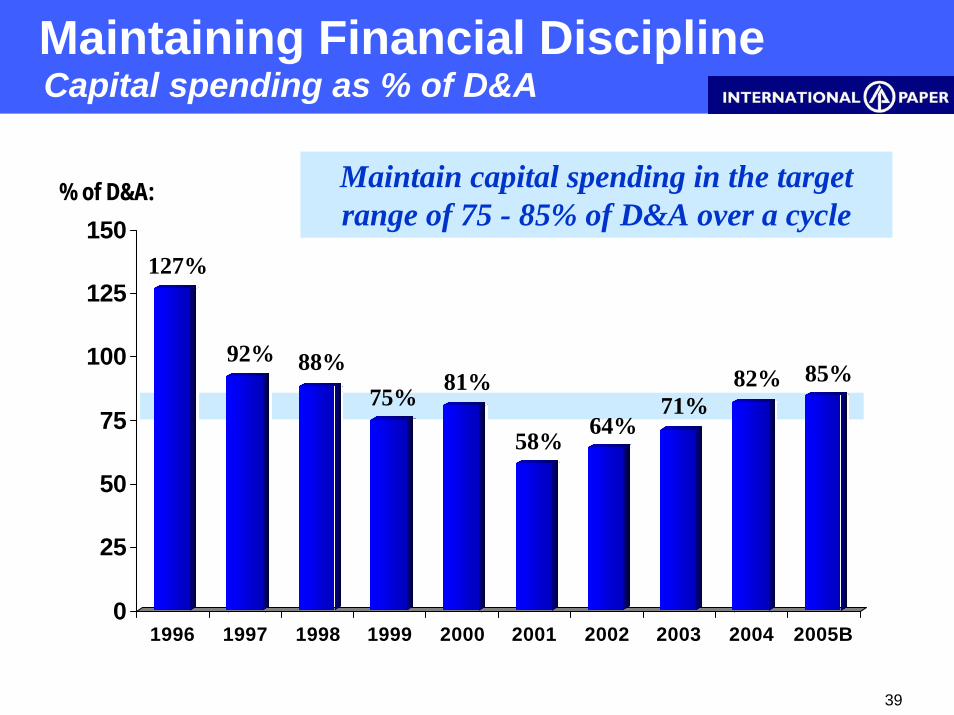
Maintain capex within range of 75-85% of depreciation over a cycle
Allocate capital to those businesses with best returns in North America & globally
39
Maintaining Financial DisciplineCapital spending as % of D&A
0
25
50
75
100
125
150
1996 1997 1998 1999 2000 2001 2002 2003 2004 2005B0
25
50
75
100
125
150
1996 1997 1998 1999 2000 2001 2002 2003 2004 2005B
% of D&A: Maintain capital spending in the target range of 75 - 85% of D&A over a cycle
127%
92% 88%75% 81%
58% 64%71%
82% 85%
40
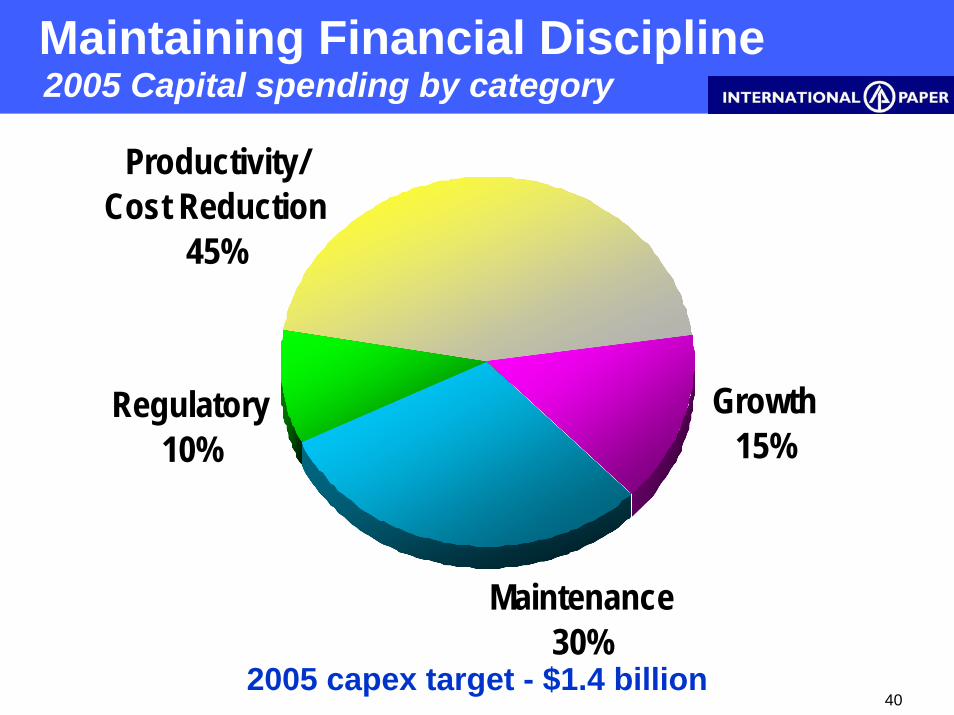
Maintenance30%
Regulatory10%
Growth15%
Productivity/Cost Reduction
45%
Maintaining Financial Discipline2005 Capital spending by category
2005 capex target - $1.4 billion

41
Maintaining Financial Discipline 2005 Capex by business
0
100
200
300
400
0
100
200
300
400% of D&A:
295%
385%
80%85%65%
90%70%
Brazil EasternEurope
ForestProducts
TotalIP
IndustrialPackaging
UncoatedPapers
ConsumerPackaging
Capital allocated in excess of D&A to Brazil and E. Europe

42
0
20
40
60
80
100
0
20
40
60
80
100
SalesRevenue
CapitalEmployed
EBIT
North America Non-North America
Financial Performance2004 Results by geographic region
% of Total
25%20%40%

43
Maintaining Financial Discipline
Committed to maintaining investment grade ratings
Targeted $3 billion reduction to $12 billion debt gross level by 2006
Reducing debt

44
Maintaining Financial DisciplineReduced debt with asset sale proceeds
Cash received (on 12/31/04)
• Weldwood sale
• Maine/NH land sale
Total
Debt Paydown
• Short-term debt/Other (pre 12/31/04)
• Trust Preferred (post 12/31/04)
• Open Market/Other (post 12/31/04)
Total
Cash received (on 12/31/04)
• Weldwood sale
• Maine/NH land sale
Total
Debt Paydown
• Short-term debt/Other (pre 12/31/04)
• Trust Preferred (post 12/31/04)
• Open Market/Other (post 12/31/04)
Total
$1.1
0.2$1.3
$(0.5)
(0.5)
(0.3)
$(1.3)

45
Maintaining Financial Discipline
Further debt reduction
Return to shareowners• Increase dividend
• Share repurchase
Reinvest in high return businesses
Options for free cash flow

46
IP into the Future
Committed to Increasing Shareowner Value
Improving Our Business Profitability
Making Portfolio Choices
Maintaining Financial Discipline

47

48
AppendixAppendix

49
Financial PerformanceU.S. pension plans
-20
-10
0
10
20
30
2000 2001 2002 2003 2004-20
-10
0
10
20
30
2000 2001 2002 2003 2004-300
-200
-100
0
100
200
2000 2001 2002 2003 2004 2005E-300
-200
-100
0
100
200
2000 2001 2002 2003 2004 2005E
Actual Rates of Return Income (Expense)*Percent $ Millions
(1.4) (2.4)(6.7)
26.0
14.1101
141
75
(60)(110)
(210)
*Pension income (expense) reflects discount rate, service cost, amortization of previous periods and anticipated return