chlor-alkali sector november, 2019 - amazon s3 · chlor-alkali industry is one of the largest...
TRANSCRIPT

CHLOR-ALKALI SECTOR
VIS Credit Rating Company Limited
November, 2019
SECTOR UPDATE
2
VIS Credit Rating Company Limited
Chlor-alkali industry is one of the largest electrochemical industry, the main products chlorine and caustic soda are imperative intermediates in chemical and allied industries.

VIS Credit Rating Company Limited
3

4
VIS Credit Rating Company Limited

VIS Credit Rating Company Limited
5

6
VIS Credit Rating Company Limited
7
VIS Credit Rating Company Limited

VIS Credit Rating Company Limited
8

VIS Credit Rating Company Limited
9
10
VIS Credit Rating Company Limited
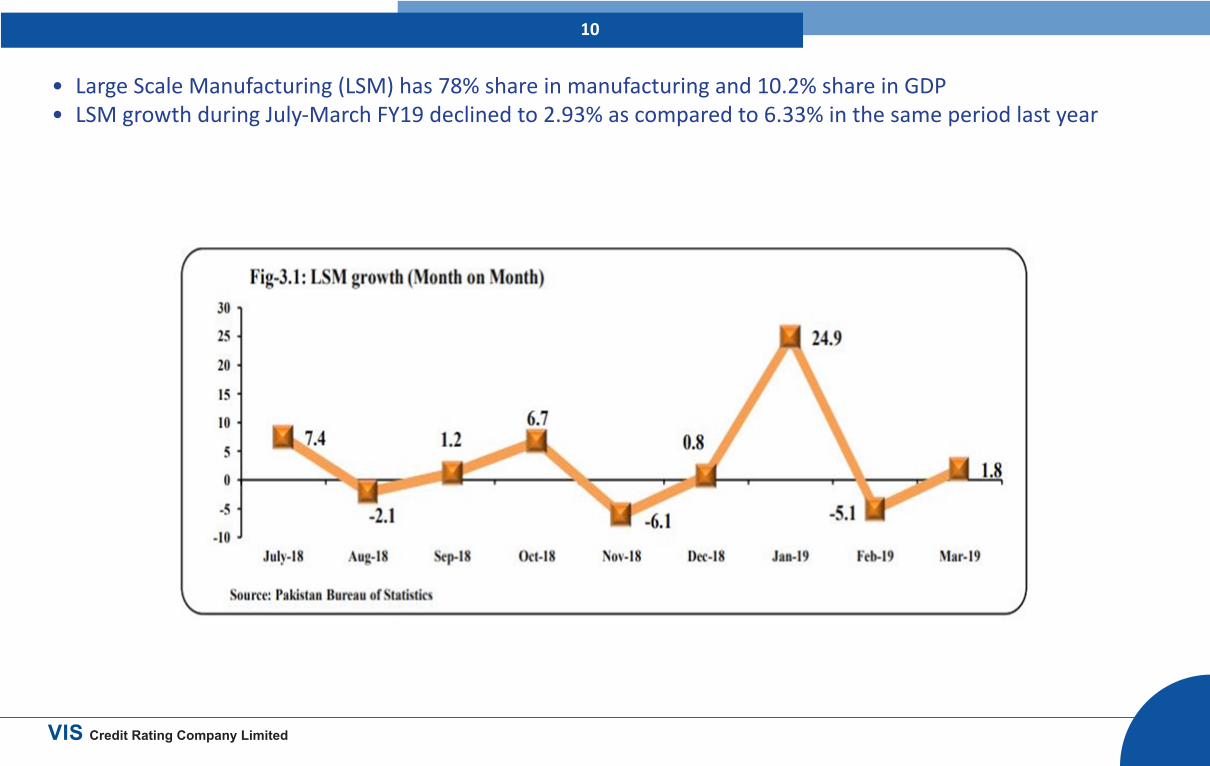
• Large Scale Manufacturing (LSM) has 78% share in manufacturing and 10.2% share in GDP• LSM growth during July-March FY19 declined to 2.93% as compared to 6.33% in the same period last year

11
VIS Credit Rating Company Limited
• Contribution of Chemicals in the LSM during the period ending July-March FY19 vis-à-vis July-March FY18 witnessed a decline of 3.94%.
S# Groups Weights% Change
July-March2017-18 2018-19
1 Textile 20.915 0.54 -0.30
2 Food, Beverages & Tobacco 12.370 -0.76 -4.69
3 Coke & Petroleum Products 5.514 12.31 -6.00
4 Pharmaceuticals 3.620 4.50 -8.405 Chemicals 1.717 0.86 -3.946 Automobiles 4.613 18.90 -7.587 Iron & Steel Products 5.392 27.49 -11.008 Fertilizers 4.441 -8.30 4.509 Electronics 1.963 73.77 23.7010 Leather Products 0.859 -6.83 0.9711 Paper & Board 2.314 9.00 -3.8612 Engineering Products 0.400 8.35 9.5413 Rubber Products 0.262 6.51 3.47
14 Non-Metallic Mineral Products 5.364 12.32 -4.96
15 Wood Products 0.588 -19.71 15.21Source: Pakistan Bureau Statistics

12
VIS Credit Rating Company Limited
• The demand for caustic soda is highly dependent on the growth of the manufacturing sector, particularly textile sector
Source: World Trade Organization

13
VIS Credit Rating Company Limited
• Caustic soda production has increased over the years
Source: Pakistan Bureau of Statistics
14
VIS Credit Rating Company Limited
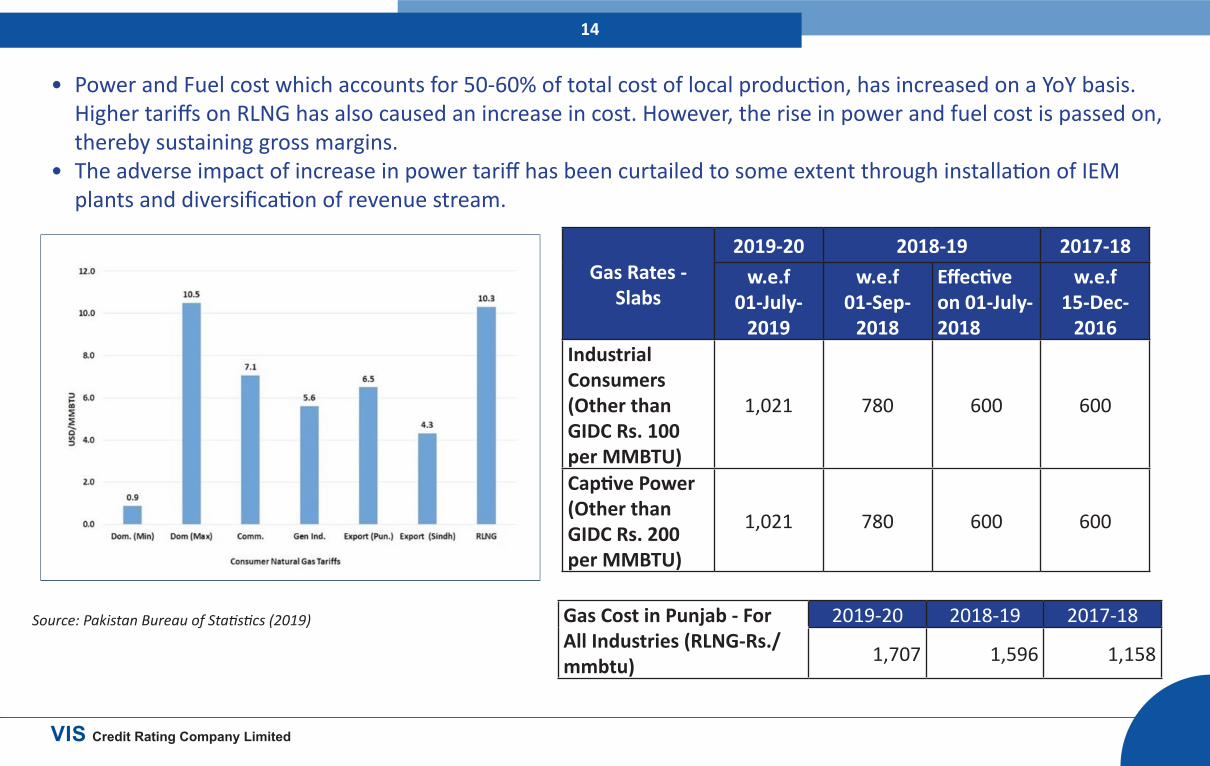
• Power and Fuel cost which accounts for 50-60% of total cost of local production, has increased on a YoY basis. Higher tariffs on RLNG has also caused an increase in cost. However, the rise in power and fuel cost is passed on, thereby sustaining gross margins.
• The adverse impact of increase in power tariff has been curtailed to some extent through installation of IEM plants and diversification of revenue stream.
Gas Rates - Slabs
2019-20 2018-19 2017-18w.e.f
01-July-2019
w.e.f01-Sep-
2018
Effective on 01-July-2018
w.e.f15-Dec-
2016Industrial Consumers (Other than GIDC Rs. 100 per MMBTU)
1,021 780 600 600
Captive Power (Other than GIDC Rs. 200 per MMBTU)
1,021 780 600 600
Source: Pakistan Bureau of Statistics (2019) Gas Cost in Punjab - For All Industries (RLNG-Rs./mmbtu)
2019-20 2018-19 2017-18
1,707 1,596 1,158

15
VIS Credit Rating Company Limited

16
VIS Credit Rating Company Limited
Description Sitara Chemical Industries Limited Ittehad Chemical Industries Limited
Engro Polymer & Chemicals Limited
Capacity in Tonnes Capacity Production Capacity Production Capacity Production
At end-FY19 At end-FY19 At end-FY19 At end-FY19 At end-CY18 At end-CY18Caustic Soda 202,950 145,122 180,000 101,135 106,000 104,940Sodium Hypochlorite 66,000 42,514 49,500 23,652 20,000 N-A
Liquid Chlorine 11,550 9,772 13,200 8,866 94,000 N-AHydrochloric Acid 363,000 317,961 200,000 200,000 60,000 N-A
Capacities

17
VIS Credit Rating Company Limited
Financial RiskProfitabilityRs. in millions FY18 FY19 FY18 FY19 FY18 FY19
Company SCIL ICL EPCL
Company Ratings A+/A-1 A+/A-1 A-/A-2 A-/A-2 - AA-/A-1+
Net Sales 12,265 12,698 5,743 6,644 27,731 35,272
Gross Profit 2,633 2,760 963 1,379 6,065 8,736
Gross Margin(%) 21.5 21.7 16.8 20.8 21.9 24.8
Net Profit 1,086 885 415 405 2,049 4,917Net Profit Margin(%) 8.9 7.0 7.2 6.1 7.4 13.9

18
VIS Credit Rating Company Limited
Rs. in millions FY18 FY19 FY18 FY19 FY18 FY19Company SCIL ICL EPCLCompany Ratings A+/A-1 A+/A-1 A-/A-2 A-/A-2 - AA-/A-1+FFO 1,799 1,738 669 946 5,212 8,820ST Debt 3,525 4,333 1,176 1,380 0 0LT Debt 2,020 2,776 1,382 1,986 8,750 7,500Total Debt 5,545 7,109 2,558 3,366 8,750 7,500Cash 80 102 94 110 680 1,359FFO to Total Debt (x) 0.3 0.2 0.3 0.3 0.6 1.2FFO to LT debt (x) 0.9 0.6 0.5 0.5 0.6 1.2Leverage 1.0 1.2 1.5 1.8 1.1 0.5Gearing 0.6 0.7 0.9 1.1 1.1 0.5DSCR 1.6 1.7 1.2 1.6 5.7 7.1Total Equity 10,637 14,619 3,710 4,004 7,720 16,743Trade Debt 1,138 1,177 524 665 505 430
Liquidity and Capitalization
Analysts Contacts Tayyaba Ijaz Assistant Manager [email protected]