china's capital controls and interest rate parity: …€™s capital controls and interest...
TRANSCRIPT

China’s Capital Controls and Interest Rate Parity: Experience during 1999 – 2010 and Future Agenda for Reforms Ichiro Otani* [email protected] Tomoyuki Fukumoto** [email protected] Yosuke Tsuyuguchi*** [email protected]
No.11-E-8 August 2011
Bank of Japan 2-1-1 Nihonbashi-Hongokucho, Chuo-ku, Tokyo 103-0021, Japan
* Economic Policy Consultant, Potomac, MD ** International Department, Bank of Japan
*** Shinkin Central Bank (Bank of Japan when the paper was drafted)
Papers in the Bank of Japan Working Paper Series are circulated in order to stimulate discussion and comments. Views expressed are those of authors and do not necessarily reflect those of the Bank. If you have any comment or question on the working paper series, please contact each author.
When making a copy or reproduction of the content for commercial purposes, please contact the Public Relations Department ([email protected]) at the Bank in advance to request permission. When making a copy or reproduction, the source, Bank of Japan Working Paper Series, should explicitly be credited.
Bank of Japan Working Paper Series

China’s Capital Controls and Interest Rate Parity:
Experience during 1999 – 2010 and Future Agenda for Reforms
Ichiro Otani *
Tomoyuki Fukumoto **
Yosuke Tsuyuguchi ***
Abstract
This paper reviews the evolution of China’s capital controls over the past decade, estimates their strength, assesses their effectiveness in influencing capital flows at a macro level, and draws policy implications for the financial market reforms in the coming years. While capital controls drove a wedge between the domestic market and the market abroad, capital flows in both directions have been rapidly increasing. This implies that, in order to deal with increasing volume of capital flows in the coming years, it is important for the authorities to keep improving the infrastructure for monitoring and assessing capital flows.
Key Words: Capital controls, Interest Rate Parity, Financial Market Reform
JEL Classification: F31, F36
August 2011
Views expressed here are those of the author and do not necessarily reflect the official views of the Bank of Japan. We thank Takeshi Kimura and Kenichiro Watanabe for their useful comments during the workshop held at the Bank of Japan in September 2010. Thanks are also due to Roberto Piazza of the IMF and Yoshiaki Azuma of the Bank of Japan for their useful comments. * Economic Policy Consultant, Potomac, MD ** International Department, Bank of Japan *** Shinkin Central Bank (Bank of Japan when the paper was drafted)
1

I. Introduction
Many industrial countries pursued expansionary fiscal and monetary policies in
the past several years in search of a way out of the most sever recession in the post-World
War II period. As a result, expansionary monetary policies adopted by many of these
countries in the recent past manifested themselves in the rapid expansion of liquidity. This in
turn led to significant increases in capital flows from these countries to many emerging
markets, including those in the Asian region, and contributed to the emergence of upward
pressures on their exchange rates and inflation, complicating the conduct of macroeconomic
policies. 1
Against this background, the efficacy of imposing capital controls has been
actively discussed by policy makers, business communities, and academic circles in recent
years, particularly following the publication of a paper by Ostry, etc (2010) in early 2010. In
the paper, the authors advocated the use of controls in countries facing rapid capital inflows
under certain conditions. 2
In China, as in many other emerging countries such as Malaysia and Thailand, the
use of controls has been in place for its international capital transactions over the years. In
some years, such controls have been used to induce inflows, while, in other years, they have
been used to induce outflows. Intentions of the Chinese authorities were often identified by
interpreting rules and regulations concerning the controls that they put in place, or removed or
modified. However, it is rather difficult to measure the strength of such controls. Therefore,
1 According to IMF (2011), net capital inflows to emerging economies are currently running at a rate of 4 percent of GDP, compared with that of only about 1 percent in 2008. 2 The paper states that, “if the economy is operating near potential, if the level of reserves is adequate, if the exchange rate is not undervalued, and if the flows are likely to be transitory, then use of capital controls—in addition to both prudential and macroeconomic policy—is justified…” (page 5).
2

it is worthwhile to make a further attempt to quantify the overall strength of capital controls
and their impact on capital flows at macroeconomic levels.3 While it is not easy to quantify
the impact of capital controls on economic activities such as growth or capital flows, it is still
worth an effort to re-examine the efficacy of these measures in influencing capital flows.
This paper represents such an effort in the case of China’s experiences during the past decade
by first estimating the strength of capital controls and then measuring its impact on capital
flows. 4
The rest of the paper is organized as follows. Section II presents the evolution of
major capital control and liberalization actions from late 1990s through 2010, focusing on
important changes that the authorities introduced in rules and regulations regarding capital
flows and on the intention of the authorities. Section III discusses the methodology used to
quantify the strength of capital controls by making use of the interest rate parity theory. It
will be shown that the strength of capital controls can be measured by the size of transaction
costs as they reflect the impact of capital controls on financial transactions. 5 Section IV
examines the strength of capital controls on transactions within Mainland China and that of
controls on China’s cross-border transactions and compares these measures with the measure
for Hong Kong, which is often regarded as having one of the most open international
financial centers in the world. Section V draws implications for reforming China’s financial
market, particularly the international capital market, in the coming years. Section VI
3 A number of attempts have been made in this regard by many researchers in the past, but the interpretation of their results was made difficult by the way in which the indicators of capital controls were constructed. Some of these indicators were based on ad hoc weights given to particular types of capital control measures or the use of binary relation associated to the presence or absence of particular control measures that existed at the end of a particular year. Critical assessments of these indicators are summarized in Edwards, ed. (2007) and IMF (2011). 4 Cline (2010) has an excellent summary of reasons for the difficulty in quantifying the impact of the openness of the financial market on economic activities. 5 The greater the strength of capital control is, the higher the transaction cost. The higher the cost of transactions, the less capital flows, with other things being unchanged.
3

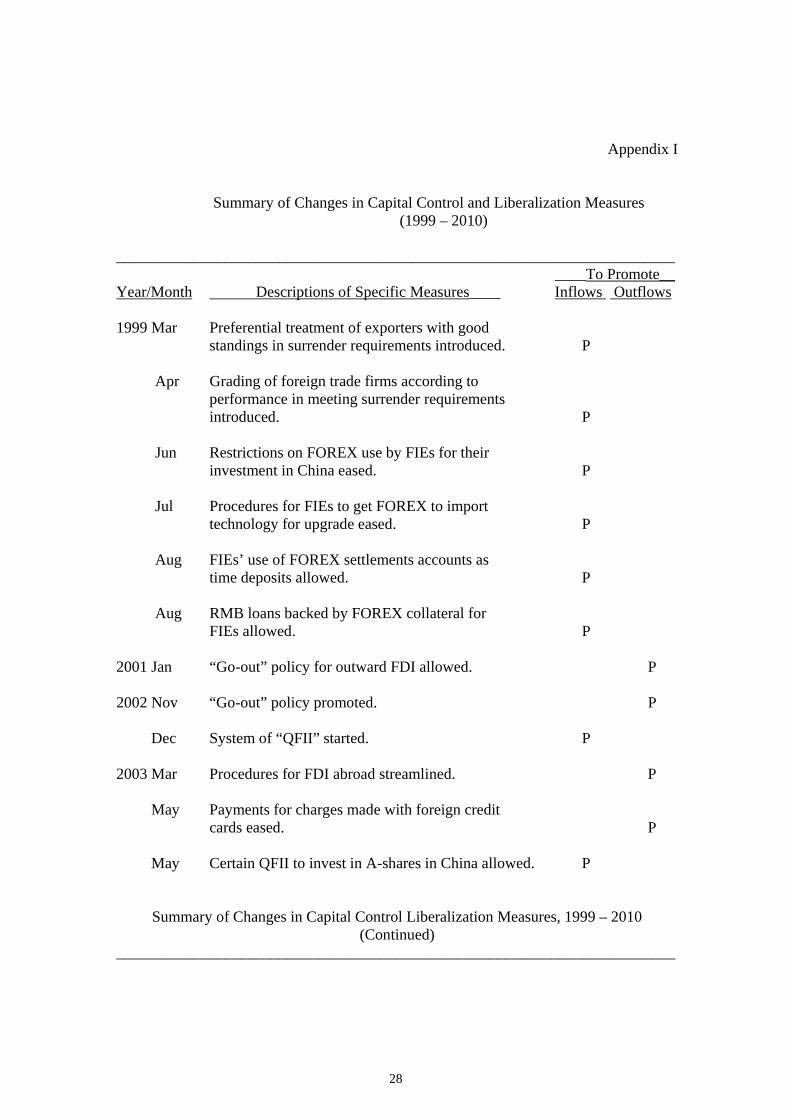
concludes, with policy recommendations. Appendix I provides a chronological list of major
changes in rules and regulations that the authorities introduced from late 1990’s through 2010,
together with their intended purposes of these changes. Appendix II describes the source and
the nature of data used for the empirical study.
II. Evolution of Capital Controls and Liberalization
China’s regime of capital controls has changed dramatically over the years. During the
1980’s and 1990’s, reflecting the need to develop its manufacturing sector following the
initiation of the open-up policy in the late 1970’s, China pursued policies to encourage
foreign direct investment. 6 The basic principle of China’s capital controls during the period
was to “encourage inflows and discourage outflows” and to liberalize restrictions on “long-
term flows first and on short-terms flows later.” After liberalizing the current account
transactions completely in 1996, China was about to open up the capital account transactions
substantially over the subsequent years.7 However, in the aftermath of the Asian financial
crisis that emerged in 1997, the pressure on capital outflows increased, resulting in large net
outflows in 1998, which continued in 1999 as well (Chart 1).
Chart 1: Developments in Net Capital Flows to and from China, 1999 – 2010
6 See Prasad and Wei (2007) for detail discussion on the evolution of China’s FDI inflows, which started to show rapid increases only from the early 1990’s. 7 China formally accepted, on December 1, 1996, the obligations of Article VIII, Sections 2, 3, and 4 of the International Monetary Fund’s Article of Agreement. This acceptance means that there will be no restrictions on purchases and sales of foreign exchange for the current account transactions.
4

In the meantime, the anticipation of the depreciation of the renminbi heightened, but
the authorities maintained the spot exchange rate of the renminbi against the U.S. dollar at the
same rate (Chart 2).
Chart 2: The renminbi’s Exchange Rate against the U.S. Dollar, 1999 - 2010
The thrust of capital controls changed significantly from the early 2000’s in response
to the substantial strengthening of the external sector after China acceded to the WTO in 2001,
as reflected in sharp increases in official holdings of the foreign exchange8 and the switch in
market participants’ expectation of the renminbi’s future value from depreciation to
appreciation. The change consisted of two types. First, the focus of capital controls changed
from “encouraging inflows and discouraging outflows” to “neutral one” first in order to
achieve a better balance in the external position. The authorities continued to encourage FDI
inflows but at the same time started to encourage FDI outflows, which was often referred to
as “Go-out” policy that was introduced in 2001. This policy was further promoted in the
subsequent years. Second, the focus on liberalization shifted from easing restrictions on
foreign direct investment to easing those on portfolio investment. Against this background,
the system of “qualified foreign institutional investors (QFIIs)” was introduced in 2002 to
allow them to invest in some renminbi-denominated domestic securities. However, the
introduction in 2004 of setting ceilings on domestic banks’ borrowing from abroad was aimed
at discouraging inflows (See Appendix I).
8 The import coverage of China’s international reserved stood on average at about 3 months in the early part of 1990’s, but it increased considerably to about 10 months in the early 2000’s. It now stands about 24 months.
5

In the second half of the 2000s, the strength of China’s external sector became
increasingly prominent with chronic surpluses in the current and capital accounts. During
this period, speculative non-FDI capital, so called “hot money,” poured in from time to time.
As a result, the authorities took steps to encourage capital outflows, liberalized certain
restrictions on outflows, and discourage capital inflows particularly. For example, in 2006,
the authorities introduced a system of “qualified domestic institutional investors” (QDIIs),
which can make overseas portfolio investment, and relaxed restrictions on foreign currency
funding for outward direct investment. Moreover, in 2008, the authorities permitted Chinese
banks to lend abroad.
III. Methodology for Quantifying Capital Controls and Liberalization
The Chinese authorities’ announcement of new regulations or modification of existing
ones is usually accompanied by their intention for their action. Therefore, it is not difficult to
know whether or not the announced rules or regulations are for encouraging capital inflows or
outflows or for discouraging inflows or outflows. However, it is not at all clear to figure out
how to give proper weights to these actions so that the net impact can be quantified
appropriately. In this connection, Frankel (1992) concluded that the interest rate parity theory
would be a very useful starting point for measuring international capital mobility, which
would naturally be influenced greatly by the cost of transaction in a broad sense. 9 More
9 Ma and McCauley (2007), in assessing whether China’s capital controls still bind, make use of the interest rate parity theory and estimate the difference between the interest rate on a renminbi-denominated asset in Mainland and the NDF-implied interest rate on a similar renminbi-denominated asset off shore, whereby the latter is based on the assumption that the interest rate parity holds. However, this assumption does not hold in reality because of the presence of transaction costs, and therefore, the estimate of the NDF-implied interest rate so obtained is not credible.
6
recently, Liu and Otani (2005) applied this theory to review developments in China’s capital
controls and liberalization during 1999 – 2004.10
In examining the impact of capital controls or liberalization on international capital
flows in the case of China, it would be useful to raise a few fundamental questions regarding
their impact on these flows. First, how do capital control and liberalization measures affect
the cost of exchanging funds between the renminbi and foreign currencies, such as the U.S.
dollar, within the country? Second, how do these measures affect the cost of transferring
funds across China’s boarder? Third, how does the cost of transaction in China’s international
capital market compare with that of other economies, particularly, that of Hong Kong, which
is regarded as having one of the most efficient and open capital market.
In order to answer these questions, it would be useful to start out with the well-known
theory for the interest rate parity, and consider the meaning of the deviation from the parity.
The interest rate parity is described as equation (1) below.
[(1 + rd)S]/[(1 + rf)F] = 1 (1)
Where rd is the interest rate on the domestic currency (say, renminbi) denominated
asset, S is the spot exchange rate (the number of units in local currency per unit of the foreign
currency, say U.S. dollar), rf is the interest rate on the foreign currency denominated asset,
and F is the forward exchange rate. The term for the local and foreign currency denominated
assets and the forward exchange rate is the same, say, 3 months.
10 Otani and Tiwari (1981) also used a similar same approach to review capital control and liberalization experience in Japan during 1978 – 81.
7

Of course, in the real world, this parity condition does not hold all the time for a
variety of reasons. First of all, any transactions would involve costs when the assets are
exchanged from one currency into another or when market participants change their holdings
of financial assets. Such costs can be identified as pure transaction costs (TCp) arising from
the commissions that the financial institutions charge their customers. In addition, market
participants are most likely to incur additional costs, reflecting taxes, search time, political
risks, or exchange risks due to changes in tax policy, capital controls or exchange market
pressures. Such costs in aggregate can be identified as risk-associated transaction costs (TCr).
Therefore, total transaction cost (TC) would be reflected in the sum of TCp and TCr.
Accordingly, the deviation from the parity condition can be expressed in equation (2) below.
- TC < [(1 + rd)S]/[(1 + rf)F] - 1 < + TC (2)
Equation (2) states that the value of the deviations from the interest rate parity
condition is bounded by the total transaction cost (which is by definition a positive value).
Therefore, there would be no unexploited profit opportunities if equation (2) holds. On the
other hand, unexploited opportunities would be taken advantage of by market participants if
equation (3) holds and capital inflows take place.
TC < [(1 + rd)S]/[(1 + rf)F] - 1 (3)
Capital outflows take place if equation (4) below holds.
- TC > [(1 + rd)S]/[(1 + rf)F] - 1 (4)
8

To elaborate the idea behind equations (2) – (4), consider the following example.
Suppose that the positive deviation from the parity is greater that TC in equation (3).
Then, the unexploited profit opportunity exists for those who want to bring in funds from
abroad. This would trigger capital inflows, which will continue as long as the deviation
from the parity remains greater than the transaction cost. In reality, at some point in time,
the inflow will stop, meaning that the inflow is finite. This implies three possibilities.
First, the interest differential or the exchange rate premium/discount would adjust in such
a way that the deviation from the parity would become equal to or less than the
transaction cost. Second, the authorities would introduce measures to restrict capital
inflows raising the transaction cost which will become equal to or greater than the
positive deviation from the parity. 11 Third, adjustments in the first and second cases
could proceed concurrently. In the each of the three cases, the unexploited profit
opportunity would cease to exist eventually.
Conversely, suppose that the absolute value of the negative deviation from the
parity is greater than the transaction cost. Under this circumstance, the unexploited
opportunity exists for those who want to take funds from the home country to abroad, and
this would trigger capital outflows. Such flows will continue as long as the absolute value
of the deviation from the parity is greater than the transaction cost. However, as this
process continues, the interest rate differential or the exchange rate premium/discount will
adjust or the authorities introduce measures to restrict capital outflows. These
adjustments in turn would lead to the situation whereby the absolute value of the negative
11 Those who try to evade the government regulations may face penalty when they are caught in violating the regulations by falsifying documents or may incur additional cost of bribing officials.
9

deviation from the parity becomes equal to or less than transaction cost. At that moment,
the unexploited profit opportunity ceases to exist.
The set of equations (2) – (4) above can be applied to each of the three markets.
The first one is the on-shore market within Mainland China (hereafter Mainland or China),
where transactions involving the renminbi and U.S. dollar denominated assets take place
within Mainland. The second is the cross-border market for Mainland, in which these
transactions take place across Mainland’s border. The third is the Hong Kong market
where transactions involving the Hong Kong dollar denominated assets and the U.S.
dollar denominated assets take place within Hong Kong or between Hong Kong and the
rest of the world. Therefore, the three sets of transaction cost can be obtained. For Hong
Kong, almost all of the total transaction costs are expected to reflect pure transaction cost.
This cost is approximated by TC, hk = TCp.12 For the on-shore market in Mainland,
denoted by TC, on, is the sum of TCp and TCr, on, where TCr, on represents transaction
cost involving political and exchange risks. The total cost is represented by TC, on = TCp
+ TCr, on. The total transaction cost for Mainland’s cross-border market is similarly
represented by TC, cb, which is equal to the sum of TCp and TCr, cb, the latter of which
is the transaction cost involving risk factors for cross-border transactions. From these sets
of relationships, the transaction cost involving risk factors for the onshore market and the
cross-border market in Mainland can also be examined. Thus, by comparing the three
sets of the estimated total transaction cost, the answers to the three questions raised at the
beginning this subsection can be obtained, and policy implications can be drawn.
12 Strictly speaking, the efficiency of personnel and infrastructure in the international capital market in Hong Kong could be different from that in Mainland China, but the difference should be very small during the period under study. This is so because most of transactions in the international capital market take place in Shanghai, where its personnel and infrastructure are regarded as comparable to Hong Kong’s.
10

IV. Empirical Results
Data used for the empirical investigation for each market are based on daily
observations of the spot exchange rate (local currency per unit of the U.S. dollar), the 3-
month forward exchange rate (local currency per unit of the U.S. dollar), the 3-month
interest rate on the local currency-denominated asset, and the 3-month interest rate on the
U.S. dollar-denominated asset.13 For each of the three markets, two sets of the exchange
rate and two sets of the interest rate were observed on a particular day. If there is at least
one variable that is not available for one reason or another for this day, for example,
because the foreign exchange market is closed for a national holiday, the rest of the data
for this particular day necessary for this investigation are excluded from the observation
sample for the empirical study. The choice of the period for this empirical study was
somewhat arbitrary but was based on the ease with which data were collected.
Observations from Charts 3 and 4
Chart 3 depicts daily observations of the deviation from the interest rate parity for the
on-shore market, the cross-border market (both for Mainland) and the Hong Kong market as a
benchmark. 14 Several observations can be noted.
Chart 3: Deviations from the Interest Rate parity, 1999 – 2010
13 See Appendix II for specificities on these variables. 14 Deviations from the parity were also calculated for the on-shore and the cross-border markets using the data for the 3-month SHIBOR for the period from 2000 through 2010, the general patterns of deviations remained very similar for the period under study. Nevertheless, from mid-2010 to the end-2010, the deviation from the parity based on the use of the 3-month SHIBOR was somewhat less than that based on the use of the 3-month renminbi deposit rate. This suggests that the cost for the market participants involved in transactions to which SHIBOR is relevant, i.e. commercial banks, is less than the cost for those involved in transactions to which the 3-month renminbi deposits, i.e. small depositors.
11

First, deviations from the parity for the Hong Kong market are very small and
scattered around the parity line, with the absolute value of these deviations averaging only
0.00045, although, during the period of several months following the Lehman shock,
deviations from the parity that became large by the Hong Kong standard can be said to reflect
exchange market risks. 15
Second, deviations from the parity for the cross-border market are mostly negative
from the beginning of 1999 through the third quarter of 2002. These findings reflect the way
in which the interest rate on the renminbi-denominated assets and the spot exchange rate of
the renminbi in Mainland are set by the authorities for domestic monetary policy reasons.
Thus, the forward exchange rate, which is not controlled by the authorities, is the only
variable that can adjust in response to the expectation of the spot rate in the future and the
cost of transactions. 16 This suggests that, during this period, changes introduced by the
authorities in capital control measures by and large aimed at encouraging inflows and
discouraging outflows, with the result that the liquidity condition in the domestic market
became easier. While the interest rate on the 3-month renminbi deposits and the spot
exchange rate remained fixed by the authorities and the foreign interest rate was determined
in the world market, the interest rate on other renminbi assets tended to decrease. As a result,
pressures on the forward exchange rate increased. 17 18
15 For 2010 as a whole, the estimated value of the transaction cost for the Hong Kong market is 0.0003. Interestingly, this value is the same as the value (0.0003) estimated for the London market for 2010 as a whole, using the spot and forward exchange rate of the pound sterling against the U.S. dollar, 3 month inter-bank (pound sterling) deposit rate and 3 month U.S. LIBOR. The data used for this calculation for the London market are all obtained from the website of the Bank of England (www.bankofengland.co.uk). 16 For detail discussion of these points, see Tsuyuguchi (2009). 17 See Otani (1983) for theoretical discussion on the impact of capital control measures on the liquidity condition, the interest rate and the exchange rate in the domestic market. 18 The NDF rate moved from a depreciated level (say, around 9 yuan per U.S. dollar from early 1990 to around 8.3 yuan per U.S. dollar in the third quarter of 2002 (See Chart 2).
12

Third, deviations from the parity showed different patterns over the period under
study, depending on the markets and on the sub-periods. During 1999 – 2002, deviations
from the parity for the on-shore market were rather small, compared with those for the cross-
border market (Chart 4). This means that, during this period, the cost of transactions for the
on-shore market was less than the cost for the cross-border transactions, because the
restrictiveness of regulations applied to the on-shore transactions or other types of political
risks associated with on-shore transactions were less than those associated with the cross-
border transactions.
Chart 4: Cost of Transaction (Absolute Value of Deviation from the Parity)
1999 – 2010
From 2003 through the second quarter of 2005, the transaction cost for both on-shore
market and the cross-border market increased sharply, compared with the earlier period.
The increased cost may have reflected uncertainty about the possible changes in the
exchange rate management scheme, which the authorities finally introduced in the form of
a more flexible but still managed exchange rate system in July 2005. This kind of
uncertainty seems to have continued through 2007. The increased cost from late 2008
through 2009 clearly reflected exchange risks associated with the global financial crisis in
the aftermath of the Lehman shock.
During the period from 2003 through 2010 as a whole, deviations from the parity
for the on-shore market were by and large greater than those for the cross-border market.
13

This is likely to be caused by the ceilings that the authorities have imposed on the interest
rate on the U.S. dollar deposits in Mainland below the rate prevailing in the world market.
Relationships between Gap and Capital Flows
For the purpose of the regression analysis of the relationships between capital
control measures and capital flows, a few remarks are in order.
First, the value of the gap variable used in the regression result is scaled up by
multiplying the actual value by 100, while the values of inflows, outflows, net inflows,
and errors and omissions are expressed in percent of the sum of exports and imports in
order to normalize the extent of capital flows.
Second, the value of the gap variable is negative when the authorities’ capital
controls aimed at encouraging inflows and discouraging outflows, while the value is
positive when these control measures aimed at encouraging outflows and discouraging
inflows.
From these relationships, it is clear that, if the capital control measures were
effective, a negative relationship between the gap variable and the net inflows would be
expected.
If we disaggregate net inflows into gross inflows and gross outflows, separate
concrete relationships with capital control measures can be found. For example, the
larger the negative value of the gap variable was, the greater the value of gross inflows
would be. On the other hand, the larger the positive value of the gap was, the smaller the
14

value of inflows would be. Combining these relationships, we expect a negative sign for
the gross inflow variable when the inflow variable is regressed against a gap variable.19
The relationship between the gap variable and the outflow variable would be
positive. This is so because the larger the negative value of the gap variable, the smaller
the value of the outflow variable, while the larger the positive value of the gap variable,
the larger the value of the outflow variable.
The relationship between the gap variable and the errors and omission (net) is the
same as that between the gap variable and net inflows, in that the nature of the errors and
omissions (net) is no different from that of net inflows.
In short, the expected sign of the gap variable is negative, negative, positive, and
negative, respectively, for the net inflow, the inflow, the outflow, and the errors and
omissions when these variables are regressed against the gap variable.
Observations from the Regression Results (Table 1)
The overall capital control measures did not have any systematic impact on net
capital inflows. The lack of statistical significance between the capital control measures
and net capital inflows (with a wrong sign) can be easily seen by the coefficient of the
Gap variable of equation 1 in the table. This result is intuitively understandable as some
of the capital controls aimed at encouraging inflows while others at encouraging outflows,
and these measures tended to be in place simultaneously from time to time. Furthermore,
these measures coexisted with other measures that aimed at discouraging inflows or
outflows. In addition, the strength of these measures differed from time to time.
19 These relationships can be easily understood by considering a two dimensional diagram with the vertical axis measuring the gap and the horizontal axis measuring inflows.
15

The impact of controls on inflows, as represented by the coefficient of the Gap
variable in equation 2, was statistically insignificant (with a wrong sign) as in the case of
net inflows as most of the period for the regression analysis observed that most controls
did not aim at encouraging inflows. However, the positive coefficient of the trend
variable has a considerable statistical significance, perhaps reflecting the integration for
China’s financial market with other financial centers as the value of capital inflows
increased faster than trade.
The impact of controls on capital outflows, represented by the coefficient of the
Gap variable in equation 3, had even less statistical significance (with a wrong sign) than
that in the case of net inflows or inflows. This seems counter-intuitive given a seemingly
positive correlation between the strength of measures taken by the authorities to
encourage capital outflows and discourage inflows during most of the regression period.
Nevertheless, the lack of statistical significance appears to reflect that the seemingly
positive correlation between the strength of capital controls and capital outflows was
dominated by the influence of the time trend variable as in the case of capital inflows. In
addition, the authorities’ introduction of the measures reflected their delayed response to
large capital inflows that had already taken place. Therefore, the authorities’ policy can
be characterized as the so called “leaning against the wind” and was rather ad hoc.
Finally, if capital controls measures had significant influences on the “hot” money
movements, which would be reflected in “errors and omissions,” a negative coefficient is
expected for the coefficient of the Gap variable in equation 4.20 In contrast, the regression
result shows a positive value for the estimated coefficient although its statistical
20 These controls would have increased the cost of transactions for the “hot money” transactions and thus would have reduced capital movements under the hot money.
16
significance is not great. This means that market participants were either successful in
evading the control measures and would find that bringing the speculative hot money into
Mainland would still worth trying despite increased transaction costs. The regression
result would also indicate that the authorities’ introduction of new or modified control
measures was of a “leaning-against-the-wind” type, whereby these measures showed the
authorities’ delayed response to flows of the “hot money.”
17

Table 1. Regression (OLS) Results for Capital flows, 2001 – 2009 1/ Dependant Variables __________________________________________________________________ Net Inflows Inflows Outflows Errors & Omissions (1) (2) (3) (4) Gap 2.31 0.57 - 1.00 2.96 (0.58) (0.09) (- 0.16) (1.60) Trend - .38 1.01* 1.44*** - 0.07 (-1.28) (2.05) (3.21) (- 0.51) Dummy 1.50 - 2.00 - 4.69 - 5.07 (0.21) - (0.17) (- 0.43) (- 1.57) Constant 7.22*** 20.87*** 12.47*** - 0.06 (3.00) (5.11) (3.25) (- 0.09) R-squared 0.12 0.35 0.52 0.19 Adj R-squared - 0.07 0.22 0.41 0.01 Source: Authors’ calculation *** Significant at the 1 percent level. * Significant at the 10 percent level. 1/ Semi-annual observations; the number of observations is 18 in each equation. 2/ Dependant variables are impressed as percent of the value of trade. 3/ Gap is the average of daily observations for a semi-annual period, expressed in percent. 4/ Trend takes 1 for H1 of 2001, 2 for H2 of 2001, 3 for H1 of 2002, etc. and 18 for H2 of 2009. Due to the lack of data for the capital flows with a higher frequency, such as a quarterly or monthly data, the highest frequency of observations is a semi-annual. No data is available for the entire period of 2010 when the regression analysis was conducted. 5/ Dummy takes 1 for H1 of 2009 to reflect the outlier observation for the Gap; takes 0 otherwise.
18

Main finding
In short, the main finding from the empirical investigation of the relationship
between capital controls on the one hand and the cost of transactions and the volume of
capital flows on the other in this sub-section is that the estimated cost of transaction in
Mainland is consistently reflective of the intention of the authorities in introducing these
measures. The fact that the positive coefficient of the trend variable has a considerable
statistical significance implies that the size of capital flows has become increasingly
greater over the years.
V. Implications for Capital Market Reform in the Future
Above-mentioned findings show that despite authorities’ aim of controlling capital
transactions, the size of capital flows has been increasing over the years. As China’s
financial markets are expected to be integrated more widely with global financial markets
in the coming years, the size of capital flows to and from Mainland China is expected to
increase further. Hence, it would become harder for the authorities to rely on capital
control measures as main instruments in regulating capital flows. This implies that the
eventual removal of capital controls would be essential. 21 As a matter of fact, the removal
of capital controls, in other words, the realization of the renminbi’s convertibility under
capital account, has been the goal set by the Chinese government. 22
21 In the late 1990’s, China’s financial system was very fragile with most state-owned banks being technically insolvent. Under this circumstance, the authorities may have felt reasonable to restrict capital flows. However, with the much improved asset quality and the capital adequacy of these banks and the improved infrastructure in other financial industries, the financial system became robust enough to stand relative rapidly changing capital movements. See Lardy and Douglass (2011) for discussion of the process in which China’s financial system strengthened over the past decade. 22 In July 2010, Yi Gang, Deputy Governor of the People’s Bank of China and Administrator of the State Administration of Foreign Exchange, told in the interview by the Executive Editor-in-Chief of China
19

The removal of controls has to be sequenced properly so as to prevent chaotic
movements in capital flows. Broadly speaking, this sequencing would first require the
improvement of the infrastructure in the financial sector. One such infrastructure would
involve a further improvement in the system of monitoring capital flows with a high
frequency (including the accurate recording of flows) and in the capacity to analyze
capital flows and to formulate micro/macroeconomic policies dealing with these flows. 23
Another aspect of this infrastructure would be the capacity to assess risks associated with
financial assets and take appropriate prudential measures by the public and private
financial institutions.
Ideally, the establishment of a strong infrastructure should precede the removal of
capital controls. However, the reality would dictate that, in some sense, the gradual
relaxation of capital controls would have to be advanced before a perfect infrastructure is
established.
For most of the emerging economies including China, they would have a sound
and comprehensive infrastructure for foreign direct investment first, followed by that for
long-term loans. The most difficult part of the infrastructure is for assets with a relatively
short-term remaining maturity period. Thus, most countries are likely to need to establish
a sound and comprehensive infrastructure only after such an infrastructure for foreign
direct investment and long-term loan movements is established.24
Reform that China’s ultimate goal is to make the renminbi a convertible currency and that the goal was made in the fall of 1993, at the Third Plenary Session of the 14th CPC Central Committee. See Yi (2010). 23 The State Administration of Foreign Exchange (SAFE) has been beefing up its efforts to monitor China’s cross-border fund flows. In February 2011, the SAFE published the report on the monitoring of China’s cross-border fund flows in 2010, showing its will to publish such kind of reports annually. 24 The sequence of capital control relaxation described in this paragraph is consistent with the SAFE official’s view. See the article written by Guan Tao, Deputy Director General of General Affairs Department, the SAFE (Guan Tao (2007, Chinese version).
20

In addition to the establishment of a decent infrastructure for monitoring capital
movements, it is essential to improve the functioning of the monetary market in general—
covering the market for domestic currency denominated assets and that for foreign
currency denominated assets within the country. In the case of China, this would involve
the improvement in the functioning of the foreign exchange market and the domestic
money market so that asset prices are determined by market forces. This implies that the
domestic interest rates have to be liberalized and the foreign exchange rate has to be
determined by market forces if China is to liberalize its capital transactions. 25 Again, in
reality, the gradual relaxation of capital controls would have to be advanced before the
complete liberalization of domestic interest rates and the full flexibility of the renminbi’s
exchange rate can be achieved.
The improved functioning of the domestic financial market also calls for an
increase in the number of different types of financial assets, which are still very limited in
number despite recent progress made in easing restrictions on the issuance of corporate
bonds and other instruments that can be transacted in the secondary markets.
VI. Concluding Remarks
The main purpose of this paper has been several-fold; to formulate a summary
measure of the strength of capital control measures and empirically estimate their overall
strength; to examine whether the strength of these controls is consistent with the
authorities’ intension to influence capital movements; to assess the effectiveness of these
25 These points are not new. Many researches, including Prasad, Rumbaugh, and Wang (2005) among others emphasized these points in the past. However, it is worth to reemphasize these again.
21

controls; and to draw policy implications for the reform of the financial markets,
particularly the international capital market.
A summary measure of the strength of capital controls was formulated by making
use of the interest rate parity theory and then quantified by measuring the observed
deviations from the parity. The evidence showed that the empirically quantified strength
of capital controls was by and large consisted with the authorities’ intention in influencing
capital movements. Nevertheless, the size of capital flows has been increasing over the
years.
Based on these findings, policy implications have been drawn for the reform of
China’s international capital market over the medium term. This involves the reform of
the domestic financial market as well. Implications are as follows.
Infrastructure needs to be improved so as to effectively monitor capital flows,
analyze their movements and associated risks, and formulate appropriate policies
at micro and macro levels.
Ideally, controls would have to be removed after the necessary infrastructure is
established. However, this is likely to be impossible in reality. As a second best,
some of the control measures need to be gradually relaxed before a perfect
infrastructure is completed.
Relaxation of capital flow restrictions needs to be accompanied by the improved
functioning of the financial market in general, which would require an
improvement in interest rate liberalization and foreign exchange rate
determination based on market forces and an increase in the scope for available
financial assets in the secondary market.
22

The speed of reform needs to be accelerated beyond the speed with which the on-
going financial integration in the world has been proceeding in recent years.
23

Chart 1: Developments in Net Capital Flows to and from China, 1999 – 2010 1/
(In percent of GDP)
‐8.0
‐6.0
‐4.0
‐2.0
0.0
2.0
4.0
6.0
8.0
10.0
(%)
Source: SAFE, Okazaki and Fukumoto (2011)
1/ Net capital flows are defiled as “changes in reserve assets” minus “changes in the current account balance.” We adjust the amount of “changes in reserve assets” according to Tsuyuguchi (2009). In his analysis of recent movements in foreign reserves in China’s balance of payments statistics, he adjusts the following three factors: the influence of the central bank’s currency swap transactions; movements in the commercial banks’ reserve requirement on foreign currency deposits; and foreign currency denominated capital injection into the China Investment Corporation.
24
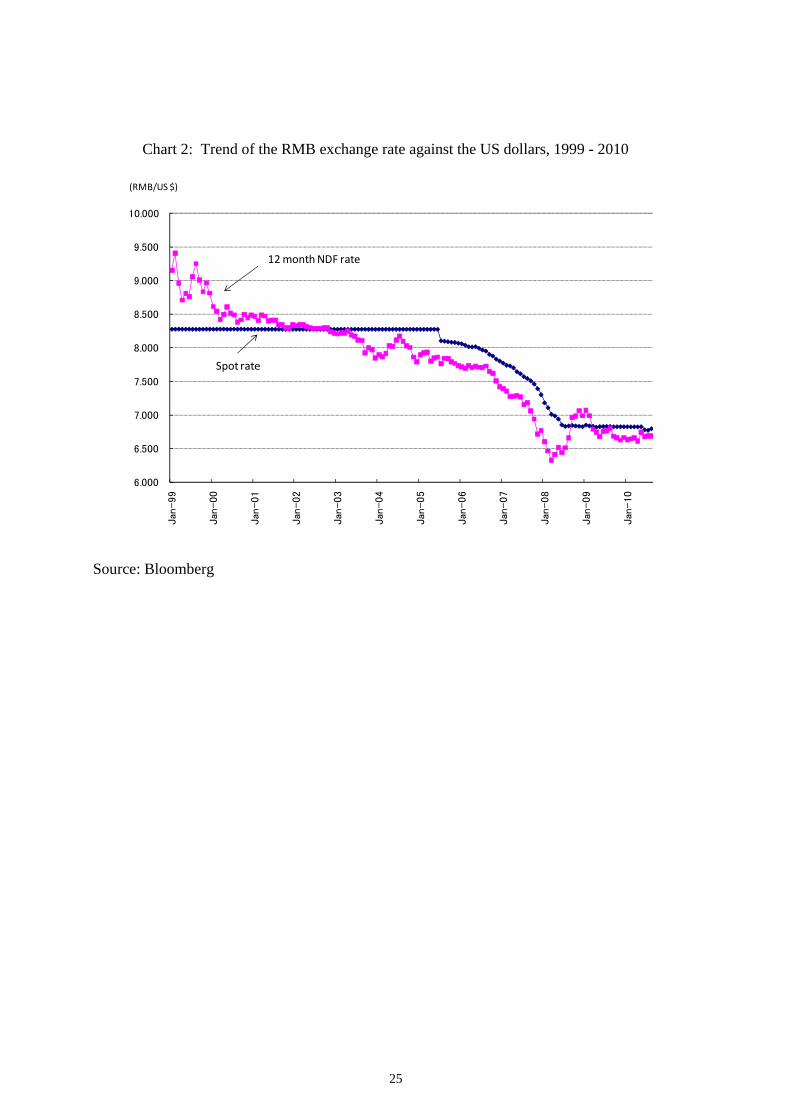
Chart 2: Trend of the RMB exchange rate against the US dollars, 1999 - 2010
6.000
6.500
7.000
7.500
8.000
8.500
9.000
9.500
10.000
Jan
-99
Jan
-00
Jan
-01
Jan
-02
Jan
-03
Jan
-04
Jan
-05
Jan
-06
Jan
-07
Jan
-08
Jan
-09
Jan
-10
(RMB/US $)
12 month NDF rate
Spot rate
Source: Bloomberg
25

Chart3: Deviations from the Interest Rate Parity, 1999 – 2010 (Daily Observations)
-0.02
-0.01
0
0.01
0.02
0.03
0.04
0.05
19
99
/01
/01
19
99
/05
/01
19
99
/09
/01
20
00
/01
/01
20
00
/05
/01
20
00
/09
/01
20
01
/01
/01
20
01
/05
/01
20
01
/09
/01
20
02
/01
/01
20
02
/05
/01
20
02
/09
/01
20
03
/01
/01
20
03
/05
/01
20
03
/09
/01
20
04
/01
/01
20
04
/05
/01
20
04
/09
/01
20
05
/01
/01
20
05
/05
/01
20
05
/09
/01
20
06
/01
/01
20
06
/05
/01
20
06
/09
/01
20
07
/01
/01
20
07
/05
/01
20
07
/09
/01
20
08
/01
/01
20
08
/05
/01
20
08
/09
/01
20
09
/01
/01
20
09
/05
/01
20
09
/09
/01
20
10
/01
/01
20
10
/05
/01
20
10
/09
/01
Onshore Cross border HK bench mark
Source: The authors’ calculation.
26

Chart 4: Cost of Transactions (Absolute Value of Deviations from the Parity)
1999 - 2010
0.0000
0.0050
0.0100
0.0150
0.0200
0.0250
1999
Q1
Q3
2000
Q1
Q3
2001
Q1
Q3
2002
Q1
Q3
2003
Q1
Q3
2004
Q1
Q3
2005
Q1
Q3
2006
Q1
Q3
2007
Q1
Q3
2008
Q1
Q3
2009
Q1
Q3
2010
Q1
Q3
On-shore Cross-Border Hong Kong
Cross-border
On-shore
Hong Kong
Source: The authors’ calculation.
27
Appendix I Summary of Changes in Capital Control and Liberalization Measures
(1999 – 2010)
________________________________________________________________________ ____To Promote__ Year/Month Descriptions of Specific Measures____ Inflows Outflows 1999 Mar Preferential treatment of exporters with good standings in surrender requirements introduced. P Apr Grading of foreign trade firms according to performance in meeting surrender requirements introduced. P Jun Restrictions on FOREX use by FIEs for their investment in China eased. P Jul Procedures for FIEs to get FOREX to import technology for upgrade eased. P Aug FIEs’ use of FOREX settlements accounts as time deposits allowed. P Aug RMB loans backed by FOREX collateral for FIEs allowed. P 2001 Jan “Go-out” policy for outward FDI allowed. P 2002 Nov “Go-out” policy promoted. P Dec System of “QFII” started. P 2003 Mar Procedures for FDI abroad streamlined. P May Payments for charges made with foreign credit cards eased. P May Certain QFII to invest in A-shares in China allowed. P
Summary of Changes in Capital Control Liberalization Measures, 1999 – 2010 (Continued)
________________________________________________________________________
28

____To Promote__ Year/Month Descriptions of Specific Measures______ Inflows Outflows
Sep Surrender requirements for certain FOREX use (e.g. hiring international contractors) cancelled. N
Nov System of collecting profits from investment abroad cancelled. N 2004 May Ceilings on banks’ borrowing from abroad introduced. N 2004 May Ceilings on foreign companies’ borrowing from abroad introduced. N 2005 Oct RMB bonds issued by ADB and IFC for funding Pprojects in China. X X 2006 Jan “Go-out” policy further promoted. P Apr System of “QDII” started. P Jun Restrictions of foreign currency funding of outward FDI relaxed. P Sep Foreigners’ purchase of real estate restricted. N Oct Domestic banks prohibited from transacting in off-shore NDF markets. X X 2007 Jan Ceilings on banks borrowing from abroad lowered. N May Restrictions on foreigners’ purchase of real estate Strengthened. N Jun Mainland banks issuance of RMB bonds in Hong Kong started. P 2008 Jul System of matching customs invoices and funds transactions introduced. N Aug Mainland banks lending abroad permitted. P
29

Summary of Changes in Capital Control and Liberalization Measures, 1999 – 2010 (Continued)
___To Promote__ Year/Month Descriptions of Specific Measures__________ Inflows Outflows 2009 Oct Upper limits on maturity of import finance shortened from 120 days to 90 days. N 2009 Jul Pilot project for cross-border settlements by RMB started in Hong Kong, Macau, and ASEAN. X X Oct Chinese RMB government bonds issued in Hong Kong. P 2010 Jun Geographical restrictions on pilot projects for cross-
border settlements by RMB lifted. X X
Jun Approval process for certain FOREX business under the Capital Account simplified. X X Jul Restrictions on pilot project for cross-border settlements in RMB in Hong Kong further relaxed. X X Aug Foreign central and commercial banks permitted to Invest in Chinese domestic (RMB) bonds. P Nov Foreign exchange controls on capital inflows strengthened. N 2011 Jan Outward FDI settlement in RMB approved. P Abbreviations; FDI: foreign direct investment. FIE: foreign invested enterprise. FOREX: Foreign exchange. N: negative impact. P: positive impact. QDII: qualified domestic institutional investor. QFII: qualified foreign institutional investor. RMB: renminbi. X: neutral impact.
30

Appendix II
Data Description and Sources
______Data Description_1/________ ___________Data Sources___________
Spot exchange rate:
RMB/US$, cross-border: SAFE, Government of China Cross-border & on-shore (www.safe.gov.cn), Bloomberg
HK$/US$, Hong Kong Hong Kong Monetary Authority, HK (www.info.gov.hk/hkma) 3-month forward exchange rate: RMB/US$, People’s Bank of China (www.pbc.gov.cn) Cross-border & on-shore Bank of China (www.boc.cn), Liu and Otani (2005) WM/Reuters, Bloomberg HK$/US$, Hong Kong Hong Kong Monetary Authority (www.inf.gov.hk/hkma) 3-month interest rates: RMB-denominated deposits, On-shore &cross-border People’s Bank of China (www.pbc.gov.cn), CEIC US$-denominated assets, On-shore: interest rate on deposits Bank of China (www.boc.cn) Cross-border: LIBOR Bank of England (www.bankofengland.co.uk), Bloomberg
HK$-denominated deposits Hong Kong Monetary Authority, HK
(www.info.gov.hk/hkma), Bloomberg
1/ All data are based on daily observations.
31

References
Cline, William R., 2010, Financial Globalization, Economic Growth, and the Crisis of 2007 – 09, Washington, DC: Peterson Institute for International Economics. Edwards, Sebastian, ed. 2007, Capital Controls and Capital Flows in Emerging in Emerging Economies: Policies, Practices, and Consequences, National Bureau of Economic Research, University of Chicago Press, Chicago. Frankel, Jeffrey, 1992, “Measuring International Capital Mobility: A Review,” American Economic Review, vol. 82, no. 2 pp 197-202. Guan Tao, 2007, “In the process of reforming RMB exchange rate and RMB’s convertibility in capital account, we should stick to self-directed, sequential and controllable ways (Zai Renminbi Huigai He Ziben Xiangmu Keduihuan Guocheng Zhong, Yao Jianchi Yiwoweizhu, Youxukekong),” Outlook Weekly (Liaowang Xinwen Zhoukan) 2007 No.48 (Chinese version only). International Monetary Fund, 2010 “Measuring Capital Account Restrictiveness: A Survey of the Literature,” in Annual Report on Exchange Arrangement and Exchange Rate, Washington, DC. International Monetary Fund, 2011, Global Financial Stability Report: Market Update, Washington, DC. Lardy, Nicholas, and P. Douglass, 2011, “Capital Account Liberalization and the Role of the Renminbi,” Peterson Institute of International Economics, Working Paper Series (February). Liu, Li-Gang and I. Otani, 2005, “Capital Controls and Interest Rate Parity, Evidences from China, 1999 – 2004,” presented for the RIETI/BIS/BOC Conference on Globalization of Financial Services in China. Ma, Guanan and Robert N. McCauley, 2007, “Do China’s Capital Controls Still Bind? Implications for Monetary Autonomy and Capital Liberalization,” BIS Working Paper No. 233. Okazaki, Kumiko and T. Fukumoto, 2011, “Macro-financial Linkage and Financial Deepening in China after the Global Financial Crisis,” Bank of Japan IMES Discussion Paper Series. Ostry, Jonathan D., A.R. Ghoshi, K Habermeier, M. Chamon, M. S. Querashi, and D.B.S. Reinhardt, 2010 “Capital Inflows: The Role of Controls,” Washington, DC, IMF Staff Position Note, No., 2010/14.
32

Otani, Ichiro, and S. Tiwari, 1981,”Capital Controls and Interest Rate parity: The Japanese Experience, 1978-81,” IMF Staff Papers, December, pp 793-815. Otani, Ichiro, 1983, “Exchange Rate Instability and Capital Controls: The Japanese Experience, 1978-81,” in Bigman, D and T. Taya eds., Exchange Rate and Trade Instability: Causes, Consequences, and Remedies, Ballinger Publishing Company (Cambridge, Mass.), pp 311-337. Prasad, Ewwar and S-J. Wei, 2007, “The Chinese Approach to Capital Inflows: Patters and Possible Explanations,” in S. Edwards, eds. Capital Controls and Caapital Flows in Emerging Economies: Policies, Practices, and Consequences. National Bureau of Economic Research, University of Chicago Press, Chicago. Prasad, Eswer, T. Rumbaugh, and Q. Wang, 2005, “Putting the Cart before the Horse? Capital Account Liberzlization and Exchange Rate Flexibility in China,” IMF PDP/05/1. State Administration of Foreign Exchange, 2009, “Waihui Guanli Gailan (Summary of Foreign Exchange Management)” Government of China, Beijing (Chinese version only). Tsuyuguchi, Yosuke, 2009, “The Recent Flow of “Hot Money” in China,” Bank of Japan Review (July). Yi, Gang, 2010, “The best choice of the RMB exchange rate regime (Renminbi Huili Zhidu de Zuijia Xuanze),” China Reform (Zhongguo Gaige) 2010-8 (Chinese version only).
33