chile fresh deciduous fruit annual chilean fruit ... gain publications/fresh deciduous...is...
TRANSCRIPT

THIS REPORT CONTAINS ASSESSMENTS OF COMMODITY AND TRADE ISSUES MADE
BY USDA STAFF AND NOT NECESSARILY STATEMENTS OF OFFICIAL U.S.
GOVERNMENT POLICY
Date:
GAIN Report Number:
Approved By:
Prepared By:
Report Highlights:
For Chilean apples, pears and table grapes, MY2016/17 has been characterized by having a high
accumulation of chill hours (i.e. temperatures below 7 degrees Celsius) during winter months, which
is necessary for a quality harvest. Such climatic conditions resulted in early and uniform blooming
that is favorable for these crops. As a result, apple exports are expected to reach 750,000 MT during
MY2016/17. In addition, the table grape export volume is expected to recover to 730,000 MT,
while fresh pear exports are estimated to rebound to 138,000 MT during the same period. The U.S.
is the largest importer of Chilean apples and table grapes, and is the fourth largest importer of
Chilean pears.
Sergio Gonzalez, Agricultural Specialist
Anita Katial, Agricultural Attaché
Chilean Fruit Production and Exports Expected to Recover
in MY2016/17
Fresh Deciduous Fruit Annual
Chile
CI1629
10/26/2016
Required Report - public distribution

Executive Summary:
For Chilean apples, pears and table grapes, MY2016/17 has been characterized by having a high
accumulation of chill hours (i.e. temperatures below 7 degrees Celsius) during winter months, which
is necessary for a quality harvest. Such climatic conditions resulted in early and uniform blooming
that is favorable for these crops. As a result, apple exports are expected to reach 750,000 MT during
MY2016/17. In addition, the table grape export volume is expected to recover to 730,000 MT, while
fresh pear exports are estimated to rebound to 138,000 MT during the same period. The U.S. is the
largest importer of Chilean apples and table grapes, and is the fourth largest importer of Chilean
pears.
Commodities:
Production:
The area planted with apples in MY2015/16 was 36,059 hectares (ha). This is a 3% reduction in
the planted area over MY2014/15, and is a result of farmers shifting their lower yield variety
apples to either higher yield varieties or more profitable fruits like cherries.
61.2% of Chile’s apple planted area is located in the region of Maule, followed by O’Higgins
region which has 25.6% of the apple planted area, and the remaining spread through other
regions in the country. 81% of the area planted is made up of red apple varieties while 19% is
green apple varieties, which is almost entirely Granny Smith. The traditional red varieties, Royal
Gala and Pink Lady, remain the most planted red ones (19.3% and 10.3% of the red apple area
planted respectively), while other traditional varieties like Scarlett and Red Chief are still
important but are not being planted at the time. New varieties that are being planted are
Brookfield Gala, Gala Premium, Fuji Raku Raku, Honey Crisp and Rosy Glow, which are
improved clones of Royal Gala (harvested in February-March), Fuji (harvested in March-April)
and Pink Lady (harvested in April-May), which allow for apples to be harvest throughout the
harvest season rather than all at one time, which reduces the risk of total loss when facing
adverse climatic conditions.
MY2016/17 has been characterized by a high accumulation of chill hours (i.e. temperatures
below 7 degrees Celsius) during the winter, which caused fruits to blooming 10 days early (see
picture 1). Such early blooming is favorable for Chile’s fruit production. In contrast, in
MY2015/16 winter lacked proper chill hour conditions and caused irregular blooming and
harvest was delayed by 10 days for almost all fresh fruits, having an adverse effect on apple
production.
Apples, Fresh

Picture 1: Apple bloom, September 13th
, Chillan, Bio Bío region.
Source: USDA/FAS Santiago field visit to Chillan, Chile
Consumption:
Apple consumption has been rising since 2003. Per capita consumption was 14kg in 2013
(ODEPA, 2014). Total domestic consumption is likely to reach around 255,000 MT/year,
considering a population of 18,191,884 in CY2016 (INE, 2016).
Trade:
Apple export volume increased 16.4% to 595,873 MT in January-July 2016 over the same
period in 2015. During mid-April 2016, rainfall affected the harvest of Fuji and pink lady
apples, which presented fruit cracking in some cases. Additionally, rainfall reduces cold storage
potential which means fruit has to be exported quickly. Exports peaked in May and June
MY2015/16 (see Graph “Chile: Apple export volume by month”) and are expected to reach a
total of 660,000 MT.
Production conditions have been favorable in MY2016/17 for apple production, due to the high
accumulation of chill hours and early blooming. Thus, exports are expected to reach 750,000
MT. The U.S. is the largest market for Chilean apples.

Source: Based in Servicio Nacional de Aduana, 2016.
Chile Export Statistics Commodity: 080810, Apples, Fresh
Calendar Year
Partner Country Volume (MT) Value (USD)
2014 2015 Variation (%) 2014 2015 Variation (%) World 820,242 628,301 -23.4% 693,288,381 517,705,764 -25.3% United States 119,574 78,290 -34.5% 105,146,957 71,501,530 -32.0% Colombia 90,741 75,593 -16.7% 73,221,748 61,084,793 -16.6% Taiwan 52,527 39,332 -25.1% 58,041,468 44,645,707 -23.1% Netherlands 64,817 42,943 -33.7% 55,012,348 33,876,275 -38.4% Saudi Arabia 33,803 39,981 18.3% 28,975,525 33,474,310 15.5% Ecuador 60,576 41,348 -31.7% 42,097,914 30,313,509 -28.0% Peru 46,810 43,715 -6.6% 30,630,292 28,755,877 -6.1% Brazil 42,577 35,820 -15.9% 34,963,281 27,446,998 -21.5% United Kingdom 41,152 25,373 -38.3% 41,391,885 24,348,936 -41.2% China 15,875 22,524 41.9% 15,122,480 21,564,094 42.6% Others 251,790 183,382 -27.2% 208,684,483 140,693,735 -32.6%
Year To Date: January - July
Partner Country Volume (MT) Value (USD)
Jan-July 2015 Jan - July 2016 Variation (%) Jan-July 2015 Jan - July 2016 Variation (%) World 512,130 595,873 16.4% 424,635,727 496,898,893 17.0% United States 74,453 100,626 35.2% 68,614,066 96,471,293 40.6% Taiwan 34,552 38,104 10.3% 38,407,733 39,926,032 4.0% Netherlands 41,917 44,565 6.3% 33,055,159 35,758,087 8.2% Colombia 50,927 45,163 -11.3% 40,667,398 34,792,498 -14.4% Saudi Arabia 37,745 41,819 10.8% 31,562,639 34,690,841 9.9% Brazil 17,901 42,368 136.7% 13,086,230 32,404,707 147.6% United Kingdom 24,524 25,448 3.8% 23,445,650 23,962,898 2.2% Canada 10,381 21,363 105.8% 9,166,764 23,026,813 151.2% India 19,997 32,189 61.0% 14,391,696 21,850,493 51.8% Peru 26,325 27,661 5.1% 16,150,604 16,114,689 -0.2% Others 173,408 176,567 1.8% 136,087,788 137,900,542 1.3%
Source: Based in Servicio Nacional de Aduana, 2016.

Production, Supply and Demand Data Statistics: Apples, Fresh 2014/2015 2015/2016 2016/2017 Market Begin Year Jan 2015 Jan 2016 Jan 2017 Chile USDA Official New Post USDA Official New Post USDA Official New Post Area Planted 37,200 37,200 36,200 36,059 0 36,000 Area Harvested 33,900 33,900 33,600 33,600 0 33,500 Bearing Trees 39,900 39,900 38,900 38,900 0 38,000 Non-Bearing Trees 2,900 2,900 2,800 2,800 0 2,500 Total Trees 42,800 42,800 41,700 41,700 0 40,500 Commercial Production 1,200,000 1,200,000 1,220,000 1,220,000 0 1,350,000 Non-Comm. Production 10,000 10,000 10,000 10,000 0 10,000 Production 1,210,000 1,210,000 1,230,000 1,230,000 0 1,360,000 Imports 2,100 2,100 1,500 1,500 0 1,500 Total Supply 1,212,100 1,212,100 1,231,500 1,231,500 0 1,361,500 Fresh Dom. Consumption 252,032 252,032 251,500 251,500 0 255,000 Exports 628,300 628,300 660,000 660,000 0 750,000 For Processing 331,768 331,768 320,000 320,000 0 356,500 Withdrawal From Market 0 0 0 0 0 0 Total Distribution 1,212,100 1,212,100 1,231,500 1,231,500 0 1,361,500
(HA) ,(1000 TREES) ,(MT)
Commodities:
Production:
Chile’s table grape production is situated between the Atacama and Maule regions. There are a
total of 48,378 ha of area planted with table grapes in these regions. Chile’s main grape varieties
produced are Red Globe, a high caliber red grape with seeds that constitutes 24.4% of planted
area, Thompson Seedless, a white seedless grape (23.9% of planted area), Crimson Seedless, red
seedless grape (16.9% of planted area), Flame Seedless, red seedless grape (15.7% of planted
area) and Superior Seedless, white seedless grape (6.5% of planted area). New varieties being
planted in Chile are Arra-15 (white seedless grape from California), Sweet Celebration (red
seedless grape from California) and Timco (red seedless grape from California).
Weather conditions MY2015/16 caused a decline in Chile’s table grape production. The spring
had low temperatures that caused an erratic bloom and the summers had high temperatures and
rain, which made the fruit more susceptible to fungus.
The Copiapó Valley in the Atacama region, which produces the earliest grapes for exports,
suffered from a flooding in March 2015 which reduced production of 1,000 ha of the 7,746 ha of
table grapes planted in that region. Current conditions suggest that harvest in Atacama region
will start around 10 days earlier than the historical harvest date due to favorable weather
conditions in MY2015/16. Like apples, table grapes benefited from the high accumulation of
chill hours, higher spring temperatures and water availability. This means table grapes from this
region could be exported by the end of November allowing exporters to receive higher prices for
the early fruit harvested.
Grapes, Table, Fresh

Consumption:
Chile’s per capita consumption of table grapes was 7.8kg in 2013 (ODEPA, 2014). As
mentioned earlier, Chile’s population is estimated at 18,191,884 in CY2016 (INE, 2016), thus
total domestic consumption is at least 142,000 MT/year.
Trade:
Chilean table grape export volume dropped 9.6% and value dropped 8.3% in MY2015/16 over
MY2014/15. Although exports to the U.S. decreased by 11.7% in volume in MY2015/16, the
U.S. still remains as the biggest market for Chilean table grapes with 45% of market share. The
main varieties exported to the U.S. are seedless: Crimson (83,000 MT exported in MY2015/16),
Thompson (80,000 MT exported in MY2015/16) and Flame (66,000 MT exported in
MY2015/16).
Chile’s export volume in MY2015/16 increased only in exports to China with a 33.3% growth
rate, but decreased in all other major markets for table grapes. The main variety sent to China
was Red Globe, adding up 100,000 MT exported in MY2015/16.
Export volume peaks in March and April, but rain that took place during mid-April 2016
damaged the late harvest varieties of grapes (see Graph “Chile: Fresh Grape export volume by
month”). Monthly volumes of exported table grapes were lower in every month of MY2015/16
except on May, which is explained by the rainfall that took place in April. This forced a
producers and exporters to work fast to move the remaining table grape harvest, as keeping
product to long in storage increased the risk of fungus disease developing (Botrytis cinerea).
Rainfall took place in mid-October 2016 from the region of Valparaiso to the south up to Maule
region. Initial assessments indicate that table grape orchards were not damaged by rains and that
products will only require the application of fungicides. A recovery of exported volumes of
730,000 MT is expected in MY2016/17 as weather conditions have been favorable.

Chile Export Statistics Commodity: 080610, Grapes, Fresh
Marketing year (October-September)
Partner Country Volume (MT) Value (USD)
MY 2013/14 MY 2014/15 Variation (%) MY 2013/14 MY 2014/15 Variation (%) World 727,875 760,841 4.5% 1,118,033,631 1,108,001,919 -0.9% United States 318,298 355,846 11.8% 418,450,515 487,982,132 16.6% China 79,124 90,201 14.0% 130,927,236 135,460,737 3.5% Korea South 47,172 50,630 7.3% 109,554,260 115,269,324 5.2% Netherlands 65,841 61,163 -7.1% 86,334,504 69,832,150 -19.1% United Kingdom 37,535 37,136 -1.1% 66,380,631 53,757,601 -19.0% Brazil 26,086 24,583 -5.8% 52,669,547 35,648,632 -32.3% Mexico 18,024 17,236 -4.4% 34,300,700 28,193,109 -17.8% Russia 22,673 16,456 -27.4% 36,908,353 23,365,014 -36.7% Canada 11,513 14,169 23.1% 15,477,915 19,615,347 26.7% Japan 10,779 10,778 0.0% 16,646,205 13,921,057 -16.4% Others 90,830 82,643 -9.0% 150,383,765 124,956,816 -16.9%
Year To Date: October - July
Partner Country Volume (MT) Value (USD)
Oct 2014- Jul 2015 Oct 2015 - Jul 2016 Variation (%) Oct 2014- Jul 2015 Oct 2015 - Jul
2016 Variation (%)
World 760,368 687,535 -9.6% 1,107,331,252 1,014,916,688 -8.3% United States 355,846 314,221 -11.7% 487,982,132 450,766,652 -7.6% China 90,200 120,259 33.3% 135,460,738 171,515,316 26.6% Netherlands 61,162 43,807 -28.4% 69,832,150 47,426,677 -32.1% Korea South 50,630 33,850 -33.1% 115,269,324 74,709,588 -35.2% United Kingdom 37,136 30,466 -18.0% 53,757,602 48,472,788 -9.8% Brazil 24,253 18,429 -24.0% 35,170,816 28,922,293 -17.8% Canada 14,169 13,132 -7.3% 19,615,348 21,736,090 10.8% Mexico 17,236 12,985 -24.7% 28,193,109 21,621,773 -23.3% Russia 16,438 11,936 -27.4% 23,328,294 17,072,649 -26.8% Japan 10,777 9,254 -14.1% 13,921,057 11,693,684 -16.0% Others 82,521 79,196 -4.0% 124,800,682 120,979,178 -3.1%
Source: Based in Servicio Nacional de Aduana and ODEPA, 2016.

Source: Based in Servicio Nacional de Aduana and ODEPA, 2016.
Policy:
The Ministry of Agriculture, through SAG (Servicio Agrícola y Ganadero) continues to carry
out the National Program for the control of Grapevine Moth Lobesia botrana.
The Strategy for Lobesia botrana (LB) in MY 2016-2017 will include the following actions:
1) Monitor LB using pheromone traps
2) Control of LB in rural and urban areas
3) Audit internal quarantine actions
4) Develop and implement a communications plan
5) Supervise and support the National Research Plan by INIA.
National program goals are:
i) Contain, suppress and eradicate the plague:
- Contention and suppress strategy in Metropolitana, O’Higgins and Maule regions.
-Eradication and suppress strategy in Atacama (Copiapó province to the south), Coquimbo,
Valparaíso, Biobío and Araucanía regions.
ii. Establish a monitoring network that allows knowledge on the distribution, absence and
population of the plague.
iii. Establish quarantine actions that avoid dispersion of the plague.
iv. Give technical support through information and compliance of conditions established by the
phytosanitary authorities in the country of destination to the SAG Sub-Department of
Phytosanitary certification. Additionally provide the technical background in order to maintain
or improve the entrance conditions of exported fruit products due to the presence of Lobesia
botrana.
v. Audit the compliance of SAG measures.
The control actions are mandatory for table grapes (Vitis vinifera), as a primary host from
Atacama region (Copiapó province to the south) to Araucanía region.
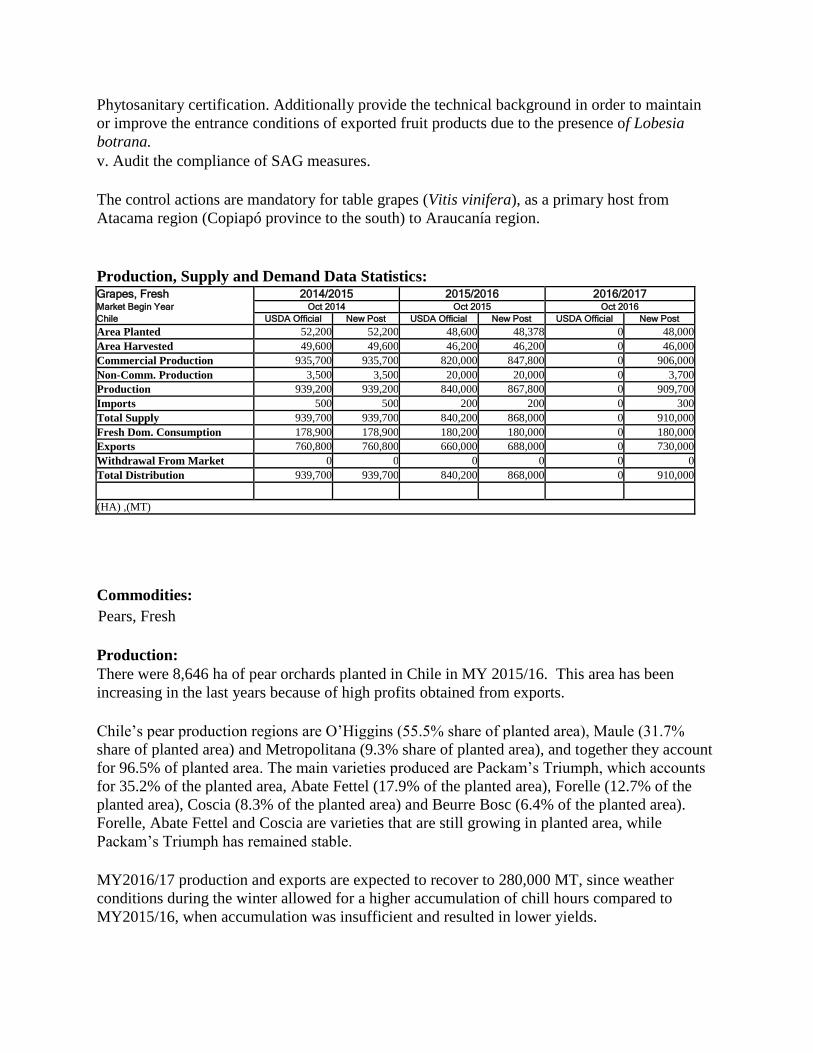
Production, Supply and Demand Data Statistics: Grapes, Fresh 2014/2015 2015/2016 2016/2017 Market Begin Year Oct 2014 Oct 2015 Oct 2016 Chile USDA Official New Post USDA Official New Post USDA Official New Post Area Planted 52,200 52,200 48,600 48,378 0 48,000 Area Harvested 49,600 49,600 46,200 46,200 0 46,000 Commercial Production 935,700 935,700 820,000 847,800 0 906,000 Non-Comm. Production 3,500 3,500 20,000 20,000 0 3,700 Production 939,200 939,200 840,000 867,800 0 909,700 Imports 500 500 200 200 0 300 Total Supply 939,700 939,700 840,200 868,000 0 910,000 Fresh Dom. Consumption 178,900 178,900 180,200 180,000 0 180,000 Exports 760,800 760,800 660,000 688,000 0 730,000 Withdrawal From Market 0 0 0 0 0 0 Total Distribution 939,700 939,700 840,200 868,000 0 910,000
(HA) ,(MT)
Commodities:
Production:
There were 8,646 ha of pear orchards planted in Chile in MY 2015/16. This area has been
increasing in the last years because of high profits obtained from exports.
Chile’s pear production regions are O’Higgins (55.5% share of planted area), Maule (31.7%
share of planted area) and Metropolitana (9.3% share of planted area), and together they account
for 96.5% of planted area. The main varieties produced are Packam’s Triumph, which accounts
for 35.2% of the planted area, Abate Fettel (17.9% of the planted area), Forelle (12.7% of the
planted area), Coscia (8.3% of the planted area) and Beurre Bosc (6.4% of the planted area).
Forelle, Abate Fettel and Coscia are varieties that are still growing in planted area, while
Packam’s Triumph has remained stable.
MY2016/17 production and exports are expected to recover to 280,000 MT, since weather
conditions during the winter allowed for a higher accumulation of chill hours compared to
MY2015/16, when accumulation was insufficient and resulted in lower yields.
Pears, Fresh

Consumption:
There is no official data for pear consumption. Data is obtained by estimating the difference
between known exports and estimated volume that goes to processing industry. Fruit
consumption in the domestic Chilean market is mainly discarded fruit that was not used for
exports.
Trade:
Chilean pear markets are diversified as follows: the Netherlands imports 18.6% Chilean pears,
Colombia imports 15.5%, the U.S. imports 13.2% and Italy 11.6% (Data for MY2014/15).
Weather conditions in MY 2015/16 also impacted pear exports, as the overall value dropped by
15.7% from January-July MY 2015/16 compared to the same period in MY 2014/15, and
volume dropped by 13.1%. Exports are expected to peak between the March-May period, but in
MY 2015/16 there is a notorious decrease in monthly export volumes compared to MY2014/15
(see graph “Chile: Pear export volume by month”).
Fresh pear exports are anticipated to rebound to 138,000 MT in MY2016/17, considering the
superior weather conditions experienced during the winter and spring.
Source: Based in Servicio Nacional de Aduana and ODEPA, 2016.

Chile Export Statistics Commodity: 080830, Pears, Fresh
Calendar Year Partner Country Volume (MT) Value (USD)
2014 2015 Variation
(%) 2014 2015 Variation (%)
World 117,023 143,726 22.8% 115,901,779 130,133,279 12.3% Netherlands 19,657 26,676 35.7% 20,818,528 25,772,000 23.8% Colombia 19,534 22,214 13.7% 20,300,049 19,837,647 -2.3% Italy 10,415 16,725 60.6% 11,385,372 15,562,457 36.7% United States 15,803 19,025 20.4% 12,335,536 15,405,830 24.9% Peru 9,467 11,311 19.5% 7,605,674 8,091,428 6.4% Ecuador 10,304 9,580 -7.0% 9,207,979 8,022,561 -12.9% Russia 5,514 6,763 22.7% 6,039,777 6,488,440 7.4% Brazil 1,842 4,258 131.2% 2,227,889 4,112,505 84.6% Spain 2,982 3,758 26.0% 3,250,896 3,921,771 20.6% Saudi Arabia 1,203 3,156 162.3% 1,303,483 3,883,400 197.9% Others 20,302 20,260 -0.2% 21,426,596 19,035,240 -11.2%
Year To Date: January - July
Partner Country Volume (MT) Value (USD) Jan-July 2015 Jan - July 2016 Variation
(%) Jan-July 2015 Jan - July 2016 Variation (%)
World 130,325 113,212 -13.1% 118,868,723 100,217,854 -15.7% Netherlands 26,676 21,046 -21.1% 25,772,000 20,495,029 -20.5% Colombia 15,628 13,992 -10.5% 14,085,635 12,157,323 -13.7% Italy 16,725 13,814 -17.4% 15,562,457 11,932,904 -23.3% United States 19,025 13,896 -27.0% 15,405,830 10,626,123 -31.0% Peru 8,379 9,221 10.0% 6,095,265 6,139,800 0.7% Russia 6,416 6,142 -4.3% 6,238,311 6,058,196 -2.9% Ecuador 7,999 7,202 -10.0% 6,552,844 5,371,268 -18.0% Saudi Arabia 3,062 3,027 -1.1% 3,758,520 3,803,524 1.2% Germany 3,819 4,032 5.6% 3,025,738 3,336,856 10.3% Brazil 3,753 2,497 -33.5% 3,706,719 2,521,419 -32.0% Others 18,843 18,343 -2.7% 18,665,404 17,775,412 -4.8%
Source: Based in Servicio Nacional de Aduana and ODEPA, 2016.

Production, Supply and Demand Data Statistics: Pears, Fresh 2014/2015 2015/2016 2016/2017 Market Begin Year Jan 2015 Jan 2016 Jan 2017 Chile USDA Official New Post USDA Official New Post USDA Official New Post Area Planted 7,300 7,300 8,400 8,646 0 8,900 Area Harvested 6,000 6,000 7,000 7,200 0 7,500 Bearing Trees 6,500 6,500 7,600 7,600 0 7,800 Non-Bearing Trees 1,200 1,200 1,400 1,400 0 1,500 Total Trees 7,700 7,700 9,000 9,000 0 9,300 Commercial Production 288,000 288,000 270,000 265,000 0 280,000 Non-Comm. Production 2,000 2,000 2,000 2,000 0 2,000 Production 290,000 290,000 272,000 267,000 0 282,000 Imports 600 600 600 700 0 600 Total Supply 290,600 290,600 272,600 267,700 0 282,600 Fresh Dom. Consumption 88,500 88,500 95,600 87,000 0 88,000 Exports 143,700 143,700 120,000 125,000 0 138,000 For Processing 58,400 58,400 57,000 55,700 0 56,600 Withdrawal From Market 0 0 0 0 0 0 Total Distribution 290,600 290,600 272,600 267,700 0 282,600
(HA) ,(1000 TREES) ,(MT)