china - peoples republic of fresh deciduous fruit … gain publications/fresh...maintain official...
TRANSCRIPT
1
THIS REPORT CONTAINS ASSESSMENTS OF COMMODITY AND TRADE ISSUES MADE BY
USDA STAFF AND NOT NECESSARILY STATEMENTS OF OFFICIAL U.S. GOVERNMENT
POLICY
Date:
GAIN Report Number:
Approved By:
Prepared By:
Report Highlights:
Post forecasts China’s apple production at 44.5 million metric tons (MMT) in MY 2017/18, up a mere
one percent from the previous year. Pear production is expected to increase by nearly 2 percent to 19
MMT and grape production is forecast to increase by 4 percent to 11.2 MMT. China’s apple and grape
imports will increase given strong demand for high quality fruit and the availability of counter-seasonal
supplies.
Abraham Inouye
Michael Ward
Chinese Demand for High Quality Fruit Continues To Increase
Fresh Deciduous Fruit Annual
China - Peoples Republic of
CH17058
11/1/2017
Required Report - public distribution
2
Production
Apples
China’s apple production is forecast at 44.5 million metric tons (MMT) in marketing year (MY) 2017/18
(July-June), up a mere one percent from the revised number in the previous year. Prolonged heat and
drought hit northern China during spring and summer, causing apple production to decrease by 5 to 10
percent in eastern producing provinces such as Shandong, Hebei, and Liaoning. In the western
producing provinces including Shaanxi, Shanxi, and Gansu, apple production is likely to continue
increasing under relatively normal growing conditions, offsetting crop losses in the east. The drought
has also resulted in smaller fruit sizes, especially in the eastern region (refer to table below for major
apple-producing regions in China).
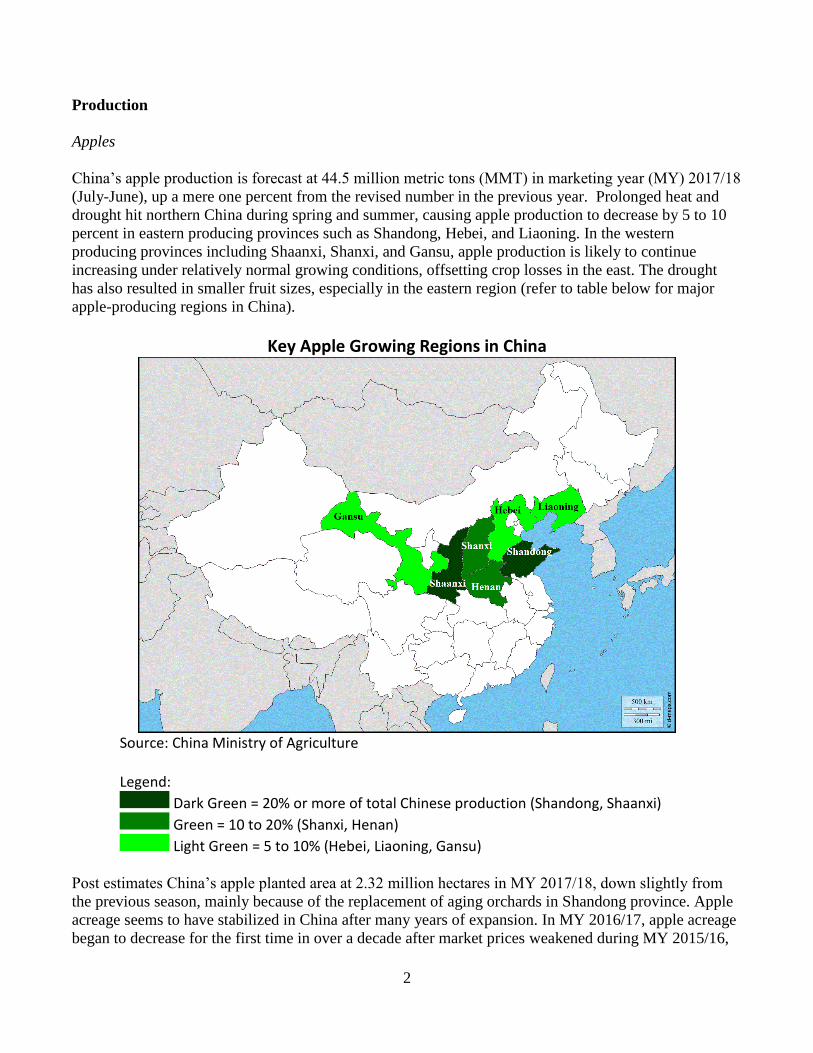
Key Apple Growing Regions in China
Source: China Ministry of Agriculture
Legend:
Dark Green = 20% or more of total Chinese production (Shandong, Shaanxi)
Green = 10 to 20% (Shanxi, Henan)
Light Green = 5 to 10% (Hebei, Liaoning, Gansu)
Post estimates China’s apple planted area at 2.32 million hectares in MY 2017/18, down slightly from
the previous season, mainly because of the replacement of aging orchards in Shandong province. Apple
acreage seems to have stabilized in China after many years of expansion. In MY 2016/17, apple acreage
began to decrease for the first time in over a decade after market prices weakened during MY 2015/16,
3
according to statistics by the Ministry of Agriculture. Fuji varieties, which are harvested in early or mid-
October, still dominate apple production in China, accounting for more than 70 percent of the total
production. Other varieties include Gala, Red Delicious, Guoguang, etc.
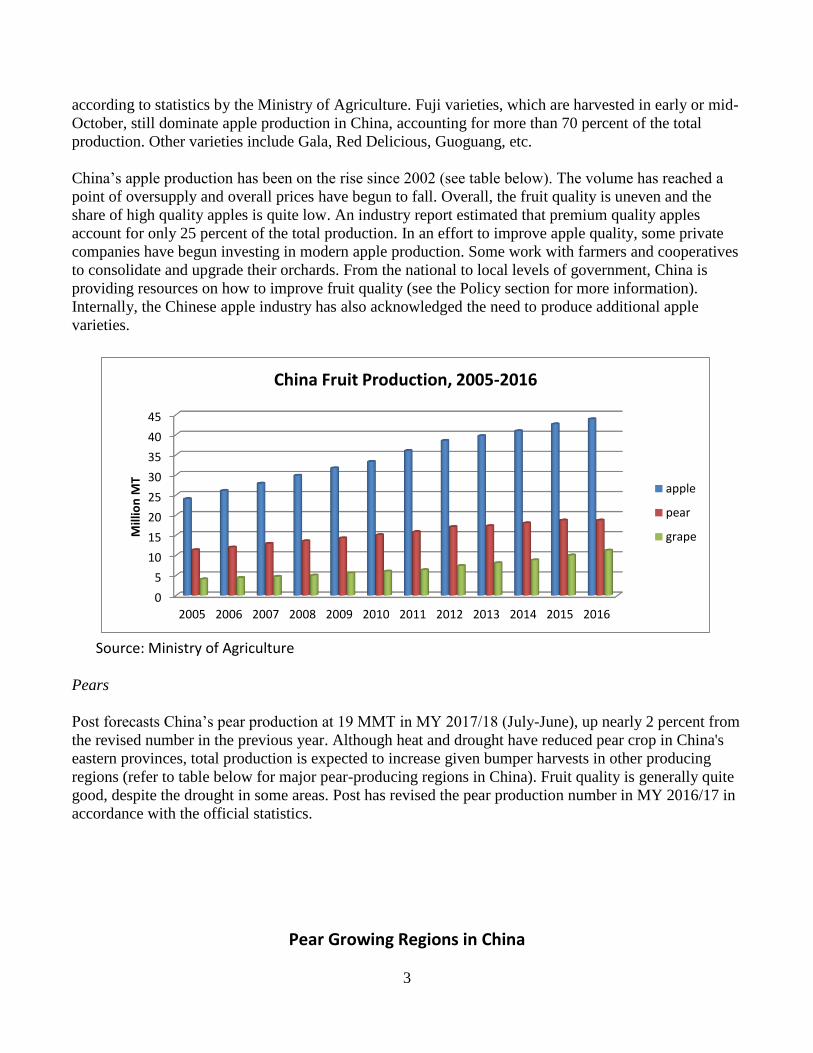
China’s apple production has been on the rise since 2002 (see table below). The volume has reached a
point of oversupply and overall prices have begun to fall. Overall, the fruit quality is uneven and the
share of high quality apples is quite low. An industry report estimated that premium quality apples
account for only 25 percent of the total production. In an effort to improve apple quality, some private
companies have begun investing in modern apple production. Some work with farmers and cooperatives
to consolidate and upgrade their orchards. From the national to local levels of government, China is
providing resources on how to improve fruit quality (see the Policy section for more information).
Internally, the Chinese apple industry has also acknowledged the need to produce additional apple
varieties.
0
5
10
15
20
25
30
35
40
45
2005 2006 2007 2008 2009 2010 2011 2012 2013 2014 2015 2016
Mill
ion
MT
China Fruit Production, 2005-2016
apple
pear
grape
Source: Ministry of Agriculture
Pears
Post forecasts China’s pear production at 19 MMT in MY 2017/18 (July-June), up nearly 2 percent from
the revised number in the previous year. Although heat and drought have reduced pear crop in China's
eastern provinces, total production is expected to increase given bumper harvests in other producing
regions (refer to table below for major pear-producing regions in China). Fruit quality is generally quite
good, despite the drought in some areas. Post has revised the pear production number in MY 2016/17 in
accordance with the official statistics.
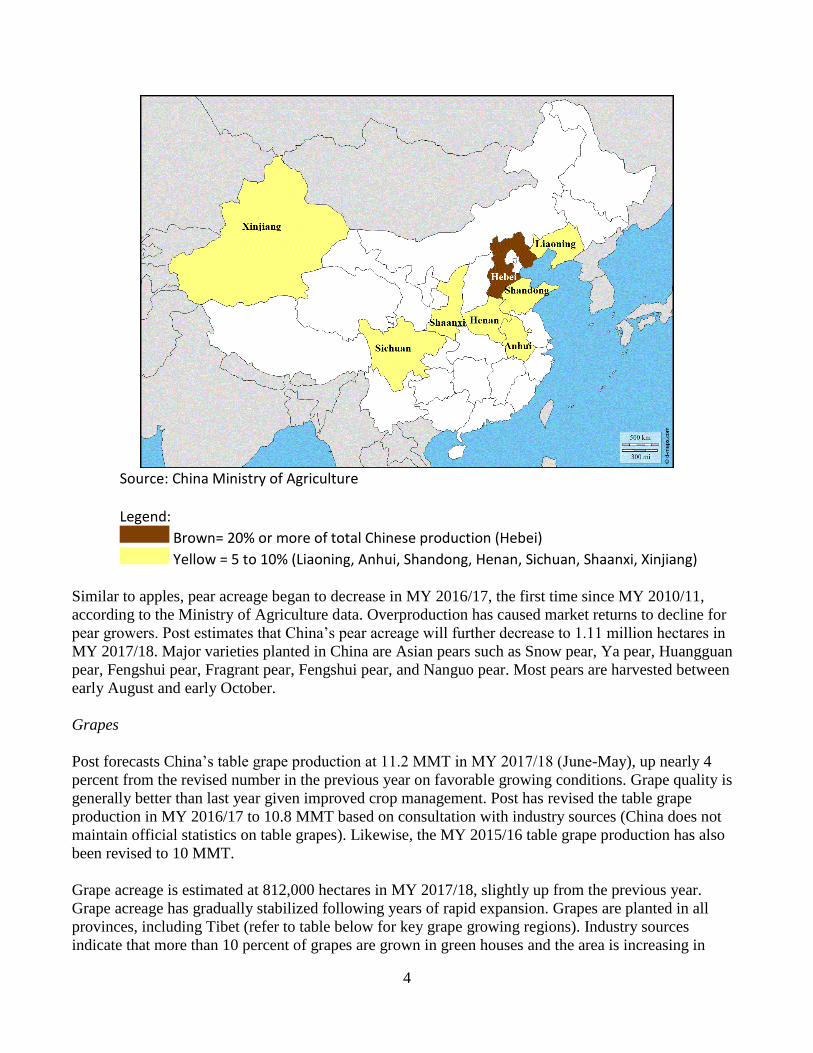
Pear Growing Regions in China
4
Source: China Ministry of Agriculture
Legend:
Brown= 20% or more of total Chinese production (Hebei)
Yellow = 5 to 10% (Liaoning, Anhui, Shandong, Henan, Sichuan, Shaanxi, Xinjiang)
Similar to apples, pear acreage began to decrease in MY 2016/17, the first time since MY 2010/11,
according to the Ministry of Agriculture data. Overproduction has caused market returns to decline for
pear growers. Post estimates that China’s pear acreage will further decrease to 1.11 million hectares in
MY 2017/18. Major varieties planted in China are Asian pears such as Snow pear, Ya pear, Huangguan
pear, Fengshui pear, Fragrant pear, Fengshui pear, and Nanguo pear. Most pears are harvested between
early August and early October.
Grapes
Post forecasts China’s table grape production at 11.2 MMT in MY 2017/18 (June-May), up nearly 4
percent from the revised number in the previous year on favorable growing conditions. Grape quality is
generally better than last year given improved crop management. Post has revised the table grape
production in MY 2016/17 to 10.8 MMT based on consultation with industry sources (China does not
maintain official statistics on table grapes). Likewise, the MY 2015/16 table grape production has also
been revised to 10 MMT.
Grape acreage is estimated at 812,000 hectares in MY 2017/18, slightly up from the previous year.
Grape acreage has gradually stabilized following years of rapid expansion. Grapes are planted in all
provinces, including Tibet (refer to table below for key grape growing regions). Industry sources
indicate that more than 10 percent of grapes are grown in green houses and the area is increasing in
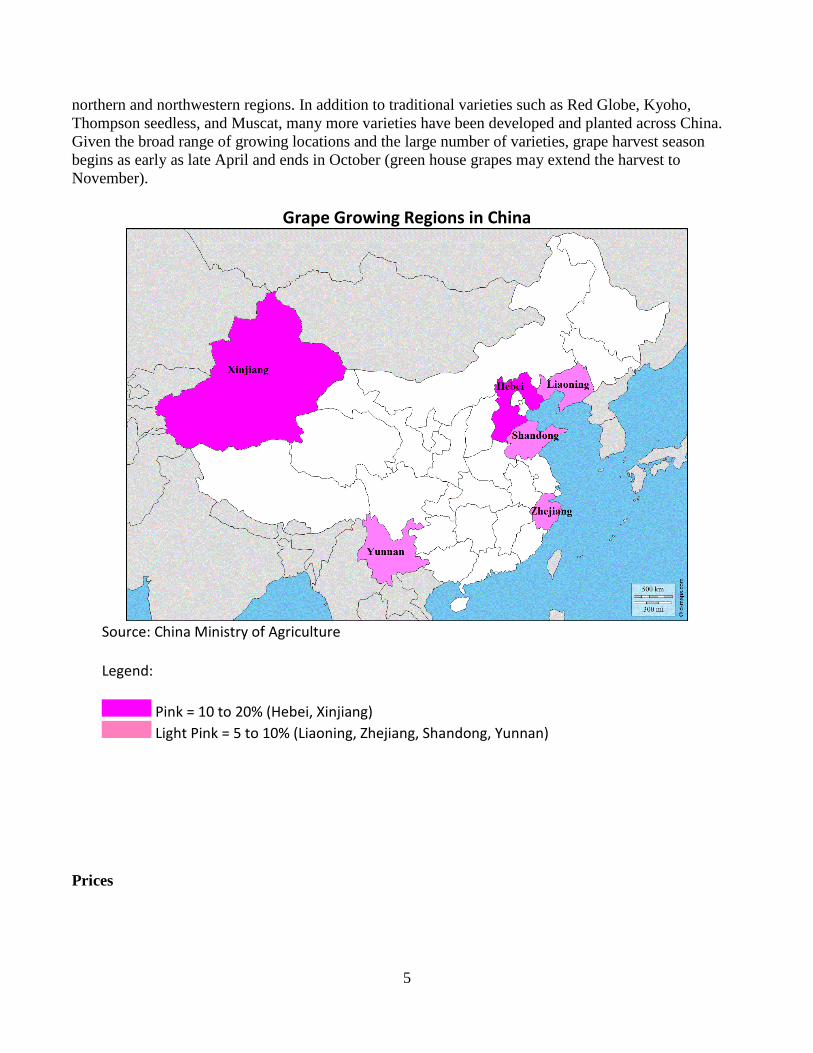
5
northern and northwestern regions. In addition to traditional varieties such as Red Globe, Kyoho,
Thompson seedless, and Muscat, many more varieties have been developed and planted across China.
Given the broad range of growing locations and the large number of varieties, grape harvest season
begins as early as late April and ends in October (green house grapes may extend the harvest to
November).
Grape Growing Regions in China
Source: China Ministry of Agriculture Legend:
Pink = 10 to 20% (Hebei, Xinjiang)
Light Pink = 5 to 10% (Liaoning, Zhejiang, Shandong, Yunnan)
Prices
6
0123456789
RM
B/k
g
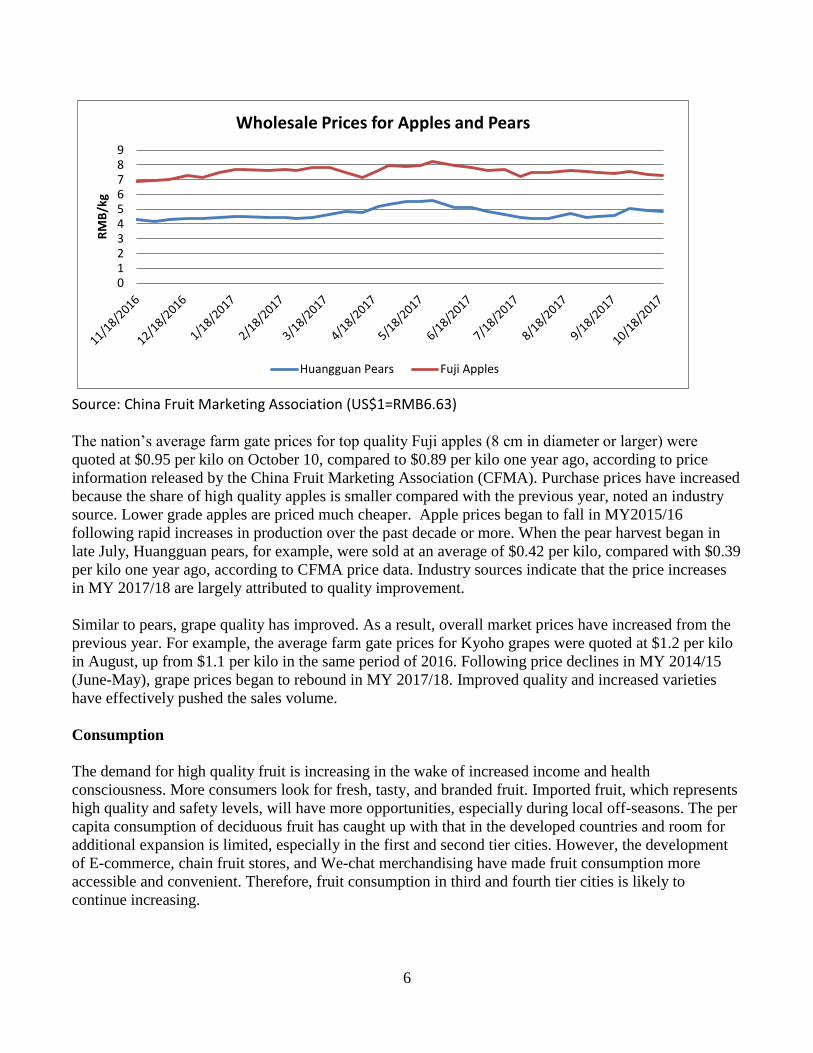
Wholesale Prices for Apples and Pears
Huangguan Pears Fuji Apples
Source: China Fruit Marketing Association (US$1=RMB6.63)
The nation’s average farm gate prices for top quality Fuji apples (8 cm in diameter or larger) were
quoted at $0.95 per kilo on October 10, compared to $0.89 per kilo one year ago, according to price
information released by the China Fruit Marketing Association (CFMA). Purchase prices have increased
because the share of high quality apples is smaller compared with the previous year, noted an industry
source. Lower grade apples are priced much cheaper. Apple prices began to fall in MY2015/16
following rapid increases in production over the past decade or more. When the pear harvest began in
late July, Huangguan pears, for example, were sold at an average of $0.42 per kilo, compared with $0.39
per kilo one year ago, according to CFMA price data. Industry sources indicate that the price increases
in MY 2017/18 are largely attributed to quality improvement.
Similar to pears, grape quality has improved. As a result, overall market prices have increased from the
previous year. For example, the average farm gate prices for Kyoho grapes were quoted at $1.2 per kilo
in August, up from $1.1 per kilo in the same period of 2016. Following price declines in MY 2014/15
(June-May), grape prices began to rebound in MY 2017/18. Improved quality and increased varieties
have effectively pushed the sales volume.
Consumption
The demand for high quality fruit is increasing in the wake of increased income and health
consciousness. More consumers look for fresh, tasty, and branded fruit. Imported fruit, which represents
high quality and safety levels, will have more opportunities, especially during local off-seasons. The per
capita consumption of deciduous fruit has caught up with that in the developed countries and room for
additional expansion is limited, especially in the first and second tier cities. However, the development
of E-commerce, chain fruit stores, and We-chat merchandising have made fruit consumption more
accessible and convenient. Therefore, fruit consumption in third and fourth tier cities is likely to
continue increasing.
7
Apples are the most popular fruit consumed in China, but are losing popularity because of limited
varieties and the increased availability of other fruits. Pears are less popular than apples. Although pears
are also available during the entire year due to cold storage facilities, they are not favored during the
winter time. Grapes are the current favorite deciduous fruit among Chinese consumers, with a focus on
flavor. While consumers in southern China like juicy grape varieties such as Kyoho, northern consumers
prefer firmer grape varieties like Red Globe. With increased varieties and improved quality, grape
consumption will continue to pick up.
Policy
Given sufficient domestic supplies of most fruit in China, the Chinese government is focusing its efforts
on guiding farmers to improve fruit quality and safety. Earlier this year, the Ministry of Agriculture
(MOA) published the Plan on the Enhancement of Quality and Safety of Agriculture Products during
the 13th
Five-Year (2016-2020). According to the plan, apples have been selected as one of the
agriculture products to establish a trial traceability system. Five provinces will enroll in the program by
the end of 2017. On February 8, 2017, the Ministry of Agriculture released an Action Plan on Using
Organic Fertilizers as Substitutes on Fruit, Vegetables, and Tea Crops. This announcement describes
the government's plan to select 100 key fruit, vegetable, and tea producing counties to participate in a
demonstration program on organic fertilizer substitution. The goal is to reduce the use of chemical
fertilizers by 20 percent in major fruit, vegetable, and tea producing regions by 2020. Chinese farmers
use far more chemical fertilizers than those in developed countries. For example, the per-unit application
of chemical fertilizers on fruit crops in China is six times of the level in the United States, according to
an MOA report.
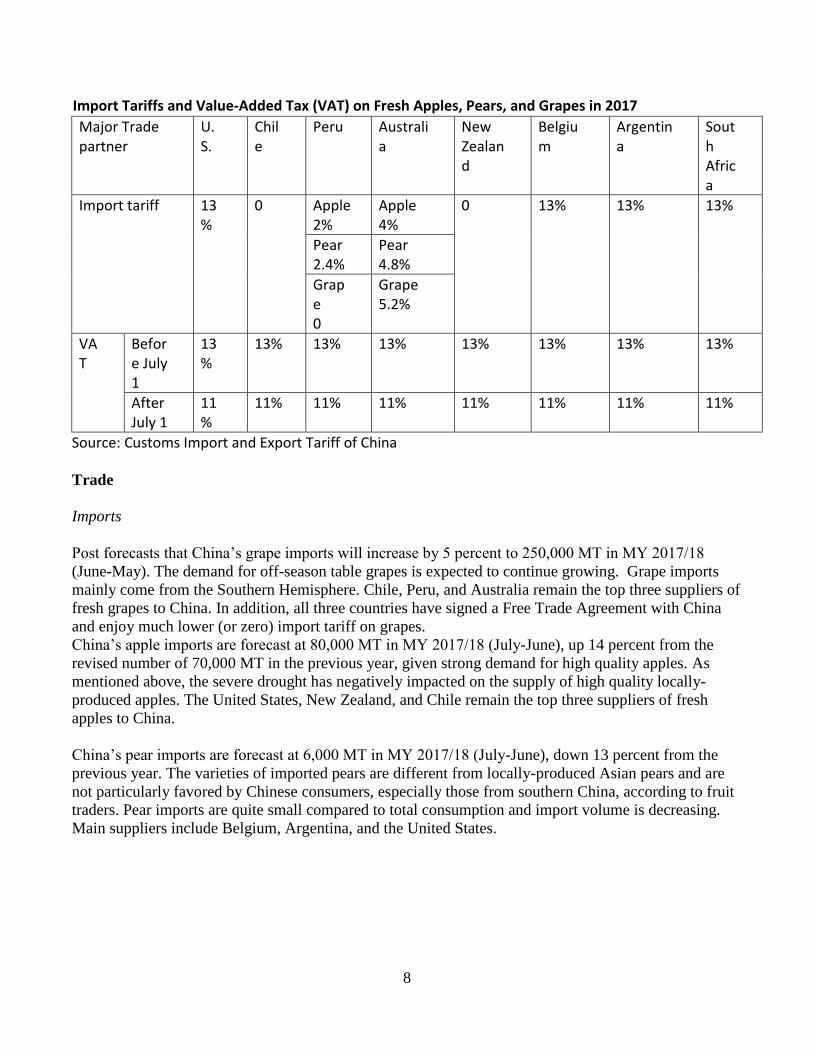
The Chinese government decided to lower the value-added tax (VAT) for all agricultural products,
including imported products, from 13 percent to 11 percent effective on July 1, 2017. The import tariffs
for fresh fruit remain unchanged in 2017, except for countries like Australia who have signed a free
trade agreement (FTA) with China (see table below).
8
Import Tariffs and Value-Added Tax (VAT) on Fresh Apples, Pears, and Grapes in 2017
Major Trade partner
U. S.
Chile
Peru Australia
New Zealand
Belgium
Argentina
South Africa
Import tariff 13%
0
Apple 2%
Apple 4%
0 13% 13% 13%
Pear 2.4%
Pear 4.8%
Grape 0
Grape 5.2%
VAT
Before July 1
13%
13% 13% 13% 13% 13% 13% 13%
After July 1
11%
11% 11% 11% 11% 11% 11% 11%
Source: Customs Import and Export Tariff of China
Trade
Imports
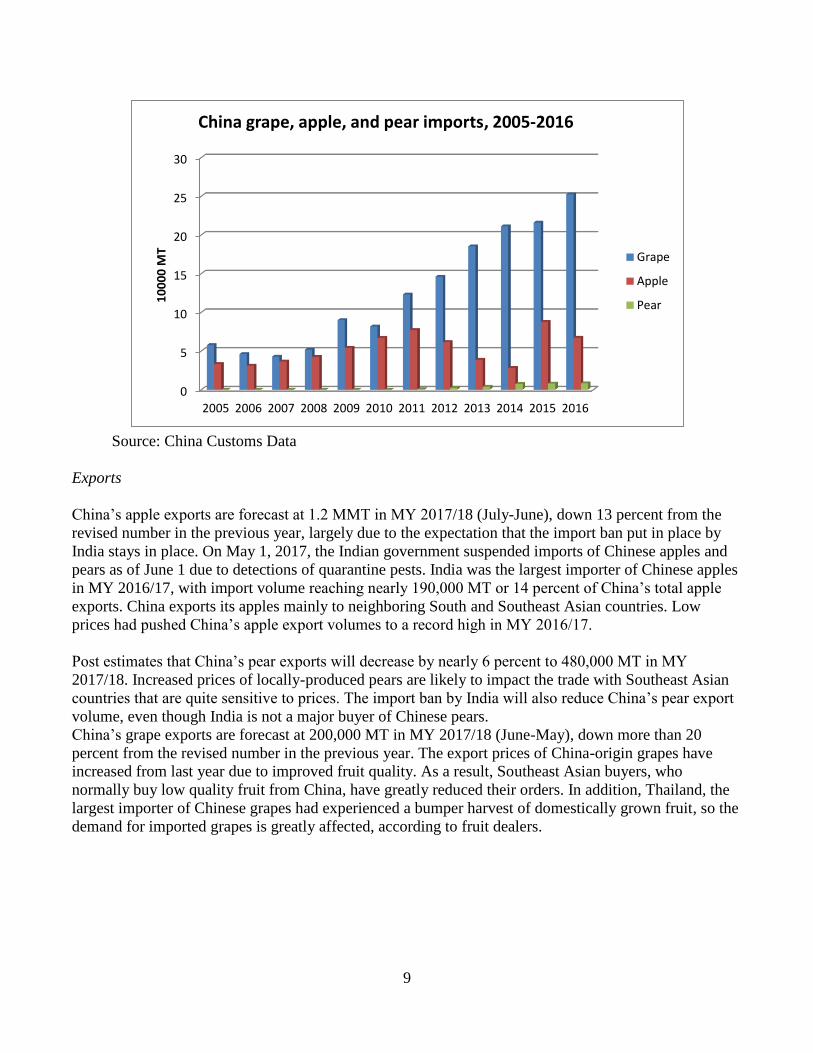
Post forecasts that China’s grape imports will increase by 5 percent to 250,000 MT in MY 2017/18
(June-May). The demand for off-season table grapes is expected to continue growing. Grape imports
mainly come from the Southern Hemisphere. Chile, Peru, and Australia remain the top three suppliers of
fresh grapes to China. In addition, all three countries have signed a Free Trade Agreement with China
and enjoy much lower (or zero) import tariff on grapes.
China’s apple imports are forecast at 80,000 MT in MY 2017/18 (July-June), up 14 percent from the
revised number of 70,000 MT in the previous year, given strong demand for high quality apples. As
mentioned above, the severe drought has negatively impacted on the supply of high quality locally-
produced apples. The United States, New Zealand, and Chile remain the top three suppliers of fresh
apples to China.
China’s pear imports are forecast at 6,000 MT in MY 2017/18 (July-June), down 13 percent from the
previous year. The varieties of imported pears are different from locally-produced Asian pears and are
not particularly favored by Chinese consumers, especially those from southern China, according to fruit
traders. Pear imports are quite small compared to total consumption and import volume is decreasing.
Main suppliers include Belgium, Argentina, and the United States.
9
0
5
10
15
20
25
30
2005 2006 2007 2008 2009 2010 2011 2012 2013 2014 2015 2016
10
00
0 M
T
China grape, apple, and pear imports, 2005-2016
Grape
Apple
Pear
Source: China Customs Data
Exports
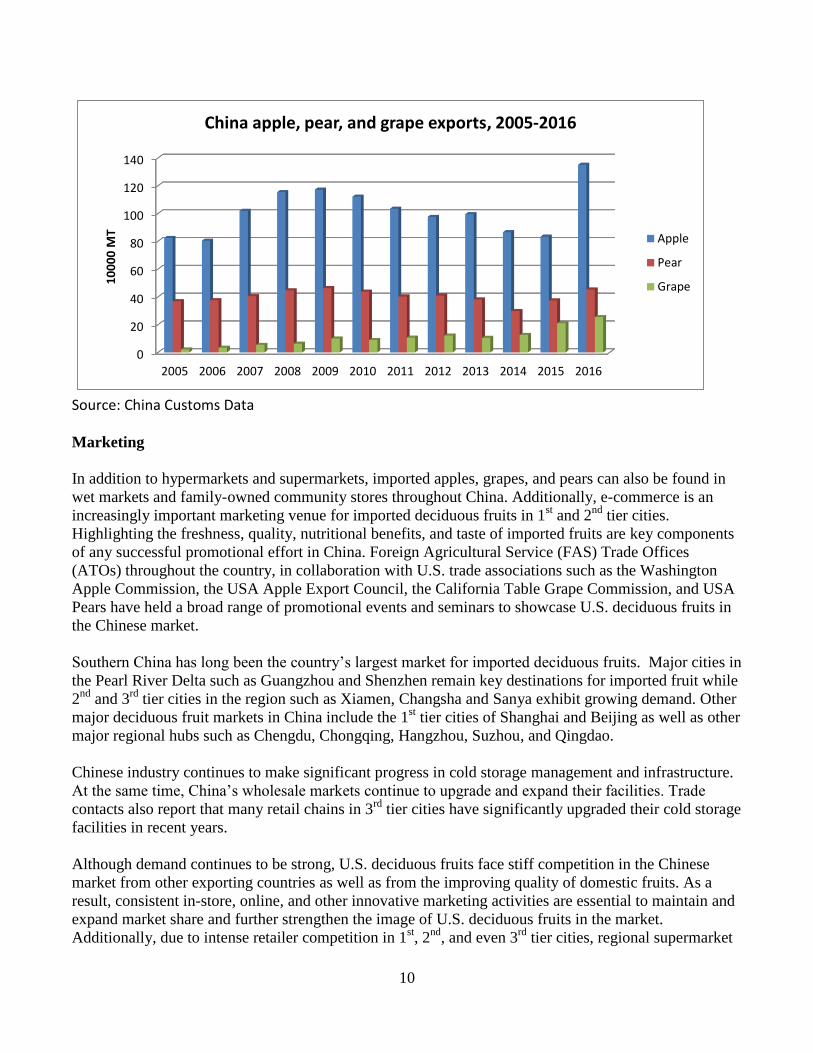
China’s apple exports are forecast at 1.2 MMT in MY 2017/18 (July-June), down 13 percent from the
revised number in the previous year, largely due to the expectation that the import ban put in place by
India stays in place. On May 1, 2017, the Indian government suspended imports of Chinese apples and
pears as of June 1 due to detections of quarantine pests. India was the largest importer of Chinese apples
in MY 2016/17, with import volume reaching nearly 190,000 MT or 14 percent of China’s total apple
exports. China exports its apples mainly to neighboring South and Southeast Asian countries. Low
prices had pushed China’s apple export volumes to a record high in MY 2016/17.
Post estimates that China’s pear exports will decrease by nearly 6 percent to 480,000 MT in MY
2017/18. Increased prices of locally-produced pears are likely to impact the trade with Southeast Asian
countries that are quite sensitive to prices. The import ban by India will also reduce China’s pear export
volume, even though India is not a major buyer of Chinese pears.
China’s grape exports are forecast at 200,000 MT in MY 2017/18 (June-May), down more than 20
percent from the revised number in the previous year. The export prices of China-origin grapes have
increased from last year due to improved fruit quality. As a result, Southeast Asian buyers, who
normally buy low quality fruit from China, have greatly reduced their orders. In addition, Thailand, the
largest importer of Chinese grapes had experienced a bumper harvest of domestically grown fruit, so the
demand for imported grapes is greatly affected, according to fruit dealers.
10
0
20
40
60
80
100
120
140
2005 2006 2007 2008 2009 2010 2011 2012 2013 2014 2015 2016
10
00
0 M
TChina apple, pear, and grape exports, 2005-2016
Apple
Pear
Grape
Source: China Customs Data
Marketing
In addition to hypermarkets and supermarkets, imported apples, grapes, and pears can also be found in
wet markets and family-owned community stores throughout China. Additionally, e-commerce is an
increasingly important marketing venue for imported deciduous fruits in 1st and 2
nd tier cities.
Highlighting the freshness, quality, nutritional benefits, and taste of imported fruits are key components
of any successful promotional effort in China. Foreign Agricultural Service (FAS) Trade Offices
(ATOs) throughout the country, in collaboration with U.S. trade associations such as the Washington
Apple Commission, the USA Apple Export Council, the California Table Grape Commission, and USA
Pears have held a broad range of promotional events and seminars to showcase U.S. deciduous fruits in
the Chinese market.
Southern China has long been the country’s largest market for imported deciduous fruits. Major cities in
the Pearl River Delta such as Guangzhou and Shenzhen remain key destinations for imported fruit while
2nd
and 3rd
tier cities in the region such as Xiamen, Changsha and Sanya exhibit growing demand. Other
major deciduous fruit markets in China include the 1st tier cities of Shanghai and Beijing as well as other
major regional hubs such as Chengdu, Chongqing, Hangzhou, Suzhou, and Qingdao.
Chinese industry continues to make significant progress in cold storage management and infrastructure.
At the same time, China’s wholesale markets continue to upgrade and expand their facilities. Trade
contacts also report that many retail chains in 3rd
tier cities have significantly upgraded their cold storage
facilities in recent years.
Although demand continues to be strong, U.S. deciduous fruits face stiff competition in the Chinese
market from other exporting countries as well as from the improving quality of domestic fruits. As a
result, consistent in-store, online, and other innovative marketing activities are essential to maintain and
expand market share and further strengthen the image of U.S. deciduous fruits in the market.
Additionally, due to intense retailer competition in 1st, 2
nd, and even 3
rd tier cities, regional supermarket
11
chains and distributors constantly look to differentiate themselves by sourcing new-to-market products.
As a result, U.S suppliers should always strive to introduce new deciduous fruit varieties into the
Chinese market when possible, as opportunities abound.
Apples
Due to steady retail chain expansion into 2nd,
and 3rd
tier cities, U.S. apples can now be found on the
shelves of most hypermarkets and supermarkets throughout China. In addition to the United States, other
recent major apple suppliers to China include New Zealand, Chile, and Poland. Despite this competition,
demand is on the rise and U.S. apples have gained significant market share over the past year. South
China is the main importing region for U.S. apples, with Guangdong ports taking in 60-70 percent of
China’s total imports.
Red Delicious, Gala, and Granny Smith are the dominant U.S. apples in the Chinese market and are
mostly available from August through March. These varieties are popular as gifts during national
holidays such as the Mid-Autumn Festival and Chinese New Year. In addition to frequent in-store
promotions and outreach activities, ATOs in China have also collaborated with the Washington Apple
Commission and the USA Apple Export Council to showcase U.S. apples via giant Chinese online
shopping platforms and numerous small-scale e-commerce operations. According to several trade
contacts established during these activities, major retailers consistently express interest in sourcing new
apple varieties from the United States.
Pears
U.S. pears have strong potential in the Chinese market but face strong competition from domestically
produced pears and from other imported varieties from multiple countries (e.g. Belgium, Argentina and
the Netherlands). The major importing ports for U.S. pears are Dalian, Guangzhou, and Shanghai. The
three most commonly found U.S. varieties in the Chinese market include Starkrimson, Red Anjou, and
Green Anjou. All three of these varieties are readily available in higher-end supermarkets in 1st tier
cities.
Per trade contacts, many retailers (especially in the 2nd
and 3rd
tier cities) lack sufficient awareness of the
availability and proper handling techniques for U.S. pears. Accordingly, ATOs in China have recently
collaborated with USA Pears in outreach activities/seminars in emerging market regions of the country
to educate retailers, traders, and consumers on the seasonality, quality attributes and best handling
practices for U.S. varieties.
Table Grapes
U.S. table grapes are highly prevalent in supermarkets and specialized fruit retail chains in 1st, 2
nd and
3rd
tier cities throughout China from August to January. Other major table grape suppliers to China
include Peru and Chile. In 2016, an estimated 85 percent of U.S. table grapes entered China through
South China ports (such as Shenzhen and Guangzhou).
Over the past few years, U.S. seedless Red Globe, Autumn Royal, Thompson, and Crimson varieties
have largely replaced the U.S. seeded Red Globe variety in the Chinese market. Retail contacts report
12
this change is a result of robust consumer demand for high quality seedless varieties combined with the
fact that importers now prefer to trade in U.S. seedless varieties as the profit margin is much higher.
Retail contacts report that in-store promotions with point-of-sale materials and decorations highlighting
attributes of imported grapes have proven to dramatically increase sales. Retail contacts also report that
timing promotional events with major Chinese holidays can be especially effective and that there are a
growing number of consumers (especially in 1st tier markets) that are willing to pay a significant
premium for high quality, new-to-market varieties. ATOs in China have collaborated with the California
Table Grape Commission and multiple national retail chains in frequent in-store promotions and
educational seminars to showcase the high quality and availability of U.S. table grapes in the Chinese
market.
13
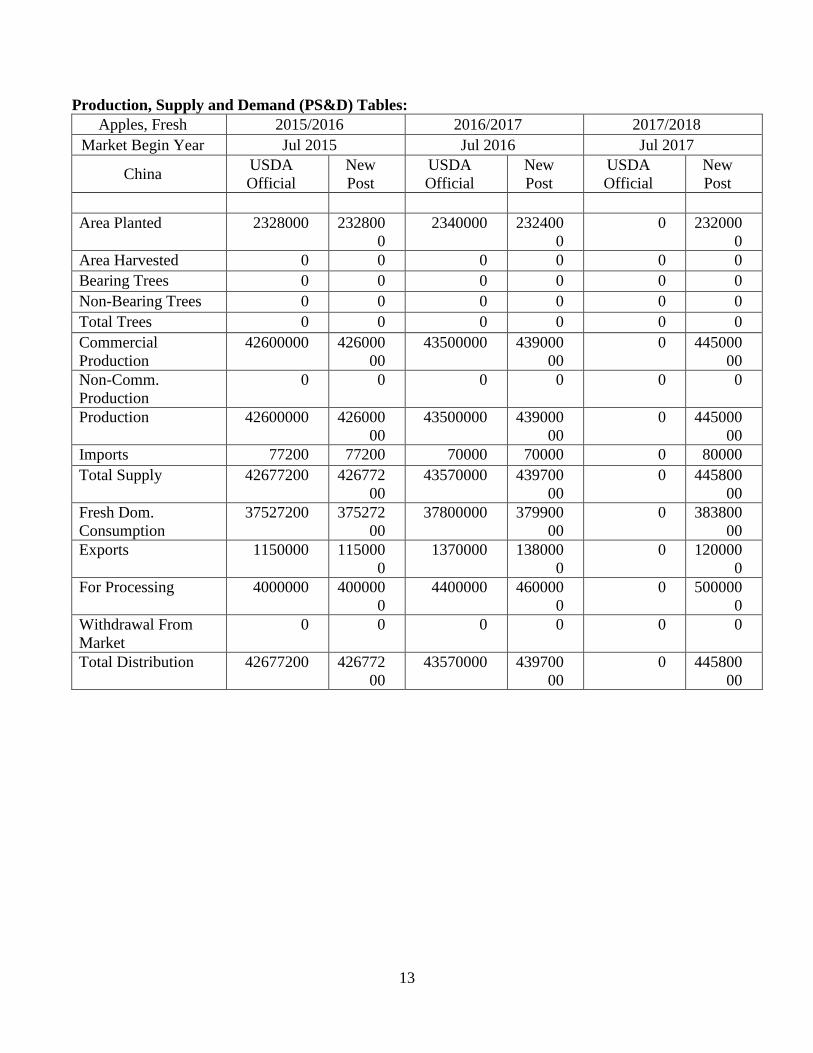
Production, Supply and Demand (PS&D) Tables:
Apples, Fresh 2015/2016 2016/2017 2017/2018
Market Begin Year Jul 2015 Jul 2016 Jul 2017
China USDA
Official
New
Post
USDA
Official
New
Post
USDA
Official
New
Post
Area Planted 2328000 232800
0
2340000 232400
0
0 232000
0
Area Harvested 0 0 0 0 0 0
Bearing Trees 0 0 0 0 0 0
Non-Bearing Trees 0 0 0 0 0 0
Total Trees 0 0 0 0 0 0
Commercial
Production
42600000 426000
00
43500000 439000
00
0 445000
00
Non-Comm.
Production
0 0 0 0 0 0
Production 42600000 426000
00
43500000 439000
00
0 445000
00
Imports 77200 77200 70000 70000 0 80000
Total Supply 42677200 426772
00
43570000 439700
00
0 445800
00
Fresh Dom.
Consumption
37527200 375272
00
37800000 379900
00
0 383800
00
Exports 1150000 115000
0
1370000 138000
0
0 120000
0
For Processing 4000000 400000
0
4400000 460000
0
0 500000
0
Withdrawal From
Market
0 0 0 0 0 0
Total Distribution 42677200 426772
00
43570000 439700
00
0 445800
00
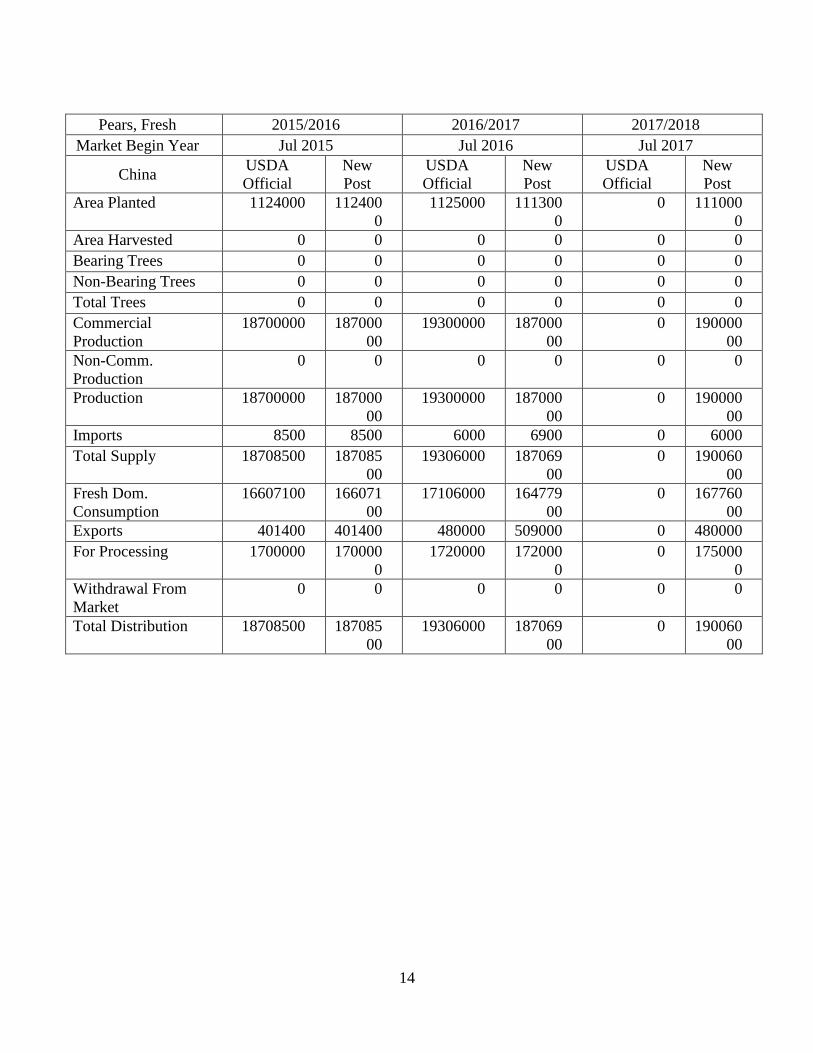
14
Pears, Fresh 2015/2016 2016/2017 2017/2018
Market Begin Year Jul 2015 Jul 2016 Jul 2017
China USDA
Official
New
Post
USDA
Official
New
Post
USDA
Official
New
Post
Area Planted 1124000 112400
0
1125000 111300
0
0 111000
0
Area Harvested 0 0 0 0 0 0
Bearing Trees 0 0 0 0 0 0
Non-Bearing Trees 0 0 0 0 0 0
Total Trees 0 0 0 0 0 0
Commercial
Production
18700000 187000
00
19300000 187000
00
0 190000
00
Non-Comm.
Production
0 0 0 0 0 0
Production 18700000 187000
00
19300000 187000
00
0 190000
00
Imports 8500 8500 6000 6900 0 6000
Total Supply 18708500 187085
00
19306000 187069
00
0 190060
00
Fresh Dom.
Consumption
16607100 166071
00
17106000 164779
00
0 167760
00
Exports 401400 401400 480000 509000 0 480000
For Processing 1700000 170000
0
1720000 172000
0
0 175000
0
Withdrawal From
Market
0 0 0 0 0 0
Total Distribution 18708500 187085
00
19306000 187069
00
0 190060
00
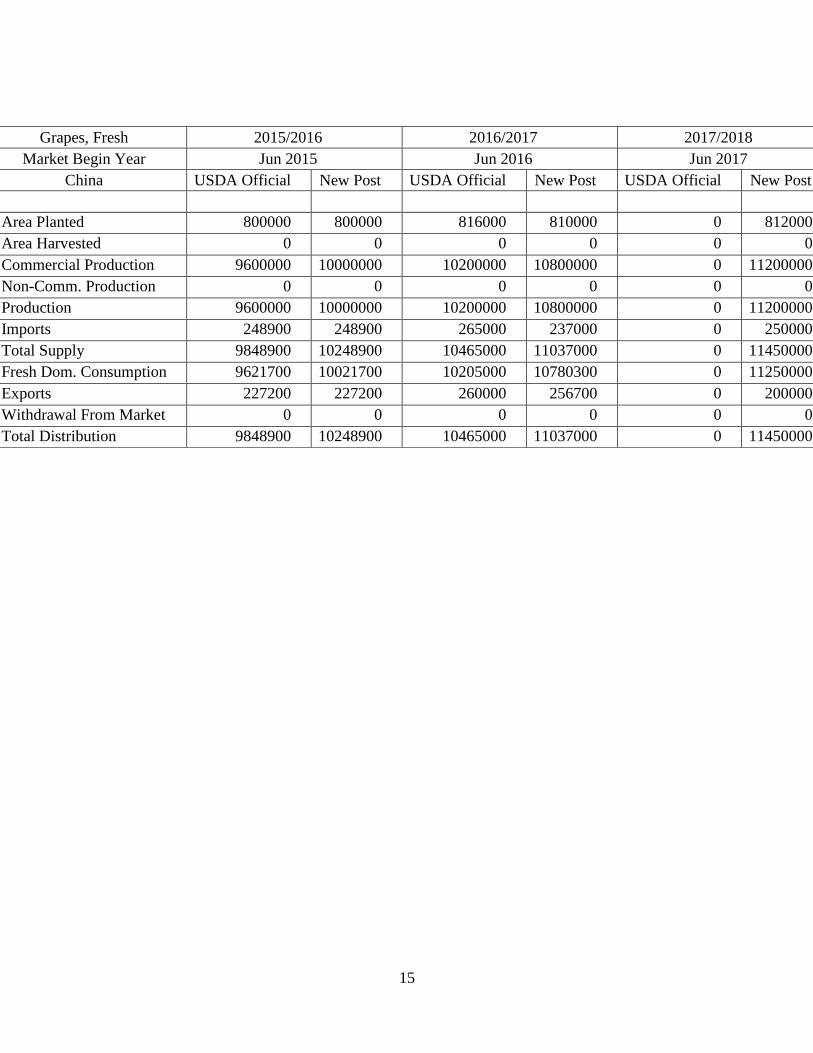
15
Grapes, Fresh 2015/2016 2016/2017 2017/2018
Market Begin Year Jun 2015 Jun 2016 Jun 2017
China USDA Official New Post USDA Official New Post USDA Official New Post
Area Planted 800000 800000 816000 810000 0 812000
Area Harvested 0 0 0 0 0 0
Commercial Production 9600000 10000000 10200000 10800000 0 11200000
Non-Comm. Production 0 0 0 0 0 0
Production 9600000 10000000 10200000 10800000 0 11200000
Imports 248900 248900 265000 237000 0 250000
Total Supply 9848900 10248900 10465000 11037000 0 11450000
Fresh Dom. Consumption 9621700 10021700 10205000 10780300 0 11250000
Exports 227200 227200 260000 256700 0 200000
Withdrawal From Market 0 0 0 0 0 0
Total Distribution 9848900 10248900 10465000 11037000 0 11450000