south africa - republic of fresh deciduous fruit annual ... gain publications/fresh deciduous... ·...
TRANSCRIPT
THIS REPORT CONTAINS ASSESSMENTS OF COMMODITY AND TRADE ISSUES MADE BY
USDA STAFF AND NOT NECESSARILY STATEMENTS OF OFFICIAL U.S. GOVERNMENT
POLICY
Date:
GAIN Report Number:
Approved By:
Prepared By:
Report Highlights:
The South African deciduous fruit industry continues to grapple with escalating input costs and the
rising cost of labor. The Western Cape suffered rampant labor strikes, which began in early 2013 and
continued through the end of the year. Despite this, South African table grape exports are up over 15
percent on the year in 2013, likely supported by a relatively weak Rand. Meanwhile, post forecasts
approximate three percent growth in production and exports for apples and pears.
Corey Pickelsimer
Corey Pickelsimer
South African Deciduous Exports Increase on a Weak Rand
Fresh Deciduous Fruit Annual
South Africa - Republic of
12/11/2013
Required Report - public distribution
Executive Summary:
Deciduous fruit is the largest sub-sector when measured in terms of hectares under plantation in South
Africa. There are about 77,805 hectares of land carrying deciduous fruit in South Africa as reported in
MY 2011 Hortgro Key Deciduous Fruit Statistics. Of the deciduous fruit grown about 33 percent are
grapes (fresh and dried); the second most grown is apples at 29 percent; followed by pears at 15 percent;
peaches (ten percent); plums (six percent); apricot (four percent) and nectarine (three percent).
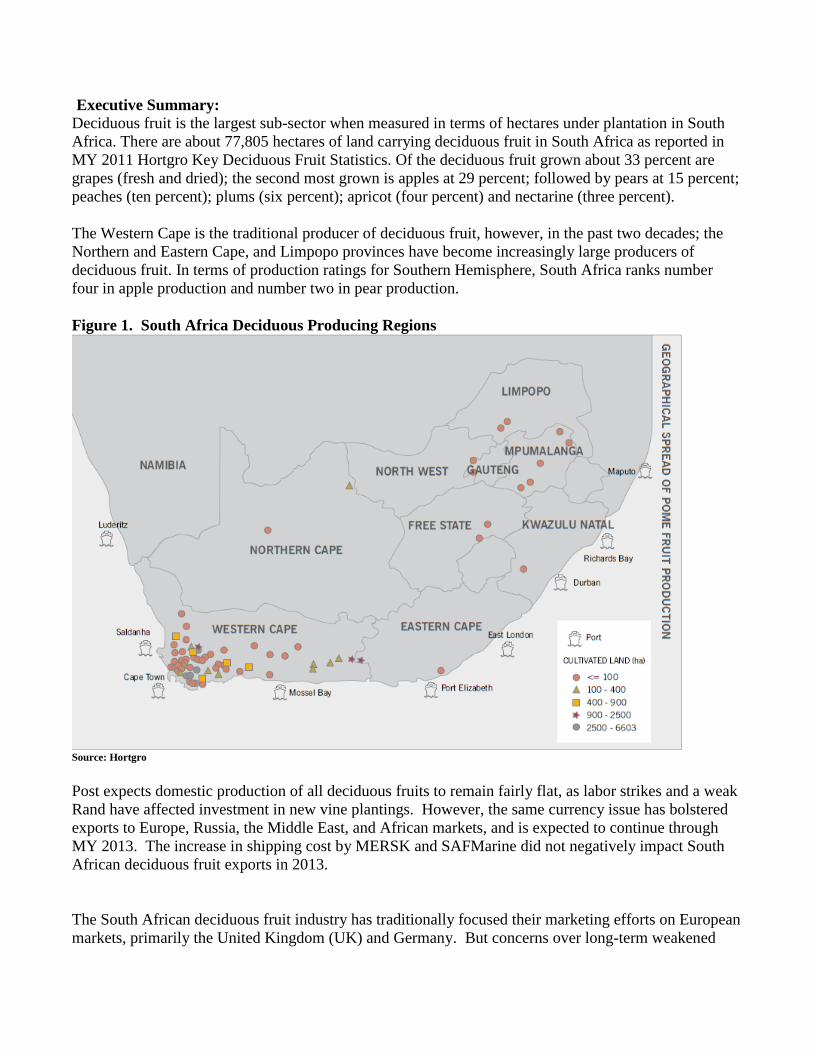
The Western Cape is the traditional producer of deciduous fruit, however, in the past two decades; the
Northern and Eastern Cape, and Limpopo provinces have become increasingly large producers of
deciduous fruit. In terms of production ratings for Southern Hemisphere, South Africa ranks number
four in apple production and number two in pear production.
Figure 1. South Africa Deciduous Producing Regions
Source: Hortgro
Post expects domestic production of all deciduous fruits to remain fairly flat, as labor strikes and a weak
Rand have affected investment in new vine plantings. However, the same currency issue has bolstered
exports to Europe, Russia, the Middle East, and African markets, and is expected to continue through
MY 2013. The increase in shipping cost by MERSK and SAFMarine did not negatively impact South
African deciduous fruit exports in 2013.
The South African deciduous fruit industry has traditionally focused their marketing efforts on European
markets, primarily the United Kingdom (UK) and Germany. But concerns over long-term weakened
demand in Europe have forced the industry to focus greater attention on Middle Eastern and Asian
markets.
US $ = R10.37 – 10 December, 2013
Sources:
Hortgro
South Africa Table Grape Industry (SATI)
National Agricultural Marketing Council (NAMC)
http://www.hortgro.co.za
http://www.namc.co.za/
http://www.freshfruitportal.com/2013/11/12/south-africa-farm-strike-intensifies-in-western-cape/
Commodities:
Apples, Fresh
Production
Post forecasts South Africa apple production at 817,000 MT for MY 2013 as more trees are reaching
full bearing potential. This is based on a recent trend of area planted growing at least two percent
annually. The MY 2012 official deciduous fruit industry data will not be published until early 2014.
However, post estimates MY 2012 apple production quantities at 815,000 MT on good growing
conditions throughout the season.
Post revised the South African MY 2011 total apple production at 790,636 MT on good growing
conditions throughout the season. This revision represents a five percent increase compared to the 2010
quantity of 753,168 MT.
Apples are grown in several provinces around South Africa, but Cape Town, located in the Western
Cape, is the heartland of deciduous fruit. The Western Cape is a winter rainfall area and has a climate
similar to the Mediterranean, which is favorable for apple production. The most important apple
growing regions are: Groenland, Ceres, Langkloof East, and Villiersdorp/ Vyeboom of Western Cape.
Harvest for South African apples typically begins at the end of January and can run through to June,
with the peak times between February and April.
Area Planted
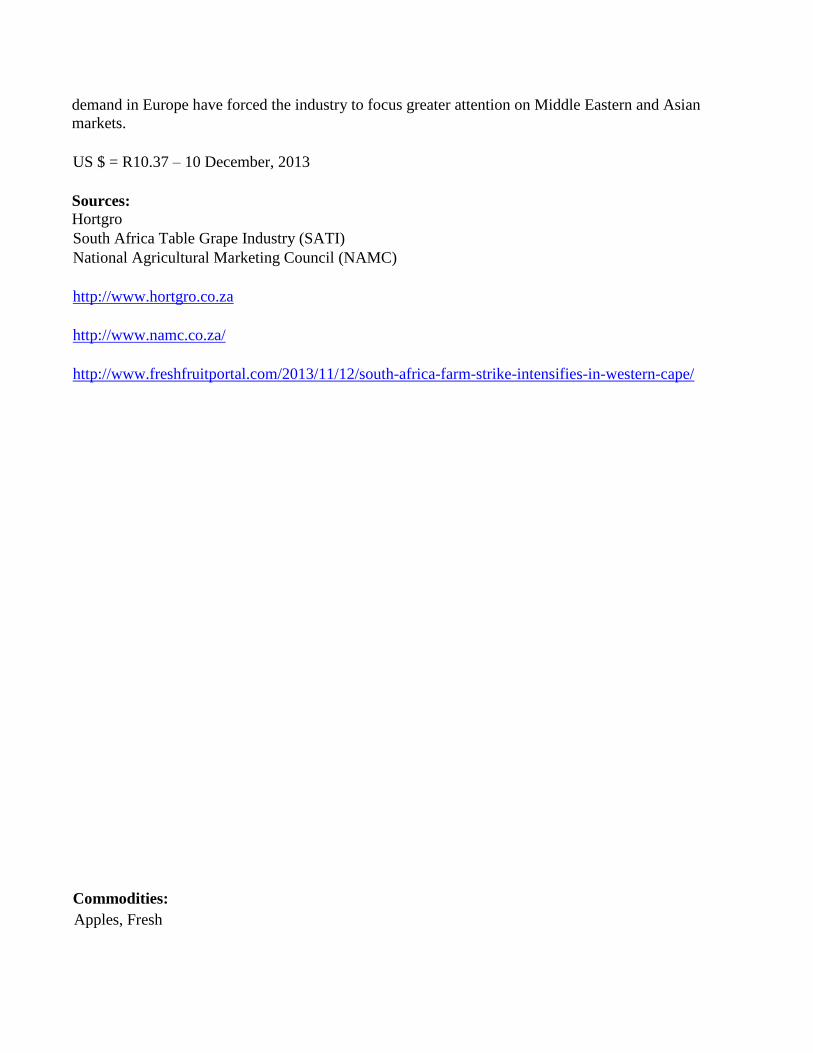
Figure 2. South Africa: Area Planted
Source: Hortgro
Post forecasts MY 2013 area planted at 22,700 hectares (ha), less than one percent growth as labor
strike have affected stability in the major production regions. Post estimates area planted in MY 2012 to
be 22,600 ha., as stated in the industry’s 2012 tree census. The area planted to apples was over 23,000
hectares (ha) just over ten years ago, and Post expects the industry to reach this same level of production
within the next few years. The Granny Smith variety has been favored by producers in recent years, but
is now losing ground to Gala, Pink Lady, and Honey Crisp varieties.
Figure 3. South Africa: Apple Production Costs
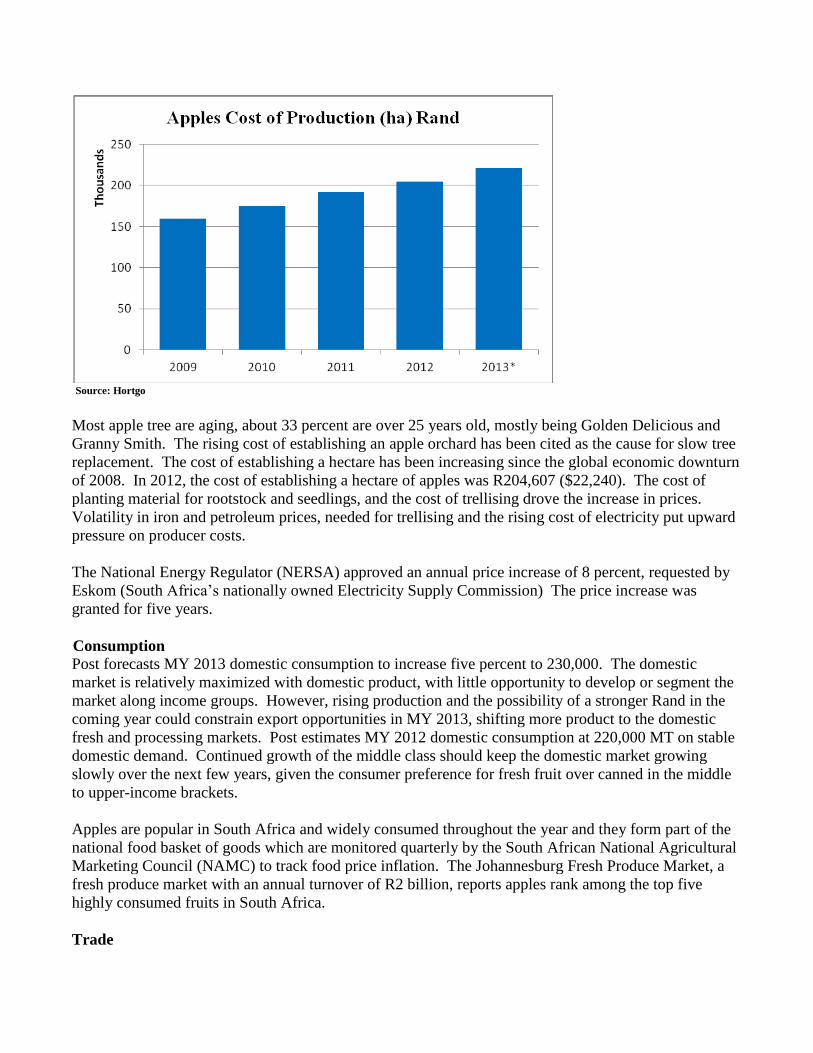
Source: Hortgo
Most apple tree are aging, about 33 percent are over 25 years old, mostly being Golden Delicious and
Granny Smith. The rising cost of establishing an apple orchard has been cited as the cause for slow tree
replacement. The cost of establishing a hectare has been increasing since the global economic downturn
of 2008. In 2012, the cost of establishing a hectare of apples was R204,607 ($22,240). The cost of
planting material for rootstock and seedlings, and the cost of trellising drove the increase in prices.
Volatility in iron and petroleum prices, needed for trellising and the rising cost of electricity put upward
pressure on producer costs.
The National Energy Regulator (NERSA) approved an annual price increase of 8 percent, requested by
Eskom (South Africa’s nationally owned Electricity Supply Commission) The price increase was
granted for five years.
Consumption
Post forecasts MY 2013 domestic consumption to increase five percent to 230,000. The domestic
market is relatively maximized with domestic product, with little opportunity to develop or segment the
market along income groups. However, rising production and the possibility of a stronger Rand in the
coming year could constrain export opportunities in MY 2013, shifting more product to the domestic
fresh and processing markets. Post estimates MY 2012 domestic consumption at 220,000 MT on stable
domestic demand. Continued growth of the middle class should keep the domestic market growing
slowly over the next few years, given the consumer preference for fresh fruit over canned in the middle
to upper-income brackets.
Apples are popular in South Africa and widely consumed throughout the year and they form part of the
national food basket of goods which are monitored quarterly by the South African National Agricultural
Marketing Council (NAMC) to track food price inflation. The Johannesburg Fresh Produce Market, a
fresh produce market with an annual turnover of R2 billion, reports apples rank among the top five
highly consumed fruits in South Africa.
Trade
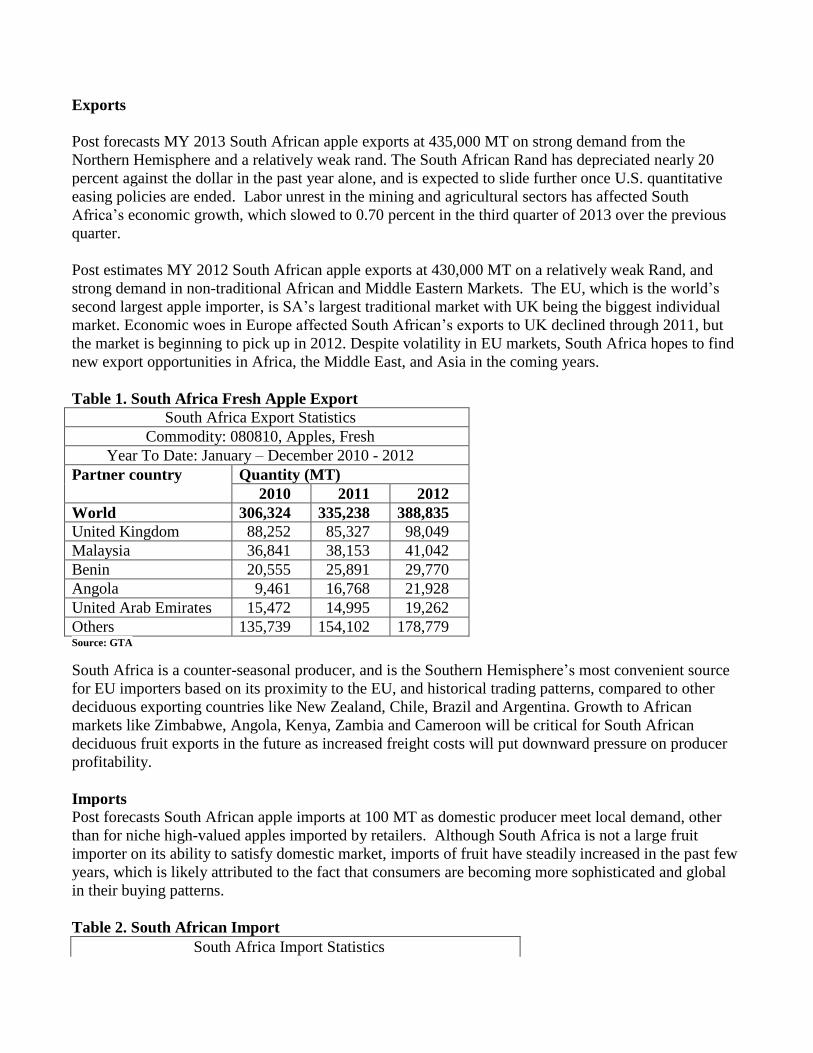
Exports
Post forecasts MY 2013 South African apple exports at 435,000 MT on strong demand from the
Northern Hemisphere and a relatively weak rand. The South African Rand has depreciated nearly 20
percent against the dollar in the past year alone, and is expected to slide further once U.S. quantitative
easing policies are ended. Labor unrest in the mining and agricultural sectors has affected South
Africa’s economic growth, which slowed to 0.70 percent in the third quarter of 2013 over the previous
quarter.
Post estimates MY 2012 South African apple exports at 430,000 MT on a relatively weak Rand, and
strong demand in non-traditional African and Middle Eastern Markets. The EU, which is the world’s
second largest apple importer, is SA’s largest traditional market with UK being the biggest individual
market. Economic woes in Europe affected South African’s exports to UK declined through 2011, but
the market is beginning to pick up in 2012. Despite volatility in EU markets, South Africa hopes to find
new export opportunities in Africa, the Middle East, and Asia in the coming years.
Table 1. South Africa Fresh Apple Export
South Africa Export Statistics
Commodity: 080810, Apples, Fresh
Year To Date: January – December 2010 - 2012
Partner country Quantity (MT)
2010 2011 2012
World 306,324 335,238 388,835
United Kingdom 88,252 85,327 98,049
Malaysia 36,841 38,153 41,042
Benin 20,555 25,891 29,770
Angola 9,461 16,768 21,928
United Arab Emirates 15,472 14,995 19,262
Others 135,739 154,102 178,779 Source: GTA
South Africa is a counter-seasonal producer, and is the Southern Hemisphere’s most convenient source
for EU importers based on its proximity to the EU, and historical trading patterns, compared to other
deciduous exporting countries like New Zealand, Chile, Brazil and Argentina. Growth to African
markets like Zimbabwe, Angola, Kenya, Zambia and Cameroon will be critical for South African
deciduous fruit exports in the future as increased freight costs will put downward pressure on producer
profitability.
Imports Post forecasts South African apple imports at 100 MT as domestic producer meet local demand, other
than for niche high-valued apples imported by retailers. Although South Africa is not a large fruit
importer on its ability to satisfy domestic market, imports of fruit have steadily increased in the past few
years, which is likely attributed to the fact that consumers are becoming more sophisticated and global
in their buying patterns.
Table 2. South African Import
South Africa Import Statistics
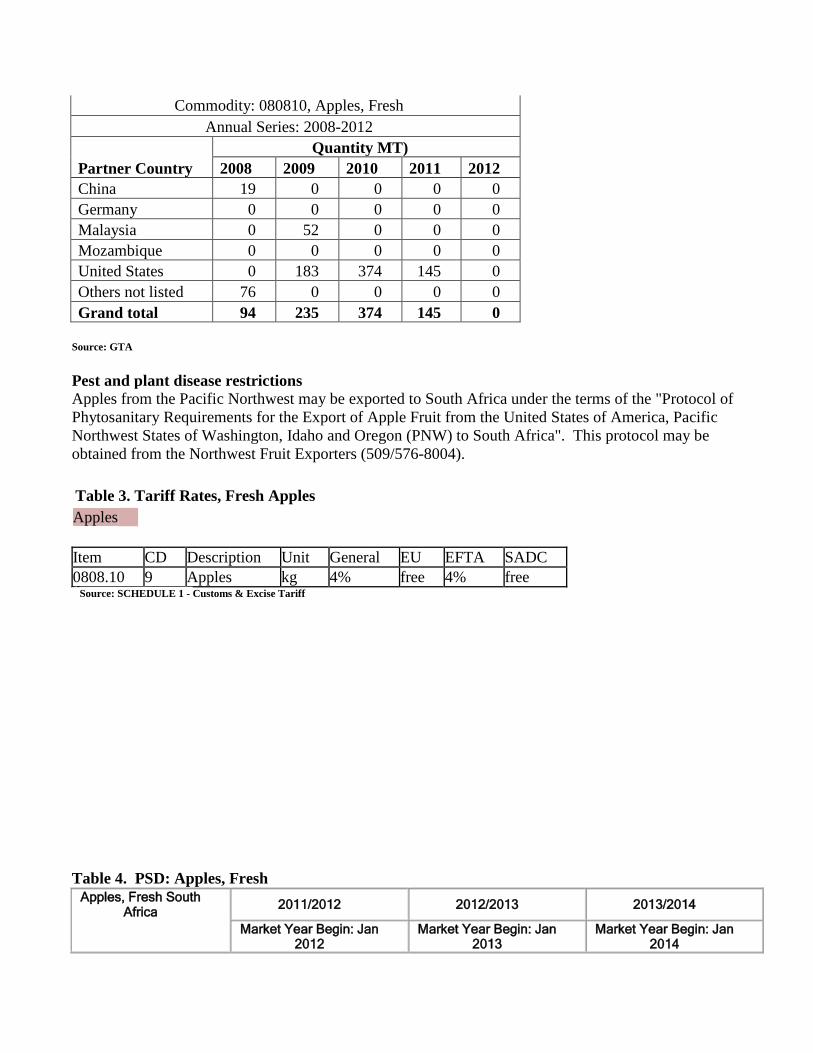
Commodity: 080810, Apples, Fresh
Annual Series: 2008-2012
Partner Country
Quantity MT)
2008 2009 2010 2011 2012
China 19 0 0 0 0
Germany 0 0 0 0 0
Malaysia 0 52 0 0 0
Mozambique 0 0 0 0 0
United States 0 183 374 145 0
Others not listed 76 0 0 0 0
Grand total 94 235 374 145 0
Source: GTA
Pest and plant disease restrictions
Apples from the Pacific Northwest may be exported to South Africa under the terms of the "Protocol of
Phytosanitary Requirements for the Export of Apple Fruit from the United States of America, Pacific
Northwest States of Washington, Idaho and Oregon (PNW) to South Africa". This protocol may be
obtained from the Northwest Fruit Exporters (509/576-8004).
Table 3. Tariff Rates, Fresh Apples
Apples
Item CD Description Unit General EU EFTA SADC
0808.10 9 Apples kg 4% free 4% free Source: SCHEDULE 1 - Customs & Excise Tariff
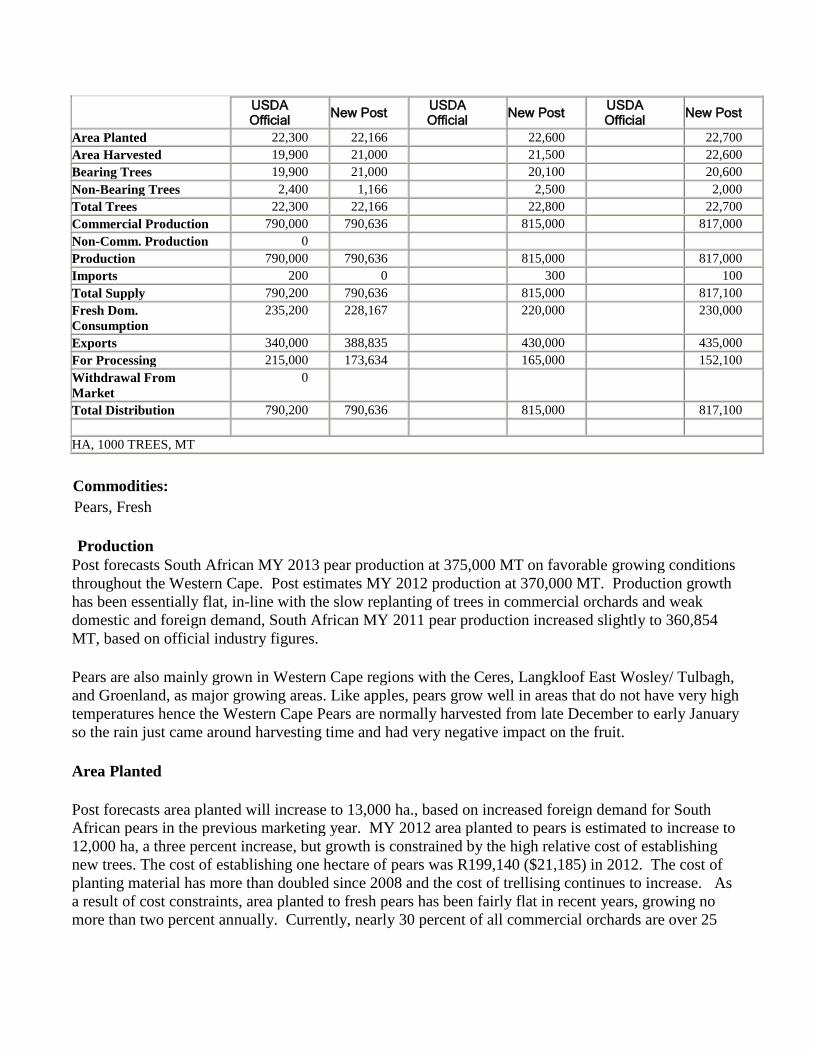
Table 4. PSD: Apples, Fresh
Apples, Fresh South Africa
2011/2012 2012/2013 2013/2014
Market Year Begin: Jan
2012 Market Year Begin: Jan
2013 Market Year Begin: Jan
2014
USDA Official
New Post USDA Official
New Post USDA Official
New Post
Area Planted 22,300 22,166 22,600 22,700
Area Harvested 19,900 21,000 21,500 22,600
Bearing Trees 19,900 21,000 20,100 20,600
Non-Bearing Trees 2,400 1,166 2,500 2,000
Total Trees 22,300 22,166 22,800 22,700
Commercial Production 790,000 790,636 815,000 817,000
Non-Comm. Production 0
Production 790,000 790,636 815,000 817,000
Imports 200 0 300 100
Total Supply 790,200 790,636 815,000 817,100
Fresh Dom.
Consumption
235,200 228,167 220,000 230,000
Exports 340,000 388,835 430,000 435,000
For Processing 215,000 173,634 165,000 152,100
Withdrawal From
Market
0
Total Distribution 790,200 790,636 815,000 817,100
HA, 1000 TREES, MT
Commodities:
Production
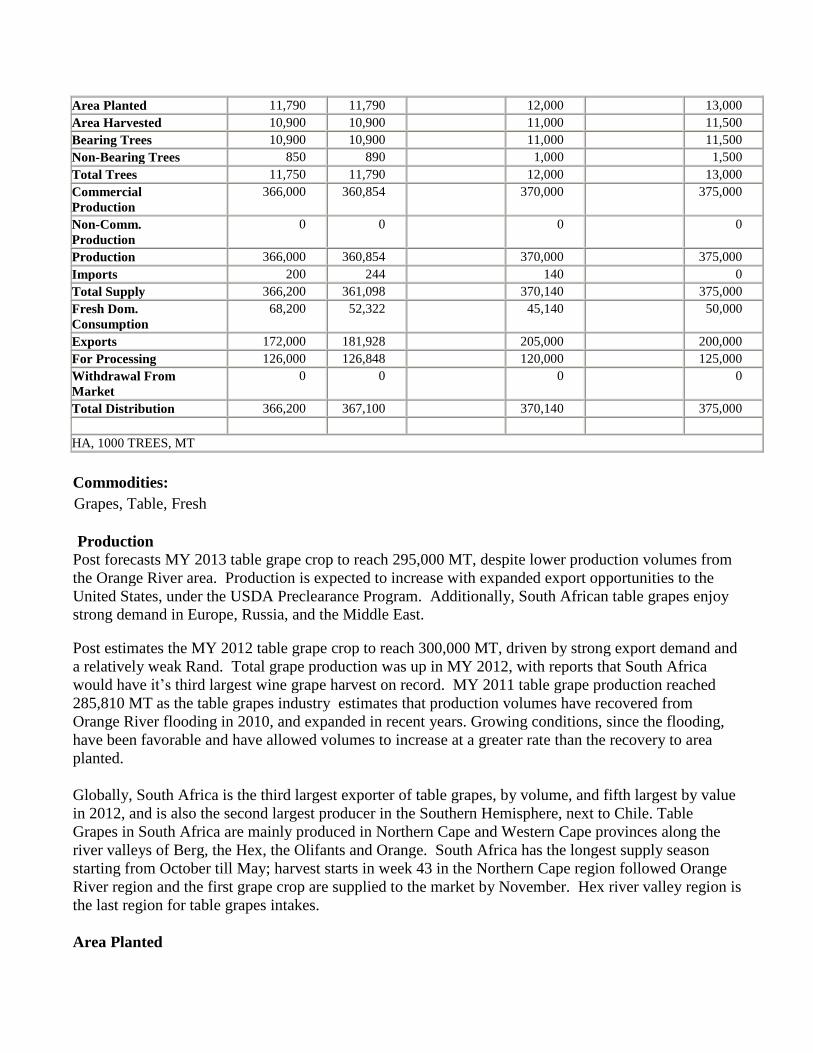
Post forecasts South African MY 2013 pear production at 375,000 MT on favorable growing conditions
throughout the Western Cape. Post estimates MY 2012 production at 370,000 MT. Production growth
has been essentially flat, in-line with the slow replanting of trees in commercial orchards and weak
domestic and foreign demand, South African MY 2011 pear production increased slightly to 360,854
MT, based on official industry figures.
Pears are also mainly grown in Western Cape regions with the Ceres, Langkloof East Wosley/ Tulbagh,
and Groenland, as major growing areas. Like apples, pears grow well in areas that do not have very high
temperatures hence the Western Cape Pears are normally harvested from late December to early January
so the rain just came around harvesting time and had very negative impact on the fruit.
Area Planted
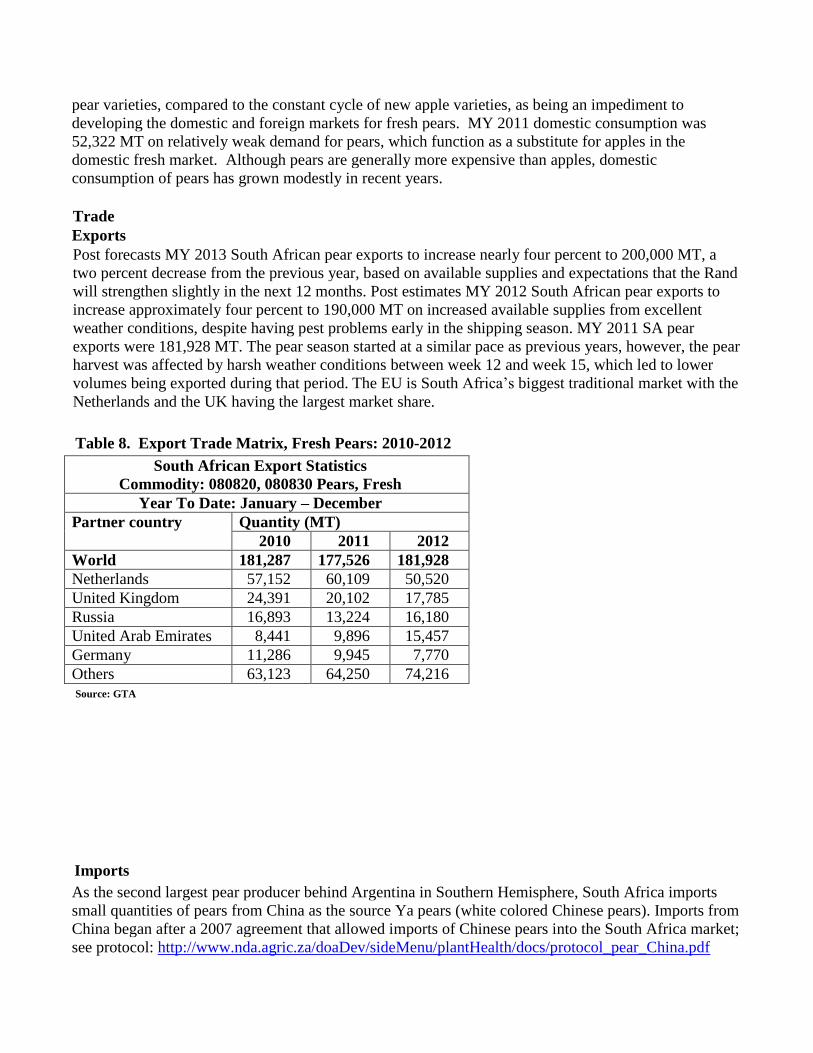
Post forecasts area planted will increase to 13,000 ha., based on increased foreign demand for South
African pears in the previous marketing year. MY 2012 area planted to pears is estimated to increase to
12,000 ha, a three percent increase, but growth is constrained by the high relative cost of establishing
new trees. The cost of establishing one hectare of pears was R199,140 ($21,185) in 2012. The cost of
planting material has more than doubled since 2008 and the cost of trellising continues to increase. As
a result of cost constraints, area planted to fresh pears has been fairly flat in recent years, growing no
more than two percent annually. Currently, nearly 30 percent of all commercial orchards are over 25
Pears, Fresh
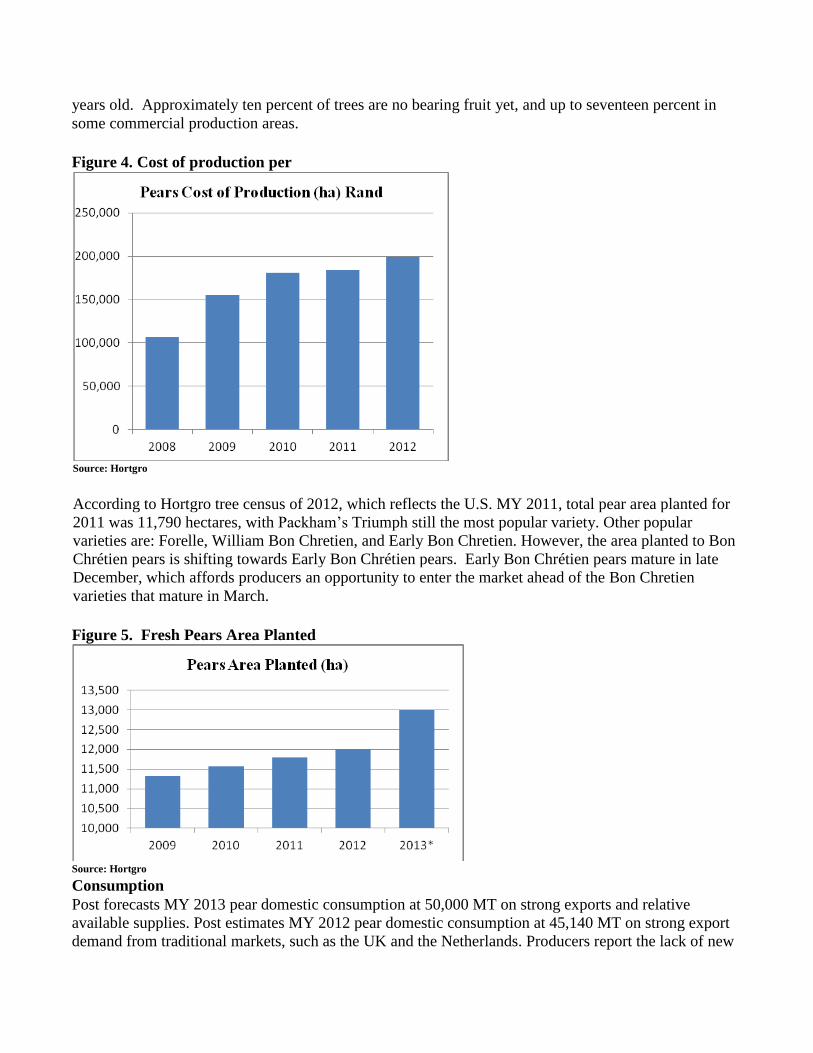
years old. Approximately ten percent of trees are no bearing fruit yet, and up to seventeen percent in
some commercial production areas.
Figure 4. Cost of production per
Source: Hortgro
According to Hortgro tree census of 2012, which reflects the U.S. MY 2011, total pear area planted for
2011 was 11,790 hectares, with Packham’s Triumph still the most popular variety. Other popular
varieties are: Forelle, William Bon Chretien, and Early Bon Chretien. However, the area planted to Bon
Chrétien pears is shifting towards Early Bon Chrétien pears. Early Bon Chrétien pears mature in late
December, which affords producers an opportunity to enter the market ahead of the Bon Chretien
varieties that mature in March.
Figure 5. Fresh Pears Area Planted
Source: Hortgro
Consumption
Post forecasts MY 2013 pear domestic consumption at 50,000 MT on strong exports and relative
available supplies. Post estimates MY 2012 pear domestic consumption at 45,140 MT on strong export
demand from traditional markets, such as the UK and the Netherlands. Producers report the lack of new
pear varieties, compared to the constant cycle of new apple varieties, as being an impediment to
developing the domestic and foreign markets for fresh pears. MY 2011 domestic consumption was
52,322 MT on relatively weak demand for pears, which function as a substitute for apples in the
domestic fresh market. Although pears are generally more expensive than apples, domestic
consumption of pears has grown modestly in recent years.
Trade
Exports
Post forecasts MY 2013 South African pear exports to increase nearly four percent to 200,000 MT, a
two percent decrease from the previous year, based on available supplies and expectations that the Rand
will strengthen slightly in the next 12 months. Post estimates MY 2012 South African pear exports to
increase approximately four percent to 190,000 MT on increased available supplies from excellent
weather conditions, despite having pest problems early in the shipping season. MY 2011 SA pear
exports were 181,928 MT. The pear season started at a similar pace as previous years, however, the pear
harvest was affected by harsh weather conditions between week 12 and week 15, which led to lower
volumes being exported during that period. The EU is South Africa’s biggest traditional market with the
Netherlands and the UK having the largest market share.
Table 8. Export Trade Matrix, Fresh Pears: 2010-2012
South African Export Statistics
Commodity: 080820, 080830 Pears, Fresh
Year To Date: January – December
Partner country Quantity (MT)
2010 2011 2012
World 181,287 177,526 181,928
Netherlands 57,152 60,109 50,520
United Kingdom 24,391 20,102 17,785
Russia 16,893 13,224 16,180
United Arab Emirates 8,441 9,896 15,457
Germany 11,286 9,945 7,770
Others 63,123 64,250 74,216
Source: GTA
Imports
As the second largest pear producer behind Argentina in Southern Hemisphere, South Africa imports
small quantities of pears from China as the source Ya pears (white colored Chinese pears). Imports from
China began after a 2007 agreement that allowed imports of Chinese pears into the South Africa market;
see protocol: http://www.nda.agric.za/doaDev/sideMenu/plantHealth/docs/protocol_pear_China.pdf
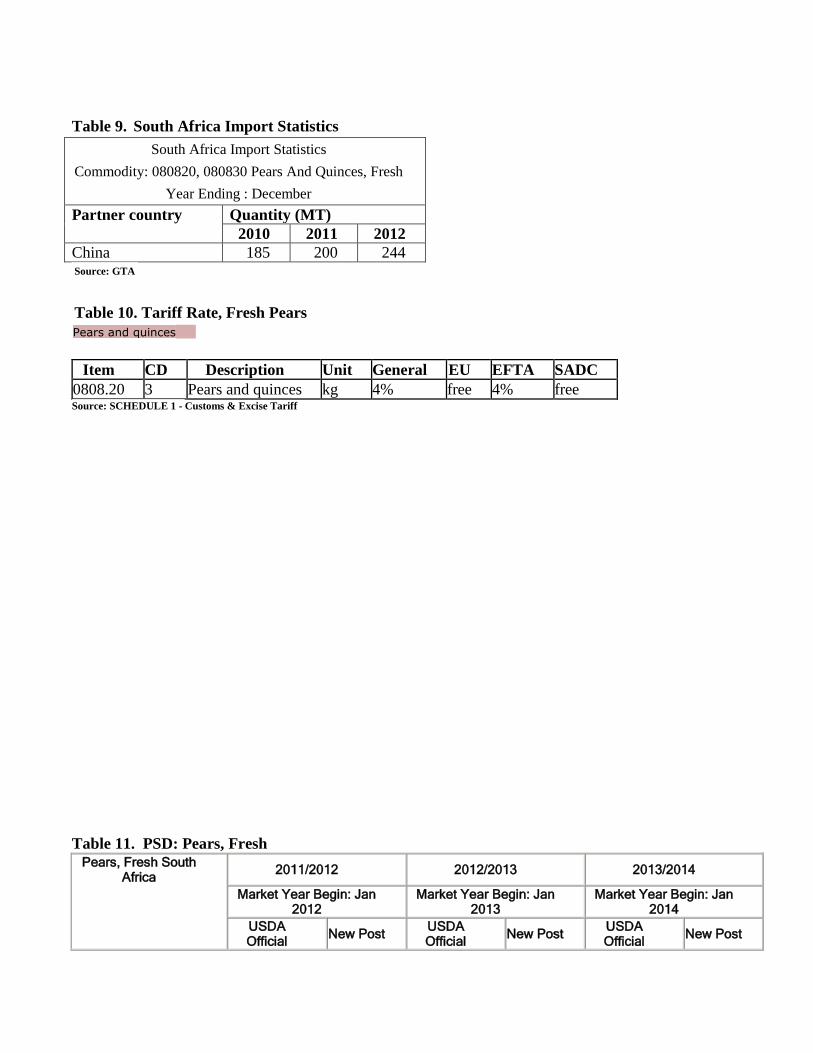
Table 9. South Africa Import Statistics
South Africa Import Statistics
Commodity: 080820, 080830 Pears And Quinces, Fresh
Year Ending : December
Partner country Quantity (MT)
2010 2011 2012
China 185 200 244 Source: GTA
Table 10. Tariff Rate, Fresh Pears
Pears and quinces
Item CD Description Unit General EU EFTA SADC
0808.20 3 Pears and quinces kg 4% free 4% free Source: SCHEDULE 1 - Customs & Excise Tariff
Table 11. PSD: Pears, Fresh
Pears, Fresh South Africa
2011/2012 2012/2013 2013/2014
Market Year Begin: Jan 2012
Market Year Begin: Jan 2013
Market Year Begin: Jan 2014
USDA Official
New Post USDA Official
New Post USDA Official
New Post
Area Planted 11,790 11,790 12,000 13,000
Area Harvested 10,900 10,900 11,000 11,500
Bearing Trees 10,900 10,900 11,000 11,500
Non-Bearing Trees 850 890 1,000 1,500
Total Trees 11,750 11,790 12,000 13,000
Commercial
Production
366,000 360,854 370,000 375,000
Non-Comm.
Production
0 0 0 0
Production 366,000 360,854 370,000 375,000
Imports 200 244 140 0
Total Supply 366,200 361,098 370,140 375,000
Fresh Dom.
Consumption
68,200 52,322 45,140 50,000
Exports 172,000 181,928 205,000 200,000
For Processing 126,000 126,848 120,000 125,000
Withdrawal From
Market
0 0 0 0
Total Distribution 366,200 367,100 370,140 375,000
HA, 1000 TREES, MT
Commodities:
Production Post forecasts MY 2013 table grape crop to reach 295,000 MT, despite lower production volumes from
the Orange River area. Production is expected to increase with expanded export opportunities to the
United States, under the USDA Preclearance Program. Additionally, South African table grapes enjoy
strong demand in Europe, Russia, and the Middle East.
Post estimates the MY 2012 table grape crop to reach 300,000 MT, driven by strong export demand and
a relatively weak Rand. Total grape production was up in MY 2012, with reports that South Africa
would have it’s third largest wine grape harvest on record. MY 2011 table grape production reached
285,810 MT as the table grapes industry estimates that production volumes have recovered from
Orange River flooding in 2010, and expanded in recent years. Growing conditions, since the flooding,
have been favorable and have allowed volumes to increase at a greater rate than the recovery to area
planted.
Globally, South Africa is the third largest exporter of table grapes, by volume, and fifth largest by value
in 2012, and is also the second largest producer in the Southern Hemisphere, next to Chile. Table
Grapes in South Africa are mainly produced in Northern Cape and Western Cape provinces along the
river valleys of Berg, the Hex, the Olifants and Orange. South Africa has the longest supply season
starting from October till May; harvest starts in week 43 in the Northern Cape region followed Orange
River region and the first grape crop are supplied to the market by November. Hex river valley region is
the last region for table grapes intakes.
Area Planted
Grapes, Table, Fresh
Post forecasts MY 2013 area planted at 16,000 hectares as area planted should remain flat with the
previous year. Massive labor strikes throughout calendar year 2013 and a relatively weak rand have
created a disincentive for new plantings. Post estimates MY 2012 area planted at 16,000 hectares as
area is driven by strong returns in export markets. MY 2011 area planted reached 15,484. The rapid
recovery in area planted has been driven by non-prohibitive costs for new vine establishment, as the
Rand was 20 percent stronger against the dollar than in calendar year 2013, and the successful
implementation of Black Economic Empowerment programs, which increased the number of black table
grape producers in South Africa. The South African Table Grapes Industry Association reports that the
current production cost for establishing a new hectare of table grapes is R123,356 ($13,122).
There were 361 table grapes producers in South Africa in 2012, a decline of five percent, as greater
consolidation in South Africa’s commercial agricultural sector continues in-line with other developed
commercial agricultural sectors around the world. The South African Table Grapes Industry will
publish statistics for 2013 in the first quarter of 2014. Total area planted estimated for MY 2012 is
16,000 ha. More than 60 percent of the vines in South Africa are between 4 - 15 years of age. The
leading varieties of South African Table Grapes are Crimson Seedless, Thompson Seedless, Prime, and
Flame. The cultivar profile in the South Africa has changed in recent years: seeded cultivars are
declining on a yearly basis in the last three years (2008 - 2012) as consumers prefer seedless grapes and
production of black and red seedless varieties has increased. The popularity of seedless cultivars stems
from characteristics such as large berry size (with elongated or oval berry shapes), favorable texture
(crunchiness), and good eating qualities.
Figure 6. Table Grape Production Regions
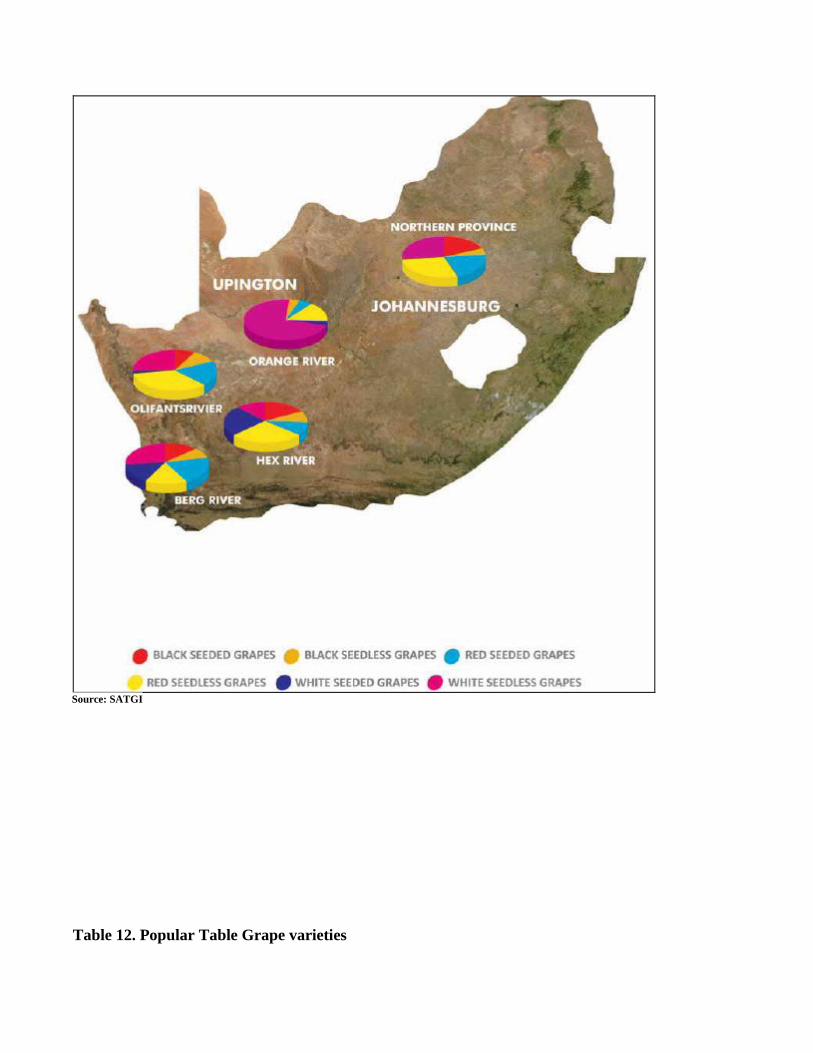
Source: SATGI
Table 12. Popular Table Grape varieties
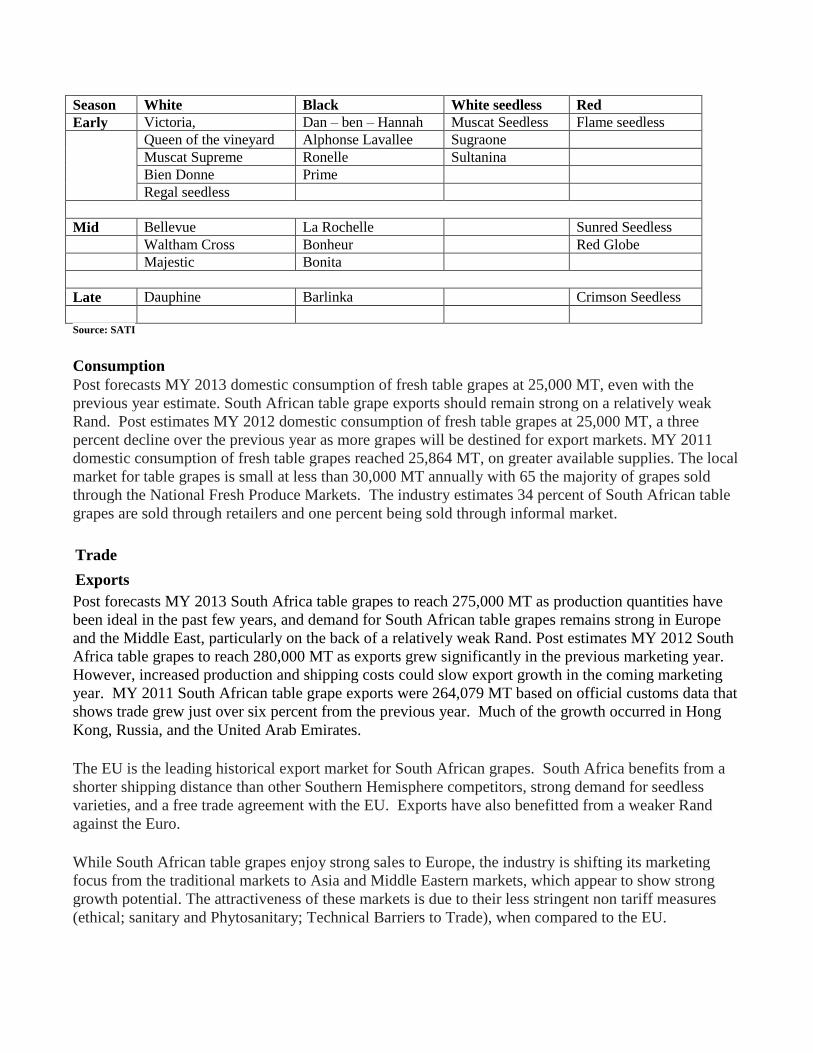
Season White Black White seedless Red
Early Victoria, Dan – ben – Hannah Muscat Seedless Flame seedless
Queen of the vineyard Alphonse Lavallee Sugraone
Muscat Supreme Ronelle Sultanina
Bien Donne Prime
Regal seedless
Mid Bellevue La Rochelle Sunred Seedless
Waltham Cross Bonheur Red Globe
Majestic Bonita
Late Dauphine Barlinka Crimson Seedless
Source: SATI
Consumption
Post forecasts MY 2013 domestic consumption of fresh table grapes at 25,000 MT, even with the
previous year estimate. South African table grape exports should remain strong on a relatively weak
Rand. Post estimates MY 2012 domestic consumption of fresh table grapes at 25,000 MT, a three
percent decline over the previous year as more grapes will be destined for export markets. MY 2011
domestic consumption of fresh table grapes reached 25,864 MT, on greater available supplies. The local
market for table grapes is small at less than 30,000 MT annually with 65 the majority of grapes sold
through the National Fresh Produce Markets. The industry estimates 34 percent of South African table
grapes are sold through retailers and one percent being sold through informal market.
Trade
Exports
Post forecasts MY 2013 South Africa table grapes to reach 275,000 MT as production quantities have
been ideal in the past few years, and demand for South African table grapes remains strong in Europe
and the Middle East, particularly on the back of a relatively weak Rand. Post estimates MY 2012 South
Africa table grapes to reach 280,000 MT as exports grew significantly in the previous marketing year.
However, increased production and shipping costs could slow export growth in the coming marketing
year. MY 2011 South African table grape exports were 264,079 MT based on official customs data that
shows trade grew just over six percent from the previous year. Much of the growth occurred in Hong
Kong, Russia, and the United Arab Emirates.
The EU is the leading historical export market for South African grapes. South Africa benefits from a
shorter shipping distance than other Southern Hemisphere competitors, strong demand for seedless
varieties, and a free trade agreement with the EU. Exports have also benefitted from a weaker Rand
against the Euro.
While South African table grapes enjoy strong sales to Europe, the industry is shifting its marketing
focus from the traditional markets to Asia and Middle Eastern markets, which appear to show strong
growth potential. The attractiveness of these markets is due to their less stringent non tariff measures
(ethical; sanitary and Phytosanitary; Technical Barriers to Trade), when compared to the EU.
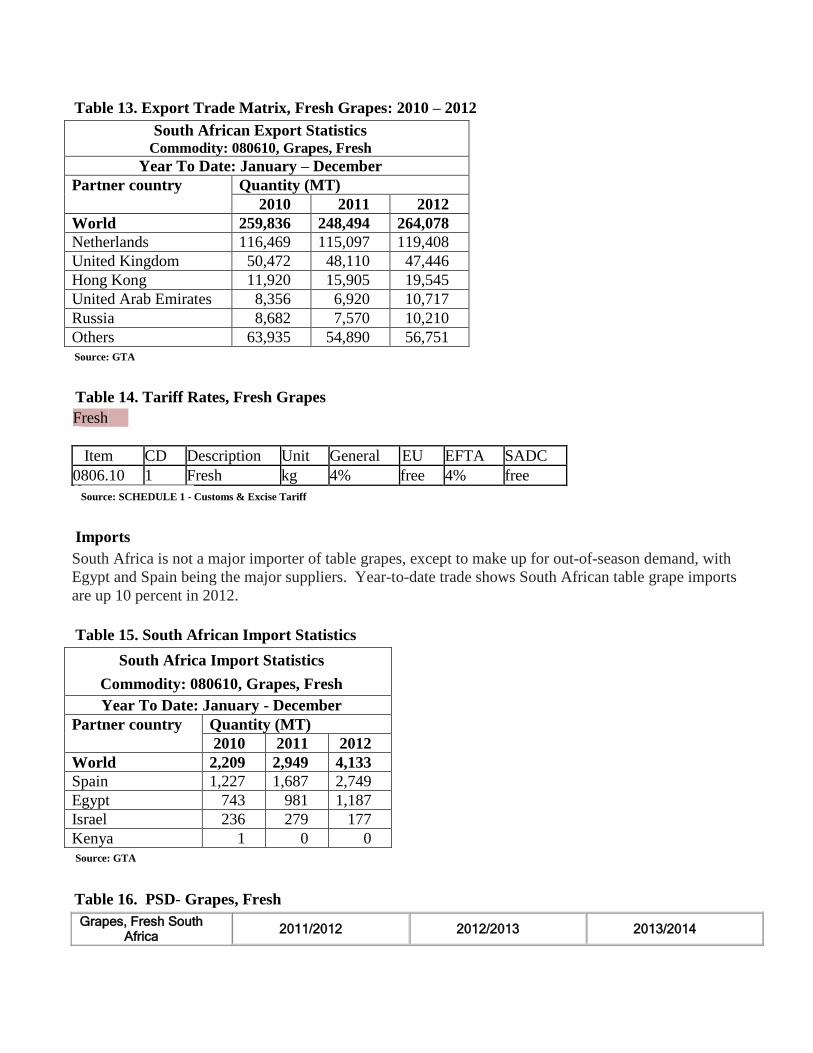
Table 13. Export Trade Matrix, Fresh Grapes: 2010 – 2012
South African Export Statistics Commodity: 080610, Grapes, Fresh
Year To Date: January – December
Partner country Quantity (MT)
2010 2011 2012
World 259,836 248,494 264,078
Netherlands 116,469 115,097 119,408
United Kingdom 50,472 48,110 47,446
Hong Kong 11,920 15,905 19,545
United Arab Emirates 8,356 6,920 10,717
Russia 8,682 7,570 10,210
Others 63,935 54,890 56,751
Source: GTA
Table 14. Tariff Rates, Fresh Grapes
Fresh
Item CD Description Unit General EU EFTA SADC
0806.10 1 Fresh kg 4% free 4% free
Source: SCHEDULE 1 - Customs & Excise Tariff
Imports
South Africa is not a major importer of table grapes, except to make up for out-of-season demand, with
Egypt and Spain being the major suppliers. Year-to-date trade shows South African table grape imports
are up 10 percent in 2012.
Table 15. South African Import Statistics
South Africa Import Statistics
Commodity: 080610, Grapes, Fresh
Year To Date: January - December
Partner country Quantity (MT)
2010 2011 2012
World 2,209 2,949 4,133
Spain 1,227 1,687 2,749
Egypt 743 981 1,187
Israel 236 279 177
Kenya 1 0 0
Source: GTA
Table 16. PSD- Grapes, Fresh
Grapes, Fresh South Africa
2011/2012 2012/2013 2013/2014
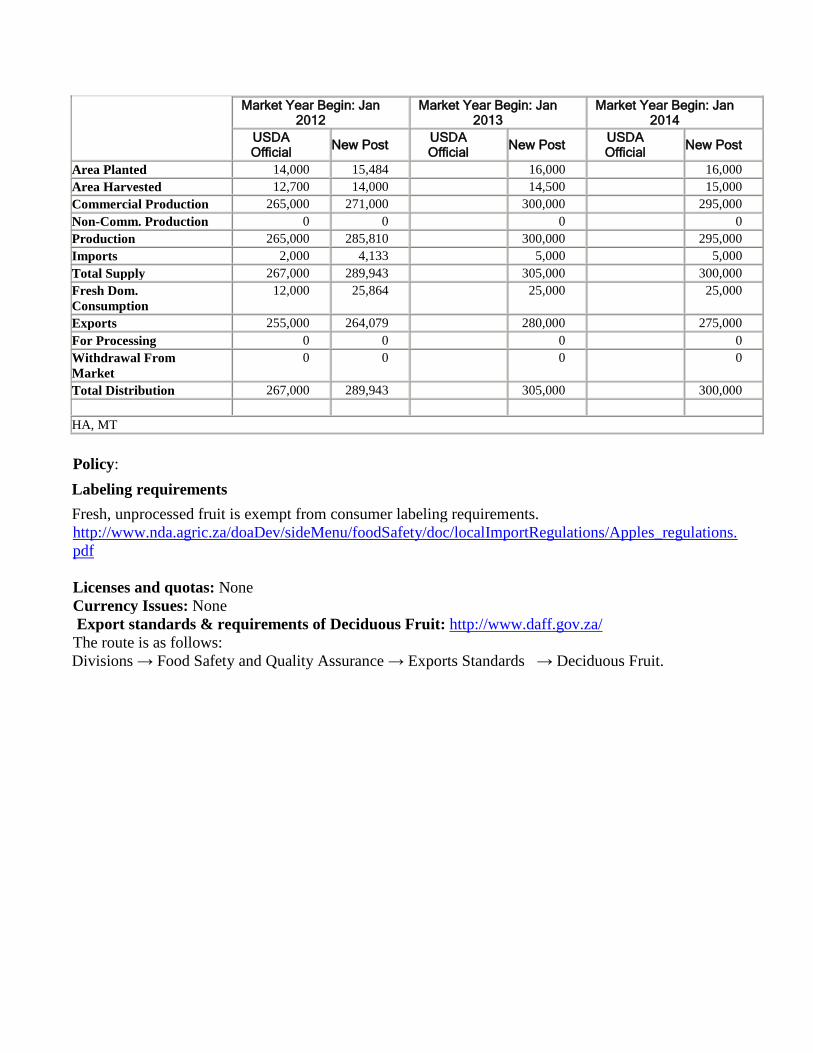
Market Year Begin: Jan 2012
Market Year Begin: Jan 2013
Market Year Begin: Jan 2014
USDA Official
New Post USDA Official
New Post USDA Official
New Post
Area Planted 14,000 15,484 16,000 16,000
Area Harvested 12,700 14,000 14,500 15,000
Commercial Production 265,000 271,000 300,000 295,000
Non-Comm. Production 0 0 0 0
Production 265,000 285,810 300,000 295,000
Imports 2,000 4,133 5,000 5,000
Total Supply 267,000 289,943 305,000 300,000
Fresh Dom.
Consumption
12,000 25,864 25,000 25,000
Exports 255,000 264,079 280,000 275,000
For Processing 0 0 0 0
Withdrawal From
Market
0 0 0 0
Total Distribution 267,000 289,943 305,000 300,000
HA, MT
Policy:
Labeling requirements Fresh, unprocessed fruit is exempt from consumer labeling requirements.
http://www.nda.agric.za/doaDev/sideMenu/foodSafety/doc/localImportRegulations/Apples_regulations.
Licenses and quotas: None
Currency Issues: None
Export standards & requirements of Deciduous Fruit: http://www.daff.gov.za/
The route is as follows:
Divisions → Food Safety and Quality Assurance → Exports Standards → Deciduous Fruit.