child poverty alliance - cini€¦ · child poverty alliance campaigning to eradicate child poverty...
TRANSCRIPT
Child Poverty Alliancecampaigning to eradicate child poverty
Beneath the SurfaceChild Poverty in Northern Ireland
BENEATH THE SURFACE
Child Poverty in Northern Ireland
The findings, interpretations and conclusions of the articles included in this report reflect the views of the individual authors, who were given an open brief to give their personal reflections on child poverty in Northern Ireland. Their views do not reflect the policies or views of the Child Poverty Alliance. The Child Poverty Alliance accepts no responsibility for errors. The designations in this publication do not imply an opinion on legal status of any country or of its authorities.
© 2014 Child Poverty Alliance. All rights reserved. Designed and printed by PepperCollective.com
i
ACKNOWLEDGEMENTS
This report is the result of work undertaken by the Child Poverty Alliance. The editors would like to thank all the contributors, not only for their papers but also for their ongoing work in highlighting the issue of child poverty in Northern Ireland. The quotes contained within the publication were extracts of interviews with parents conducted on behalf of the Child Poverty Alliance by Barnardo’s Northern Ireland; we appreciate the time given by the parents to discuss these issues. Special thanks to Gary Lightbody from Snow Patrol for his support of this publication, to Orlaith Minogue for her expertise in editing and Advice NI, Barnardo’s Northern Ireland, Children in Northern Ireland, the Family Fund, Save the Children NI and the Quaker Service for their kind financial contributions.
ii
ABOUT THE CONTRIBUTORS
Les Allamby was the director of the Law Centre until taking up post as the Chief Commissioner at the Northern Ireland Human Rights Commission in September 2014. The chapter is written in a personal capacity.
Dr Bronagh Byrne is a Lecturer in Social Policy at Queen’s University Belfast. Her research interests lie in children’s rights, disability policy and the relationship between international human rights law and policy development. Bronagh has a particular research interest in the potential of the United Nations Convention on the Rights of Persons with Disabilities, which incorporates a range of social policy areas, in creating a more inclusive society.
Dr Agata D’Addato is Senior Policy Coordinator at Eurochild, a network which brings together over 100 member organisations from across Europe promoting the rights and welfare of children. Eurochild aims at monitoring and influencing EU policy to ensure the rights of children and, in particular, the most vulnerable children are taken into account.
Rachel Dennison is a Research and Policy Officer for Employers For Childcare Charitable Group. To date she has completed several reports including the Northern Ireland Childcare Cost Survey series (2010-2013) and ‘Managing Expectations, a survey of new mums and dads’ (2013).
Ellen Finlay is Policy Officer at Children in Northern Ireland, responsible for policy analysis. She is co-chair of the Child Poverty Alliance and sits on the Policy Steering Group of Eurochild. She is also a Board Member of Hazelwood Integrated Primary School.
Kevin Higgins is Head of Policy and Research with Advice NI. He has worked in the advice sector for over 20 years within an independent advice centre (Ballynafeigh Community Development Association), a CAB (Falls Road) and with Law Centre NI (Legal Adviser). A large part of his work revolves around addressing social policy issues raised by Advice NI members and engaging with key stakeholders.
Paddy Hillyard is Professor of Sociology at Queen’s University Belfast. His main research interest is in social order and control in modern welfare states focusing on a number of substantive areas: 'crime', social harm, political violence, poverty and

iii ABOUT THE CONTRIBUTORS
inequality. Recently his research has focused on poverty, conflict and inequality in Northern Ireland.
Goretti Horgan is a lecturer in Social Policy and Deputy Policy Director of the ARK project (www.ark.ac.uk). She is a member of the Board of Directors of the Northern Ireland Anti-Poverty Network. Research interests are child rights and women’s rights, especially child poverty, welfare reform and poverty among disabled people. Much of her research is carried out with children’s organisations and other NGOs.
Grace Kelly is Research Assistant with the School of Sociology, Social Policy and Social Work at Queen’s University Belfast. Her main area of work to date has covered issues relating to indicators of social need, socially perceived necessities of life, the measurement of poverty and social exclusion.
Anne Moore is Policy, Advocacy and Campaigns Manager for Save the Children. Previously she worked as a Policy Officer, Press Officer and teacher. She has a BA Hons from QUB in Political Science, History and French, a PGCE from Edinburgh University, MA in 20th century history from the University of Ulster and LLM in Human Rights Law from QUB.
Katie Schmuecker is a Programme Manager in the Poverty Team at Joseph Rowntree Foundation (JRF), where she is working on the development of JRF’s Anti-Poverty Strategies for the UK. She also manages programmes of research on the future of the UK labour market and working poverty, income adequacy and the cost of living.
Professor Mike Tomlinson is Head of School of Sociology, Social Policy and Social Work at Queen’s University Belfast. Much of his work has focused on the political economy of the Northern Ireland conflict. Mike has been working with colleagues from six universities across the UK, participating in the Poverty and Social Exclusion in the UK project, supported by the Economic and Social Research Council.
Sanne Velthuis joined JRF in 2013 where she works as a programme assistant for the Anti-Poverty Strategies for the UK programme. Prior to that she worked for

iv ABOUT THE CONTRIBUTORS
StepChange Debt Charity and completed an MA in International Social Transformation at Leeds University.
Mary Anne Webb has over twenty years’ policy and practice experience working in the voluntary sector. Since 2007 she has worked for Barnardo’s NI a leading children’s charity providing services to 10,000 children, young people and families in Northern Ireland as a senior Policy and Research Officer.
v
EXECUTIVE SUMMARY & NEXT STEPS
CHAPTER 1: CHILD RIGHTS AND THE EUROPEAN UNION
Fighting child poverty should be framed in a child rights approach which should be applied in internal market, trade, finance and infrastructure policy-making, as well as the more obvious areas of education, health, employment and welfare.
Targeted action, designed to protect the most vulnerable and marginalised children, needs to be embedded in a comprehensive child rights strategy.
The traditional silo and departmental approaches are not helpful or cost effective. Children’s rights need to be mainstreamed.
Investing in children is a priority especially in hard times. The Executive has responsibility to implement the European Commission’s 2013 Recommendation on Investing in Children and should access the structural funds to progress this.
CHAPTER 2: CHILD POVERTY IN NORTHERN IRELAND – RESULTS FROM THE PSE STUDY
There is general agreement that the measurement of child poverty is based on both low income and deprivation.
Adjusting incomes for different household types, measuring before or after housing costs, and the selection of deprivation items all have an impact on poverty rates.
The consensual poverty method, which takes account of what the population considers to be basic necessities, is described. The study found a high level of agreement on the basic necessities for children.
The study found that only a few children lacked very basic necessities such as three meals a day and adequate clothing, but a third of all children (150,000) were deprived of an annual holiday and 75,000 children are growing up in cold and damp homes.
Overall, the study found that 24% or 106,000 children are living in low income households and are deprived of four or more items.
vi EXECUTIVE SUMMARY & NEXT STEPS
The study found those who had a ‘high experience’ of the conflict were significantly more deprived than those with no conflict experience and that a fifth of all children are living with an adult/s who have ‘high experience’.
CHAPTER 3: CHILD POVERTY AND DISABILITY
Children who have a disability and children who live in a household with a disabled parent or sibling are most likely to experience poverty.
To treat disability benefits as income in the measurement of poverty masks the true extent of child poverty.
Once benefits are removed from income, the child poverty rate increases by 4% with the disparity greater in Northern Ireland than the UK, due largely to higher levels of disability.
The introduction of further benefit cuts risks having a disproportionate impact on child poverty rates compared to the rest of the United Kingdom.
The UN Convention on the Rights of Persons with Disabilities (UNCRPD) and the UN Convention on the Rights of the Child (UNCRC) should guide ministerial fulfilment of the right to an adequate standard of living for children living with disabilities.
CHAPTER 4: CHILD POVERTY, LOW PAY AND THE LABOUR MARKET
For the first time, child poverty in Northern Ireland is highest in working families.
Changes in the labour market are driving up poverty and inequality with work no longer a guarantee out of poverty.
The rising employment rate masks the shift towards part time and insecure employment as many low income families join the market on temporary contracts in caring, leisure and other service occupations.
These groups face a heightened risk of cycling between low paid work and unemployment in what has become known as the low-pay, no-pay cycle.

vii EXECUTIVE SUMMARY & NEXT STEPS
It is estimated that 25 per cent of Northern Ireland’s workforce was paid less than the Living Wage in 2013.
Northern Ireland suffers from longstanding educational inequality. A substantial proportion of people aged 16-64 has few or no formal qualifications (29.1 per cent in 2011) compared to England and Wales (15 per cent).
Northern Ireland has fewer people with high level qualifications (23.6% compared to 29.7 per cent in England and Wales).
The welfare to work system presents a barrier to employment. Current disincentives for second earners to work are set to worsen under Universal Credit (UC), as the current design of UC does not include an earnings disregard for second earners.
Employment programmes need to be much more tightly targeted on low income families.
Policy makers should be concerned by the quality of jobs as well as the quantity.
A child poverty strategy must embrace employment, skills and workforce development programmes.
CHAPTER 5: CHILD POVERTY AND SOCIAL SECURITY – AN UNRAVELLING CONSENSUS
Child poverty levels were reduced in the past through changes to the tax and social security system. They account for four times the level of decrease in relative poverty than changes in parental work patterns.
Welfare reform since 2010 amounts to the largest shake-up of the social security system for a generation.
As detailed, there have been over thirty changes to reduce social security expenditure since October 2010.
The GB Welfare Reform Act 2012 and the contentious welfare bill in Northern Ireland involve the introduction of Universal Credit to replace six existing social security benefits and the replacement of Disability Living Allowance for people of working age with Personal Independence Payment.
viii EXECUTIVE SUMMARY & NEXT STEPS
The Institute for Fiscal Studies report illustrates the disproportionate impact social security policy is having on child poverty in Northern Ireland. Over the period of 2010 to 2020 relative child poverty will have increased by 8.3 per cent and absolute child poverty by 11.5 per cent.
Populist rhetoric has replaced support for social protection and created hardship.
An open debate of what can be done, at what cost and how it could be paid for is needed urgently.
CHAPTER 6: CHILD POVERTY AND CHILDCARE
Childcare in Nordic countries is seen as a bulwark against child poverty.
Childcare provision in Northern Ireland is inadequate, inflexible and too expensive.
Childcare impacts on the rate of child poverty in three ways: acts as a barrier to employment for parents, places pressure on family incomes and meets essential developmental needs of children.
There is only one childcare place in Northern Ireland for every 8.6 children, with even more limited provision for children with disabilities and special needs.
There is a lack of flexibility failing to support shift work and irregular hours.
It costs on average £158 per week or £16,432 for an average family with two children. For low income families the cost of childcare takes up more than 44 per cent of their disposable income.
A high quality childcare system could reduce child poverty by up to one half.
Northern Ireland should follow the Nordic example by linking early years and childcare policy and provision.
CHAPTER 7: CHILD POVERTY AND EDUCATION
There is a large gap between the educational achievement of children living in poverty and children from better-off families.

ix EXECUTIVE SUMMARY & NEXT STEPS
Poverty impacts on many outcomes including maternal mental health, children’s anxiety levels and behaviour as well as cognitive development.
A ‘free school day’ for low income pupils should be supported to cover the cost of uniforms, books, materials and school trips.
Funding should be redirected to raising teaching quality and incentivising the best teachers to work in the most deprived schools.
An expensive segregated system – segregated on lines of religion, social class and gender – should be replaced by a good social mix which is known to provide the best educational outcomes and value for money.
CHAPTER 8: CHILD POVERTY, ADVICE SERVICES, FOOD BANKS AND DEBT
Families are experiencing severe economic pressure and many are falling into debt, with increasing reliance on food banks.
Advice services are witnessing the harsh reality of increasing poverty and inequality.
Last year, over a 12 month period, more than 150,000 people were offered advice from Advice NI on many areas especially social security, housing and debt.
Debt Action NI helped over 5,000 people deal with over £62 million in debt.
Over half of these clients had no savings and one in ten presented with a deficit budget. The Executive should ensure access to affordable credit as a viable alternative to risky high interest credit, promote financial education and ensure the continuation of free face-to-face advice.
NEXT STEPS FOR THE CHILD POVERTY ALLIANCE All the evidence suggests that child poverty levels will reach shocking levels by 2020. The Child Poverty Alliance plans to hold a series of meetings over the next year to reflect on the report’s findings and begin a dialogue about what needs to be done to eliminate child poverty in Northern Ireland by 2020. We would like this conversation about a range of options to involve key stakeholders, policy makers, children in poor families and the report’s expert authors.

x
FOREWORD
Gary Lightbody, Snow Patrol
Heat, food, water, a roof over your head... If you’re reading this as an adult then chances are as a child you had all those things as standard. In fact chances are you never thought twice about any of them. They just WERE. My childhood was blessed although I didn’t really know it at the time because I took it for granted. Three meals a day in a nice wee house with a garden and loved by attentive and affectionate parents. That was me. And not once as a child did I think it was any different for anyone else. The Northern Ireland I grew up in, to my childhood eyes, may have been sporadically scorched with violence but in the relatively sleepy seaside town of Bangor our life as kids was for the most part about kicking a football around in the street until it got too dark and a long string of benign mundanities that meant for fairly uneventful days and evenings. There were triumphs of course, tragedies too but for the most part there was a golden-hued yawning predictability to my childhood days that was maybe a little dull but certainly very cosy. Of course these days for some kids this is still the case. For many many children though, life is not like this at all. What should be a given for every child in Northern Ireland and beyond, heat, food, water, housing, these things many of us have taken for granted, are lacking and sometimes even entirely absent.
Child poverty is becoming a problem of working families, a problem of low wages and insecure work. This might be the most disturbing of all the data in this report. Too often does one hear the glib remark from more conservative commentators ‘get a job’ in response to struggling families hopeful of change. It’s clear that ‘getting a job’ is no guarantee of any security. A lot of the parents of these children are working very hard to provide for their families yet still coming up short in extremely difficult conditions. Poverty is of course not just about income it also means that people are excluded in some way from a standard of living and way of life that the majority regard as acceptable.
One surely doesn’t need to point out the benefits or indeed necessity of a healthy diet for growing kids or the disadvantage no access to computers is to a child competing for places at schools and universities. Or the major skin and respiratory
xi FOREWORD
problems a damp house can cause. Or indeed the effect the lack of a warm coat has in the frigid Northern Irish winter on the immune system of a small child. Having been through many Northern Irish winters myself I can’t imagine having to walk to school with no coat or not having enough dry clothes. Then in many cases to get home from school in wet clothes and no coat to a house with no heating. To add all these things up seems an unthinkable injustice to throw at a child.
Children in Northern Ireland with Save the Children Northern Ireland co-chair the Child Poverty Alliance, with child poverty in NI due to rise in the coming years an alliance such as this is more important than ever. Working alongside parents and families, teachers and schools is the only way to effect great change, for this is not just a matter of budget cuts and funding and keeping the government focused on the issue but is also very important to educate, elevate and support families that are struggling to give their children better and safer lives with the odds very unfairly stacked against them.
That children in Northern Ireland should be the worst hit by this seems doubly cruel. To have finally come out the other side of decades of conflict a new generation is trying to build a new Northern Ireland from the rubble of the old. For it now to be hit hardest by the welfare reform bill would be a bitter pill to swallow. One hopes that good sense prevails and at the very least some parity with the rest of the UK is reached. If not, the struggle in the next decade will be all the greater and the Child Poverty Alliance all the more important.
CONTENTS
Introduction 1 Ellen Finlay
1. Child Poverty and Child Rights in the European Union 5 Dr Agata D’Addato
2. Child Poverty in Northern Ireland: 11 Results from the Poverty and Social Exclusion Study
Professor Mike Tomlinson, Professor Paddy Hillyard & Grace Kelly
3. Child Poverty and Disability 35 Dr Bronagh Bryne
4. Child Poverty and Social Security 49 Les Allamby
5. Child Poverty, Low Pay and the Labour Market 67
Sanne Velthuis & Katie Schmuecker
6. Child Poverty and Education 81
Goretti Horgan
7. Child Poverty and Childcare 97
Rachel Dennison
8. Child Poverty, Advice, Food-banks and Debt 109 Ellen Finlay & Kevin Higgins
9. Reflections 115 Anne Moore & Paddy Hillyard
PAGE 1
____________________________________________
INTRODUCTION
Ellen Finlay Children in Northern Ireland
____________________________________________
The Child Poverty Alliance steering group commissioned experts to write articles on key aspects of child poverty in Northern Ireland. The purpose is to highlight the extent of child poverty and inequality, the complexity of the problem and the need for the Executive to adopt a more progressive approach to ending child poverty within a child rights framework.
The Northern Ireland Executive is bound by human rights treaties that have been ratified by the UK. They include the United Nations Convention on the Rights of the Child (UNCRC), the International Covenant on Economic and Social and Cultural Rights (ICESCR) and the UN Convention on the Rights of Persons with Disabilities (UNCRPD).
The UNCRC represents a promise to our children and young people to protect their rights and recognise that they need specific protection and care in relation to civil, political, economic, social and cultural rights.
UNCRC has four core principles: the right to life, survival, and development, non-discrimination, devotion to the best interests of the child, and respect for the views of the child. The Conventions also protects the right of the child to an adequate standard of living and social security. To this end the Child Poverty Alliance strongly
PAGE 2 INTRODUCTION
advocate that the only way to tackle child poverty is through a rights based approach.
As far back as 2008, the Concluding Observations made by the UN Committee on the Rights of the Child expressed concern at the extent of child poverty and its impact upon children and young people. The committee highlighted that an adequate standard of living is essential for a child’s physical, mental, spiritual, moral and social development. It recommended that the government would:
Adopt and adequately implement the legislation aimed at achieving the target of ending child poverty by 2020
Give priority to those children and their families in most need of support
When necessary, besides giving full support to parents or others responsible for the child, intensify its efforts to provide material assistance and support programmes for children, particularly with regard to nutrition, clothing and housing
Reintroduce a statutory duty for local authorities to provide safe and adequate sites for Travellers.
Introduce budgetary analysis and impact assessment to identify how much expenditure is allocated to children and to gauge the efficacy of policy implementation.
Every child needs and deserves a safe, happy and fulfilled childhood. We all have a moral duty to challenge the structures that have contributed to children and young people in Northern Ireland growing up in poverty. Shockingly, the evidence which follows in this report clearly shows that the rights of children and young people in Northern Ireland are not high on the political agenda with many continuing to face inequalities.
The unacceptable and shamefully high child poverty figures demonstrate a complete lack of commitment to the UNCRC and lack of urgent action to end child poverty and address inequality that our children face in their daily lives.
Much work has been undertaken to understand the extent of poverty, its causes, who is poor, how many and what it’s like to live in poverty. We have the data: the
PAGE 3 INTRODUCTION
following chapters bring together much of this evidence. It has become apparent that the 2020 statutory targets to end child poverty will be missed by a huge distance.1 We need everyone to understand the complexities of poverty, we all need to accept the challenge of being effective and tackle not only the symptoms of poverty but also the underlying causes.
The chapters which follow are a compilation of articles on the issue of child poverty. This report draws upon the thoughts and research of leading thinkers in the field of child poverty and inequality.
Dr Agata D’Addato from Eurochild in Child Poverty and Child Rights gives us an overview of the European Union’s Recommendation on child poverty. The three pillar approach looks at access to adequate resources, access to services and opportunities and children’s participation, arguing for a strong rights-based approach to eradicating child poverty.
Professor Mike Tomlinson, Grace Kelly and Professor Paddy Hillyard from Queen’s University Belfast discuss the results from the Poverty and Social Exclusion study in Child Poverty in Northern Ireland, starting with how poverty is measured and the PSE ‘consensual poverty’ approach before highlighting how poverty is linked to experience of conflict.
In Child Poverty and Social Security: an unravelling consensus, Les Allamby provides an overview of social security reform and highlights the changes to the social security benefits from October 2010 to October 2013 and the impacts of these changes on child poverty.
Dr Bronagh Bryne from Queen’s University Belfast in Child Poverty and Disability reflects how children with a disability are experiencing poverty and explains why it is problematic ascertaining the true levels of child poverty in the context of disability.
Goretti Horgan from the University of Ulster in Child Poverty and Education explores the impact of poverty on education. It starts by examining the facts and figures and then explores what the evidence indicates.

PAGE 4 INTRODUCTION
In Child Poverty, low pay and the labour market, Sanne Velthuis and Katie Schmuecker from the Joseph Rowntree Foundation discuss the current link between work and poverty, highlighting the need to look beyond the simple approach of work as a route out of poverty but developing a more comprehensive approach to reducing child poverty that brings together a child poverty strategy, employment, skills and workforce development strategies.
Rachel Dennison from Employers for Childcare in Child Poverty and Childcare explores the existing childcare system in Northern Ireland and discusses the links between childcare provision and child poverty.
Child Poverty, Advice, Food Banks and Debt, written by Kevin Higgins, Advice NI and Ellen Finlay, Children in Northern Ireland and Co-chair of the Child Poverty Alliance, notes the growing succession of cuts to government spending on social security and the huge impact this is having upon children and families. With low wages, rising household bills, food banks and debt more families than ever are contacting advice services for help.
Anne Moore from Save the Children and co-chair of the Child Poverty Alliance and Professor Paddy Hillyard, Queen’s University Belfast conclude with Reflections. This chapter aims to reflect on the learning and insight from previous chapters and to begin a conversation about what needs to be done to eliminate child poverty in Northern Ireland. It suggests that the CPA host a series of public events and roundtables with the participation of the expert authors and key stakeholders over the coming months. They will explore the report findings and discuss a range of options including the need to increase the resources or reduce the outgoings of poor families with children and promote the wellbeing of all children.
1 The latest figures show that in 2012/13 there were almost 89 thousand children (20%) in relative poverty and 96 thousand (22%) in absolute poverty before housing costs. NISRA (2013) Northern Ireland Poverty Bulletin 2012/13

PAGE 5
____________________________________________
CHAPTER ONE
CHILD POVERTY AND CHILD RIGHTS IN THE EUROPEAN
UNION
Dr Agata D’Addato Eurochild
____________________________________________
INTRODUCTION Growing up in poverty is known to severely curtail life chances. Across the European Union (EU), every fourth child under 18 lives in, or is at risk of, poverty and social exclusion. In just one year, the number has increased by more than half a million (Eurostat, EU-SILC 2013). These children are particularly vulnerable and have difficulty affording appropriate services. Under the guise of austerity, many member states are cutting services for the most vulnerable children and families.1
How children experience their childhood is important for their well-being. Child poverty is not only about growing up in families that are income poor. It is also about not living with families that offer appropriate care and protection, not living in adequate or safe housing, not having access to affordable and quality education and health care, not having appropriate support for their needs, and not having equal opportunities to thrive.
CHILD POVERTY AND CHILD RIGHTS Child poverty is a multidimensional problem.2 It stems not just from low income, but from exclusion and a denial of children’s rights. According to the United
PAGE 6 CHILD POVERTY AND CHILD RIGHTS IN THE EUROPEAN UNION
Nations Convention on the Rights of the Child (UNCRC) – which every European country has signed and ratified – every child has the right to fully develop their social, emotional, cognitive and physical potential, and to an adequate standard of living, no matter what their family circumstances are. The UNCRC specifically guarantees them the right to education, healthcare, housing and protection, to participate in decisions that affect them, to enjoy play and leisure and a balanced diet, and to be cared for in a family environment. Moreover, in all actions concerning children, the best interests of the child shall be a primary consideration. 2014 marks the 25th Anniversary of the UNCRC. Now is therefore the right time to take stock of achievements and progress so far, reflect on lessons learnt and gather ideas and recommendations on what can be further improved in the future.
It is undeniable that EU legislation, policy and funding have enormous impact on the lives of children inside and outside the EU. The last decade has witnessed significant progress in strengthening the EU’s role in promoting and realising children’s rights and channelling resources to children – especially the most vulnerable. The EU’s Lisbon Treaty strengthened the EU’s commitment and provided that protecting the rights of children is an objective of the EU. Furthermore, the Charter of Fundamental Rights of the EU guarantees the protection of children’s rights by EU institutions, as well as by EU countries when they implement EU law.
EU RECOMMENDATION INVESTING IN CHILDREN In 2011 the EU laid out a clear framework for EU action called the Agenda on the Rights of the Child. Since its adoption the EU has made important progress, through implementation of this Agenda, in a number of key areas particularly with the establishment of a Europe wide missing children’s hotline, the promotion of a child-friendly justice system, the improvement of data collection and the integration of a child’s rights lens into external action. However, it must be remembered that there are no child-neutral policies - a child’s rights approach needs to be applied in internal market, trade, finance and infrastructure policy as well as the more obvious areas of education, health, employment and welfare. Targeted action designed to protect the most vulnerable and marginalised children needs to be embedded in a comprehensive, integrated and forward-looking child rights strategy.
PAGE 7 CHILD POVERTY AND CHILD RIGHTS IN THE EUROPEAN UNION
We are absolutely convinced that fighting child poverty has to be framed in a broader child rights approach which addresses children’s holistic well-being. A study carried out by Eurochild in 2013 concluded that consideration of the rights of the child in the institutions is still marginal and there is a lack of awareness of the relevance of children’s rights and how they can be taken into account in decision-making.3 The EU faces enormous institutional constraints in taking forward policy agendas that cross the traditional sectoral boundaries. This silo approach is simply not helpful for children. Nor do we believe is it the most cost-effective in addressing the challenges ahead. Children’s rights need to be mainstreamed across all the competencies of the EU in order to ensure that children’s rights in the EU are fully realised and protected.4
GOVERNMENT ARE NOT GIVING YOU A CHANCE,
YOU HAVE NOTHING AND YOU WILL NEVER
HAVE NOTHING.
A MOTHER TALKS ABOUT EQUALITY.
A paradigm shift is also needed across Europe towards considering investment in children as a cost-effective fiscal policy at European, national, regional and local levels. Poverty and exclusion deny children their rights and, in doing so, limit their opportunities to acquire the skills and capabilities that will enable them to work their way out of poverty and contribute to the future well-being of society. All European governments have a duty to fulfil and protect children’s rights. We are convinced that promoting children’s rights can mitigate the consequences of poverty and, in the long term, reduce and prevent it.5
PAGE 8 CHILD POVERTY AND CHILD RIGHTS IN THE EUROPEAN UNION
Addressing child poverty is primarily the responsibility of member states; however, the EU has become more involved in influencing social policy since the adoption of the Europe 2020 Strategy.6 The discussion on poverty and social exclusion evolved significantly in its wake. The Strategy represents a key policy shift within the EU that economic growth needs to be achieved through socially responsible means and calls for more integration between economic, environmental and social policy. Within the Europe 2020 Strategy the EU was bold enough to set a poverty reduction target of 20 million by 2020 which represents a significant policy advancement. Although the adoption of the Europe 2020 Strategy in 2010 marked an important landmark in Europe’s efforts to tackle poverty and social exclusion in general and child poverty in particular, we must acknowledge that Europe 2020 in its current form is not delivering for children. Europe is moving farther away, rather than closer to, its poverty reduction target. The EU needs to ensure member states take the target seriously. This year, seven countries received Country Specific Recommendations (CSRs) calling explicitly for increased efforts to reduce child poverty. More received CSRs on inclusive education and increasing early childhood education and care service provision. This is to be welcomed. However, the overall lack of coherence of CSRs and the increasingly narrow focus on employability – particularly with respect to young people - is of great concern. A sustainable and inclusive exit from the crisis requires that economic and employment measures reinforce, rather than undermine, efforts towards poverty reduction and social inclusion.
This year the EU will be taking stock and a mid-term review of the process will be taking place. This will be crucial to restate commitment to act from both EU and national decision-makers. Europe has no chance of achieving its goals of smart, sustainable and inclusive growth if it fails to address how policies are impacting children, and what policies help all children to fulfil their potential.
The EU has already sent a clear message to member states that investing in children must be a priority even in times of austerity. The Recommendation 'Investing in Children - Breaking the Cycle of Disadvantage' was adopted by the European Commission as part of its Social Investment Package in February 2013.7 It takes a child rights approach, emphasising the best interests of the child, equal opportunities and support for the most disadvantaged. It promotes integrated strategies based on three pillars: access to resources, access to quality services,
PAGE 9 CHILD POVERTY AND CHILD RIGHTS IN THE EUROPEAN UNION
and child participation. It recommends member states use structural funds to catalyse reforms that implement the Recommendation. It suggests that Europe 2020 and its governance tools be used to support child-centred investment.
CONCLUSION Child poverty is widely recognised to be a major drain on resources and a waste of human potential. The moral duty on governments to respect and implement children’s rights is also gaining credence. The EU policy framework can help to highlight the gaps between rhetoric and policy and the risk this poses to millions of children’s overall chances in life. There is no better way to build a brighter future than to invest in our children.
In conclusion, in order for the EU to fulfil its commitment and become a true champion for children’s rights and well-being it must:
Put children at the heart of the European Semester and the Europe 2020 governance system.
Ensure that EU Funds benefit children.
Support implementation of the European Commission’s Recommendation on Investing in Children to achieve better outcomes for children.
Strengthen capacity to mainstream child rights in everything it does.
1 Eurochild Crisis Update, How the Economic and Financial Crisis is affecting Children and Young People in Europe, 2012, http://old.eurochild.eu/fileadmin/ThematicPriorities/Crisis/Eurochild%20updates/Eurochild_Crisis_Update_Report_2012.pdf accessed 14 October 2014 2 For more information about the multidimensional nature of child poverty please see European Anti-Poverty Network (EAPN) and Eurochild, Towards Children’s Well-being in Europe: Explainer on child poverty in the EU, 2013, http://issuu.com/eurochild_org/docs/2013_child_poverty_eu?e=5569316/2300156 accessed 14 October 2014 3 Eurochild, Mainstreaming child rights in EU legislation, policy and programmes - lessons from practice, 2014,

PAGE 10 CHILD POVERTY AND CHILD RIGHTS IN THE EUROPEAN UNION
http://www.eurochild.org/fileadmin/public/05_Library/Thematic_priorities/01_Childrens_Rights/Eurochild/Mainstreaming_Childrens_Rights_Discussion-paper_Feb2014.pdf accessed 14 October 2014 4 For more information on mainstreaming children’s rights in the EU, please see Eurochild and UNICEF, Realising the Rights of Children in the EU, Moving Forward with the EU, 2014, http://www.eurochild.org/fileadmin/public/05_Library/Thematic_priorities/01_Childrens_Rights/Eurochild/Eurochild_UNICEF_Realising-Childrens-Rights-EU_Feb2014_low-res.pdf accessed 14 October 2014 5 Eurochild, A Child’s Rights Approach to Child Poverty, 2007, http://www.eurochild.org/fileadmin/public/05_Library/Thematic_priorities/01_Childrens_Rights/Eurochild/Eurochild_discussion_paper_child_rights___poverty.pdf accessed 14 October 2014 6 For more information on Europe 2020, please see the European Commission website available at: http://ec.europa.eu/europe2020/index_en.htm 7 European Commission Recommendation, Investing in Children: Breaking the Cycle of Disadvantage (2013/112/EU), http://eur-lex.europa.eu/LexUriServ/LexUriServ.do?uri=OJ:L:2013:059:0005:0016:EN:PDF and for Eurochild’s assessment of the Recommendation and suggestions for implementation at national level please see: http://old.eurochild.eu/fileadmin/ThematicPriorities/ChildPoverty/Eurochild/Eurochild_assessment_of_the_Recommendation_2013.pdf accessed 14 October 2014
PAGE 11
____________________________________________
CHAPTER TWO
CHILD POVERTY IN NORTHERN IRELAND: RESULTS FROM
THE POVERTY AND SOCIAL EXCLUSION STUDY
Mike Tomlinson, Paddy Hillyard, Grace Kelly Queen’s University Belfast
____________________________________________
INTRODUCTION The Child Poverty Act of 2010 represents a landmark in government policy on child poverty. Not only did the Act set a number of targets to ‘eradicate’ child poverty by 2020, but it also established a framework of policy strategies and reporting covering both the UK Government and the devolved administrations.1 While the Act had broad support across the political spectrum, the apparent consensus masks determined efforts by members of the Coalition Government to undermine core sections of the Act, including what counts as child poverty. This article explores the official child poverty measures using results for Northern Ireland from the Poverty and Social Exclusion (PSE) study based on surveys carried out in 2011/12.2 We explain the differences between the official measures and the PSE poverty line, and examine one of the unique features of the PSE work, namely evidence on people’s experience of the conflict/’troubles’. We conclude with a discussion of the UK and Northern Ireland Governments’ approaches to child poverty.
INCOME AND DEPRIVATION

PAGE 12 CHILD POVERTY IN NORTHERN IRELAND: RESULTS FROM THE POVERTY AND SOCIAL EXCLUSION STUDY
The four measures of child poverty specified in the 2010 Act are based on low income and deprivation so it is important to understand how these are counted.3 The measures are constructed from data collected by the Family Resources Survey (FRS). For Great Britain, we have a picture of household incomes, by region, stretching back to 1992. In the case of Northern Ireland, there was no reliable population-wide measure of low income until the PSE survey of 2002 which, for the first time, produced an estimate of child poverty at around 37 per cent of all children (approximately 149,000). The survey found that 8 per cent of children relied on second hand clothes, 7 per cent lacked enough bedrooms for boys and girls over 10 to sleep separately, 10 per cent could not afford family days out, 21 per cent could not afford a computer to do homework and 28 per cent had no annual holiday away from home.4 Immediately following the first PSE survey, a decision was taken to carry out the FRS in Northern Ireland and we now have eleven years of data with which to compare our position with the English regions, Scotland and Wales.
In order to compare the living standards of different households, household income is ‘equivalised’ in the analysis of all surveys of income. Clearly, a weekly income of £200 per week for a single person with no children is not equivalent to the same sum for a couple with two teenage children. It is now common practice to apply a scale which adjusts household income so that the purchasing power can be compared from one household to another. This is an important issue because some equivalence scales are more ‘generous’ than others and therefore potentially result in a higher measure of poverty. The FRS uses the ‘modified OECD’ scale and the weighting differs for household income before housing costs are deducted (BHC) and after housing costs are deducted (AHC). The PSE scale is notable for giving a higher value to children and for giving an extra value for a person with a longstanding limiting illness or disability in recognition of the extra average costs associated with such a condition. Also, the PSE scale is based on the values implied in the Minimum Income Standard budgets for the UK whereas the OECD scales are regarded as somewhat arbitrary.5
Another issue concerns regional variations in incomes and housing costs. There is an argument that relative income poverty rates are inflated for Northern Ireland by using the UK median as the reference point. From the 2012/13 FRS survey results, for example, we know that the median weekly income for a single adult household
PAGE 13 CHILD POVERTY IN NORTHERN IRELAND: RESULTS FROM THE POVERTY AND SOCIAL EXCLUSION STUDY
(BHC) was £295 for the UK but only £265 for Northern Ireland, or ten per cent lower. It would be possible to calculate poverty rates for Northern Ireland based on Northern Ireland, rather than UK, median incomes. In effect this would replicate the approach used for calculating poverty rates across the EU whereby the median income within each country, not the EU median income, is used as the reference point. The argument against using a lower Northern Ireland threshold is that a UK-wide standard should apply, in keeping with the Child Poverty Act, against which progress over time and relative to the English regions, Scotland and Wales can be gauged. Further, most of the policies affecting household incomes and child poverty are matters over which the UK Government has most control, namely taxes and benefits.
Average housing costs tend to be lower in Northern Ireland than elsewhere, apart from an exceptional period in 2007 when they exceeded the UK average briefly.6 In high housing cost areas, the deduction of housing costs from household income (the AHC measure) has a much bigger impact on reducing income than for Northern Ireland. Relative to other areas therefore, Northern Ireland tends to have higher rates of income poverty using the BHC measure than under the AHC measure. While Northern Ireland has the lowest BHC median income out of the 12 areas covering the English regions, Scotland and Wales, it comes 9th in the ranking of AHC median incomes. The AHC measure is generally favoured by poverty analysts as it provides the most realistic comparison of disposable incomes and because households arguably have very little control over their housing costs. A similar argument arises with disability. Households have little control over the additional costs of disability so, arguably, any benefits paid in respect of disability should be removed from the household income to provide a true measure of disposable income.7
From 2004/05, the FRS included questions on material deprivation, as a number of studies had demonstrated the importance of combining low income with deprivation to produce better measures of poverty.8 It is now the established practice in Europe to discuss poverty in terms of deprivation rates, low incomes and some combination of the two. But what counts as deprivation varies considerably. The deprivation items used in the Republic of Ireland for the ‘consistent poverty’ measure (based on lacking two out of eleven items),9 as with

PAGE 14 CHILD POVERTY IN NORTHERN IRELAND: RESULTS FROM THE POVERTY AND SOCIAL EXCLUSION STUDY
Eurostat deprivation (based on the lack of three or four out of nine items), do not include any child-specific items so child deprivation has to be implied or assumed from adult deprivation. This may not be correct: if adults say they cannot afford to replace worn out clothes, or eat meat/proteins regularly, this does not necessarily apply to any children in the household as parents are known to make sacrifices to ensure children do not go without.
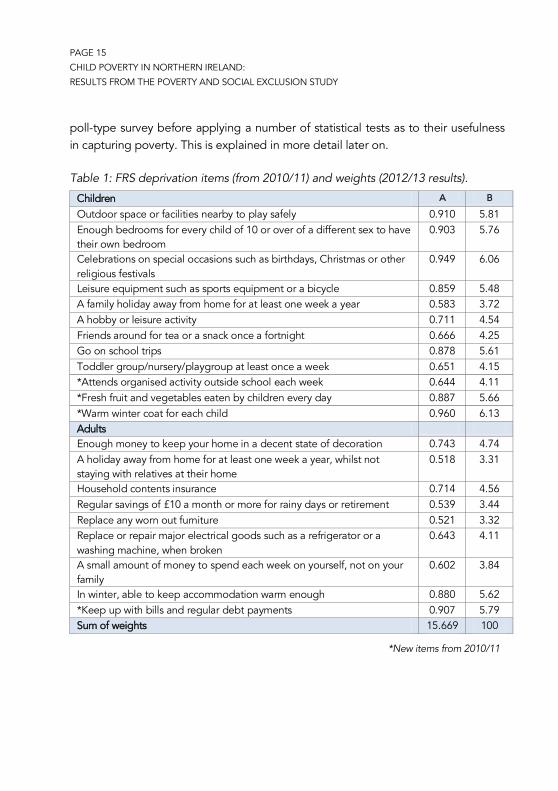
The FRS deprivation items are shown in Table 1. Twelve of the 21 items apply to children and some of them apply to children in particular age groups only. For the purpose of the Child Poverty Act measure, low income households (in this case, below 70 per cent of the median) are combined with those households lacking sufficient items to pass a threshold score of 25. The items are ‘prevalence weighted’ by their relative importance within the list. In the case of ‘Go on school trips’, for example, 87.8 per cent (column A) can afford for their children to participate, which amounts to a 5.61 per cent (column B) weighting in the whole list. For all items that a household lacks, the scores in column B are added to see if the threshold of 25 is crossed.
There are two interesting points about the FRS list of deprivation items that concern us here. The first is that the list changed in 2010/11: four items were dropped and replaced by the new items highlighted below. This had a considerable impact on the proportion of children in combined low income/deprivation. Simply by changing four of the items, the combined income and deprivation poverty measure drops from 16 to 12 per cent of children (19,000 children). The second point is that the threshold of 25 is both arbitrary and conservative, more in line with the Republic of Ireland’s consistent poverty measure.10 To achieve the threshold, between five and seven items need to be lacking.
This is not to discredit the use of a long list as such. Many of the FRS items are consistent with deprivation research historically and it is accepted that a list of items needs to be revised from time to time to reflect social changes. The key issue is the basis on which items are either included or excluded, and how the deprivation threshold is drawn. The approach taken in the PSE study – known as the ‘consensual poverty’ approach – is to identify deprivation items through an opinion
PAGE 15 CHILD POVERTY IN NORTHERN IRELAND: RESULTS FROM THE POVERTY AND SOCIAL EXCLUSION STUDY
poll-type survey before applying a number of statistical tests as to their usefulness in capturing poverty. This is explained in more detail later on.
Table 1: FRS deprivation items (from 2010/11) and weights (2012/13 results).
Children A B
Outdoor space or facilities nearby to play safely 0.910 5.81 Enough bedrooms for every child of 10 or over of a different sex to have their own bedroom
0.903 5.76
Celebrations on special occasions such as birthdays, Christmas or other religious festivals
0.949 6.06
Leisure equipment such as sports equipment or a bicycle 0.859 5.48 A family holiday away from home for at least one week a year 0.583 3.72 A hobby or leisure activity 0.711 4.54 Friends around for tea or a snack once a fortnight 0.666 4.25 Go on school trips 0.878 5.61 Toddler group/nursery/playgroup at least once a week 0.651 4.15 *Attends organised activity outside school each week 0.644 4.11 *Fresh fruit and vegetables eaten by children every day 0.887 5.66 *Warm winter coat for each child 0.960 6.13 Adults
Enough money to keep your home in a decent state of decoration 0.743 4.74 A holiday away from home for at least one week a year, whilst not staying with relatives at their home
0.518 3.31
Household contents insurance 0.714 4.56 Regular savings of £10 a month or more for rainy days or retirement 0.539 3.44 Replace any worn out furniture 0.521 3.32 Replace or repair major electrical goods such as a refrigerator or a washing machine, when broken
0.643 4.11
A small amount of money to spend each week on yourself, not on your family
0.602 3.84
In winter, able to keep accommodation warm enough 0.880 5.62 *Keep up with bills and regular debt payments 0.907 5.79 Sum of weights 15.669 100
*New items from 2010/11 .

PAGE 16 CHILD POVERTY IN NORTHERN IRELAND: RESULTS FROM THE POVERTY AND SOCIAL EXCLUSION STUDY THE DECLINE IN HOUSEHOLD INCOMES Three of the Child Poverty Act measures rest on income alone. In addition to the relative income measure (60 per cent of median) mentioned above, there is an ‘absolute’ poverty measure based on the 60 per cent threshold at a fixed point in time.11 Figure 1 shows the proportion of children in poverty according to the Act’s relative and absolute income poverty measures (based on three-year rolling averages). Given the recent recession and below-inflation increases in wages and benefits, we would expect poverty to rise. In fact relative income poverty has declined by more than three percentage points during the worst period of recession because the 60 per cent median threshold has fallen faster than the lowest incomes. In contrast absolute income poverty (based on 2010/11 values) rose by two percentage points.
Figure 1: Proportion of N. Ireland children in income poverty.
Source: Child Poverty Act measures derived from Northern Ireland Poverty Bulletin 2012/13. .
18.0
19.0
20.0
21.0
22.0
23.0
24.0
25.0
26.0
Relative
Absolute
PAGE 17 CHILD POVERTY IN NORTHERN IRELAND: RESULTS FROM THE POVERTY AND SOCIAL EXCLUSION STUDY
Table 2: Rank of Mean incomes (AHC) of individuals by UK areas and N. Ireland mean relative to UK and highest UK region (12/13 prices).
Rank of Mean Income AHC (lowest =12) 02
/03-
04/0
5
03/0
4-05
/06
04/0
5-06
/07
05/0
6-07
/08
06/0
7-08
/09
07/0
8-09
/10
08/0
9-10
/11
09/1
0-11
/12
10/1
1-12
/13
South East 2 2 2 2 2 2 2 1 1 London 1 1 1 1 1 1 1 2 2 East of England 3 3 3 3 3 3 3 3 3 Scotland 5 5 5 4 4 4 4 4 4 South West 4 4 4 5 5 5 5 5 5 East Midlands 7 6 7 6= 9 6 6 6 6 North West 6 7 6 6= 7 9 8 7 7 Yorkshire and the Humber 8 9 10 8 8 8 11 9= 8 West Midlands 9 10 11 11 11 11 10 9= 9 Wales 11 11 8 9 6 7 7 8 10
= North East 12 12 12 12 12 12 12 12 10= Northern Ireland 10 8 9 10 10 10 9 9= 12
Mean income £pw
UK 482 489 498 505 509 513 503 490 472 Highest (1) 576 579 594 607 611 610 585 574 556 Lowest (12) 410 417 428 432 434 433 436 427 412 N Ireland (UK=100) 89 90 90 90 89 89 89 88 87 N Ireland (Highest=100) 75 76 75 74 74 75 77 75 74
Source: Derived from the Family Resources Survey .
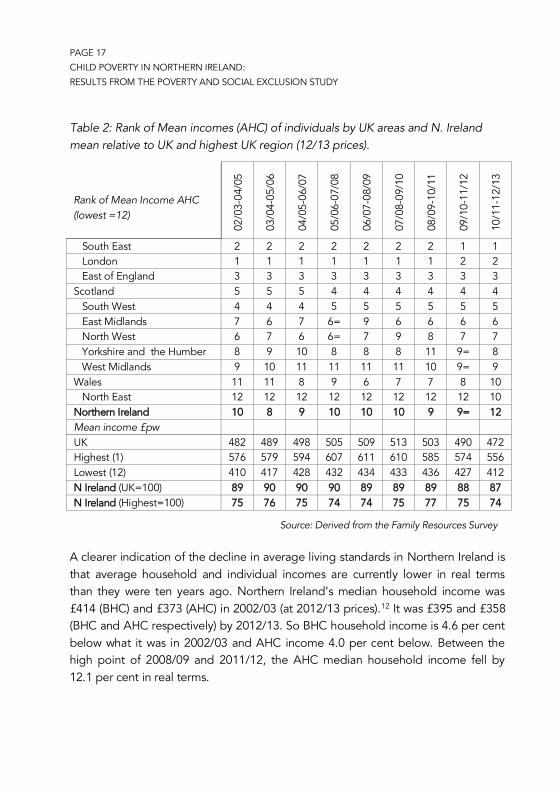
A clearer indication of the decline in average living standards in Northern Ireland is that average household and individual incomes are currently lower in real terms than they were ten years ago. Northern Ireland’s median household income was £414 (BHC) and £373 (AHC) in 2002/03 (at 2012/13 prices).12 It was £395 and £358 (BHC and AHC respectively) by 2012/13. So BHC household income is 4.6 per cent below what it was in 2002/03 and AHC income 4.0 per cent below. Between the high point of 2008/09 and 2011/12, the AHC median household income fell by 12.1 per cent in real terms.
PAGE 18 CHILD POVERTY IN NORTHERN IRELAND: RESULTS FROM THE POVERTY AND SOCIAL EXCLUSION STUDY
Northern Ireland’s position relative to the UK has also deteriorated under devolved government such that it is now at the bottom of the league (Table 2). Individual AHC average income in Northern Ireland is now 87 per cent of the UK average and less than three-quarters of the average in the highest income region, the South East of England. In real terms a citizen of Northern Ireland has on average £144 less per week to live on than someone living in the English region with the highest incomes.
MY HEATING ONLY
COMES ON FOR 1½ HOURS IN THE
MORNING AND THEN A FEW IN THE EVENING
AND THAT IS IT.
PARENT DISCUSSING THE PRICE
OF OIL AND GAS.
PSE: THE ‘CONSENSUAL POVERTY’ APPROACH As indicated above, the approach used by the PSE study is based on the notion of the consensual poverty approach involving relative incomes, deprivation and social exclusion. It builds on the work of Peter Townsend and the idea that to be in poverty means that people are excluded in some way from a standard of living and way of life that the majority regard as acceptable:
Individuals, families and groups in the population can be said to be in poverty when they lack the resources necessary to obtain the type of diet, participate in the activities and have the living conditions which are customary, or at least widely encouraged or approved, in the societies to which they belong. Their resources
PAGE 19 CHILD POVERTY IN NORTHERN IRELAND: RESULTS FROM THE POVERTY AND SOCIAL EXCLUSION STUDY
are so seriously below those commanded by the average individual or family that they, are in effect, excluded from ordinary living patterns, customs and activities.13
Mack and Lansley14 built on Townsend’s work by arguing that a consensus on what was ‘normal’ in a given society could be established by asking people for their views. This way, the ‘necessities of life’ would be defined by a popular consensus rather than by experts or politicians.
The first step in the PSE approach, therefore, is to establish which items and activities the general public believe are basic necessities. In 2012, a representative sample of the adult population was presented with a list of 76 adult and children’s items and activities, and asked which ones they thought were ‘necessary’, ‘desirable but not necessary’, or ‘does not apply’.15 Fifty per cent or more of the population must regard an item as necessary for it to be included in the potential list of ‘socially perceived necessities’. Children’s necessities are based on what adults think, as the survey made no attempt to canvas children’s views.
SOCIALLY PERCEIVED NECESSITIES Tables 3 and 4 present the survey results for the proportion of people agreeing that an item or activity is a basic necessity for children. Items associated with children’s health, development, environmental and social needs are clearly prioritised. The table also shows how people’s views are consistent across the UK in general and between Northern Ireland and Great Britain specifically, with no statistically significant differences of opinion as measured using relative risk ratios.16

PAGE 20 CHILD POVERTY IN NORTHERN IRELAND: RESULTS FROM THE POVERTY AND SOCIAL EXCLUSION STUDY
Table 3: Level of support for children’s items – 2012 Omnibus survey.17
(% stating item 'necessary')
Relative risk ratios (GB vs. Northern Ireland)
Child items GB NI UK Relative
Risk 95% CI Lower
95% CI Upper
RR Sig
A warm winter coat 97 96 97 1.0 1.0 1.1 ns
Fresh fruit or vegetables at least once a day 96 94 96 1.0 1.0 1.1 ns
Three meals a day 93 93 93 1.0 0.9 1.1 ns
New, properly fitting, shoes 93 90 93 1.0 0.9 1.1 ns
A garden or outdoor space nearby where they can play safely
92 91 92 1.0 0.9 1.1 ns
Books at home suitable for their ages 92 88 91 1.0 0.9 1.2 ns
Meat, fish or veg equivalent at least once a day
90 88 90 1.0 0.9 1.1 ns
A suitable place at home to study / do homework
89 88 89 1.0 0.9 1.1 ns
Indoor games suitable for their ages 81 74 81 1.1 0.9 1.3 ns Enough bedrooms for every child of 10 or over of a different sex to have their own bedroom
75 65 74 1.1 0.9 1.4 ns
Computer and internet for homework 66 67 66 1.0 0.8 1.2 ns
Some new, not second-hand clothes 65 66 65 1.0 0.8 1.2 ns
Outdoor leisure equipment such as rollerskates, skateboards, footballs etc.
58 60 58 1.0 0.8 1.2 ns
At least 4 pairs of trousers, leggings, jeans or jogging bottoms
57 51 57 1.1 0.8 1.5 ns
Money to save 55 53 55 1.0 0.8 1.3 ns
Pocket money 54 52 54 1.0 0.8 1.4 ns
Construction toys such as Duplo or Lego 53 52 53 1.0 0.8 1.3 ns
Bicycle 45 50 45 0.9 0.7 1.2 ns
Clothes to fit in with friends 31 30 31 1.0 0.7 1.6 ns
Mobile phone for children aged 11 or older 27 27 27 1.0 0.6 1.5 ns
MP3 player such as an iPod 8 10 8 0.8 0.3 1.8 ns
Designer/brand name trainers 6 9 6 0.7 0.3 1.8 ns
PAGE 21 CHILD POVERTY IN NORTHERN IRELAND: RESULTS FROM THE POVERTY AND SOCIAL EXCLUSION STUDY
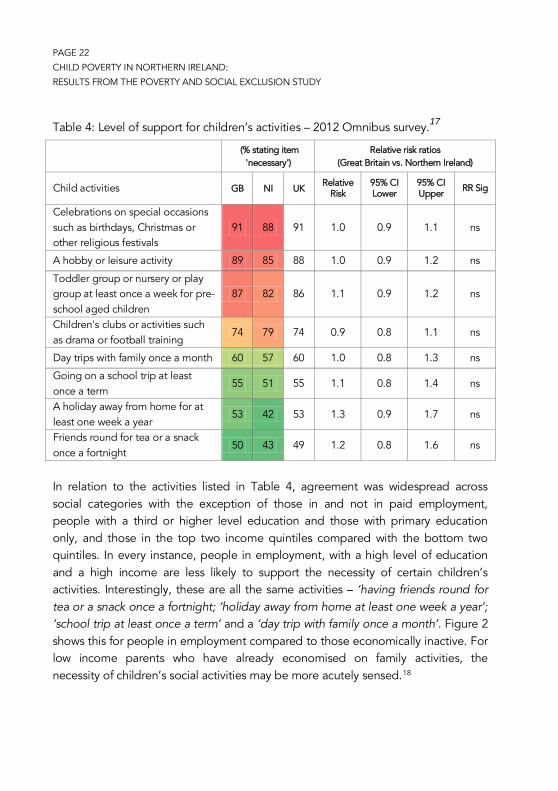
One item stands out (Table 4), where the different Northern Ireland/GB scores straddle the 50 per cent threshold. Only 42 per cent of people in Northern Ireland believe that it is a basic necessity for children to have a week’s holiday away from home each year, compared to 53 per cent of people in GB. The difference was not found to be statistically significant, however.
The validity of the consensual approach relies on a high level of agreement among the general public on basic necessities for adults and children. There should be few significant differences between men and women, Catholics and Protestants, by age or socio-economic position, for the concept to be valid. For the most part, very similar proportions of men and women agree on what children need, one exception being that men are more likely than women to say that children need pocket money (62 per cent of men and 46 per cent of women). There were very few differences between Catholics and Protestants. Interestingly, opinions between people with dependent children and those without are also close in agreement with the interesting exception that people without dependent children are more likely to think construction toys are a necessity (58 per cent compared with 44 per cent for those with children). Older people were much more likely than younger people to say that pocket money was a necessity (79 compared to 37 per cent).
PAGE 22 CHILD POVERTY IN NORTHERN IRELAND: RESULTS FROM THE POVERTY AND SOCIAL EXCLUSION STUDY
Table 4: Level of support for children’s activities – 2012 Omnibus survey.17
(% stating item 'necessary')
Relative risk ratios (Great Britain vs. Northern Ireland)
Child activities GB NI UK Relative Risk
95% CI Lower
95% CI Upper RR Sig
Celebrations on special occasions such as birthdays, Christmas or other religious festivals
91 88 91 1.0 0.9 1.1 ns
A hobby or leisure activity 89 85 88 1.0 0.9 1.2 ns
Toddler group or nursery or play group at least once a week for pre-school aged children
87 82 86 1.1 0.9 1.2 ns
Children's clubs or activities such as drama or football training
74 79 74 0.9 0.8 1.1 ns
Day trips with family once a month 60 57 60 1.0 0.8 1.3 ns
Going on a school trip at least once a term
55 51 55 1.1 0.8 1.4 ns
A holiday away from home for at least one week a year
53 42 53 1.3 0.9 1.7 ns
Friends round for tea or a snack once a fortnight
50 43 49 1.2 0.8 1.6 ns
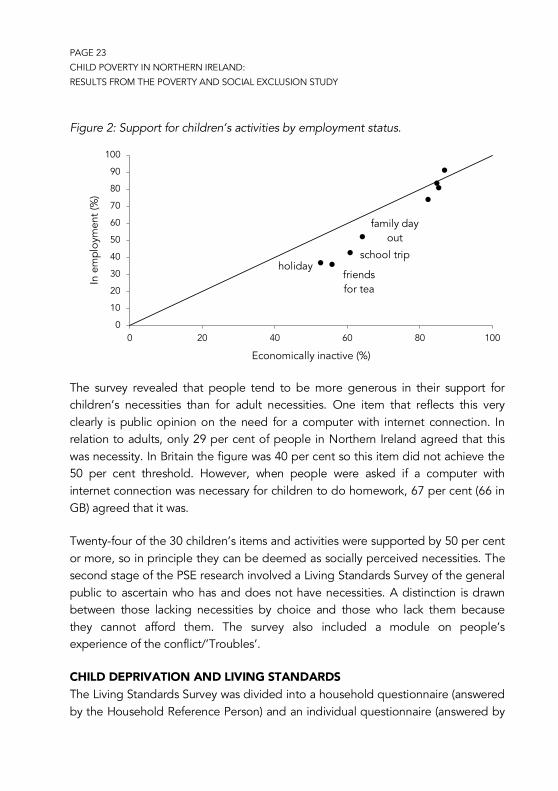
In relation to the activities listed in Table 4, agreement was widespread across social categories with the exception of those in and not in paid employment, people with a third or higher level education and those with primary education only, and those in the top two income quintiles compared with the bottom two quintiles. In every instance, people in employment, with a high level of education and a high income are less likely to support the necessity of certain children’s activities. Interestingly, these are all the same activities – ‘having friends round for tea or a snack once a fortnight; ‘holiday away from home at least one week a year’; ‘school trip at least once a term’ and a ‘day trip with family once a month’. Figure 2 shows this for people in employment compared to those economically inactive. For low income parents who have already economised on family activities, the necessity of children’s social activities may be more acutely sensed.18
PAGE 23 CHILD POVERTY IN NORTHERN IRELAND: RESULTS FROM THE POVERTY AND SOCIAL EXCLUSION STUDY
Figure 2: Support for children’s activities by employment status.
The survey revealed that people tend to be more generous in their support for children’s necessities than for adult necessities. One item that reflects this very clearly is public opinion on the need for a computer with internet connection. In relation to adults, only 29 per cent of people in Northern Ireland agreed that this was necessity. In Britain the figure was 40 per cent so this item did not achieve the 50 per cent threshold. However, when people were asked if a computer with internet connection was necessary for children to do homework, 67 per cent (66 in GB) agreed that it was.
Twenty-four of the 30 children’s items and activities were supported by 50 per cent or more, so in principle they can be deemed as socially perceived necessities. The second stage of the PSE research involved a Living Standards Survey of the general public to ascertain who has and does not have necessities. A distinction is drawn between those lacking necessities by choice and those who lack them because they cannot afford them. The survey also included a module on people’s experience of the conflict/’Troubles’.
CHILD DEPRIVATION AND LIVING STANDARDS The Living Standards Survey was divided into a household questionnaire (answered by the Household Reference Person) and an individual questionnaire (answered by
holiday friends for tea
school trip
family day out
0
10
20
30
40
50
60
70
80
90
100
0 20 40 60 80 100
In e
mpl
oym
ent (
%)
Economically inactive (%)
PAGE 24 CHILD POVERTY IN NORTHERN IRELAND: RESULTS FROM THE POVERTY AND SOCIAL EXCLUSION STUDY
all adult household members aged 18 and over). Questions about children in the household were addressed to the parent or guardian who, on consultation, was considered to be the main carer for the children, and thus best placed to answer questions about their children’s circumstances. The survey asked whether the individual adult, or child, or household, had the item or carried out the activity in question. Respondents were asked to say whether this was by choice or because they could not afford it.
Of the 24 child items and activities, 22 were found to be valid, reliable and ‘additive’ in that each independently added to the distinction between ‘deprived’ and ‘non-deprived’ children. A similar set of statistical tests were carried out for adult items, some of which we have classified as ‘household’ items on the grounds that if, for example, the accommodation is damp, this will affect the children just as much (if not more) than the adults. There are 44 items in the final PSE deprivation list and for child deprivation, there are 22 child-specific items and five household items assumed to affect children (see Table 5). While there is a degree of overlap, one of the FRS child deprivation items (having friends round once a fortnight) and four of the adult items are not in the PSE list.
In Table 5, children who do not have an item (or do not participate in an activity) are divided into two columns – the ‘don’t wants’ and the ‘cannot affords’. It could be argued that what matters to child well-being is that children do not live in a damp home, or that they have fresh fruit and vegetables daily, rather than whether their parent/s ‘choose’ these things. For the purposes of measuring PSE poverty, however, children are only counted as being deprived of an item if the parent says they cannot afford it (even though people may say they don’t want an item to hide the fact that they cannot afford it). Not all of the figures apply to all children (436,000). For example the computer/internet question applies only to 5-17 year olds (287,000) and the results tell us that around 31,600 children in this age group do not have access to a computer and the internet at home, including 18,000 for reasons of affordability. The books question applies to 2-17 year olds (365,000) and the bedroom question to 10-17 year olds (179,000). Over 20,000 children are deprived of the appropriate bedroom standard because of poverty.

PAGE 25 CHILD POVERTY IN NORTHERN IRELAND: RESULTS FROM THE POVERTY AND SOCIAL EXCLUSION STUDY
Table 5: Child deprivation items and Living Standards Survey result. Necessities Northern Ireland responses (%)
Have Do not have, does not want
Do not have, cannot afford Children Ages
(All=0-17) FOOD Fresh fruit or vegetables at least once a day 95.1 3.0 1.5 All Three meals a day 98.9 0.5 0.5 All Meat, fish or veg equiv at least once a day 94.1 2.0 2.8 All CLOTHES A warm winter coat 96.7 2.0 1.3 All New, properly fitting shoes 94.3 1.4 3.3 All Some new, not second-hand clothes 90.7 4.2 5.1 All At least 4 pairs of trousers etc. 92.5 2.3 4.3 All DEVELOPMENTAL Books at home suitable for their ages 97.4 1.6 1.0 2-17 Computer and internet for homework 87.8 4.8 6.2 5-17 Outdoor leisure equipment etc. 85.5 9.7 4.5 All Pocket money 65.9 16.4 16.5 5-17 Money to save 61.7 8.3 28.3 5-17 ENVIRONMENTAL A garden or outdoor space 92.4 1.2 4.9 All A suitable place to study/ do homework 94.2 1.3 3.2 5-17 Enough bedrooms for every child of 10 83.0 5.7 11.4 10-17 Do Doesn’t want Cannot afford Another reason
PARTICIPATION & ACTIVITIES Celebrations on special occasions 97.5 0.3 0.9 0.3 All A hobby or leisure activity 87.6 4.0 5.9 2.1 5-17 Toddler group or nursery or play group 74.4 11.6 0.6 11.7 <5 Children's clubs or activities 73.7 15.3 5.7 4.3 2-17 Day trips with family once a month 69.4 8.1 15.8 5.2 All Going on a school trip at least once a term 73.5 5.2 10.6 9.4 5-17 A holiday for at least one week a year 54.6 6.0 34.3 4.2 All Have Doesn’t want Cannot afford HOUSEHOLD Could your household afford to pay an un-expected, but necessary, expense of £500? 44.7 n/a 55.3 All
Home Insurance 77.4 n/a 22.6 All Damp-free home 81.9 4.5 12.8 All Table/chairs at which all the family can eat 94.8 3.3 1.9 All Curtains or window blinds 97.5 1.2 0.8 All
PAGE 26 CHILD POVERTY IN NORTHERN IRELAND: RESULTS FROM THE POVERTY AND SOCIAL EXCLUSION STUDY
Overall, few children lack the very basic necessities of food and clothing. On the basis of the Living Standards Survey, about 12,000 children in Northern Ireland are lacking a good daily source of protein and about half that number, fresh fruit and vegetables. Around 20,000 are deprived of adequate clothing. The higher deprivation scores lie in the social and developmental areas. Parents are unable to afford to give pocket money to some 47,000 children and 81,000 are unable to save. Over a third of all children (150,000) are deprived of an annual holiday of a minimum of a week away from home and 69,000 do not have a family day out once a month. Around 75,000 children are growing up in damp homes. A key measure of financial vulnerability is that more than half of all children (241,000) are living in households that could not pay an unexpected but necessary expense of £500.
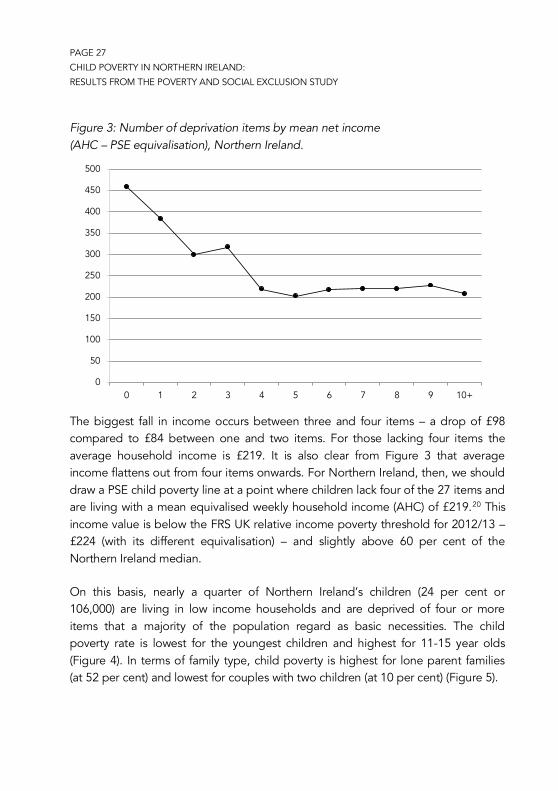
DRAWING THE CHILD POVERTY LINE Analysis of the PSE data on child deprivation for the UK as a whole suggests that there are two points at which the number of deprivation items are marked by a sharp drop in average household income.19 On the basis of 24 child-only items, Main and Bradshaw suggest that poverty lines can be drawn for children lacking two items and five items, the latter providing a measure of severe poverty. Applying a similar approach to the Northern Ireland data, Figure 3 shows the average equivalised disposable weekly household income for those lacking 0, 1, 2 etc. items using the 44 items in the final PSE deprivation measure (27 of which apply to children).
PAGE 27 CHILD POVERTY IN NORTHERN IRELAND: RESULTS FROM THE POVERTY AND SOCIAL EXCLUSION STUDY
Figure 3: Number of deprivation items by mean net income (AHC – PSE equivalisation), Northern Ireland.
The biggest fall in income occurs between three and four items – a drop of £98 compared to £84 between one and two items. For those lacking four items the average household income is £219. It is also clear from Figure 3 that average income flattens out from four items onwards. For Northern Ireland, then, we should draw a PSE child poverty line at a point where children lack four of the 27 items and are living with a mean equivalised weekly household income (AHC) of £219.20 This income value is below the FRS UK relative income poverty threshold for 2012/13 – £224 (with its different equivalisation) – and slightly above 60 per cent of the Northern Ireland median.
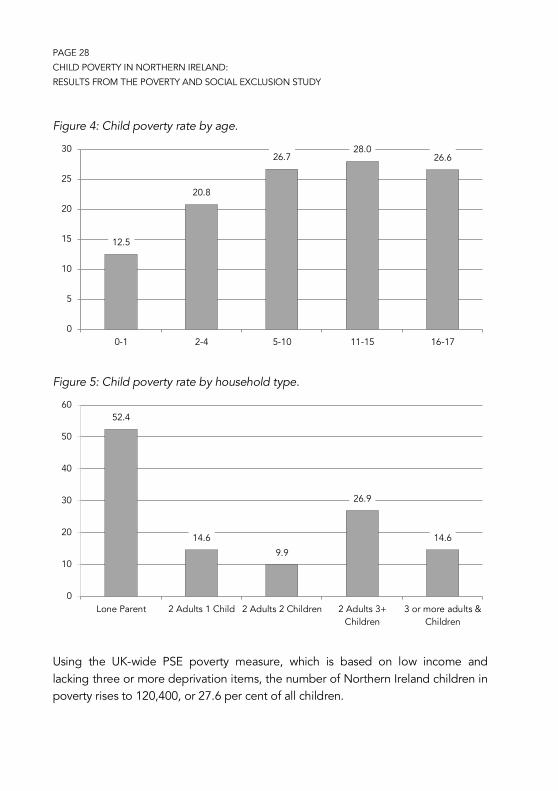
On this basis, nearly a quarter of Northern Ireland’s children (24 per cent or 106,000) are living in low income households and are deprived of four or more items that a majority of the population regard as basic necessities. The child poverty rate is lowest for the youngest children and highest for 11-15 year olds (Figure 4). In terms of family type, child poverty is highest for lone parent families (at 52 per cent) and lowest for couples with two children (at 10 per cent) (Figure 5).
0
50
100
150
200
250
300
350
400
450
500
0 1 2 3 4 5 6 7 8 9 10+
PAGE 28 CHILD POVERTY IN NORTHERN IRELAND: RESULTS FROM THE POVERTY AND SOCIAL EXCLUSION STUDY
Figure 4: Child poverty rate by age.
Figure 5: Child poverty rate by household type.
Using the UK-wide PSE poverty measure, which is based on low income and lacking three or more deprivation items, the number of Northern Ireland children in poverty rises to 120,400, or 27.6 per cent of all children.
12.5
20.8
26.7 28.0
26.6
0
5
10
15
20
25
30
0-1 2-4 5-10 11-15 16-17
52.4
14.6 9.9
26.9
14.6
0
10
20
30
40
50
60
Lone Parent 2 Adults 1 Child 2 Adults 2 Children 2 Adults 3+Children
3 or more adults &Children
PAGE 29 CHILD POVERTY IN NORTHERN IRELAND: RESULTS FROM THE POVERTY AND SOCIAL EXCLUSION STUDY
Other questions in the Living Standards Survey reveal the precarious state of household finances. One in ten children are living in households that are behind with mortgage and rent payments. Eight per cent are in households where the adults are in arrears with credit or debit card payments and the same proportion of households are in arrears with fuel bills. Approximately 130,000 children are living in households in which heating was turned down or off, even though it was too cold in the house/flat. Parents report skimping on food so that children would have enough to eat – some 12.5 per cent of children are living with adults who ‘sometimes’ or ‘often’ skimp on food for the sake of others.
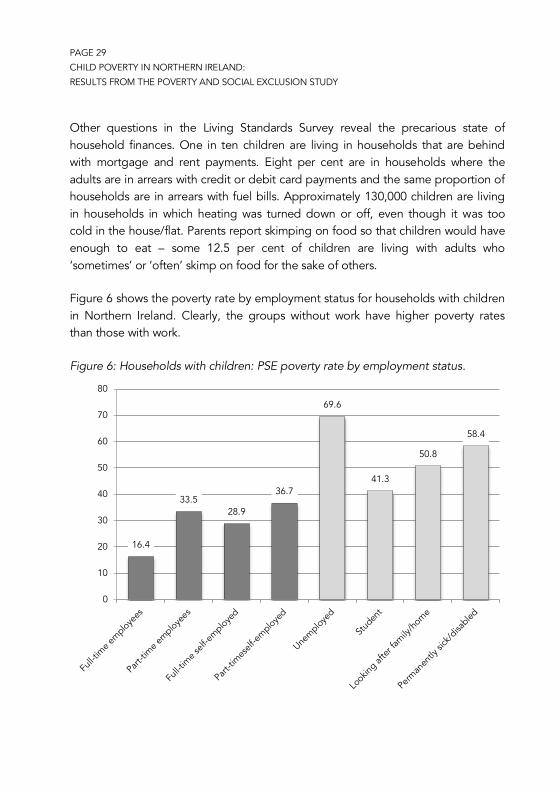
Figure 6 shows the poverty rate by employment status for households with children in Northern Ireland. Clearly, the groups without work have higher poverty rates than those with work.
Figure 6: Households with children: PSE poverty rate by employment status.
16.4
33.5 28.9
36.7
69.6
41.3
50.8
58.4
0
10
20
30
40
50
60
70
80
PAGE 30 CHILD POVERTY IN NORTHERN IRELAND: RESULTS FROM THE POVERTY AND SOCIAL EXCLUSION STUDY
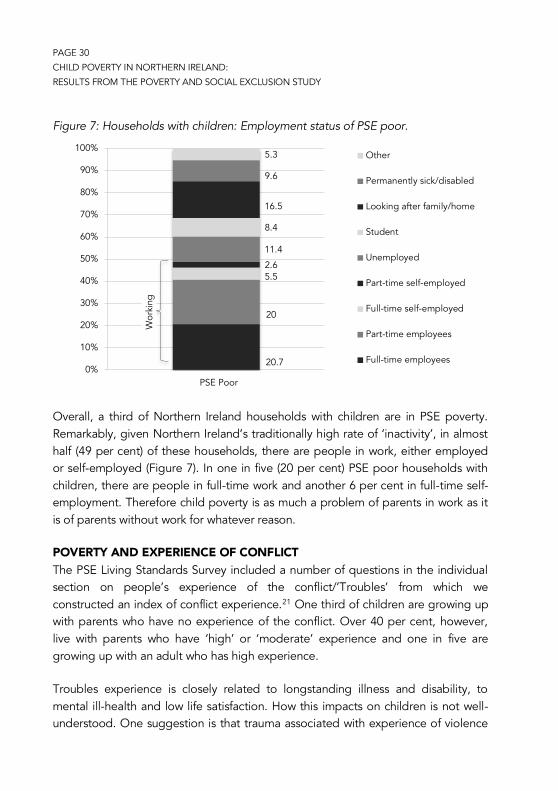
Figure 7: Households with children: Employment status of PSE poor.
Overall, a third of Northern Ireland households with children are in PSE poverty. Remarkably, given Northern Ireland’s traditionally high rate of ‘inactivity’, in almost half (49 per cent) of these households, there are people in work, either employed or self-employed (Figure 7). In one in five (20 per cent) PSE poor households with children, there are people in full-time work and another 6 per cent in full-time self-employment. Therefore child poverty is as much a problem of parents in work as it is of parents without work for whatever reason.
POVERTY AND EXPERIENCE OF CONFLICT The PSE Living Standards Survey included a number of questions in the individual section on people’s experience of the conflict/’Troubles’ from which we constructed an index of conflict experience.21 One third of children are growing up with parents who have no experience of the conflict. Over 40 per cent, however, live with parents who have ‘high’ or ‘moderate’ experience and one in five are growing up with an adult who has high experience.
Troubles experience is closely related to longstanding illness and disability, to mental ill-health and low life satisfaction. How this impacts on children is not well-understood. One suggestion is that trauma associated with experience of violence
20.7
20
5.5 2.6
11.4
8.4
16.5
9.6
5.3
0%
10%
20%
30%
40%
50%
60%
70%
80%
90%
100%
�PSE Poor
Other
Permanently sick/disabled
Looking after family/home
Student
Unemployed
Part-time self-employed
Full-time self-employed
Part-time employees
Full-time employees
Wor
king

PAGE 31 CHILD POVERTY IN NORTHERN IRELAND: RESULTS FROM THE POVERTY AND SOCIAL EXCLUSION STUDY
is transmitted to the next generation. In any event, children growing up with adults in poor mental and physical health are undoubtedly at a disadvantage. More generally, the implications of parents with high conflict experience for what children learn about history, politics, sectarianism and attitudes to violence are under-researched.
For some children, poverty and ‘Troubles’ experience come together. Our survey found that deprivation rates for those adults with no conflict experience are below 20 per cent, which compares to a rate of 35 per cent for those with high experience. Those who said they had lived in poverty in the past were 1.3 times as likely to have high or moderate conflict experience than those who never lived in poverty (controlling for age, gender, religion and household type).
ENDING CHILD POVERTY IN NORTHERN IRELAND Under the Child Poverty Act, the Coalition Government was obliged to produce a strategy for reducing poverty within a year, taking advice from a Child Poverty Commission. It failed to produce a strategy and failed to establish a Child Poverty Commission.22 Instead, it produced a ‘new approach’ to child poverty, changing the issue from one of resources to one of problem behaviours and ‘troubled families’.23 It then amended the Act (using the Welfare Reform Act 2012) to set up a Social Mobility and Child Poverty Commission which is consultative rather than advisory. Northern Ireland is not represented on the Commission but if it passes the Welfare Reform Act, the ‘relevant department’ will appoint a member, unlike for Scotland and Wales where Ministers make the appointment.
The Coalition’s next initiative was to launch a consultation on measuring child poverty, further reinforcing a focus on the ‘multidimensional’ approach to include parental skills and health, family stability, unmanageable debt and worklessness. Widely regarded as unnecessary, the consultation document was described as ‘conceptually inept and confused’ by one expert and by another as based on a ‘zombie argument about stereotypes’.24 As is clear from the Coalition’s Child Poverty Strategy published in June 2014, the causes of child poverty continue to be framed in terms of ‘family breakdown, educational failure, addiction, debt or worklessness’ rather than a lack of resources due to low pay or long-term sickness
PAGE 32 CHILD POVERTY IN NORTHERN IRELAND: RESULTS FROM THE POVERTY AND SOCIAL EXCLUSION STUDY
and disability.25 As the PSE survey shows, only 11 per cent of child poverty in Northern Ireland can be attributed to unemployment.
In relation to the devolved administrations, the Child Poverty Strategy makes clear that ‘the UK Government retains key policy responsibility for fiscal and macro-economic policy’.26 The Northern Ireland Executive’s approach to child poverty does not address lack of resources or seek to compensate for the deficiencies of policy at the UK level. Instead it is focused mainly on literacy and numeracy, parenting and play and leisure facilities for children and young people. If ending child poverty in Northern Ireland is to be more than a slogan, the Executive needs to focus on maximising child household incomes of those in work and out of work. Projections by the Institute for Fiscal Studies forecast higher than expected rises in child poverty over the next decade in Northern Ireland.27 This is attributed mainly to a significant weakening in employment growth as the public sector is cut back and growth is in sectors underrepresented in the Northern Ireland economy. The Executive is neither the champion of paying a ‘living wage’ nor tackling the sharp end of child poverty: children are growing up in damp, poorly heated homes in which parents struggle to put an adequate diet on the table.
1. For a useful summary of the Act and its prospects, see House of Commons Library (2014) Child Poverty Act 2010: a short guide. SN/SP/55. 2. This work is a collaboration between six universities and is supported by the Economic and Social Research Council. See www.poverty.ac.uk 3. The four measures are i) Relative income poverty defined as below 60 per cent of the median household income with a target to reduce the proportion of children in such households below 10% by 2020; ii) Absolute income poverty defined as below 60 per cent of median household income in real terms at a fixed point in time (2010) with a target of less than 5 per cent of children; iii) Persistent poverty defined as relative income poverty over a period of time (such as three years) with a target due to be defined by December 2014; and iv) Combined low income and material deprivation using an income threshold of 70 per cent of the median household income (before housing costs) and a score of the extent to which households lack items/activities because they cannot afford them. The target is that less than 5% of children should be in this position by 2020. 4. See P Hillyard with G Kelly, E McLaughlin, D Patsios and M Tomlinson, Bare Necessities: Poverty and Social Exclusion in Northern Ireland, key findings, Belfast: Democratic Dialogue, 2003
PAGE 33 CHILD POVERTY IN NORTHERN IRELAND: RESULTS FROM THE POVERTY AND SOCIAL EXCLUSION STUDY
5. The MIS research is carried out for the Joseph Rowntree Foundation by the Centre for Social Policy Research at Loughborough University. See http://www.lboro.ac.uk/research/crsp/mis/reports/ 6. See P Hillyard, An Exploratory Study of the Wealth of Older People in Ireland North and South, Belfast/Dublin: Centre for Ageing Research and Development in Ireland, 2014, p. 30. 7. For a consideration of this issue, see A Zaidi and T Burchardt, Comparing incomes when needs differ: equivalisation for the extra costs of disability in the UK, CASE Paper 64, Centre for Analysis of Social Exclusion, London School of Economics, 2003 8. D Gordon with L Adelman, K Ashworth, J Bradshaw, R Levitas, S Middleton, C Pantazis, D Patsios, S Payne, P Townsend, and J Williams, Poverty and Social Exclusion in Britain, York, Joseph Rowntree Foundation, 2000; C Whelan with R Layte and B Mai tre, Persistent Deprivation in the European Union, Dublin: Economic and Social Research Institute, 2001 9. See for example, Central Statistics Office, Survey on Income and Living Conditions, 2012, 2014, http://www.cso.ie/en/media/csoie/releasespublications/documents/silc/2012/silc_2012.pdf accessed 14 October 2014 10. Consistent poverty is based on the proportion of the population living below 60 per cent of the median income and who cannot afford two out of eleven deprivation items. 11. Another measure, ‘persistent poverty’, captures the idea of the effects on children of poverty over a long period. The Government is required to define the threshold by December 2014. 12. NISRA, Northern Ireland Poverty Bulletin 2012/1, 2013 13. P Townsend, Poverty in the United Kingdom, Harmondsworth: Penguin, 1979, p. 31 14. J Mack and S Lansley, Poor Britain, London: Allen and Unwin, 1985, p. 39 15. The survey was part of the Omnibus Survey carried out by the Central Survey Unit of the Northern Ireland Statistical and Research Agency. The same survey was also carried out in Great Britain. 16. Risk ratios show the risk, or probability of one group (e.g. men) thinking an item or activity is a necessity compared to another group (e.g. women). A risk ratio of 2 means twice the relative risk; a risk ratio of 0.33 means one-third the risk etc. A relative risk of 1 would indicate no differences between the two groups. The nearer the relative risk is to 1, the smaller the difference between the two groups. This helps us to assess how meaningful the significance is. See D Gordon, ‘Why use relative risks?’ 2013, http://www.poverty.ac.uk/sites/default/files/attachments/PSE-Statistical-Briefing-Note-No.1-%28Gordon-Dec2012%29.pdf accessed 14 October 2014 17. D Patsios and S Nandy, Great Britain versus Northern Ireland in the harmonised UK Omnibus 2012, Statistical Briefing No 4, Poverty and Social Exclusion Study, 2013, http://poverty.ac.uk/pse-research/pse-uk/statistical-notes, accessed 14 October 2014
PAGE 34 CHILD POVERTY IN NORTHERN IRELAND: RESULTS FROM THE POVERTY AND SOCIAL EXCLUSION STUDY
18. PSE qualitative interviews with low income families reveal that family-based social activities such as holidays and day trips are the first to be cut as financial pressures increase. See M Daly and G Kelly, Reconceptualising Family: Everyday life on a low income, Bristol: Policy Press, forthcoming 19. G Main and J Bradshaw, Presentation to 3rd Peter Townsend Memorial Conference, London. 19-20 June 2014, www.poverty.ac.uk 20. This income level is very close to the Main and Bradshaw (2014) level based on child deprivation items only. See note 19. 21. See M Tomlinson ‘Poverty and Social Exclusion in Northern Ireland: Legacies of Conflict.’ Presentation to 3rd Peter Townsend Memorial Conference, London. 19-20 June 2014. www.poverty.ac.uk 22. In an action taken by the Child Poverty Action Group the Government was found to have acted unlawfully for failing to establish the Commission. 23. See Department of Work and Pensions/Department of Education, A New Approach to Child Poverty: Tackling the Causes of Disadvantage and Transforming Families’ Lives, Cm 8061. https://www.gov.uk/government/uploads/system/uploads/attachment_data/file/177031/CM-8061.pdf accessed 14 October 2014. For a critique of this approach, see R Levitas, There may be ‘trouble’ ahead: what we know about those 120,000 ‘troubled’ families. PSE Policy Response Series No. 3, 2012 24. J Bradshaw, Consultation of Child Poverty Measurement, PSE Policy Response Working Paper No. 8, 2013; P Allin and J Veit-Wilson, On Measuring Child Poverty, 2013 25. See Iain Duncan Smith’s foreword to Child Poverty Strategy 2014-17, June 2014, p. 6 26. Appendix B of Child Poverty Strategy 2014-17, June 2014, p. 73 27. J Browne, J., A Hood and R Joyce, Child and working-age poverty in Northern Ireland over the next decade: an update. Institute for Fiscal Studies, IFS Briefing Note BN144, 2014 http://www.ifs.org.uk/publications/7054 accessed 14 October 2014
PAGE 35
____________________________________________
CHAPTER THREE
CHILD POVERTY AND DISABILITY
Dr Bronagh Byrne Queen’s University Belfast
____________________________________________
INTRODUCTION The pervasive relationship that exists between disability and poverty has been recognised for some time.1 Understanding the nature of this relationship requires recognition of the complex causal factors that underpin it. In broad terms, poverty as characterised by malnutrition, poor housing, lack of access to health care and/or poor or dangerous working conditions can increase the likelihood of acquiring a disability. On the other hand, disability, when characterised by social exclusion, marginalisation, discrimination and/or poor educational or labour market outcomes can increase the risk of poverty. While people with disabilities can experience poverty in the same ways as those without disabilities, poverty can also be experienced by this population group in a way that is distinct.
Adding childhood into this mix can bring with it a whole new set of challenges and children with disabilities generally are significantly more likely to grow up in poverty than their non-disabled peers.2 The two key challenges which must be considered in ascertaining the true picture of child poverty and disability are; first how ‘disability’ is itself defined, and secondly, how poverty is defined; in other words, whether or not additional costs of disability are taken into account when measuring childhood poverty. It is also crucial to note that those impacted by ‘child poverty and disability’ include children who have a disability, and children who do not have
PAGE 36 CHILD POVERTY AND DISABILITY
a disability but who live in a household where someone else – such as a parent or older sibling – has a disability.
This chapter examines child poverty and disability in the specific context of Northern Ireland. It will examine the existing evidence, drawing on the most recent available data from the 2011/12 Family Resources Survey, and considers some of the current challenges which may have a disproportionate impact on children with disabilities and on children with a disabled parent or family member.
CHILD POVERTY, DISABILITY AND CHILDREN’S RIGHTS The right to an adequate standard of living for children with disabilities is enshrined in both Article 28 of the UN Convention on the Rights of Persons with Disabilities (UNCRPD) and Article 27 of the UN Convention on the Rights of the Child (UNCRC). The UN Committee on the Rights of the Child has highlighted the link between poverty and disability in General Comment 9 ‘The rights of children with disabilities’, stating that:
“Poverty is both a cause and a consequence of disability. Children with disabilities and their families have the right to an adequate standard of living, including adequate food, clothing and housing and to the continuous improvement of living conditions. The question of children with disabilities living in poverty should be addressed by allocating adequate budgetary resources as well as by ensuring access by children with disabilities to social protection and poverty reduction programmes.”3
The right to an adequate standard of living is a key right in and of itself, but crucially; can impact upon the realisation of other rights such as (but not limited to) the rights to life, survival and development, education, health and health care, and play and leisure. Disability poverty is not just about low income but also relates to lack of opportunity and other barriers, and the additional costs associated with disability. Article 20 of the UNCRPD, for example, stipulates that people with disabilities should have access to quality mobility aids, devices, assistive technologies and forms of live assistance and intermediaries, and that these should be made available at affordable cost; a nod to the additional costs that can make it difficult for people with disabilities to access the support they may require. It is also important to note Article 31 of the UNCRPD requires States Parties to collect
PAGE 37 CHILD POVERTY AND DISABILITY
statistical and research data to help formulate policies that give effect to the Convention, to assess the implementation of States Parties' obligations, and to identify and address the barriers faced by persons with disabilities in exercising their rights.
I WAS ON DLA AND I GOT IT TAKEN OFF ME SO I DID…
BECAUSE I WAS TOO HAPPY AT THE INTERVIEW… EVEN THOUGH IT WAS FOR
FIBROMYALGIA AND ARTHRITIS. I USED THE DLA MONEY
TO BUY FOOD.
A PARENT DISCUSSES
HER BENEFITS BEING TAKEN AWAY. The significance of the right to an adequate standard of living is recognised in the Northern Ireland Disability Strategy which links Article 28 of the UNCRPD to Strategic Priority 13 to ‘Reduce poverty among people with disabilities and their families and protect their right to an adequate standard of living’ and Strategic Priority 14, to ‘Ensure that people with disabilities and their families have appropriate accommodation and adequate support to live independently.’4 However, while a number of actions under the Programme for Government are identified in relation to these, it is not clear how these are to be monitored with respect to meeting obligations under Article 28 of the UNCRPD.5 Nor are the specific experiences of children with disabilities who may be living in poverty referred to, risking invisibility in the context of an ‘assumed’ adult disabled

PAGE 38 CHILD POVERTY AND DISABILITY
population. In its jurisdictional parallel report to the Committee on the Rights of Persons with Disabilities the Northern Ireland Equality Commission and Human Rights Commission note that greater numbers of children with disabilities are living in poverty in Northern Ireland compared to their non-disabled peers and call for clarification on the initiatives which have been taken to reduce poverty among children with disabilities living in poverty in Northern Ireland and the impact these initiatives have had.6
Definitions of disability are crucial for determining who is and who is not ‘counted’ as ‘disabled’ for the purposes of measuring poverty. Article 1 of the CRPD states that persons with disabilities ‘include those who have long-term physical, mental, intellectual or sensory impairments which in interaction with various barriers may hinder their full and effective participation in society on an equal basis with others’. The ways in which disability has been defined for the purposes of government surveys has varied over time. Up until 2001/02 all those who reported having a long-standing limiting illness were identified as having a disability. From 2002/03, statistics have been based on responses to questions about difficulties across a number of areas of life. In 2012/13 the disability questions in the Family Resource Survey were revised to reflect new harmonised standards.7 People with disabilities are now identified as those who report any physical or mental health condition(s) or illness(es) that last or are expected to last 12 months or more, and which limit their ability to carry out day-to-day activities a little, or a lot.8,9
CHILD POVERTY AND DISABILITY: THE EVIDENCE The Child Poverty Strategy notes that the presence of a disabled adult in a household significantly increases the risk of poverty for children in such households.10 This is not a new observation, with previous research indicating that disabled children and children with disabled parents living in Northern Ireland are more likely to be severely poor demonstrating that they are also more at risk of persistent poverty.11,12
These findings can be examined in the context of data from the most recent Households Below Average Income (HBAI) report for Northern Ireland.13,14 In 2011/2012, approximately 483,000 individuals or 27% of the population in Northern Ireland lived in families where someone is disabled (either an adult or child). There was, however, very little apparent difference in the level of poverty
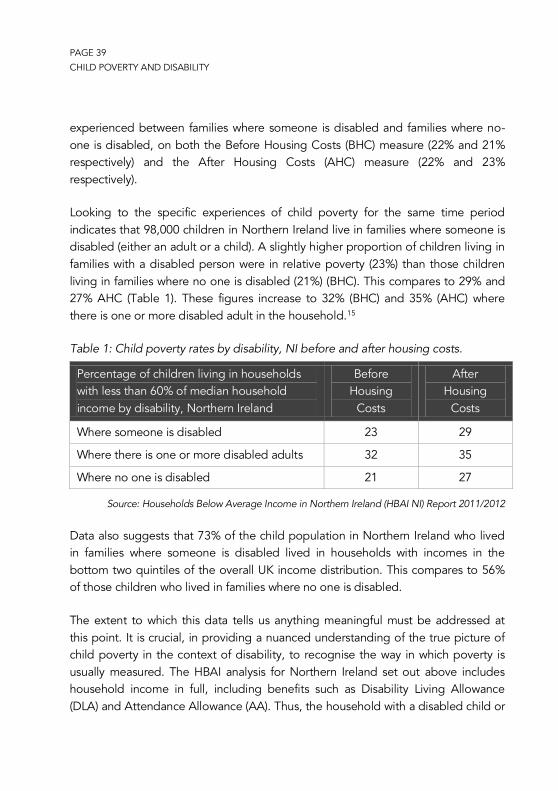
PAGE 39 CHILD POVERTY AND DISABILITY
experienced between families where someone is disabled and families where no-one is disabled, on both the Before Housing Costs (BHC) measure (22% and 21% respectively) and the After Housing Costs (AHC) measure (22% and 23% respectively).
Looking to the specific experiences of child poverty for the same time period indicates that 98,000 children in Northern Ireland live in families where someone is disabled (either an adult or a child). A slightly higher proportion of children living in families with a disabled person were in relative poverty (23%) than those children living in families where no one is disabled (21%) (BHC). This compares to 29% and 27% AHC (Table 1). These figures increase to 32% (BHC) and 35% (AHC) where there is one or more disabled adult in the household.15
Table 1: Child poverty rates by disability, NI before and after housing costs.
Percentage of children living in households with less than 60% of median household income by disability, Northern Ireland
Before Housing
Costs
After Housing
Costs
Where someone is disabled 23 29
Where there is one or more disabled adults 32 35
Where no one is disabled 21 27
Source: Households Below Average Income in Northern Ireland (HBAI NI) Report 2011/2012
Data also suggests that 73% of the child population in Northern Ireland who lived in families where someone is disabled lived in households with incomes in the bottom two quintiles of the overall UK income distribution. This compares to 56% of those children who lived in families where no one is disabled.
The extent to which this data tells us anything meaningful must be addressed at this point. It is crucial, in providing a nuanced understanding of the true picture of child poverty in the context of disability, to recognise the way in which poverty is usually measured. The HBAI analysis for Northern Ireland set out above includes household income in full, including benefits such as Disability Living Allowance (DLA) and Attendance Allowance (AA). Thus, the household with a disabled child or
PAGE 40 CHILD POVERTY AND DISABILITY
household member may appear to have a higher level of income when compared to a household where no household member has a disability, the effect potentially leading to the ‘disabled household’ being lifted out of poverty in contrast to ‘non-disabled households’.
Significantly however, the rate at which individuals can translate income into a standard of living varies. Thus, the same level of income may represent different standards of living for different people.16 Many families with a disabled child, for example, face additional costs of living in order to achieve the same basic standard of living as families without a disabled child. Since DLA is supposed to address the additional costs of disability, it is misleading to assume that it constitutes additional disposable income. These additional costs of disability can include:
Transportation costs because of the lack of accessible public transport or as a result of travel to hospital appointments;
Higher heating and fuel bills; Home adaptations and/or specialist equipment; Higher childcare costs; Higher costs for some household items such as food, furniture or
clothing.17
Existing research suggests that the cost of raising a disabled child is approximately three times the cost of raising a non-disabled child and that disabled people in general face extra costs which amount, on average, to approximately an extra quarter above normal expenditure.18 The exact calculation of ‘extra costs’ is difficult to measure since these are likely to vary by type of impairment, age and individual need. Research carried out in 2010 has suggested that, on averaging cost by age group, a clear link emerged between age and disability costs, with those aged 0-18 and their families spending the most (on average about £870-£1650 per month), followed by those aged 18-64 (£784-£1534 per month).19 More recently, it has been estimated that disabled people pay on average £550 per month on extra costs relating to disability.20 The lack of consensus in figures demonstrates the complexity and diversity of disabled people’s needs and the need to be both cautious and nuanced when examining child poverty in the context of disability.21
Ultimately then, the way in which DLA is currently included in poverty measures masks the true levels of disability poverty. Monteith et al (2009), using 2006/2007
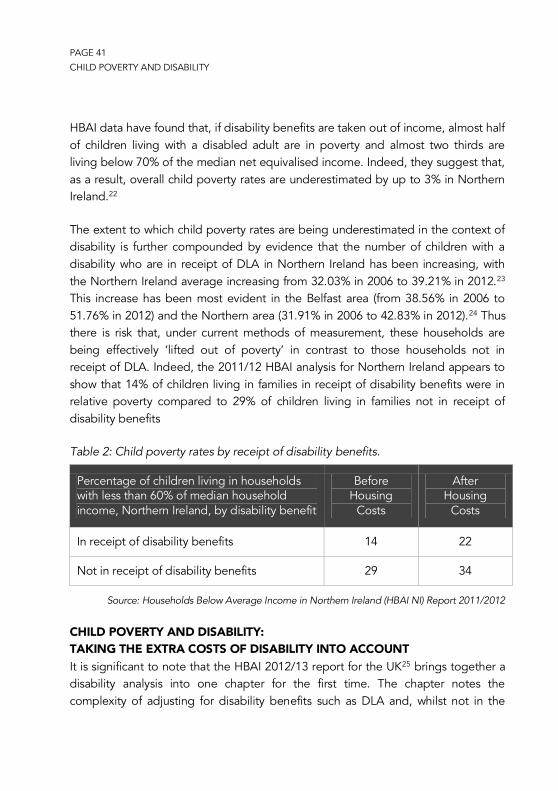
PAGE 41 CHILD POVERTY AND DISABILITY
HBAI data have found that, if disability benefits are taken out of income, almost half of children living with a disabled adult are in poverty and almost two thirds are living below 70% of the median net equivalised income. Indeed, they suggest that, as a result, overall child poverty rates are underestimated by up to 3% in Northern Ireland.22
The extent to which child poverty rates are being underestimated in the context of disability is further compounded by evidence that the number of children with a disability who are in receipt of DLA in Northern Ireland has been increasing, with the Northern Ireland average increasing from 32.03% in 2006 to 39.21% in 2012.23 This increase has been most evident in the Belfast area (from 38.56% in 2006 to 51.76% in 2012) and the Northern area (31.91% in 2006 to 42.83% in 2012).24 Thus there is risk that, under current methods of measurement, these households are being effectively ‘lifted out of poverty’ in contrast to those households not in receipt of DLA. Indeed, the 2011/12 HBAI analysis for Northern Ireland appears to show that 14% of children living in families in receipt of disability benefits were in relative poverty compared to 29% of children living in families not in receipt of disability benefits
Table 2: Child poverty rates by receipt of disability benefits.
Percentage of children living in households with less than 60% of median household income, Northern Ireland, by disability benefit
Before Housing
Costs
After Housing
Costs
In receipt of disability benefits 14 22
Not in receipt of disability benefits 29 34
Source: Households Below Average Income in Northern Ireland (HBAI NI) Report 2011/2012
CHILD POVERTY AND DISABILITY: TAKING THE EXTRA COSTS OF DISABILITY INTO ACCOUNT It is significant to note that the HBAI 2012/13 report for the UK25 brings together a disability analysis into one chapter for the first time. The chapter notes the complexity of adjusting for disability benefits such as DLA and, whilst not in the
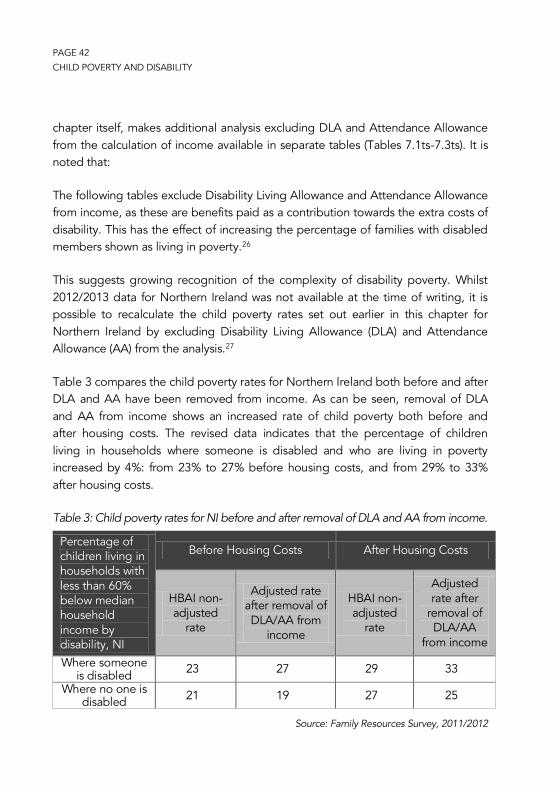
PAGE 42 CHILD POVERTY AND DISABILITY
chapter itself, makes additional analysis excluding DLA and Attendance Allowance from the calculation of income available in separate tables (Tables 7.1ts-7.3ts). It is noted that:
The following tables exclude Disability Living Allowance and Attendance Allowance from income, as these are benefits paid as a contribution towards the extra costs of disability. This has the effect of increasing the percentage of families with disabled members shown as living in poverty.26
This suggests growing recognition of the complexity of disability poverty. Whilst 2012/2013 data for Northern Ireland was not available at the time of writing, it is possible to recalculate the child poverty rates set out earlier in this chapter for Northern Ireland by excluding Disability Living Allowance (DLA) and Attendance Allowance (AA) from the analysis.27
Table 3 compares the child poverty rates for Northern Ireland both before and after DLA and AA have been removed from income. As can be seen, removal of DLA and AA from income shows an increased rate of child poverty both before and after housing costs. The revised data indicates that the percentage of children living in households where someone is disabled and who are living in poverty increased by 4%: from 23% to 27% before housing costs, and from 29% to 33% after housing costs.
Table 3: Child poverty rates for NI before and after removal of DLA and AA from income.
Percentage of children living in households with less than 60% below median household income by disability, NI
Before Housing Costs After Housing Costs
HBAI non-adjusted
rate
Adjusted rate after removal of DLA/AA from
income
HBAI non-adjusted
rate
Adjusted rate after
removal of DLA/AA
from income
Where someone is disabled 23 27 29 33
Where no one is disabled 21 19 27 25
Source: Family Resources Survey, 2011/2012
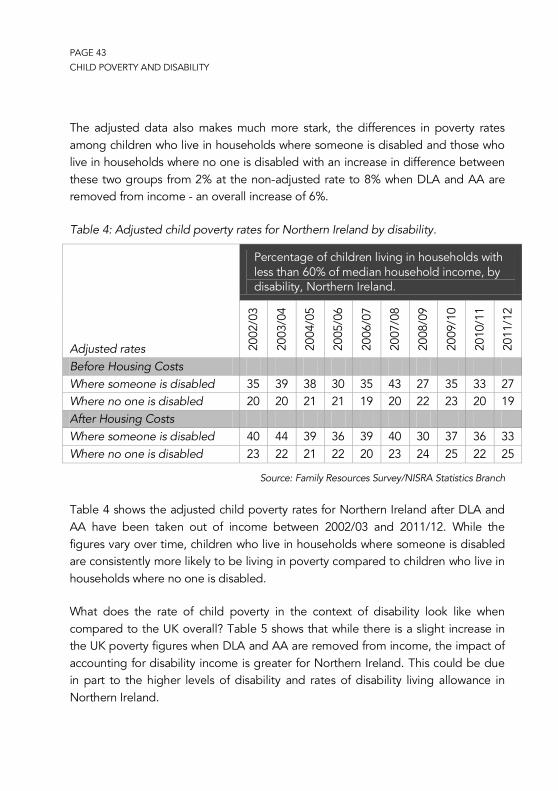
PAGE 43 CHILD POVERTY AND DISABILITY
The adjusted data also makes much more stark, the differences in poverty rates among children who live in households where someone is disabled and those who live in households where no one is disabled with an increase in difference between these two groups from 2% at the non-adjusted rate to 8% when DLA and AA are removed from income - an overall increase of 6%.
Table 4: Adjusted child poverty rates for Northern Ireland by disability.
Adjusted rates
Percentage of children living in households with less than 60% of median household income, by disability, Northern Ireland.
2002
/03
2003
/04
2004
/05
2005
/06
2006
/07
2007
/08
2008
/09
2009
/10
2010
/11
2011
/12
Before Housing Costs Where someone is disabled 35 39 38 30 35 43 27 35 33 27 Where no one is disabled 20 20 21 21 19 20 22 23 20 19 After Housing Costs Where someone is disabled 40 44 39 36 39 40 30 37 36 33 Where no one is disabled 23 22 21 22 20 23 24 25 22 25
Source: Family Resources Survey/NISRA Statistics Branch
Table 4 shows the adjusted child poverty rates for Northern Ireland after DLA and AA have been taken out of income between 2002/03 and 2011/12. While the figures vary over time, children who live in households where someone is disabled are consistently more likely to be living in poverty compared to children who live in households where no one is disabled.
What does the rate of child poverty in the context of disability look like when compared to the UK overall? Table 5 shows that while there is a slight increase in the UK poverty figures when DLA and AA are removed from income, the impact of accounting for disability income is greater for Northern Ireland. This could be due in part to the higher levels of disability and rates of disability living allowance in Northern Ireland.
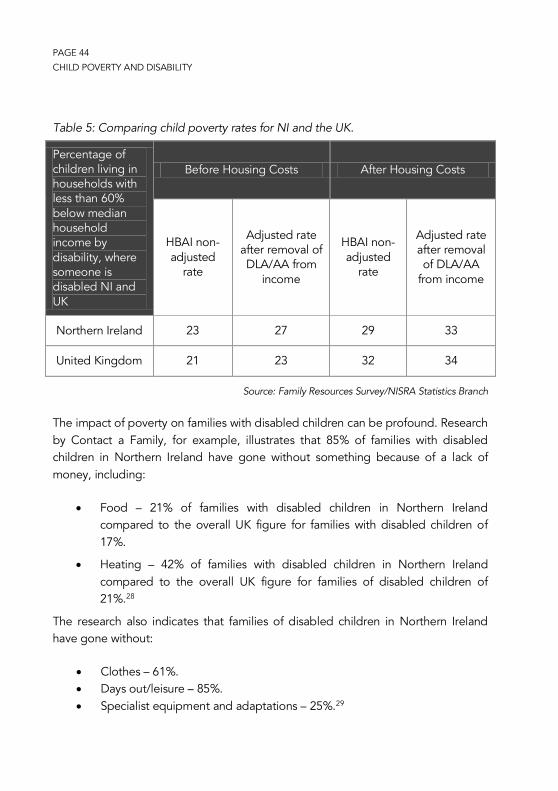
PAGE 44 CHILD POVERTY AND DISABILITY
Table 5: Comparing child poverty rates for NI and the UK.
Percentage of children living in households with less than 60% below median household income by disability, where someone is disabled NI and UK
Before Housing Costs After Housing Costs
HBAI non-adjusted
rate
Adjusted rate after removal of DLA/AA from
income
HBAI non-adjusted
rate
Adjusted rate after removal of DLA/AA
from income
Northern Ireland 23 27 29 33
United Kingdom 21 23 32 34
Source: Family Resources Survey/NISRA Statistics Branch
The impact of poverty on families with disabled children can be profound. Research by Contact a Family, for example, illustrates that 85% of families with disabled children in Northern Ireland have gone without something because of a lack of money, including:
Food – 21% of families with disabled children in Northern Ireland compared to the overall UK figure for families with disabled children of 17%.
Heating – 42% of families with disabled children in Northern Ireland compared to the overall UK figure for families of disabled children of 21%.28
The research also indicates that families of disabled children in Northern Ireland have gone without:
Clothes – 61%. Days out/leisure – 85%. Specialist equipment and adaptations – 25%.29
PAGE 45 CHILD POVERTY AND DISABILITY
In addition, 54% of families of disabled children in Northern Ireland were found to have fallen behind with payments: 66% with utility bills, and 36% with the mortgage or rent. These can have far-reaching implications for the extent to which the rights of disabled children and their families are being effectively realised. Indeed, 61% of families of disabled children in Northern Ireland believed that their financial situation would get worse in 2013 with 78% citing welfare reforms as the main reason for this (compared to 60% and 73% of families with disabled children in the UK overall).30
CONCLUSION Ascertaining the true levels of child poverty in the context of disability is deeply problematic. The extent of poverty among children living in households where someone is disabled continues to be underestimated; a finding which has previously been highlighted by Monteith et al (2009). The data presented here suggests that, not only do child poverty rates increase by 4% once DLA and AA are removed from income, but that there is a stark difference in the adjusted poverty rates among children who live in households where someone is disabled compared to those who live in households where no one is disabled. However, these figures must be approached with caution since the extra costs of disability continue to vary widely from one family to another, and as such are unlikely to be sufficiently offset by existing levels of Disability Living Allowance. The true levels of poverty would possibly be significantly higher were it possible to examine them in the light of more robust measures of the true extra cost of disability.
Given the poorer levels of health in Northern Ireland and the higher numbers of disabled people in the population, there is a risk that welfare reform in Northern Ireland will have a disproportionate impact on child poverty rates compared to the rest of the United Kingdom when examined in the context of disability. Particular attention must also be paid to how changes in Disability Living Allowance will impact on the way in which disability poverty is measured in light of benefit changes. Addressing the challenges posed by the intersection between disability and childhood, and ensuring the right to an adequate standard of living for all children and their families, must first begin by acknowledgment of the true levels of poverty and the subsequent implications this poses for children with disabilities and children living in disabled families in realising their full potential.
PAGE 46 CHILD POVERTY AND DISABILITY
1 G Groce with M Kett, R Lang, and J Trani, ‘Disability and Poverty: the need for a more nuanced understanding of implications for development policy and practice’, Third World Quarterly, 32, 8, 2011, pp 1493-1513. M Palmer ‘Disability and Poverty: A conceptual review’, Journal of Disability Policy Studies, 21, 4, 2011, pp 210-218. G Parckar, Disability Poverty in the UK, London: Leonard Cheshire, 2008. P She and G.A. Livermore, ‘Material hardship, poverty, and disability among working-age adults’, Social Science Quarterly, 88, 2007, pp 970–989 2 E Emerson and C Hatton, ‘The socio-economic circumstances of children at risk of disability in Britain’, Disability and Society, 22, 6, 2007, pp 563–580 3 Committee on the Rights of the Child, General Comment 9: The rights of children with disabilities, Geneva: United Nations, CRC/C/GC/9, 2007 4 Office of the First Minister and Deputy First Minister, A Strategy to improve the lives of people with disabilities 2012-2015, Belfast: OFMdFM, 2013 5 B Byrne with C Harper, R.S Irvine H Russell, and B Fitzpatrick, Shortfalls in public policy and programme delivery in Northern Ireland relative to the Articles of the UNCRPD, Belfast: Equality Commission NI, 2014, http://www.equalityni.org/Research-investigations accessed 14 October 2014 6 Equality Commission for Northern Ireland/Northern Ireland Human Rights Commission, United Nations Convention on the Rights of Persons with Disabilities Jurisdictional ‘Parallel’ Report on Implementation in Northern Ireland, Working Paper, Belfast: IMNI, 2014 7 Department for Work and Pensions, Households Below Average Income (HBAI) Quality and Methodology Information Report – 2012/13, London: DWP, 2014 8 Office for National Statistics, Harmonised Concepts and Questions for Social Data Sources. Primary Standards: Long-lasting Health Conditions and Illnesses; Impairments and Disability, London: ONS, 2011 9 The Northern Ireland Households Below Average Income data reported in this chapter precedes the 2012/13 change in disability definition 10 The Northern Ireland Executive, ‘Improving Children’s Life Chances: The Child Poverty Strategy’, Belfast: Northern Ireland Executive, 2011 11 M Monteith and E McLaughlin, The Bottom Line: Severe Child Poverty in Northern Ireland, Belfast: Save the Children, 2004 12 In their report on Child and Family poverty (2006), McLaughlin and Monteith, using the PSENI consensual measure of poverty, found that approximately 3 in 5 (57%) disabled children are poor compared to approximately 2 in 5 (37%) children without disabilities. Approximately 3 in 5 (59%) of children living with a chronically ill or disabled parent are poor. The report indicated that families with disabled children are disproportionately likely to be in poverty and the presence of a disabled parent increases the risk of poverty even further. 13 Northern Ireland Statistics and Research Agency, Households Below Average Income 2011/12, Belfast: DSD, 2013

PAGE 47 CHILD POVERTY AND DISABILITY
14 Released 17 December 2013 15 A breakdown of focusing solely on disabled children was not possible due to small sample sizes. Nonetheless, the figures presented here give an overview on the impact of the intersection between disability and poverty for children who live in families with either a disabled adult or child. 16 A Zaidi and T Burchardt, Comparing incomes when needs differ: Equivalisation for the extra costs of disability in the UK, CASE Paper 64: London, 2003 17 The Children’s Society, 4 in every 10 Disabled Children Living in Poverty, London: The Children’s Society, 2011 18 The Children’s Society, 4 in every 10 Disabled Children Living in Poverty, London: The Children’s Society, 2011. G Parckar, Disability Poverty in the UK, London: Leonard Cheshire, 2008 19 C Wood and E Grant, Counting the Costs: Disability poverty is underestimated by not including the much higher everyday costs, London: Demos, 2010 20 Scope, Priced Out: ending the financial penalty of disability by 2020, London: Scope, 2014 21 On 25 July 2014, the Extra Costs Commission was launched by Scope, supported by the Barrow Cadbury Trust. This is a year-long independent inquiry that will explore the extra costs faced by disabled people and families with disabled children in England and Wales 22 M Monteith, E Casement, K Lloyd and P McKee, Taking a closer look: Child Poverty and Disability, November Briefing, Belfast: Save the Children/Family Fund, 2009 23 Overall in 2012 there were 14,980 children aged 0-15 claiming DLA 24 Children and Young People’s Strategic Partnership, Children’s Services Planning: Northern Ireland Outcome Monitoring Report with Trends 2006-2012/13. Belfast: CYPSP, 2013, 25 Released July 2014. The disability analysis can be found in chapter 7 26 The report notes that the FRS definition of disability changes in 2012/13 and as such, comparisons between figures in 2012/13 and previous years should be made with caution 27 The author would like to acknowledge the support from Jonathan Kane at NISRA in carrying out this revised analysis 28 Contact a Family, Counting the Costs 2012: The financial reality for families with disabled children in Northern Ireland, London: CaF, 2012 29 Results from Contact a Family’s 2014 survey are due to be released in November 2014 30 see note 28

PAGE 49
____________________________________________
CHAPTER FOUR
CHILD POVERTY, LOW PAY AND THE LABOUR MARKET
Sanne Velthuis and Katie Schmuecker Joseph Rowntree Foundation
____________________________________________
INTRODUCTION Reducing child poverty is not simply a job for the tax and benefits system; it is also about the nature of work and the labour market. Work (for those that are able to) should offer a route out of poverty. But according to official statistics over 60 per cent of children experiencing poverty in Northern Ireland live in households where at least one member of the family works - up from 52 per cent in 2002-03, the earliest year for which figures are available.1 The face of poverty is changing, and we cannot assume a rising employment rate will necessarily bring about a reduction in child poverty. In addition to supporting more people into work missing pieces of the puzzle to sustainably reduce child poverty include addressing low pay, progression and insecure working conditions in Northern Ireland.
Recent years have been tough for families on low incomes. While there are signs of improvement in the employment rate and the average number of hours worked2, earnings are still not seeing much growth and are failing to keep pace with increases in the cost of essential items.3
Furthermore, whether work offers a route out of poverty depends not only on the nature of work but also the make-up of the household. While employment and pay are considered from an individual perspective, poverty is generally experienced at

PAGE 50 CHILD POVERTY, LOW PAY AND THE LABOUR MARKET
a household level. This means the number of adults in the household in employment, what other income a family receives (such as benefits and tax credits), and the costs they face in terms of housing and childcare, need to be factored in. The earnings prospects of individuals also depend on what qualifications and training they have done and how well they are able to access opportunities for progression in the workplace. In short, the relationship between employment and poverty depends on both structural factors to do with the demand for and nature of employment, as well as household and individual level factors to do with the size and shape of families and the choices they make, within the constraints they face, about whether to work, how many hours to work, and what education or training to undertake. This chapter looks at each of these issues in turn before drawing some conclusions.
LABOUR MARKET TRENDS AND THE NATURE OF WORK Employer demand for skilled labour is an important part of the context for whether work offers a reliable route out of poverty. This means that policy makers should not only be concerned by how many jobs are available, but the quality of those jobs too.
EMPLOYMENT, UNEMPLOYMENT AND ECONOMIC INACTIVITY Children growing up in workless households face the highest poverty risk: 49 per cent of children in workless households were in poverty in Northern Ireland in 2011-12.4 This makes the general health of the labour market and whether or not people are working a central concern for any strategy to reduce child poverty.
The unemployment rate in Northern Ireland is comparable to that in Great Britain, and has been falling since the start of 2013 when it was 8.1 per cent, to 6.7 per cent in the second quarter of 2014 (against 6.3 per cent in Great Britain).5 However, while the employment rate (at 68%), has increased steadily over the last several years, it remains substantially lower than the UK average (72%).6 This disparity is explained in most part by a higher economic inactivity rate in Northern Ireland. The economic inactivity rate refers to the proportion of people of working age who are neither working nor looking for work for reasons such as long-term illness, caring responsibilities or because they are looking after the home. Economic inactivity in Northern Ireland stood at 26.6 per cent in April-June 2014, whereas the corresponding rate in Great Britain was 21.8 per cent.7 This gap is particularly stark
PAGE 51 CHILD POVERTY, LOW PAY AND THE LABOUR MARKET
for women: female economic inactivity in Northern Ireland is 8.7 percentage points higher than the UK average (33.2 per cent compared to 24.5 per cent).8 Northern Ireland also has a higher proportion of people who are economically inactive due to sickness or disability (29.9 per cent of the economically inactive) compared to the UK (20.9 per cent)9, with at least some of this difference likely to be a legacy of conflict in the region.10
Long-term unemployment also remains higher in Northern Ireland than in the rest of the UK, with over half of unemployed adults (51.7 per cent) having been out of work for 12 months or more in April-June 2014.11 The UK long-term unemployment rate is currently 35.5 per cent.12 The high levels of economic inactivity and long-term unemployment in the Northern Ireland labour market are long-standing challenges which precede the economic downturn and, despite some signs of recent improvement, remain a significant challenge to reducing child poverty.
THEY ARE PUSHING PEOPLE
OUT TO WORK, BUT THEY ARE NOT MAKING IT
BENEFICIAL FOR YOU.
LACK OF JOBS WITH SUITABLE HOURS AND WAGES.
LOW PAY The prevalence of low pay has come to be seen as central to tackling working poverty. This has fuelled the debate about the need for a Living Wage in the UK – that is a voluntary rate of pay set to reflect changes to the cost of living, unlike the minimum wage, which is rooted in an assessment of what the labour market can bear.
PAGE 52 CHILD POVERTY, LOW PAY AND THE LABOUR MARKET
It is estimated that 25 per cent of Northern Ireland’s workforce was paid less than the Living Wage in 2013.13 Predictably, the majority of this group is under 21 years old. Nonetheless, a recent report shows that more than a quarter of 22-29 year olds (28 per cent) and more than one in ten 30-39 year olds (12 per cent) also fall into this category.14 These last two groups are likely to include the majority of families with young children, which may go some way towards explaining the high rates of in-work poverty among households with children.
Indeed, analysis by the Institute for Fiscal Studies shows that someone’s rate of pay is a stronger predictor of the likelihood of experiencing working poverty than what sector they work in, which occupational group they belong to or the number of hours they work, although the strength of the relationship is weakened by the earnings of other household members.15 It is important to note, however, that not all those on low pay are in poverty. Across the UK it is estimated that only one in ten low-paid workers live in poor households (although the risk of poverty is much higher among low earners than among high earners, for whom it is only 1.2 per cent).16 Furthermore, among those that are experiencing in-work poverty, 44 per cent are neither low paid, nor live with anyone who is.17 For these families, other factors, such as the number of hours worked, the size of the household, and any other income coming into the household – such as benefits – also play a role.
Addressing the high numbers of people in low paid employment in Northern Ireland and across the UK therefore needs to be part of the picture of tackling child poverty. However, tackling low pay alone will not solve working poverty. A more comprehensive strategy is needed.
PART-TIME WORKING, UNDEREMPLOYMENT AND INSECURE WORK Alongside addressing unemployment, economic inactivity and pay, a strategy to reduce child poverty also needs to consider the nature of work available. In Northern Ireland the rising employment rate masks a shift towards more part-time employment. Since the start of the recession the proportion of people working less than 30 hours a week has increased from 21.6 per cent in 2007 to 24.7 per cent in 2013, mirroring a wider UK trend.18 Some of this may reflect choices people have made, but some appears to be involuntary: 4.4 per cent of part time workers in Northern Ireland say they would prefer full-time work (slightly higher than Great Britain’s 3.5 per cent).19 One of the reasons why women especially can find it
PAGE 53 CHILD POVERTY, LOW PAY AND THE LABOUR MARKET
difficult to work full-time is because of a lack of affordable childcare. This is of particular concern as part-time work is associated with higher risks of poverty, especially where there are no full time workers in a household, or the main earner is working part time.20
Job insecurity and intermittent work over the course of a year is also associated with higher rates of poverty. Temporary work has increased from 4.2 per cent of the Northern Ireland workforce in April-June 2011, to 6.1 per cent in April-June 2014.21 This includes workers on fixed-term contracts, those who are temping through an agency, and those doing casual or seasonal work. People in low-paid work22, and particularly those in elementary occupations and caring, leisure and other service occupations are more likely to be on temporary contracts.23 These groups face a heightened risk of cycling between low paid work and unemployment in what has become known as the low-pay, no-pay cycle. Authoritative projections of the future of work find insecurity at the bottom end of the labour market is likely to increase between now and 2030.24
SECTORS AND OCCUPATIONS WITH HIGH LEVELS OF POVERTY, LOW PAY AND INSECURITY Low pay is a particular problem in certain sectors, such as hospitality and catering, retail, social work and care, and agriculture. Taking the UK as a whole, the Resolution Foundation finds that 68 per cent of employees working in hotels and restaurants are low-paid, as well as 41 per cent of retail and wholesale workers and 36 per cent of those working in administrative services. Many of these sectors are also more likely to offer insecure work.25 It is perhaps unsurprising then that these sectors also tend to have higher poverty rates, although poverty is more widely spread across sectors and occupation groups than low pay. Among those working in retail, hospitality, personal services and residential care, a total of 17 per cent are in poverty (after housing costs) compared to 8 per cent for all other employees. Poverty rates are also high for those working in elementary occupations such as cleaners, porters and kitchen assistants (21 per cent), sales occupations (16 per cent) and caring (14 per cent) – see figure 1.26
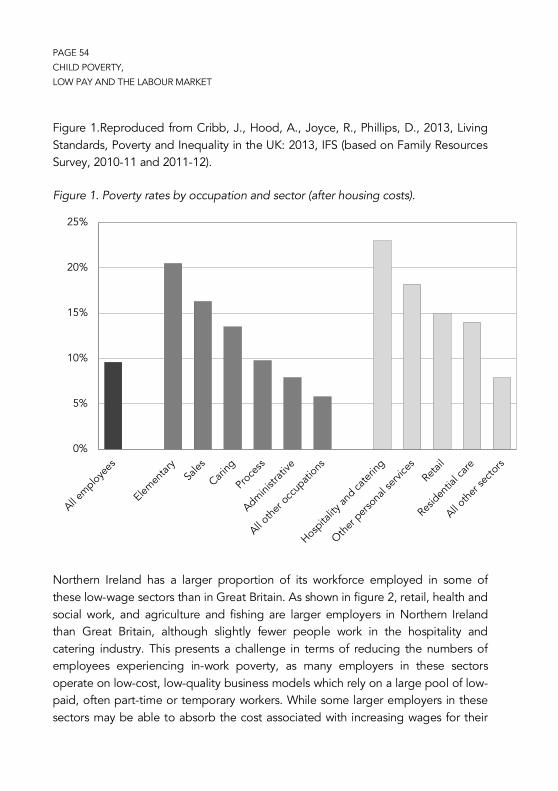
PAGE 54 CHILD POVERTY, LOW PAY AND THE LABOUR MARKET
Figure 1.Reproduced from Cribb, J., Hood, A., Joyce, R., Phillips, D., 2013, Living Standards, Poverty and Inequality in the UK: 2013, IFS (based on Family Resources Survey, 2010-11 and 2011-12).
Figure 1. Poverty rates by occupation and sector (after housing costs).
Northern Ireland has a larger proportion of its workforce employed in some of these low-wage sectors than in Great Britain. As shown in figure 2, retail, health and social work, and agriculture and fishing are larger employers in Northern Ireland than Great Britain, although slightly fewer people work in the hospitality and catering industry. This presents a challenge in terms of reducing the numbers of employees experiencing in-work poverty, as many employers in these sectors operate on low-cost, low-quality business models which rely on a large pool of low-paid, often part-time or temporary workers. While some larger employers in these sectors may be able to absorb the cost associated with increasing wages for their
0%
5%
10%
15%
20%
25%

PAGE 55 CHILD POVERTY, LOW PAY AND THE LABOUR MARKET
workers, many would not be in a position to do so without this affecting the number of people they employ.27
Figure 2.Source: Workforce Jobs by Region and Industry, ONS, 2013-2014 (own calculations, figures show averages for June 2013 to March 2014).
Aside from improving wages however, there are other ways to address the problem of in-work poverty. Better progression routes and access to on-the-job training could help low-paid workers move up the pay scale or access better jobs elsewhere. However, research for JRF shows workers in low-wage sectors such as retail, catering and care are less likely to be offered training by their employer, limiting opportunities for progression to a better job.28
0% 5% 10% 15% 20%
Public administration
Information, communication & financial services
Education
Professional scientific & technical
Manufacturing & construction
Administrative & support service activities
Wholesale & retail
Human health & social work
Agriculture, fishing, mining
Accomodation & food service activities
GB
NI
Inci
denc
e of
low
pay

PAGE 56 CHILD POVERTY, LOW PAY AND THE LABOUR MARKET
SKILLS, CHOICES AND INCENTIVES Alongside the context of the local labour market, the characteristics of individuals and their families, and their interaction with the tax and benefit system also needs to be understood to tackle poverty.
SKILLS AND QUALIFICATIONS The reduced likelihood of employer provided training for those in low paid low skilled jobs offers a barrier to escaping working poverty, but so too does a lack of qualifications among workers, which limits their options in the labour market. Northern Ireland has a substantial proportion of people aged 16-64 with few or no formal qualifications (29.1 per cent in 2011)29compared to England and Wales (15 per cent).30 It also has fewer people with high level qualifications (see figure 3).
Figure 3. Source: Labour Market Profile, Northern Ireland, July 2013, Department for Learning and Employment, and ONS, Local area analysis of qualifications across England and Wales, 07 March 2014 (both based on 2011 Census data).
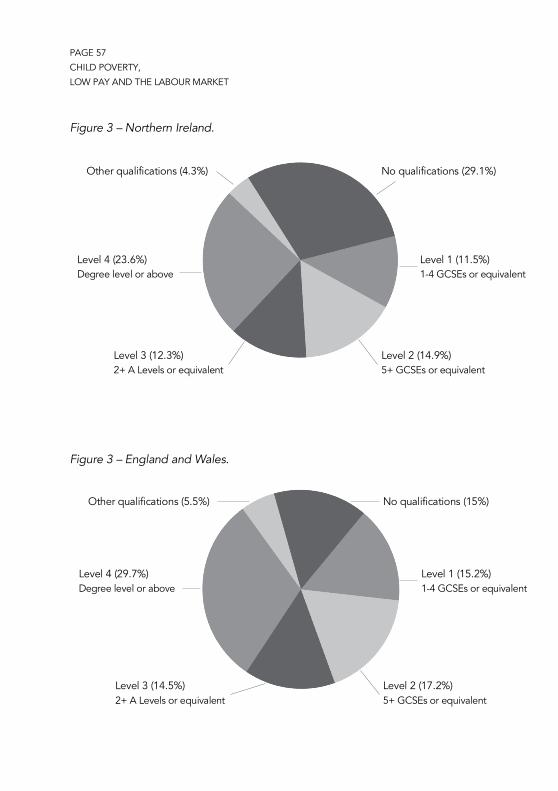
PAGE 57 CHILD POVERTY, LOW PAY AND THE LABOUR MARKET
Figure 3 – Northern Ireland.
Figure 3 – England and Wales.
No qualifications (29.1%)
Level 1 (11.5%) 1-4 GCSEs or equivalent
Level 2 (14.9%) 5+ GCSEs or equivalent
Level 3 (12.3%) 2+ A Levels or equivalent
Level 4 (23.6%) Degree level or above
Other qualifications (4.3%)
No qualifications (15%)
Level 1 (15.2%) 1-4 GCSEs or equivalent
Level 2 (17.2%) 5+ GCSEs or equivalent
Level 3 (14.5%) 2+ A Levels or equivalent
Level 4 (29.7%) Degree level or above
Other qualifications (5.5%)
PAGE 58 CHILD POVERTY, LOW PAY AND THE LABOUR MARKET
On average in the UK those without qualifications are more likely to have both lower earnings, and to live in households with lower overall incomes, which consequently makes them more likely to experience poverty.31 This is reflected in the fact that in the UK nearly one in four parents in poverty have no qualifications.32 Those with low-level qualifications such as GCSEs at grades D–G or Level 1 NVQs also have lower average earnings and tend to be more likely to live in households at the lower end of the income distribution, although the relationship is not as strong as for those without any qualifications.
To reduce poverty, many have therefore called for action to improve the skill levels of those with low qualifications, to enable them to access better employment and higher earnings. However, a substantial number of low-skilled workers live in middle to high-income households, where presumably they live with partners or family members with higher earnings. Modelling work by the IFS finds a general increase in qualifications across the population would result in greater income inequality with only small effects on poverty.33 This means to succeed as a means of tackling working poverty, efforts to increase skill levels would need to be targeted at households with the lowest incomes.34
Alongside greater demand for skills from employers, the welfare to work system also has a potential role to play. Policy debate appears to be heading in this direction, with discussion of in-work conditionality within Universal Credit, whereby claimants on low-wages and/or low hours will be expected to take steps to increase their earnings. However, this is an area where evidence of what works remains relatively light,35 as does the readiness of welfare to work services to deliver it. In addition, for some people, wider barriers to work such as caring responsibilities or the high cost of childcare will also need to be addressed. Thought must also be given to the attitudes of individuals with few or no qualifications to learning. Evidence suggests effective training is typically small-scale, targeted, addresses other barriers and takes place in a ‘real world’ environment (such as in a workplace or combined with a placement or work trial, rather than in a classroom).36 Furthermore, a study of what motivates low-paid employees in the care and hotel sectors to undertake training found that low-paid employees valued it as a way of improving their employment prospects. However, the same study also found cost was the major factor affecting the decision to undertake qualifications (54%
PAGE 59 CHILD POVERTY, LOW PAY AND THE LABOUR MARKET
reported this), followed by the times at which training was offered, which accounted for 26% (with training conducted in their own time a significant barrier).37
MAKING WORK PAY FOR LOW-INCOME HOUSEHOLDS WITH CHILDREN The choices that families make about how to balance working and caring, along with the barriers to work for those with caring responsibilities, are also an important part of the relationship between child poverty and the labour market. The high proportion of poor children living in single-earner households suggests that one way to tackle child poverty would be to increase the number of second earners among low-income families by incentivising them to take up work. However there are a number of barriers to this, notably the difficulty that many families face in combining work with childcare. This partly has to do with the nature of work. The higher incidence of shift work and irregular hours among those on moderate to low incomes means that these households often have less control over the hours they work, which makes it hard for some families to find suitable childcare arrangements that would allow both parents to work.38 It is also an issue of a lack of affordable formal childcare available to working families, something which is a particular problem in Northern Ireland due to the inadequate nature of local childcare infrastructure.39
The tax and benefit system also plays an important part here. The benefits and tax credits a family is entitled to are withdrawn as a second earner moves into work and earns more, as is any support with housing costs the household may be receiving. Under the current system this occurs at a relatively steep rate, and a second earner often needs to earn a substantial amount before the family is better off. This is actually set to worsen under Universal Credit (UC), as the current design of UC does not include an earnings disregard for second earners.40
This is not just a problem for single-earner families, but more generally, as all families with children have to weigh up how much extra they will be able to earn by increasing their working hours or moving to a different job relative to how much their tax credits or support with housing or childcare costs might reduce and the taxes due increase in such a scenario. For instance, using the JRF’s Minimum Income Standards calculator41, we can look at a simple example of a couple with a child under the age of four. With one adult earning £230 per week (approximately
PAGE 60 CHILD POVERTY, LOW PAY AND THE LABOUR MARKET
£12,000 per year) and their partner working 25 hours on the minimum wage (£6.50 from 1 October 2014), the couple receive a net weekly income of £438.50 based on current tax and benefit rules. Should the second adult increase their working hours to 37.5 hours a week, the couple lose their child tax credit and need to pay additional tax and national insurance, leaving them only £27.82 better off on a weekly basis. Moreover, the couple is likely to require additional childcare to cover the extra hours at work which would swallow up their additional earnings.
CONCLUSION: POLICY DIRECTIONS If we do not act child poverty will increase. The IFS projects that relative child poverty in Northern Ireland will rise by 8.3 percentage points between 2010–11 and 2020–21, increasing to 29.7 per cent. Much of this increase is due to the effect of welfare reforms – both those already implemented and those that form part of the 2012 Welfare Reform Act (which has not yet been introduced in Northern Ireland due to disagreement within the Northern Ireland Executive and between the Executive and Westminster42) – but the effect is exacerbated by the nature of work at the bottom of the labour market43.
As the face of poverty changes – with more children in poverty living in working households – so too must strategies to tackle child poverty. Conventional approaches to reducing poverty through the tax and benefit system must be complemented by measures to address low pay, low work intensity, insecure work and progression in work.
Northern Ireland currently has a suite of strategies that are intended to bring about improvement in the labour market:
A strategy to tackle economic inactivity is being developed, which will include initiatives designed to promote flexible working, extend working lives, and maintain employment for individuals who develop health conditions or take on caring responsibilities.44
The soon-to-commence Steps 2 Success, is designed to help jobseekers not only find work but sustainable employment, with the targets and performance payments for job sustainability set to be extended beyond those under its precursor, Steps To Work. There are no specific incentives
PAGE 61 CHILD POVERTY, LOW PAY AND THE LABOUR MARKET
however for providers to focus on progression once in work, or to help jobseekers access good quality jobs.
Alongside Steps 2 Success which is targeted at those further from the labour market, there are also a number of other, voluntary employment support programmes available to jobseekers, including the Youth Employment Scheme, Step Ahead 50+, and First Start. These include access to subsidised employment and work placements, opportunities to undertake a qualification or a short accredited course, and assistance to improve jobsearch skills.
The ten-year skills strategy Success Through Skills - Transforming Futures seeks to improve productivity through increasing skill levels in the workforce, and to promote a closer relationship between further education colleges and regional employers to better match the supply of training to the demand for local skills (for instance through Local Workforce Development Forums and Sector Skills Councils).
The Department for Employment and Learning is also promoting apprenticeship schemes, Essential Skills training, further education courses and company based up-skilling45, and running a special youth programme, Training for Success offering training in personal and social development skills, employability skills, and professional and technical skills.
The role of employers has been recognised, and a Skills Solutions Service established to offer a single point of contact for companies wishing to access information on training programmes provided by the Department for Employment and Learning.
These programmes have relevant and positive aims to up-skill the workforce, involve employers in training and skills and achieve sustainable employment for the economically inactive and long term unemployed. However, to make a lasting contribution to reducing child poverty they need to be much more tightly targeted on families at risk of or experiencing poverty. Furthermore, these programmes need to be accompanied by measures to ensure training is accessible to those that need it, including those stuck in low skilled low paid jobs; to increase the incentives to work for second earners; and to overcome barriers to work like the availability

PAGE 62 CHILD POVERTY, LOW PAY AND THE LABOUR MARKET
and cost of childcare and transport. With regard to childcare, the framework and consultation produced by the Office of the First Minister and Deputy First Minister in 201346 is a welcome first step, however there needs to be greater clarity over when the final Childcare Strategy will be published and implemented in order to address this key barrier to parental employment.
Changing the incentives for welfare to work providers, so they are tasked not only with supporting people to enter and sustain employment but to progress once in employment, could also play an important role. With the advent of Universal Credit, those who are in employment but in receipt of support may be required to look for ways to increase their earnings. This so-called in-work conditionality, when combined with the right support from Jobs and Benefits Offices and sufficient access to childcare, could contribute to more families with children being able to improve their incomes through work.
Perhaps the biggest challenge, however, is how to drive up employer demand for skills and their commitment to the progression and development of their low-paid, low-skilled workforce. In part, this can be done at individual employer level, by making the business case for better employment practice, improving management practice so well-intentioned policies for staff learning and development are rolled out consistently. But there is likely to be a role too for sharing practice among employers, and a leadership role for government too.
Overall, a more comprehensive approach to reducing child poverty is needed, one that brings together the child poverty strategy with employment, skills and workforce development programmes, to facilitate greater cross-departmental working. The Office of the First Minister and Deputy First Minister are currently developing their Delivering Social Change for Children and Young People strategy47, as part of a wider framework designed to achieve better co-ordination of key actions across Government Departments. However, there is concern that this strategy does not have as strong a focus on addressing child poverty as the previous Child Poverty Strategy, and does not sufficiently consider how the effects of low pay might be addressed. The linked Child Poverty Outcomes framework48 focuses on reducing the numbers of workless households and households where not all adults are in employment but fails to include progression or pay as part of its indicators. In addition, the current skills strategy is predominantly concerned with
PAGE 63 CHILD POVERTY, LOW PAY AND THE LABOUR MARKET
improving the skills of the workforce and meeting the needs of the local economy. While it does outline some measures for tackling skills barriers to employment, it does not address how these measures will benefit low-income households specifically.49
To reduce the numbers of families experiencing in-work poverty, welfare to work, workforce development and skills policy need to be better aligned with welfare reforms, changes to the tax system as well as family policy. Only then can we hope to achieve a sustained reduction in the numbers of children living in poverty.
1Defined as having an income below 60 per cent of the median, before deduction of housing costs. Department for Social Development (DSD), Households Below Average Income, Northern Ireland Report, 2002-03 to 2011-12 2 Department of Enterprise, Trade and Investment (DETI), Northern Ireland Labour Force Survey, Data Tables, published 13 August 2014 3 See A Davis with D Hirsch and M Padley, A Minimum Income Standard for the UK in 2014, Joseph Rowntree Foundation (JRF), 2014; D Hirsch and L Valadez, Wages, taxes and top-ups: the changing role of the state in helping working families make ends meet, JRF, 2014; and D Hirsch, The Cost of a Child in 2014, Child Poverty Action Group, 2014 4 DSD, Households Below Average Income, Northern Ireland Report 2011-2012, 2012. 5 Office for National Statistics (ONS), Time Series Dataset: Labour Market Statistics 6 Department of Finance and Personnel (DFP), Northern Ireland Labour Force Survey, Quarterly Supplement January – March 2014, and DETI, LFS Labour Market Statistics, March 2014 – May 2014 7 ONS, Labour Force Survey, Regional Labour Market Statistics, August 2014 8 DETI, Labour Force Survey Northern Ireland, Economic Activity Rate by Age, 13 August 2014; ONS, Labour Force Survey, Labour Market Statistics, August 2014 9 DETI, Northern Ireland Labour Force Survey Quarterly Supplement April - June 2014. 10 T MacInnes with H Aldridge, A Parekh and P Kenway, Monitoring Poverty and Social Exclusion in Northern Ireland 2012, JRF, 2012 11 ONS, Labour Force Survey, Regional Labour Market Statistics, August 2014. 12 ONS, Labour Force Survey, Unemployment by Age and Duration, 13 August 2014. 13 P Mac Flynn, Hours and Earnings in the Northern Ireland Labour Market, Nevin Economic Research Institute (NERI) Working Paper series, July 2014. 14 See note 13
PAGE 64 CHILD POVERTY, LOW PAY AND THE LABOUR MARKET
15 J Cribb with A Hood, R Joyce, D Phillips, Living Standards, Poverty and Inequality in the UK: 2013, Institute of Fiscal Studies (IFS), 2013 16 K Lawton and M Pennycook, Beyond the Bottom Line: the challenges and opportunities of a Living Wage, Institute of Public Policy Research (IPPR) and Resolution Foundation, 2013 17 H Barnard, Increasing the Minimum Wage is only a Half Answer to Poverty, http://www.jrf.org.uk/blog/2014/01/increasing-minimum-wage-only-half-answer-poverty accessed 14 October 2014 18 DETI, Labour Force Survey Northern Ireland, 2007-2014 19 Monitoring Poverty and Social Exclusion In Northern Ireland, 2014, JRF, 2014 20 K Ray with P Sissons, K Jones, and S Vegeris, Employment, Pay and Poverty, Work Foundation, 2014 21 See note 2 22 Metcalfe and Dhudwar, Employers’ role in the low-pay, no-pay cycle, JRF, 2010 23 UK Labour Force Survey Statistical Bulletin, 13 August 2014 http://www.ons.gov.uk/ons/dcp171778_372372.pdf, access 14 October 2014 24 UK Commission for Employment and Skills (UKCES), The Future of Work: Jobs and Skills in 2030, 2014 25 See note 23 26 See note 15 27 J Philpott, Rewarding Work for Low-paid Workers, JRF, 2014 28 D Devins with T Bickerstaffe, B Mitchell, and S Halliday, Improving progression in low-paid, low-skilled retail, catering and care jobs, JRF, 2014 29 Department for Learning and Employment (DEL), Labour Market Profile, Northern Ireland, July 2013 30ONS, Local area analysis of qualifications across England and Wales, 07 March 2014. 31 M Brewer, A Dickerson, L Gambin, A Green, R Joyce and R Wilson, Poverty and Inequality in 2020: Impact of changes in the structure of employment, JRF, 2012 32 M Barnes and C Lord, Poverty, economic status and skills: What are the links?, JRF, 2012 33 See note 31 34 K Schmuecker, The Future of the UK Labour Market, JRF, 2014 35 For a summary of what is known see K Ray, P Sissons, K Jones, and S Vegeris, Employment, Pay and Poverty, Work Foundation, 2014 36 See note 20 37 R McQuaid with J Cenduela, V Egdell and C Lindsay, Engaging Low-skilled Employees in Workplace Learning, UKCES, 2012 38 K Lawton and S Thompson, Tackling in-work poverty by supporting dual-earning families, JRF, 2013; V Alakeson, Childcare: failing to meet the needs of working people, Resolution Foundation, 2011

PAGE 65 CHILD POVERTY, LOW PAY AND THE LABOUR MARKET
39 R Dennison, Northern Ireland Childcare Cost Survey 2013, Employers for Childcare Charitable Group, 2013 40 K Lawton and S Thompson, Tackling in-work poverty by supporting dual-earning families, JRF, 2013 and D Hirsch and Y Hartfree, Does Universal Credit enable households to reach a minimum income standard?, JRF, 2013 41 See www.minimumincome.org.uk 42 L Clarke, “Northern Ireland’s politicians are making a dangerous mistake by digging their heels on welfare reform” Belfast Telegraph Blog http://www.belfasttelegraph.co.uk/debateni/blogs/liam-clarke/northern-irelands-politicians-are-making-a-dangerous-mistake-by-digging-their-heels-on-welfare-reform-30545929.html accessed 14 October 2014. Social security is devolved to the NI Executive but has in practice followed policy set by the UK Parliament in accordance with the principle of parity. 43 J Browne with A Hood and R Joyce, Child and Working Age Poverty in Northern Ireland from 2010 to 2020, IFS, 2013 44 DEL and DETI, Enabling Success - Driving social change through economic participation: a strategic framework to tackle economic inactivity, February 2014. See also: http://www.delni.gov.uk/es/economic-inactivity-consultation accessed 14 October 2014 45 DEL, Success Through Skills - Transforming Futures, May 2011 46 Northern Ireland Executive, Bright Start - The NI Executive’s Programme for Affordable and Integrated Childcare: Strategic Framework and Key First Actions 47 Office of the First Minister and Deputy First Minister (OFMDFM), Delivering Social Change for Children and Young People – consultation document, January 2014 48 The National Children’s Bureau, Child Poverty Outcomes Framework NI, OFMDFM, 2013 49 See note 45

PAGE 67
____________________________________________
CHAPTER FIVE
CHILD POVERTY AND SOCIAL SECURITY: AN UNRAVELLING
CONSENSUS
Les Allamby
____________________________________________
INTRODUCTION One of the interesting questions surrounding the three term Labour government in Britain was whether the pledge to eliminate child poverty by 2020 announced by Tony Blair was his idea or Gordon Brown’s. The speech initially drafted by speech writers in March 1999 for the (then) Prime Minister’s Beveridge lecture contained no such pledge and whoever inserted the commitment, it almost certainly had the support of both politicians.
In practice, tackling child poverty needs a range of initiatives and interventions including through social security policy, programmatic approaches and effective child poverty proofing of policies and initiatives, including economic policy, to ensure the goal of eradication of child poverty is met. This article focuses on the role played by social security, the impact of recent changes to social security under the Westminster coalition government and the likely impact of the Welfare Reform Bill still the subject of an impasse within the Northern Ireland Executive. In effect, social security changes have heralded the unravelling of the consensus in Britain to eradicate child poverty.
PAGE 68 CHILD POVERTY AND SOCIAL SECURITY: AN UNRAVELLING CONSENSUS
MEASURING CHILD POVERTY Making sense of the child poverty figures is not straightforward. It requires an examination of absolute and relative child poverty and also qualitative work on the practical impact on families of living on a low household income. In effect, this is not just material needs foregone, but also opportunities lost and impact on educational life chances, health and wellbeing.
A valuable starting point for analysis of recent trends is the Institute for Fiscal Studies report Child and Working Age Poverty in Northern Ireland 2010 to 2020.1 The report examines two of the four measures in the Child Poverty Act 2010, namely, the relative low income and absolute low income measures. In the report, absolute poverty is defined as having 60 percent or less of the 2010/2011 median household income (in real terms) before housing costs and relative poverty is 60 per cent or less of the median before housing costs in each year measured. The report analyses the Family Resources Survey figures and outlines the position in Britain where relative and absolute child poverty fell from 26 per cent in 1998/99 to 17.6 per cent and 10.5 per cent in 2010/2011 respectively. The authors characterise the change as being covered by three distinct phases. The period from 1998/99 to 2004/05 saw the greatest reduction in both absolute and relative child poverty, though for absolute child poverty the most rapid reduction was in the first three years from 1998/99 onwards. A second phase covering 2004/2005 to 2007/2008 saw this progress halted with absolute child poverty showing little change while relative child poverty increased slightly. The third phase covering 2007/2008 up until 2010/2011 saw further reductions in both absolute and relative child poverty with a significant fall in the latter in 2010/2011. The report notes this decline is attributable to a large decrease in median income with its impact on relative poverty rather than a significant increase in the living standards of low income households with children. This is borne out by the fact that absolute child poverty remained largely unchanged.
The figures in Northern Ireland followed a broadly similar path. Comparable figures only began to be collated when the Family Resources Survey was extended to Northern Ireland in 2002/2003. Nonetheless, there was an initial significant decline in absolute poverty through until 2006, followed by an increase to 2008 and a smaller reduction thereafter. Relative poverty declined less markedly to 2006 followed by a considerable increase to 2009 and another fall through to
PAGE 69 CHILD POVERTY AND SOCIAL SECURITY: AN UNRAVELLING CONSENSUS
2010/2011. The overall level of both relative and absolute poverty is higher in Northern Ireland than in Britain. The position does look very different depending on whether incomes are measured before housing costs or after housing costs are taken into account. Incomes measured before housing costs paints a bleaker picture as housing costs are generally lower in Northern Ireland than in Britain.
The Labour government had set itself an interim target of cutting absolute and relative child poverty in half from 1998/1999 to 2010/2011. By 2010/2011 the relative low income target was substantially missed though the numbers were heading in the right direction. The number of children in absolute poverty had reduced sufficiently to meet the interim target. In Northern Ireland, despite improvements, the numbers of children in poverty remained high with over one in five children in relative poverty and over one in seven children in absolute poverty. The reduction in child poverty was to a significant degree achieved through changes to the tax and social security system. In particular, child contingent support increased markedly, particularly through the tax credits system introduced in 2003. This is not to belittle other important initiatives including the introduction of the national minimum wage, Sure Start and (in Britain at least) a major focus on additional spending on and reform of childcare both within and outside of the social security system.
In Northern Ireland there were equivalent social security changes without the additional external reforms or comparable extra spending. Analysis by Dickens published in the National Institute Economic Review in 2011 noted that changes to tax credits and other social security benefits accounted for four times the level of decrease in relative poverty than changes in parental work patterns.2 In part, this is due to the fact that moving into work does not guarantee a family will move out of poverty. While not a new phenomenon, the political rhetoric surrounding the importance of getting into work is still not always matched by an end to low household incomes. In fact, the social security system in recent years has made a number of changes which run counter intuitive to the work based solutions emphasised by Ian Duncan Smith and other political colleagues.
PAGE 70 CHILD POVERTY AND SOCIAL SECURITY: AN UNRAVELLING CONSENSUS
A FINAL LABOUR LEGACY In its final year the Labour government left two legacies to child poverty. The first, the Child Poverty Act (2010) was designed to cement the commitment to the pledge to eradicate child poverty. The Act covering the UK aimed to entrench child poverty targets and set up (the now) Child Poverty and Social Mobility Commission. Enacted in the run up to the British general election of 2010, the three major parties in Britain all recommitted themselves therein to the aim of eradicating child poverty. This consensus, however, was to unravel spectacularly over the life of the following Parliament.
ON WELFARE REFORM:
THEY NEED TO
LOOK AFTER THE FAMILIES THAT HAVE CHILDREN
AND ARE TRYING TO REAR THEM.
The second legacy was less positive for families with children particularly those where one or both adults were incapable of work. The introduction of employment and support allowance in October 2008 with its attendant Work Capability Assessment test undertaken by Atos on behalf of the Department for Work and Pensions and Department for Social Development was followed by a major programme of migrating existing claimants from incapacity benefit to employment and support allowance. This was the forerunner of changes to the social security system for claimants of working age with a dual purpose of saving money and encouraging people back into work. The savings of £4 billion sought from the introduction of employment and support allowance was soon exceeded by the £18 billion sought following the emergency budget and comprehensive spending review statements of the new coalition government in June and October 2010.
PAGE 71 CHILD POVERTY AND SOCIAL SECURITY: AN UNRAVELLING CONSENSUS
The subsequent 2012 autumn statement envisaged a further £3.7 billion pounds being shaved off the social security budget.
SOCIAL SECURITY REFORM Welfare reform since 2010 amounts to the largest shake up of the social security system for a generation. The changes included the introduction of Universal Credit to replace six existing social security benefits (income support, income based jobseeker’s allowance, income related employment and support allowance, child tax credit, working tax credit and housing benefit) and the replacement of Disability Living Allowance for people of working age with Personal Independence Payment. While the introduction of Personal Independence Payment was designed to reduce projected spending over Disability Living Allowance by 20 percent, the introduction of Universal Credit anticipated an increase in overall expenditure. Unfortunately, this increase was being paid for many times over in a Faustian pact reached between the Department of Work and Pensions and the Treasury.
In effect, there have been two parts to social security reform. The first is a series of changes made from October 2010 onwards to reduce expenditure to social security. The second is the proposals contained in the Welfare Reform Act passed in Britain in early 2012 and the Welfare Reform Bill which still sits on the launching pad in Northern Ireland in September 2014. The first set of measures has been introduced in both Britain and Northern Ireland. The changes have largely impacted on people of working age both in and out of work. People of pensionable age have been relatively spared from the social security expenditure reductions save for the pension age rising for women and eventually on equalisation continuing to rise for both women and men.
The extent of the changes has been wide ranging. Figure 1 provides a list of the changes introduced from October 2010 to April 2013. It is noteworthy that many of the changes impact directly on families with children; from the abolition of the Health in Pregnancy Grant, restrictions to Sure Start maternity payments and abolition of the Child Tax Credit baby element through to general cuts to tax credits and housing benefit and adverse changes to uprating of working age social security benefits. All of the changes in figure 1 occurred in both Northern Ireland and Britain.
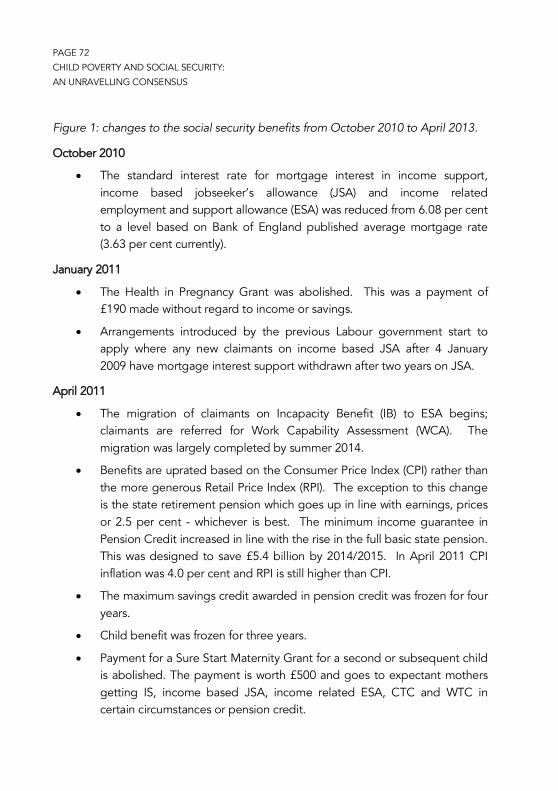
PAGE 72 CHILD POVERTY AND SOCIAL SECURITY: AN UNRAVELLING CONSENSUS
Figure 1: changes to the social security benefits from October 2010 to April 2013.
October 2010
The standard interest rate for mortgage interest in income support, income based jobseeker’s allowance (JSA) and income related employment and support allowance (ESA) was reduced from 6.08 per cent to a level based on Bank of England published average mortgage rate (3.63 per cent currently).
January 2011
The Health in Pregnancy Grant was abolished. This was a payment of £190 made without regard to income or savings.
Arrangements introduced by the previous Labour government start to apply where any new claimants on income based JSA after 4 January 2009 have mortgage interest support withdrawn after two years on JSA.
April 2011
The migration of claimants on Incapacity Benefit (IB) to ESA begins; claimants are referred for Work Capability Assessment (WCA). The migration was largely completed by summer 2014.
Benefits are uprated based on the Consumer Price Index (CPI) rather than the more generous Retail Price Index (RPI). The exception to this change is the state retirement pension which goes up in line with earnings, prices or 2.5 per cent - whichever is best. The minimum income guarantee in Pension Credit increased in line with the rise in the full basic state pension. This was designed to save £5.4 billion by 2014/2015. In April 2011 CPI inflation was 4.0 per cent and RPI is still higher than CPI.
The maximum savings credit awarded in pension credit was frozen for four years.
Child benefit was frozen for three years.
Payment for a Sure Start Maternity Grant for a second or subsequent child is abolished. The payment is worth £500 and goes to expectant mothers getting IS, income based JSA, income related ESA, CTC and WTC in certain circumstances or pension credit.
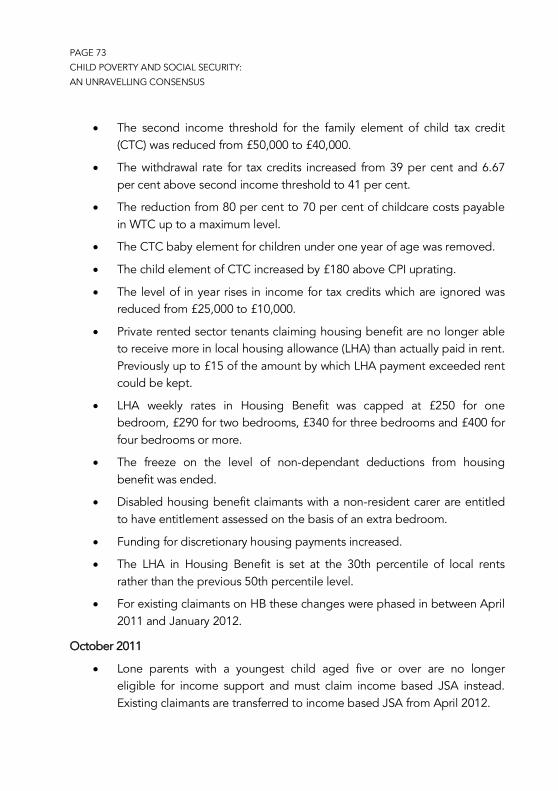
PAGE 73 CHILD POVERTY AND SOCIAL SECURITY: AN UNRAVELLING CONSENSUS
The second income threshold for the family element of child tax credit (CTC) was reduced from £50,000 to £40,000.
The withdrawal rate for tax credits increased from 39 per cent and 6.67 per cent above second income threshold to 41 per cent.
The reduction from 80 per cent to 70 per cent of childcare costs payable in WTC up to a maximum level.
The CTC baby element for children under one year of age was removed.
The child element of CTC increased by £180 above CPI uprating.
The level of in year rises in income for tax credits which are ignored was reduced from £25,000 to £10,000.
Private rented sector tenants claiming housing benefit are no longer able to receive more in local housing allowance (LHA) than actually paid in rent. Previously up to £15 of the amount by which LHA payment exceeded rent could be kept.
LHA weekly rates in Housing Benefit was capped at £250 for one bedroom, £290 for two bedrooms, £340 for three bedrooms and £400 for four bedrooms or more.
The freeze on the level of non-dependant deductions from housing benefit was ended.
Disabled housing benefit claimants with a non-resident carer are entitled to have entitlement assessed on the basis of an extra bedroom.
Funding for discretionary housing payments increased.
The LHA in Housing Benefit is set at the 30th percentile of local rents rather than the previous 50th percentile level.
For existing claimants on HB these changes were phased in between April 2011 and January 2012.
October 2011
Lone parents with a youngest child aged five or over are no longer eligible for income support and must claim income based JSA instead. Existing claimants are transferred to income based JSA from April 2012.

PAGE 74 CHILD POVERTY AND SOCIAL SECURITY: AN UNRAVELLING CONSENSUS
January 2012
The age limit for shared room rate for housing benefit increased from 25 to 35 years of age.
April 2012
Couples with children must work 24 hours a week between them with at least one partner working 16 hours a week in order to qualify for WTC.
The family element of CTC was withdrawn straight after the child element.
Backdating of tax credit claims and certain changes of circumstances was reduced from three months to one month.
A disregard of £2,500 was introduced in tax credits for in-year falls in income down from the £10,000 introduced in April 2011.
50 plus element of working tax credit was removed.
January 2013
Child benefit was removed where one parent earns more than £60,000 a year and withdrawn on a phased basis where one parent earns more than £50,000 a year.
April 2013
LHA rates set by Consumer Price Index (CPI) rather than by real rents.
Working age benefits to be uprated by 1 per cent for three years. This covers the main elements of JSA, ESA, income support, applicable amounts for HB, SSP, statutory maternity, paternity and adoption pay and maternity allowance. The disability, carers and pensioner premiums in means tested benefits and the support component in ESA will continue to be uprated in line with prices.
Child tax credit and working tax credit (excluding disability elements) will be updated by 1 per cent for three years.
Child benefit will be uprated by 1 per cent in 2014/2015 and 2015/2016.
The changes outlined in figure 1 have made substantial reductions to spending on social security and reduced the incomes of many families who rely on means-tested benefits – both those in and out of work.
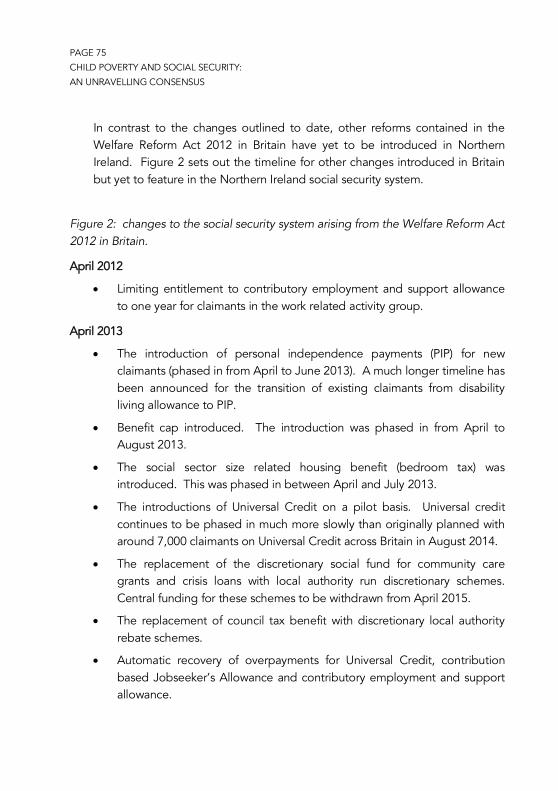
PAGE 75 CHILD POVERTY AND SOCIAL SECURITY: AN UNRAVELLING CONSENSUS
In contrast to the changes outlined to date, other reforms contained in the Welfare Reform Act 2012 in Britain have yet to be introduced in Northern Ireland. Figure 2 sets out the timeline for other changes introduced in Britain but yet to feature in the Northern Ireland social security system.
Figure 2: changes to the social security system arising from the Welfare Reform Act 2012 in Britain.
April 2012
Limiting entitlement to contributory employment and support allowance to one year for claimants in the work related activity group.
April 2013
The introduction of personal independence payments (PIP) for new claimants (phased in from April to June 2013). A much longer timeline has been announced for the transition of existing claimants from disability living allowance to PIP.
Benefit cap introduced. The introduction was phased in from April to August 2013.
The social sector size related housing benefit (bedroom tax) was introduced. This was phased in between April and July 2013.
The introductions of Universal Credit on a pilot basis. Universal credit continues to be phased in much more slowly than originally planned with around 7,000 claimants on Universal Credit across Britain in August 2014.
The replacement of the discretionary social fund for community care grants and crisis loans with local authority run discretionary schemes. Central funding for these schemes to be withdrawn from April 2015.
The replacement of council tax benefit with discretionary local authority rebate schemes.
Automatic recovery of overpayments for Universal Credit, contribution based Jobseeker’s Allowance and contributory employment and support allowance.
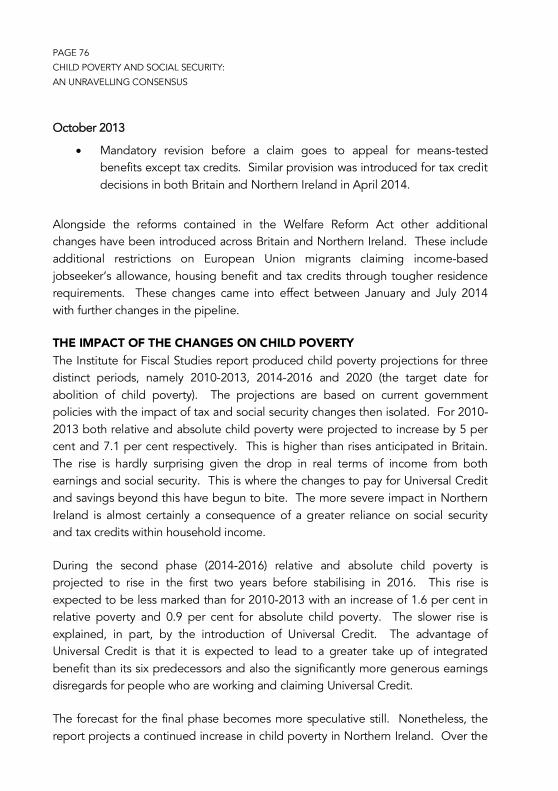
PAGE 76 CHILD POVERTY AND SOCIAL SECURITY: AN UNRAVELLING CONSENSUS
October 2013
Mandatory revision before a claim goes to appeal for means-tested benefits except tax credits. Similar provision was introduced for tax credit decisions in both Britain and Northern Ireland in April 2014.
Alongside the reforms contained in the Welfare Reform Act other additional changes have been introduced across Britain and Northern Ireland. These include additional restrictions on European Union migrants claiming income-based jobseeker’s allowance, housing benefit and tax credits through tougher residence requirements. These changes came into effect between January and July 2014 with further changes in the pipeline.
THE IMPACT OF THE CHANGES ON CHILD POVERTY The Institute for Fiscal Studies report produced child poverty projections for three distinct periods, namely 2010-2013, 2014-2016 and 2020 (the target date for abolition of child poverty). The projections are based on current government policies with the impact of tax and social security changes then isolated. For 2010-2013 both relative and absolute child poverty were projected to increase by 5 per cent and 7.1 per cent respectively. This is higher than rises anticipated in Britain. The rise is hardly surprising given the drop in real terms of income from both earnings and social security. This is where the changes to pay for Universal Credit and savings beyond this have begun to bite. The more severe impact in Northern Ireland is almost certainly a consequence of a greater reliance on social security and tax credits within household income.
During the second phase (2014-2016) relative and absolute child poverty is projected to rise in the first two years before stabilising in 2016. This rise is expected to be less marked than for 2010-2013 with an increase of 1.6 per cent in relative poverty and 0.9 per cent for absolute child poverty. The slower rise is explained, in part, by the introduction of Universal Credit. The advantage of Universal Credit is that it is expected to lead to a greater take up of integrated benefit than its six predecessors and also the significantly more generous earnings disregards for people who are working and claiming Universal Credit.
The forecast for the final phase becomes more speculative still. Nonetheless, the report projects a continued increase in child poverty in Northern Ireland. Over the

PAGE 77 CHILD POVERTY AND SOCIAL SECURITY: AN UNRAVELLING CONSENSUS
period of 2010 to 2020 as a whole, relative child poverty will have increased by 8.3 per cent and absolute child poverty by 11.5 per cent. The equivalent forecast across the decade for the United Kingdom is an increase in relative and absolute child poverty of 6.0 per cent and 9.6 per cent respectively. The projected continued increase in child poverty occurs even during a period with an improved economic growth outlook.
The report also undertook projections for child poverty based on not introducing the social security and tax changes. Recognising the degree of artificiality in that the social security system was unlikely to remain unchanged for a decade regardless of who was in power in Westminster, it does illustrate the important role social security policy plays in affecting child poverty. In effect, the report concludes that the increase attributable to the social security changes is a 6.9 per cent increase in relative child poverty and an 8.8 per cent increase in absolute child poverty. In practice, the advantages of the introduction of Universal Credit are significantly outweighed by other changes, particularly the decision to annually uprate many social security benefits based on the consumer price index measure of inflation rather than the higher retail price index measure.
One of the variants since the IFS study was published has been the slow down in the introduction of Universal Credit with a projected timetable for full implementation having been prolonged. The disproportionate offer of pain to gain has, to date, been substantially one of pain only. Moreover, while the overall advantages of Universal Credit are clear, there remain significant groups who may not benefit substantially. Households with couples who are both in work will receive nothing like the relative gain than their single earning household counterparts. The long term plans for integrating passport benefits into Universal Credit will also affect the overall advantage or otherwise of being in work. This issue remains unresolved at the time of writing.
The IFS initial projections for 2010-2013 have largely been borne out by research elsewhere. The New Policy Institute report Monitoring Poverty and Social Exclusion in Northern Ireland 2014 for the Joseph Rowntree Foundation noted that household income, poverty rates and the labour market had all deteriorated. Poverty in working age families has increased, particularly among working families.3
PAGE 78 CHILD POVERTY AND SOCIAL SECURITY: AN UNRAVELLING CONSENSUS
One of the effects of the cuts to tax credits and housing benefit has been to make life more difficult for people in work. The prevalence of low pay has meant that, in practice, work is not an automatic pathway out of poverty. While being in work has many valuable spinoffs, there is a need to focus on the quality and terms and conditions of employment rather than simply employment itself.
THE UNRAVELLING CONSENSUS The Child Poverty Act 2010 represented the high watermark of a consensus on the need to end child poverty. With hindsight, the all-party agreement to tackling child poverty now looks like expediency close to a general election. The coalition government commissioned work from the Labour MPs Frank Field and Graham Allen to examine programmatic approaches to tackling child poverty and improving life chances and took little account of the conclusions. There is a clear need for approaches which tackle income poverty and increasing inequality alongside programmatic approaches. Social security is a key element of any former approach.
Instead, social security for working age families has emphasised ‘work first’ while paradoxically cutting both in work and out of work benefits. This has been accompanied by a concerted attack on working age people reliant on social security. The language of welfare dependency and the undeserving claimant has returned with a vengeance. The aim of eradicating child poverty has come in second to populist rhetoric underpinning social security policies designed to save money, creating consequent hardship. Moreover, budget cuts elsewhere, including to local authority budgets in Britain, have further undermined programmatic responses to tackling child poverty.
In the absence of a ‘Plan B’ a welfare reform bill in Northern Ireland will eventually have to be passed. The reality is that the IT system for the existing means-tested benefits in Northern Ireland is run from Britain. While it will now be some considerable time before the existing system is no longer needed in Britain, there are no plans to provide an alternative or pay for the preservation of the existing IT systems. The impact of the existing concessions agreed with the Treasury on child poverty is difficult to measure. The detail of splitting universal credit payments, between couples, paying fortnightly rather than monthly and paying landlords housing credit has still to emerge despite two years passing since its initial
PAGE 79 CHILD POVERTY AND SOCIAL SECURITY: AN UNRAVELLING CONSENSUS
announcement. Equally, what a different approach to sanctions and support for obtaining independent medical evidence for PIP will look like in practice is also not clear. Confining the size related social sector changes (bedroom tax) to new claimants, a discretionary support fund to replace the social fund and absorbing Treasury cuts to rate rebate payments will all help. There are a plethora of other options which can ameliorate the changes at little or no cost. An open debate of what can be done, at what cost and how it could be paid for is urgently needed. This may move us into the terrain of the need for tax raising powers locally and the desire for a more progressive tax system as well as what a social security system might look like in the longer term. The Scottish Referendum was the impetus for longer term planning for social security in Scotland. Without such an approach in Northern Ireland it is clear that the unravelling of the consensus on eradicating child poverty in Britain and current social security policy is going to plunge more children into poverty.
1 J Browne with A Hood and R Joyce, Child and Working Age Poverty in Northern Ireland from 2010 to 2020, Institute of Fiscal Studies, 2013 2 R Dickens, ‘Child Poverty in Britain: Past Lessons and Future Prospects’, National Institute Economic Review 218, 1, 2011, pp 7-19 3 Monitoring Poverty and Social Exclusion In Northern Ireland, 2014, Joseph Rowntree Foundation, 2014
PAGE 81
____________________________________________
CHAPTER SIX
CHILD POVERTY AND
CHILDCARE
Rachel Dennison Employers for Childcare
____________________________________________
INTRODUCTION The full benefits of investing in an excellent childcare system extend well beyond the needs of parents and families only; the local labour market and economy also gain in the short, medium and long term. The provision of suitable childcare is therefore an important tool in any attempt to reduce child poverty. Unfortunately in Northern Ireland the childcare system which is in place does not meet the needs of families, and with the rates of child poverty on the rise, this is a matter which needs urgent attention.
This chapter explores the existing childcare system in Northern Ireland and discusses the links between childcare provision and child poverty.
CHILDCARE AND THE POLITICAL AGENDA The vital role which childcare plays in society has been recognised at various levels, most notably by a range of European Governments, particularly in the Nordic countries, which have heavily invested in childcare services for the benefit of children, families, businesses and their economies.
PAGE 82 CHILD POVERTY AND CHILDCARE
The childcare systems in Nordic countries are often upheld as the benchmark of excellence. Childcare is either universally provided or heavily subsidised, systems of care place the needs of the child at the centre, closing the gap between education and childcare and enabling parents to enter the workforce. Childcare also features highly on the political agenda, and the childcare systems in place serve as a testament to the policies and legislation which underpin them.
Within the UK, England, Scotland and Wales have been proactively addressing childcare since the late 1990s. Each region has one Government department which takes ownership and responsibility for childcare. In England and Wales the Childcare Act 2006 places a statutory duty on Local Authorities to ensure that there is sufficient childcare in place to meet local need. Scotland has a similar obligation in place.
Over the last couple of years the main political parties in England, Scotland and Wales have taken real steps to address the problems associated with childcare provision. The establishment of a childcare commission in England in 2012 was designed to investigate measures to address the problems of childcare affordability and the lack of school age childcare. A number of measures have been proposed, some of which, including Tax Free Childcare, will soon pass into law. Each of the main political parties has also set out their proposals for childcare reform ahead of the next election. Whilst views differ on the efficiency of these policies, it is positive that the lack of childcare is now being recognised as a social problem which needs attention.
One of the key reasons why the UK Government has increasingly prioritised childcare is the recognition that it makes a positive contribution to both economic growth and social inclusion. This has been the main driving force behind the expansion of childcare services in England, Scotland and Wales. The development of relevant, up-to-date strategies and legislation has led to an increase in childcare provision, and greater access to appropriate advice and information services.
Northern Ireland is unique within the context of the UK because childcare simply did not feature highly on the political agenda for over a decade. The first childcare strategy was introduced in 1999, but while the other three regions reviewed and updated their childcare strategies, ours became outdated and obsolete.
PAGE 83 CHILD POVERTY AND CHILDCARE
It was not until 2011 that a commitment to publish and implement a new childcare strategy was given. After a period of public consultation, the Executive launched ‘Bright Start’, a childcare framework and precursor to a childcare strategy in September 2013. Bright Start contains 15 key first actions1 which aim to take the first steps towards addressing the problems associated with childcare provision in Northern Ireland. These actions include measures to address school age childcare, rural childcare, childcare for children with disabilities, information services and workforce development. A full childcare strategy is due to be launched in March 2015.
We are hopeful that both ‘Bright Start’ and the forthcoming childcare strategy will take proactive, effective and innovative steps towards tackling the problems associated with childcare. It is very positive that childcare has finally made it onto the political agenda; however, the effects of the lack of attention it has received over the last decade are clear to be seen. Childcare in Northern Ireland is difficult to source, typically inflexible and expensive.
In today’s economic times, childcare services have a key role to play in supporting children, families and the local economy. There is a greater need than ever before to ensure that the childcare infrastructure is fit for purpose and that it can be used as a mechanism in tacking child poverty in Northern Ireland.
CHILDCARE AND CHILD POVERTY Childcare impacts on the rate of child poverty in three ways. Firstly, the lack of available childcare is a barrier to employment for parents. Secondly, the high cost of childcare places pressure on family incomes. Thirdly, childcare is essential for early intervention, particularly regarding the developmental needs of children.
CHILDCARE AND EMPLOYMENT The impact of the global recession has been felt in Northern Ireland. The latest Monitoring Poverty and Social Exclusion report showed that over the last five years household incomes, poverty rates and the labour market have all worsened in the region.2 Between 2007/08 and 2012/13 the proportion of unemployed working-age people in Northern Ireland almost doubled.3

PAGE 84 CHILD POVERTY AND CHILDCARE
The Coalition Government’s mantra is that work is the surest route out of poverty, and whether one agrees with this approach or not, there are many barriers which prevent parents from entering work in the first instance. For many the most significant of these is the lack of suitable childcare.
For parents to both secure and sustain employment they must be able to source a childcare service which will meet their needs. The failings of the current childcare system make this very difficult for parents.
OVERALL CHILDCARE PROVISION Current provision of childcare in Northern Ireland fails to meet the needs of families. According to the Department for Health Social Services and Public Safety’s (DHSSPS) latest figures there are 41,110 childcare places in day nurseries, childminding settings and out of school clubs across Northern Ireland.4 These types of provision support working parents by either covering full time hours or by assisting the working parents of school aged children through wraparound care. Typically parents require childcare for children between the ages of 0 to 14 years old. The 2011 Census results show that there are 354,703 children within this age band in Northern Ireland.5 There is therefore a ratio of one childcare place to every 8.6 children. Even if only half of the 354,703 children living in the region required childcare to enable their parents to work, an additional 136,242 places would need to be created.
The lack of available childcare is clear; however, problems with accessibility extend well beyond the number of overall places. There is limited provision to cater for the needs of different family types in Northern Ireland. Much of our research and work with parents points to a lack of childcare for children with disabilities and/or special needs6, school age childcare, rural childcare and childcare which is available outside ‘normal’ working hours (Monday to Friday, 8.00am-6.00pm).7
Each family will have a range of different needs which will depend on, for example, the number of children, age of children, location of work and home and the type of work, to name a few. Childcare and work arrangements must be coordinated in a manageable way so that families can balance their work and family lives effectively. This is particularly important for lone parents who cannot share arrangements with
PAGE 85 CHILD POVERTY AND CHILDCARE
their partner. Additional childcare places need to be created which will cater for specific needs if we are to have a truly fit for purpose childcare infrastructure.
FLEXIBILITY In addition, childcare must also be flexible to assist parents in balancing their caring and work responsibilities. Last year’s Childcare Cost Survey showed that 54% of parents found it difficult to find flexible childcare in their area.8
As the nature of work changes, and parents are required to work longer or atypical hours, childcare services must accommodate changing needs. Many of the parents Employers For Childcare works with require versatile childcare and would also benefit from flexibility around the opening hours of childcare settings to facilitate working patterns.9 The Bright Start framework does not include measures to address issues around the flexibility or opening hours of childcare services.
AFFORDABILITY Employers For Childcare Charitable Group’s research shows that the main barrier to parents being able to access childcare in the first instance, and therefore enter work, is the high cost of childcare services.
Childcare in Northern Ireland is expensive. The results of the 2013 Northern Ireland Childcare Cost Survey showed that a full time childcare place costs on average £158 per week.10 For the average family with two children in full-time childcare, this represents an annual cost of £16,432 per year.
The survey showed that 46% of parents either reduced their hours of work, or left work altogether, due to the high cost of childcare.11 Many of the parents who responded to our survey felt they had no choice but to reduce their hours or leave work in order to manage financially. The decision to do so is very often a last resort. The lack of affordable childcare therefore contributes to the unemployment rate, the economic inactivity rate and the number of people working part-time.
With regard to the rate of economic inactivity, just over 82,000 people in Northern Ireland are economically inactive due to family commitments.12 18% of this group would prefer to be in work and contribute to the economy.13 This equates to over
PAGE 86 CHILD POVERTY AND CHILDCARE
14,700 people who are economically inactive but would like to be in work. Childcare plays an integral role in assisting parents with caring responsibilities to enter the workforce, and conversely the lack of affordable childcare contributes to the number of parents leaving work to become economically inactive. Both of these factors link to the rates of child poverty in Northern Ireland.
Low income families are adversely affected by high childcare costs as the proportion of their income consumed by childcare costs is greater than for higher income households. The cost of childcare is simply unaffordable for many of these families and is therefore a greater barrier to work.
Overall, for those parents who want to access work, suitable childcare which meets their family’s needs must be available to them. The failings of the existing childcare system can make it very difficult for parents to find childcare that is appropriate, flexible and affordable. The lack of affordable childcare in particular is a major barrier to employment for those who will enter work at a low income. With the welfare reform agenda in the pipeline and a greater drive to assist people into work, it is ever more important that there is sufficient and appropriate childcare to meet the needs of families, especially for those who are living in poverty.
THE IMPACT OF CHILDCARE COSTS ON FAMILY INCOMES The level of in-work poverty has risen significantly over the last few years. Over half of those children growing up in poverty in Northern Ireland now live in a working household.14 Today we find ourselves in a situation where work is not necessarily the surest route out of poverty.
In Northern Ireland the level of overall wages, the costs of goods and services and the impact of government austerity measures have placed families in difficult financial circumstances. Earlier this year the Joseph Rowntree Foundation reported that the typical household in Northern Ireland saw almost a 10% reduction in income. However, poorer families saw a greater reduction in income of 16%.15 Furthermore families, particularly those on low incomes, have been adversely affected by a series of austerity measures implemented by the Government. Since 2010 many family benefits and entitlements, which supplemented family incomes, have been reduced or removed altogether.
PAGE 87 CHILD POVERTY AND CHILDCARE
The impact of lower pay and stagnant wages, alongside the increased cost of living has hit families on the lowest incomes hard. Save the Children recently reported that 70% of low income families stated that they were struggling to pay for essentials such as food and heating.16 The rising cost of childcare is one factor which places families under increased financial pressure.
Last year’s Childcare Cost Survey showed that 63% of parents struggled with the cost of childcare either throughout the year or at some point during it.17 A higher number of single parents struggled with their costs (78%), compared to two parent families (62%).18 The results also showed that the average earner allocated 44% of their take home pay to childcare costs.19 For low income families the cost of childcare takes up an even greater proportion of their disposable income.
Many of the parents who responded to the survey commented on the pressure childcare costs place on the family. Childcare was considered to be a necessary payment that was often made at the expense of other items. For some families essential items such as food and heating were sacrificed. The following are quotes from parents:
“This [childcare] is an expense that just comes out every month like the mortgage. I have to reduce in other areas like food and heating in order to ensure that it is paid.”
“It’s a constant worry and struggle as to whether I can afford it or not and what I’ll have to do without to pay my childcare costs.”20
Save the Children also reported in A Fair Start for Every Child that parents repeatedly cited childcare costs as a reason for reducing expenditure on other goods. A number also commented that childcare costs had forced them to fall into debt. These results correlate with a number of parents who responded to the Childcare Cost Survey stating that they often relied on credit cards or overdrafts to be able to afford childcare.
Many other families are ‘pay neutral’, meaning that the income earned through work only covers the cost of family bills, including childcare, with nothing left over
PAGE 88 CHILD POVERTY AND CHILDCARE
each month – these families may already be classed as being in ‘working poverty’, or are in danger of easily falling into absolute poverty.
ON CHILDCARE:
THEY ONLY PAY
SO MUCH TOWARDS CHILDCARE,
IT IS TOO EXPENSIVE.
There is financial assistance available to families with the cost of childcare through the Childcare Element of Working Tax Credit and the Childcare Voucher Scheme. Few families take up their entitlements as awareness of this support is low. Indeed in 2013, only 19% of parents stated that it was easy or very easy to access information on the financial help available with childcare costs.21
Availing of either type of support could offset the cost of childcare for families, but like many other family benefits and entitlements, this type of support is also not as beneficial as it would have been prior to the recession. From 2011 the Childcare Element of Working Tax Credit has been reduced from 80% to 70% of total childcare costs. The Childcare Voucher scheme was also changed to limit the amount higher rate tax payers could save, yet no attempt to increase savings for basic rate tax payers was made. Indeed the monthly cap for childcare vouchers has not increased since 2005, meaning that the support available has not risen in line with childcare costs.
There is a need to address the cost of childcare. The services which are available are simply not affordable for families, particularly low income families. Childcare is necessary for enabling many parents to work, however when the childcare bill eats
PAGE 89 CHILD POVERTY AND CHILDCARE
up a significant proportion of the disposable income and forces families to cut back on essential items, such as food and heating, it adds to the number of families in Northern Ireland in working poverty. Unless the cost of childcare is addressed it will continue to be a stumbling block to any progress in reducing child poverty.
CHILDCARE AND THE DEVELOPMENTAL NEEDS OF CHILDREN There are clear links between the prevalence of poverty and a child’s life chances.22 Research shows that poverty has a significant negative impact on children’s development cognitively, socially and emotionally.23 Many studies have also pointed to the differences in academic achievement between children from disadvantaged families and those who are not affected by poverty. The role of early intervention in alleviating and reversing these negative trends has been explored by a number of studies, both in the UK and internationally. Quality childcare services for pre-school children which link care and early learning have an impact on children’s development.
The most crucial years for learning and development are from birth to the age of six. The benefits of providing good quality childcare during these years are substantial and include improvements in cognitive skills, such as language development, logic, reasoning and concentration.24 The Effective Provision of Preschool Education (EPPE) Project, involving a longitudinal study of 3,000 children in the UK, showed that the cognitive outcomes in reading and mathematics nurtured during pre-school provision persist throughout primary school.25 Children are therefore more school–ready by the time formal education begins. In terms of social and emotional development, good pre-school care is proven to develop children’s sociability, peer-relationships and independence.
Investing in good quality childcare services is therefore beneficial for children’s development, and this is particularly important for children living in disadvantaged areas. A recent report by Policy Exchange commented that, in 2013, only 56% of children living in the poorest 30% of areas achieved a good level of development, compared to 68% of children living outside these areas.26 Children in disadvantaged areas can be left with long-term educational disadvantage if they cannot access good pre-school childcare.
PAGE 90 CHILD POVERTY AND CHILDCARE
Melhuish’s overview of international research in this area concludes that the benefits of intellectual, social and behavioural development through good quality pre-school education and care are more substantial for disadvantaged children.27 A number of other studies have shown similar trends. Furthermore, the most prominent longitudinal studies in this area show that not only are there short term development benefits, but there are also long term advantages such as improved educational attainment, less risk of juvenile arrests, a lower rate of substance misuse and better adult employment and earning prospects.28 Therefore, in many cases the full benefits of good pre-school education and care are not realised until many years later. Policy Exchange suggest that there are many reasons why Government should invest in good early years provision:
“If they [Government] can invest money at the right time in the right way, they can potentially address problems before they begin to develop. By identifying needs at a young age, and providing a good start in education, the goal of creating a fairer more meritocratic society, where social mobility is a reality, seems more achievable. There are also huge costs which emerge later in a child’s life which could be avoided…Early years education can have an important impact not just on cognitive development but also on the vital emotional and social characteristics that make people more able to participate in society.”29
Good quality childcare has the potential to break the cycle of poverty, improve chances of social mobility and reduce rates of child poverty. However the key to achieving each of these benefits is grounded in the provision of childcare which links early learning and care.
Childcare services should, therefore, contain developmental and learning opportunities in combination with care. In the Nordic countries childcare and early learning are inextricably linked. Indeed the OECD, European Commission and European Council all advocate the need to integrate childcare and early learning into one service.30
In England and Wales, the Early Years Foundation Stage (EYFS) was created in 2008 and sets a statutory standard that all early years providers must meet. The EYFS framework supports an integrated approach to early learning and care. It provides a set of common principles and commitments to deliver quality early
PAGE 91 CHILD POVERTY AND CHILDCARE
education and childcare experiences for pre-school children. All schools and Ofsted-registered early years providers must follow the EYFS, which includes childminders, pre-schools and nurseries. Although the framework is not as advanced as the systems of educare in other European countries, it attempts to bring together early learning and childcare for the benefit of children. This framework does not exist in Northern Ireland.
Childcare and education (including early education) are viewed as two distinctly different policy areas in Northern Ireland. Indeed the Department of Education’s recent Early Years strategy, Learning to Learn, for children aged 0-6 does not include childcare services, nor does it link education and childcare. Indeed, despite one of the key actions being to “collaborate with other departments and work towards a common goal of improving outcomes for children”31, there is no mention of joint working in the area of childcare.
The Pre-School Education Programme which provides one year of pre-school education for children aims to deliver a “rich variety of challenging play activities and other experiences in a stimulating environment to help children learn and develop.”32 However, the programme explicitly states that it is “not provided to meet the day care needs of parents.”33 Indeed the pre-school programme only offers 12.5 hours of early education during term time to children in their pre-school year. The eligibility criteria and the number and inflexibility of hours make it difficult for working parents to access the places. Therefore although pre-school places may be beneficial for children in their pre-school year, this model of early learning does not link with childcare.
OFMDFM are currently developing a Childcare Strategy for Northern Ireland, and early discussions on the content of the strategy are focused on creating a child-centred approach with strong links between early learning and childcare. If this is to be achieved, better connections and collaboration between the Department for Education and the lead department on the Childcare Strategy will have to be in place. Given the findings detailed above around the benefits of investing in quality childcare provision, it is essential for strong links to be formed between early education and childcare in Northern Ireland. The role that good quality childcare services (which are based on a model of educare) have in breaking the cycle of
PAGE 92 CHILD POVERTY AND CHILDCARE
intergenerational poverty is clear. Indeed a UK study by Waldfogel and Garnham (2008) found that a high quality childcare system could reduce child poverty by between one-half and one-sixth.34 Northern Ireland will miss out on these benefits if the childcare system is not upgraded to ensure that it caters for the developmental needs of children.
If the full benefits are to be achieved, every childcare setting must offer quality childcare in conjunction with early learning. In its current state the childcare infrastructure does little to reap the benefits of improved child development, especially for children in areas of disadvantage who seek to benefit the most.
CONCLUSION Save the Children predict that, based on current trends, 38% of children in Northern Ireland will be living in poverty by 2020.35 The lack of a childcare system which meets the needs of families in Northern Ireland is a major contributory factor to the rate of poverty.
The problems associated with childcare provision in terms of its accessibility, suitability and flexibility make it difficult for parents to access childcare to enable them to work and sustain an income for their families. Furthermore, the high cost of childcare is the main barrier to work for many parents, contributing to the rates of economic inactivity and unemployment. If parents cannot afford the cost of childcare they are unlikely to be able to access work in the first instance.
The high cost of childcare also contributes to the rate of in-work poverty. Childcare costs can take up a large proportion of a family’s disposable income, forcing some parents to sacrifice essential items such as food and heating. This is detrimental to the family’s basic standard of living and undermines the role of work in creating economic stability.
In addition to supporting parental employment and benefiting the local labour market and economy, childcare has a role to play in children’s development. However, the policy disjoint between early years education and childcare, which are inextricably linked in other countries, hampers the role which childcare could play in child development.
PAGE 93 CHILD POVERTY AND CHILDCARE
The links between the lack of an appropriate childcare system and child poverty are clear. In order to redress this issue, lack of childcare must be acknowledged as an underlying cause of poverty. This must begin with political recognition of childcare as both a social and economic issue. There are many gains to be made by investing in childcare which is focused on a model of educare and by ensuring that adequate provision is available for all disadvantaged families. Given the current rates of child poverty and predicted outlook for many years to come this is an issue which needs to be tackled as a matter of urgency.
1 Northern Ireland Executive, Bright Start - The NI Executive’s Programme for Affordable and Integrated Childcare Strategic Framework and Key First Actions, 2013, http://www.northernireland.gov.uk/bright-start-strategic-framework-key-actions.pdf accessed 14 October 2014, pp 13-14 2 Monitoring Poverty and Social Exclusion In Northern Ireland, 2014, Joseph Rowntree Foundation (JRF), 2014 3 see note 2, p 1 4 Department of Health, Social Services and Public Safety (DHSSPS), Statistical Press Release, Publication of ‘Children’s Social Care Statistics for Northern Ireland 2012/13, 2013, http://www.dhsspsni.gov.uk/microsoft_word_-_childrens_social_care_statistics_201213_press_release.pdf accessed 14 October 2014 5 Northern Ireland Statistics and Research Agency (NISRA), Age - Single Year: QS103NI (administrative geographies), 2011, www.ninis2.nisra.gov.uk/Download/Census%202011/QS103NI%20(a).xlsx accessed 14 October 2014 6 S Lowndes and N Smith, Childcare for all?, Lisburn: Employers For Childcare Charitable Group, 2011, p xv 7 For further information, see R Dennison, Northern Ireland Childcare Cost Survey 2013, Lisburn: Employers For Childcare Charitable Group, 2013; Employers For Childcare Charitable Group, ‘Towards a Childcare Strategy’ Parent Consultation Summary of results, 2013, http://vouchers.employersforchildcare.org/media/towards-a-childcare-strategy-parent-response-to-consultation.pdf accessed 14 October 2014; S Lowndes and R Dennison, Wraparound Childcare in Primary Schools: Consulting Primary Schools on the Provision of Wraparound Services, Lisburn: Employers For Childcare Charitable Group, 2013 8 R Dennison, Northern Ireland Childcare Cost Survey 2013, Lisburn: Employers For Childcare Charitable Group, 2013, p 51

PAGE 94 CHILD POVERTY AND CHILDCARE
9 Employers For Childcare Charitable Group, ‘Towards a Childcare Strategy’ Parent Consultation - Summary of results, 2013, p 2 10 See note 8, p 5 11 see note 8, p 45 12 Department For Employment and Learning (DEL) and the Department of Enterprise, Trade and Investment (DETI), A Consultation on “Enabling Success” A New Strategic Framework to Tackle Economic Inactivity in Northern Ireland – Driving Social Change Through Economic Participation, http://www.delni.gov.uk/economic-inactivity-roadshow-consultation-document-february-2014.pdf accessed 14 October 2014, p 18 13 see note 12, p 21. 14 Save the Children, A Fair Start for Every Child: NI Executive Summary, Belfast: Save the Children, 2014 15 See note 2, p 2 16 See note 14, p 2 17 R Dennison, Northern Ireland Childcare Cost Survey 2013, Lisburn: Employers For Childcare Charitable Group, 2013, p 41 18 see note 17, p 43 19 see note 17, p 39 20 see note 17, p 42 21 see note 17, p 52 22 See F Field, The Foundation Years: Preventing Poor Children Becoming Poor Adults, 2010, http://dera.ioe.ac.uk/14156/1/poverty-report.pdf accessed 14 October 2014 23 See J Waldfogel and E Washbrook, Low Income and Early Cognitive Development in the UK, Sutton Trust, London, 2010 24 See M Hill and E Knights, Quality Costs – Working Paper 1, What is high quality early childhood education and care? London: Daycare Trust, 2009 25 Sammons et al, The Effective Pre-School and Prinary Education Project 3-11 (EPPE 3-11): Influences on Children’s Attainment and Progress in Key Stage 2: Cognitive outcomes in year 5, London: DFES and Institute of Education, University of London, 2007 26 H Waldergrave and L Lee, Quality Childcare – Improving early years childcare, London: Policy Exchange, 2013, p 14 27 EC Melhuish, A Literature Review of the impact of early years provision on young children with emphasis given to children from disadvantaged backgrounds, prepared for the National Audit Office, Institute for the Study of Children, Families and Social Issues, Birkbeck College, 2004 28 see note 27, p 14 29 see note 16, p 19 30 See European Commission, Early Childhood Education and Care: Providing all our children with the best start for the world of tomorrow, 2011, http://eur-

PAGE 95 CHILD POVERTY AND CHILDCARE
lex.europa.eu/LexUriServ/LexUriServ.do?uri=COM:2011:0066:FIN:EN:PDF accessed 14 October 2014 31 Department of Education, Learning to Learn: A Framework for Early Years Education and Learning, Department of Education, 2013, p 25 32 see note 31, p 15 33 see note 31, p 15 34 J Waldfogel and A Garnham, Eradicating Child Poverty: The Role of Key Policy Areas, York: Joseph Rowntree Foundation, 2008, pp 3-4 35 see note 14, p 1
PAGE 97
____________________________________________
CHAPTER SEVEN
CHILD POVERTY AND
EDUCATION
Goretti Horgan University of Ulster
____________________________________________
INTRODUCTION This chapter explores the impact of poverty on education. It starts by examining the facts and figures; then it looks at what we know about what children and young people who are growing up in poverty think about education; finally, it explores what the evidence indicates could make a difference to outcomes for poorer children, and what the Assembly and the Department of Education think should be done to make sure that all children and young people benefit equally from the education system.
THE “ATTAINMENT GAP” One of the most vicious and long-lasting impacts of growing up in poverty is poorer educational outcomes. When we talk about inequalities in Northern Ireland, the gap between the educational attainment of children living in poverty and those from better off families is one of the most blatant. From as early as 22 months of age, children of well-off parents are already 14 percentage points higher up the scale of educational development than children of working class parents.1 By age three, children growing up in poverty are a full year behind children from better-off families in relation to cognitive development, social skills and school readiness generally. By age six, even those children from more affluent families who started
PAGE 98 CHILD POVERTY AND EDUCATION
off as low achievers will out-perform high achieving children from low income families.
Northern Ireland has twice as many children living in persistent poverty, that is, being in poverty for three out of any four years, than is the case in the rest of the UK and the effects of persistent poverty are significant. Analysing four waves of the Family and Children’s Survey, the National Centre for Social Research found that the risks of poor outcomes were considerably greater than the risk faced by children in temporarily poor families. Those outcomes included being suspended or expelled from school.
As well as being hugely unfair on children, robbing poorer children of the same opportunities to get on in life as better off children, this significant inequality is costly to the economy of Northern Ireland. The Confederation of British Industry (CBI) suggests that the UK economy would benefit by up £8 trillion over the lifetime of a child born today, if the attainment gap was reduced to the Finnish level.2 Save the Children estimates that “success in closing the gap in Northern Ireland would have resulted in increased economic gains of around £400 million in 2013, rising to £1.2 billion by 2030.”3
Each year, A level and GCSE results show Northern Irish students ahead of students in England and Wales. In 2013, 68.1 per cent of students achieved grades A*-C in their GCSEs, with Northern Ireland at 76.5 per cent, England 67.9 per cent and Wales at 65.7 per cent – students from this region were over 8 percentage points ahead of those in England or Wales.4 But this is only half the story because, by the time the most disadvantaged young people reach GCSE level, the attainment gap is substantial. As pointed out in the 2014 Peace Monitoring Report, while we have some of the best results in the UK, when it comes to those who do very poorly in the educational league tables, Northern Ireland also has the worst results. For example, no school in England “has fewer than 14 per cent of its pupils achieving 5 good GCSEs in the OFSTED 2012/13 Annual Report. Three schools in Northern Ireland are below this line”.5 The 2014 Peace Monitoring Report also provides details of the ESCS Index of economic, social and cultural status. This index provides an indication of how much students’ outcomes are affected by social background. The scores for the Republic of Ireland, Scotland and Wales are all below the OECD average of 39 on the index, “with scores of 38, 37 and 35
PAGE 99 CHILD POVERTY AND EDUCATION
respectively”, suggesting that social background in those countries have less of an impact on educational outcomes than in the OECD generally. However, England is above the OECD average at 41 and Northern Ireland higher again at 45, indicating that educational success is more influenced by social background in Northern Ireland, thereby “tending to reproduce hierarchies”.6
As pointed out in the 2014 Peace Monitoring Report, “the most significant divisions are based on gender and class…Catholic middle-class girls enjoy remarkable educational success, while Protestant working class boys experience equally remarkable failure.”7
A range of evidence suggests that the social segregation which results from the division between grammar and non-grammar schools is to blame for the huge gap in attainment seen in the graph above. Protestant working class boys suffer particularly from this division. There is much evidence to suggest that all children – from the most academically able to those with learning disabilities – benefit from being educated in mixed-ability, socially-mixed schools.8
WHY DO POORER CHILDREN NOT DO SO WELL AT SCHOOL? There are a whole range of reasons why even the brightest poorer children do not do as well at school as children from better off backgrounds, including those with lesser ability. Government discourse and policies tend to focus on parenting issues in the early years’ home environment, on parental engagement in children’s education and on the aspirations of children and their families as the key to improving educational outcomes for poorer children. Undoubtedly, these are important facets which ought to be addressed. However, research with children and young people suggests that there are other factors, less commonly discussed at policy level, that need to be addressed if children and young people are to enjoy their school lives and to achieve more equitable outcomes.
WORRYING ABOUT MONEY Money is important – a fact that few like to talk about! Yet a range of research studies that have talked to children across different parts of the UK have shown that children from low income families are keenly aware of their family’s lack of money from quite an early age. Children and young people worry about worrying their

PAGE 100 CHILD POVERTY AND EDUCATION
parents by asking for even small amounts of money for school and there is evidence from a range of studies to show that this affects their ability to enjoy school and to concentrate on learning.9
That children are the experts when it comes to their own lives and experiences is demonstrated by their awareness of the importance of parental income to their education. This is not a view which is widely held within the policy community; but the belief is confirmed by an evidence review of the impact of income on children’s outcomes carried out by for the Joseph Rowntree Foundation.10 The evidence review found that income has “a positive and significant effect” on a range of children’s outcomes. The strongest evidence for a causal association between income and child outcomes “relates to cognitive development and school achievement, followed by social and behavioural development... With regard to intermediate outcomes, the strongest evidence relates to maternal mental health, where all four relevant studies identify a positive income effect, followed by parenting and the home learning environment.”11 So, not only is school achievement related to income, but so are issues known to impact on educational outcomes, such as maternal mental health, parenting and the home learning environment.
The Child Poverty Action Group, together with the British Youth Council, Kidsclub and NUT carried out a survey and focus groups with 400 young people across the income spectrum and asked them about the cost of going to school and what it means for their education. The findings confirm those of smaller scale qualitative research12 carried out in Northern Ireland and across the UK.
The survey found that many young people went hungry during the school day: one in four. 25% of students on Free School Meals (FSM); more than half of low-income students; and more than one in ten of the students who did not identify as low-income (described from here as “better-off”) said that they were going hungry and unable to concentrate at school because they could not afford to eat. Not having a full school uniform was described as embarrassing and “trampish” by students; it also got them into trouble with teachers. More than one in three students on FSM and one in four low income students said that cost prevented them from having a full school uniform.
PAGE 101 CHILD POVERTY AND EDUCATION
More than half (57%) of low-income students and more than a quarter (28%) of “better off” students said they missed school trips because they were too expensive. The young people knew that there were subject related consequences of missing school trips but it was the social and relationship-building aspect of trips and residentials that they missed most. For young people from low income families, it exacerbated their feeling of social exclusion within school.
It made me feel poor and that I was alone, not being able to participate in school activities really gave me a negative look on school life which made me less likely to participate in lessons and made me feel alone. At the same time, I felt that the school did not help my family in trying to cover the costs or providing subsidies for lower income families. – Young person from a low-income household.13
Some young people – around one in five young people on FSM and a similar proportion of “better-off” young people and 12 per cent of young people from low-income families reported being unable to participate in after school clubs and extra-curricular activities due to either the cost of the activity itself or the cost of transport to it.
Most young people reported not having all the books and equipment needed for their studies, with those in receipt of FSM (21%) being most likely to say they could not afford them. Some subjects, especially ‘creative subjects’ (art, design and technology, photography) require extra materials and therefore cost more to study. For example, photography requires purchasing camera film and covering the costs of printing. Students on free school meals (27%) were most likely not to study arts or music because of the related costs, but one in seven low-income students; and 8 per cent of better-off students ‘chose’ not to study one of these because of the cost.
Almost all the students who participated in the study had access to a computer at home that was connected to the internet. But a significant minority of young people receiving FSM (8%) did not; for them, this meant they spent “hours at school or travelling to libraries, because teachers expected homework to be printed or on USB sticks.”14
PAGE 102 CHILD POVERTY AND EDUCATION
TEACHERS UNDER PRESSURE Any explanation of the link between child poverty and education has to take into account the social, economic and educational context in which schools are situated. Child poverty in Northern Ireland is highly concentrated and there is considerable evidence of a link between areas with high levels of deprivation and lower levels of educational attainment. Further, those areas with the highest proportions of young people with no qualifications tend to have the fewest teachers available. By contrast, those areas with a higher proportion of qualified young people tend to have many adults (around the age of these young people’s parents) with degree-level qualifications.15 While a strong relationship has been found between levels of deprivation and the ‘quality’ of schools in an area, studies do not always take account of progress made by pupils who start with high levels of disadvantage. Nor do such measures always value the work schools in disadvantaged areas have to do to promote children’s ‘welfare and spiritual, moral, social and cultural development’.16 And studies do not always take account of how much more time teachers in disadvantaged areas have to spend on welfare issues, discipline and engaging children and parents; they face more difficulty planning and financing out-of-school activities such as school trips; more time has to be spent ensuring that pupils have access to the equipment needed for music, sports and so on.17
These difficulties faced by teachers in disadvantaged schools go some way to explaining the considerable amount of evidence, for example from the Joseph Rowntree Foundation (JRF) Education and Poverty18 programme of research, that relationships with teachers and a perceived lack of respect from them impacts badly on the educational prospects of children and young people growing up in poverty.
Several qualitative studies in disadvantaged areas of Northern Ireland found that most of the young people complained that teachers did not show them any respect and that they ‘picked on’ young people who were having difficulties in keeping up with their work. Many of the young people complained that some of the teachers did little to make learning easy; boys were considerably more likely than girls to complain about how they are treated by teachers; and there was agreement among young people that the best teachers are less likely to be harsh or have favourites.19
PAGE 103 CHILD POVERTY AND EDUCATION
A study about why young people aged 16 and 17 are not in education, training or employment (NEET), carried out by the National Foundation for Educational Research found a range of reasons for young people’s disengagement. However, it said that the NEET young people’s experience of school was generally negative and that “young people’s experience of teachers, and the perceived lack of respect from teaching staff, impacted on their attitudes towards engaging in further learning” (NFER, 2009, p.60). The young people interviewed in the NFER study were frustrated with teaching and learning methods which they had found boring and not practical enough.
ON EDUCATION:
IT IS GOING TO CHANGE FOR THE
NEXT GENERATION, BECAUSE OF THE FEES AND STUDENT LOANS AND
ALL THAT SORT OF STUFF… WHEN I CAME OUT OF COLLEGE
I WASN’T TWENTY OR THIRTY THOUSAND IN DEBT.
Data collected by the Young Life and Times Survey (an Annual survey of 16 year olds in NI (www.ark.ac.uk/ylt) shows that over two thirds of respondents reported positive school experiences. However, 12% of 16 year olds did not feel happy at school, while 16% felt that most teachers did not respect them as an individual and 17% felt they themselves had under-achieved. Young people from less well-off families reported significantly worse school experiences than those from well-off families. They were overall less happy at school, and were more likely to feel not respected as an individual by most teachers in their school.
PAGE 104 CHILD POVERTY AND EDUCATION
Young people in the most disadvantaged parts of NI have also debated how relevant school is, especially to young people not of an academic bent. We know from cohort20 studies that low-attaining and low-engaged young people coming towards the end of Key Stage 3 are highly critical of the relevance of the curriculum to their lives.21 In both the qualitative and quantitative studies, young people were highly critical of teaching methods used. Harland and Moor, for example, noted that young people from schools with high levels of Free School Meals had started Key Stage 3 with great enthusiasm and had been far more likely than young people in schools with low levels of FSMs to say they enjoyed school. All the young people found school less enjoyable as they moved through the three years of KS3 but young people in schools with a higher rate of FSMs “showed a greater decrease in enjoyment through Key Stage 3, suggesting disengagement could be a more deeply felt experience, particularly in the key areas of numeracy and literacy”.22
Among young people who participated in qualitative research in the most deprived parts of NI, there was a widespread view that teachers needed to make learning more fun and the ‘boring’ teaching methods at school were contrasted unfavourably with the youth work methods of the informal education that many of them enjoyed. This was particularly true in relation to the young people who had been failed by the education system and who, at age 15-16 had literacy problems. These young people were most likely to say that “some teachers just don’t teach” and leave the students floundering.23
The success of Alternative Education Projects (AEPs) in re-engaging young people who have been suspended, expelled or dropped out of school is generally partly explained by the quality of relationships between staff and young people. For example, a DfES commissioned evaluation of AEPs found that the young people attending the projects evaluated “highlighted positive staff-student relationships, being treated like adults, having a sense of equality with staff, being treated with respect and receiving more time and attention from staff.”24
CONCLUSION There are a range of policies from OFMDFM, DENI, DEL, DHSSPS and DSD that aim to contribute to a reduction in the attainment gap. These focus on the Early Years, on supporting families at particular risk and on improving literacy and numeracy. However, as has been argued in this chapter, at the root of much

PAGE 105 CHILD POVERTY AND EDUCATION
educational under-achievement is poverty itself – and difficulties in involving parents or quality of schools result from poverty, not the other way around. Indeed, Cooper and Stewart (2013) concluded that “Protecting households from low income is unlikely to provide a complete solution to less well-off children’s worse outcomes, but ought to be a central part of Government efforts to promote children’s opportunities and life chances. The impact of increases in income on cognitive outcomes appears to be comparable with the effects identified for spending on early childhood programmes or education. However, income influences many different outcomes at the same time, including maternal mental health and children’s anxiety levels and behaviour. Few other policies are likely to affect such a range of outcomes at once.”
The revised funding formula for schools, aimed at supporting better outcomes for the most disadvantaged children has caused much controversy. The suggestion has been made that additional money to schools can be used on all kinds of things, from repairs to replacing old equipment and not benefit individual children. But it should be possible to allocate such additional funding to the child, not the school – that the money be clearly earmarked to ensure that the child has a “free school day”, with all school expenses from uniform to books and materials, to school trips covered by the additional funding. This would have the effect of greatly lowering anxiety levels among both children and parents, thereby improving children’s experience of school.
Improving the experience of school must include making it more child-centred and increasing the participation of children and young people in their own education. Moves to increase the amount of school-based youth work are welcome in this regard as a way of eliciting the views of children and young people. But there is a wealth of evidence, from cohort to qualitative studies which tell us what young people think about the education system. We need to start listening to what they say and make the curriculum fit for purpose; while there has been a start to this in relation to curriculum development, children and young people are still not included in this development. Within schools, children should be shown the same respect that adults demand of them. This means providing teachers in the most disadvantaged areas with more support in dealing with the welfare issues of their pupils and it means ensuring that the best teachers are not in schools in the better
PAGE 106 CHILD POVERTY AND EDUCATION
off areas but are available also to the least well off. The recently published JRF report A UK Without Poverty suggests that “Rather than investing in school structures, redirect funding into raising teaching quality and incentivising the best teachers to work in the most deprived schools.25 Finally, too much of the cost of education in Northern Ireland goes into maintaining a segregated system – segregated on lines of religion, social class and gender. Evidence from across the world is clear that mixed-ability schools with a good social mix provide the best educational outcomes. Our children deserve no less.
1 Child Poverty Action Group (CPAG), Poverty: the facts, 2002, p. 138 2 CBI, First Steps: A new approach for our schools, CBI, London, 2012 3 Save the Children, Too Young To Fail: Closing the Educational Achievement Gap in Northern Ireland, Belfast: Save the Children, 2013 4 Financial Times, ‘The Education Gap Between the Regions’, 2014, http://www.ft.com/cms/s/0/f6ae0b84-adf6-11e3-bc07-00144feab7de.html#axzz3ClCYzOsD accessed 14 October 2014 5 P Nolan, Northern Ireland Peace Monitoring Report, Community Relations Council, 2014, p. 92 6 see note 5, p. 93 7 see note 5, p. 91 8 R Cassen and G Kingdon, Tackling Low Educational Achievement, Joseph Rowntree Foundation (JRF)/LSE, 2007 9 G Horgan, The Impact of Poverty on Young Children’s Experience of School, JRF, York, 2007; Ridge, Living with poverty: A review of the literature on children’s and families’ experiences of poverty, DWP Research Report, No 594, 2009 10 Cooper and Stewart, Does Money Affect Children’s Outcomes? A Systematic Review, JRF, York, 2013 11 see note 10, p. 28 12 See for example, Ridge, Childhood poverty and social exclusion: From a child’s perspective, Bristol: Policy Press, 2002; G Horgan, The Impact of Poverty on Young Children’s Experience of School, JRF, York, 2007; G Horgan, Speaking Out Against Poverty: voices of children living in disadvantaged areas, University of Ulster, Save The Children, Belfast, 2009 13 Farthing, The Costs of Going to School from Young People’s Perspectives, CPAG, BYC, Kid’s Company and NUT, London, 2014, p.18 14 see note 13, p. 24 15 B Wheeler with M Shaw, R Mitchell, and D Dorling, The Relationship between Poverty, Affluence and Area, Findings Ref. 0425, York: JRF, 2005
PAGE 107 CHILD POVERTY AND EDUCATION
16 R Lupton, ‘Social justice and school improvement: improving the quality of schooling in the poorest neighbourhoods’, British Educational Research Journal, 31, 5, 2005, p. 590 17 M Thrupp, Schools Making a Difference, Let’s Be Realistic!, Buckingham: Open University Press, 1999 18 Hirsch, Experiences of poverty and educational disadvantage, JRF, York, 2007 19 G Horgan, “The Making of an Outsider: Growing up in poverty in Northern Ireland”, Youth & Society, 43, 2010, pp 453-467 20 A group of young people born in the same year or period is referred to as a ‘cohort’. 21 J Harland and H Moor, Experiencing the Curriculum: The Learner’s Perspective – An Overview Of The Findings From The Northern Ireland Curriculum Cohort Study: Key Stage 3 Phase, Paper presented at the British Educational Research Association Conference, University of Leeds, 13-15 September 2001 22 see note 21, p. 3 23 see note 19 24 Kendall et al, An Evaluation of Alternative Education Initiatives, DFES Research Report 403, 2003, p.137 25 JRF, A UK Without Poverty, JRF, York, 2014

PAGE 109
____________________________________________
CHAPTER EIGHT
CHILD POVERTY, ADVICE SERVICES,
FOOD BANKS AND DEBT
Kevin Higgins, Advice NI and Ellen Finlay, Children in Northern Ireland
____________________________________________
INTRODUCTION Many families are struggling to cope with the high cost of rising energy bills, food and the burden of unmanageable debt. A report by Save the Children1 looked at 5,000 families with incomes of up to £30,000 a year and found that to ensure their children get enough food to eat, nearly two-thirds of parents skip meals, go into debt, avoid paying bills and put off replacing worn-out clothing. These findings illustrate how low income families are dealing with the effects of increasing poverty and inequality since the UK entered recession in 2008.
ADVICE SERVICES Families in Northern Ireland face significant difficulties and hardship as a result of the Coalition Government’s cuts to Northern Ireland departmental spend and the potential impact of proposals contained within the Welfare Reform Bill. There are other risk factors which will also impact on and ‘squeeze’ households across Northern Ireland still further. These include the threat of higher interest rates, increasing grocery bills, household goods, home heating bills, petrol, transport costs, mortgages, credit card and personal loan commitments.

PAGE 110 CHILD POVERTY, ADVICE SERVICES, FOOD BANKS AND DEBT
Demand from families for advice services has increased dramatically over the last number of years.2 Last year, over a 12 month period, over 150,000 people were offered advice from Advice NI on an extensive range of matters including social security (58%), housing (18%) and debt (11%).3 Debt Action NI, a service aimed at helping those most financially vulnerable in Northern Ireland, helped over 5,000 people deal with over £62 million in debt. During this period over half (55%) of clients had no savings, and one in ten (10%) presented with a deficit budget which meant their income was not lasting until their next payday. Many clients were facing severe hardship, relying on further credit to pay for essentials.4 The impact of independent advice services to families during these times cannot be overestimated.
FOOD POVERTY While a recent report by PriceWaterhouseCoopers5 suggests the Northern Ireland economy is starting to grow, a combination of wage repression over the last number of years combined with the rise in living costs has led to a situation in which families cannot often afford to buy the things they need to survive. This has led to a greater demand on food banks.
In December 2013, Advice NI launched a social policy report Turning the Tide: The Growth of Food Banks in Northern Ireland.6 The report highlighted that an estimated half a million people in the UK are dependent on food banks. This rise was linked to unemployment, falling income and increases in the price of food and fuel. Moreover, the report noted that the most common reason for families requesting help from food banks was benefit cuts and delays with payments. The report also suggested that the failure of the National Minimum Wage and benefit levels to keep pace with inflation added to the strain on low income families.
While it is difficult to calculate the exact number of organisations which are engaged in distributing emergency food within Northern Ireland, the report7 suggests there are currently 14 official food banks with many more small-scale projects operating as and when required.
Nine of the food banks in Northern Ireland are linked to the Trussell Trust, an organisation which helped set up approximately 374 food banks across the UK to date. Evidence8 from the Trussell Trust has suggested there has been a sharp rise in

PAGE 111 CHILD POVERTY, ADVICE SERVICES, FOOD BANKS AND DEBT
the use of food banks linked to the welfare reform changes introduced in England and Wales including the abolition of the discretionary social fund, which has left many local authorities unsure where to refer clients to in a crisis situation.
A further trend is the significant number of families beginning to use food banks as a result of sanctions imposed on them with the introduction of welfare reform. Unsurprisingly, the imposition of sanctions on families has resulted in many being left with no financial support whatsoever. This has facilitated a trend in which many more families are turning to food banks for help. Chris Mould, Chairperson of the Trussell Trust commented: “In the last year we’ve seen things get worse, rather than better, for many people on low-incomes. It’s been extremely tough for a lot of people, with parents not eating properly in order to feed their children.”9
The evidence from Great Britain (GB) does not bode well for Northern Ireland, considering economic recovery here lags behind GB and the full impact of the anticipated welfare reform changes are yet to be felt. A Joseph Rowntree Foundation (JRF) report10 has highlighted that the move from Disability Living Allowance to Personal Independence Payment and the increased requirement on people with disabilities to seek work will have a greater impact on Northern Ireland than the rest of UK, due to the larger proportion of people with disabilities. In addition, recent research commissioned by the Northern Ireland Council for Voluntary Action (NICVA)11 found that the full impact of welfare reform will remove £750m a year from the Northern Ireland economy and this financial loss per adult is significantly more than in any other part of the UK. This was found to be £650 for every adult of working age in Northern Ireland, compared to the GB equivalent of £470.
The overall picture of food poverty in Northern Ireland is shocking. Society’s poorest and most vulnerable families and children are going hungry. In the Turning the Tide Report12, Advice NI recommends that a longitudinal research study should be carried out to ascertain why people in Northern Ireland find themselves without sufficient food to feed themselves or their children. A co-ordinated effort is required to ‘join-up’ statutory and voluntary sector services with food bank services to ensure that people who find themselves in immediate need of food have access to all available help. The report also identifies the need to identify and address the
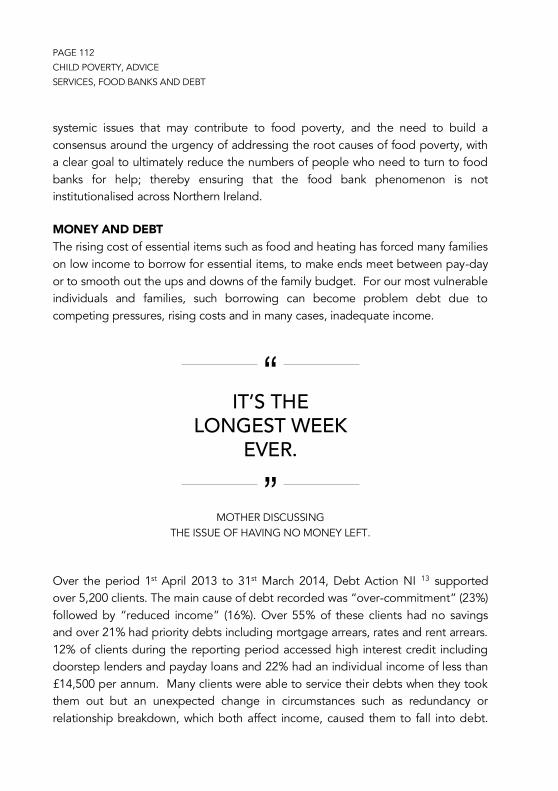
PAGE 112 CHILD POVERTY, ADVICE SERVICES, FOOD BANKS AND DEBT
systemic issues that may contribute to food poverty, and the need to build a consensus around the urgency of addressing the root causes of food poverty, with a clear goal to ultimately reduce the numbers of people who need to turn to food banks for help; thereby ensuring that the food bank phenomenon is not institutionalised across Northern Ireland.
MONEY AND DEBT The rising cost of essential items such as food and heating has forced many families on low income to borrow for essential items, to make ends meet between pay-day or to smooth out the ups and downs of the family budget. For our most vulnerable individuals and families, such borrowing can become problem debt due to competing pressures, rising costs and in many cases, inadequate income.
IT’S THE
LONGEST WEEK EVER.
MOTHER DISCUSSING
THE ISSUE OF HAVING NO MONEY LEFT.
Over the period 1st April 2013 to 31st March 2014, Debt Action NI 13 supported over 5,200 clients. The main cause of debt recorded was “over-commitment” (23%) followed by “reduced income” (16%). Over 55% of these clients had no savings and over 21% had priority debts including mortgage arrears, rates and rent arrears. 12% of clients during the reporting period accessed high interest credit including doorstep lenders and payday loans and 22% had an individual income of less than £14,500 per annum. Many clients were able to service their debts when they took them out but an unexpected change in circumstances such as redundancy or relationship breakdown, which both affect income, caused them to fall into debt.
PAGE 113 CHILD POVERTY, ADVICE SERVICES, FOOD BANKS AND DEBT
This has resulted in many families suffering further under the weight of increasing debt, high prices and poverty.
The impact of debt on families can have a serious downward pressure on their quality of life including marriage and relationship break-up and mental health problems. A report by The Children’s Society14 noted that two and a half million children live in families with problem debt, with a further five million children in families that are struggling to keep up with repayments and at risk of falling behind. This debt affects children’s lives in many ways, including bullying at school, children constantly worrying about the family financial situation, arguments in the household and children going without essentials such as food, clothing or heating.
It is evident that debt has come to form a central part of the economic survival strategies of those families locked in poverty, many of whom see no light at the end of the tunnel when faced with the impact of low wages, rising costs and cuts to welfare.
CONCLUSION Since 2010, we have witnessed a succession of cuts to government spending on social security. These changes have had a huge impact upon children and families with most cuts being targeted at the vulnerable. The harsh reality for families on low incomes today is low wages, rising household bills, food banks and debt. Assistance for these families and children is central to tackling these problems. Further changes are expected with the introduction of Universal Credit, which will most certainly intensify the problems facing many households. Access to affordable credit opportunities would give families viable alternatives to risky, high-interest credit. There are many vulnerable, low-income families and households who will continue to need financial education and support as well as free, face-to-face advice – this will require the necessary investment from government.
PAGE 114 CHILD POVERTY, ADVICE SERVICES, FOOD BANKS AND DEBT
1 G Whitham, Ending Child Poverty: Ensuring Universal Credit Supports Working Mums, Save the Children UK, 2012, http://www.savethechildren.org.uk/sites/default/files/docs/Ending-Child-Poverty.pdf, accessed 13 October 2014 2 Northern Ireland Advice Services Consortium, Why Advice Matters: Welfare Reform and the Value of Independent Advice, 2013, http://www.adviceni.net/userfiles/file/Why%20advice%20matters.pdf, accessed 13 October 2014 3 Advice NI, Annual Report 2012-2013, http://www.adviceni.net/publications/PDF/Annual%20Report%20and%20Membership%20Report.pdf, accessed 13 October 2014 4 Debt NI, Impact Report, http://www.debtaction-ni.net/sites/default/files/resources/FINAL%20Debt%20Action%20NI%20impact%20report%202012-13.pdf, accessed 13 October 2014 5 Price Waterhouse Coopers, Northern Ireland Economic Outlook, 2014, http://pwc.blogs.com/files/nieo-september_2014-final.pdf, accessed 13 October 2014 6 Advice NI, Turning the Tide: The Growth of Food Banks in Northern Ireland, 2013, http://www.adviceni.net/publications/PDF/AdviceNI%20Policy%20paper.pdf, accessed 13 October 2014 7 see note 6. 8 Trussell Trust, Latest Foodbank Figures Top 900,000: Life has Got Worse, Not Better, for Poorest in 2013/14, and This is Just the Tip of the Iceberg, July 2014, http://www.trusselltrust.org/foodbank-figures-top-900000, accessed 13 October 2014 9 see note 8. 10 H Aldridge et al, Monitoring Poverty and Social Exclusion in Northern Ireland, Joseph Rowntree Foundation, 2012, http://www.jrf.org.uk/sites/files/jrf/poverty-northern-ireland-social-exclusion-2012-full.pdf, accessed 13 October 2014 11 C Beatty and S Fothergill, The Impact of Welfare Reform in Northern Ireland, Sheffield Hallam University, 2013, http://www.nicva.org/resource/impact-welfare-reform-northern-ireland, accessed 13 October 2014 12 see note 6. 13 see note 4. 14 The Children’s Society, The Debt Trap: Exposing the Impact of Problem Debt on Children, 2014, http://www.childrenssociety.org.uk/sites/default/files/debt_trap_report_may_2014.pdf, accessed 13 October 2014
PAGE 115
____________________________________________
CHAPTER NINE
REFLECTIONS
Anne Moore and Paddy Hillyard
____________________________________________
The aim of this chapter is to reflect on the learning and insight from previous chapters and to begin a conversation about what needs to done to eliminate child poverty in Northern Ireland. All the evidence suggests that child poverty levels will reach shocking levels by 2020. A range of options is suggested to increase the resources or reduce the outgoings of poor families with children and to promote the wellbeing of all children.
The views expressed are personal and do not represent the views of either the Child Poverty Alliance or any particular organisation within it. They could form, however, the basis for a wider discussion among key stakeholders, policy makers, and children in poor families over the coming months.
There is no doubt that the evidence from the eight contributors presents a bleak picture about the state of child poverty in Northern Ireland. If trends continue as forecast, all the evidence suggests that child poverty, income inequality and social mobility will get worse unless there is targeted intervention. The Institute for Fiscal Studies (IFS) forecasts that one in three children will be living below the poverty line by 2020, and economic modelling commissioned by Save the Children predicts that relative child poverty levels will increase to 38% (AHC) by 2020.1 This may not even represent the full picture because the disability sector argues that counting disability benefits as income masks the true extent of child poverty.
PAGE 116 REFLECTIONS
The report illustrates the harsh reality of inadequate incomes that are forcing families into debt and an increased reliance on food banks. Save the Children has long highlighted the fact that it costs more to be poor because low income families often pay a ‘poverty premium’ or additional costs for basic necessities, such as energy, insurance and household goods, amounting to over £1700 each year.
This is the situation today following a whole range of policy initiatives over the past twenty plus years since Targeting Social Need and ratification of the United Nations Convention on the Rights of the Child (UNCRC). In 1999, the then Prime Minister Tony Blair made a commitment to halve child poverty by 2010, and eliminate child poverty by 2020. In 2007 David Cameron committed his party to dealing with child poverty. In 2010 this cross party consensus led to the passing of the Child Poverty Act which lays down clear targets for the elimination of child poverty by 2020.
In 2006 OFMDFM published Lifetime Opportunities2 with a clear commitment to end child poverty in Northern Ireland by 2020 and lifting 65,000 children out of poverty by 2010. It also laid down a whole series of other goals for children and young people to be achieved by 2020 covering education, health, disability, housing and the environment. It was a progressive and comprehensive document but the goals were not defined in terms of clear targets, the strategy was not costed and the responsibilities for delivering the strategy were diffuse.
Lifetime Opportunities was subsequently replaced by a new strategy in 2011 entitled Improving Children’s Life Chances: The Child Poverty Strategy.3 It set out the actions proposed by the Executive between 2011 and 2014 to fulfil its obligations under the Child Poverty Act 2010. The strategy was changed again when it was subsumed under a new programme called Delivering Social Change. The aim of this programme was to “deliver a sustained reduction in poverty and associated issues across all ages; and to improve children and young people’s health, wellbeing and life opportunities thereby breaking the long term cycle of multi-generational problems” (italics added). 4 The new programme was to be outcome-based with an enhanced delivery on a cross-departmental and cross-agency basis.
In January 2014 it was proposed to change the child poverty strategy for the fourth occasion. A consultation on the new strategy was published with the long and
PAGE 117 REFLECTIONS
confusing title: Delivering Social Change for Children and Young People: Consultation Document: Child Poverty.5 The document attempted to do five very different things: to consult on the new child poverty strategy; to deliver on the Northern Ireland Executive’s current child poverty strategy; to provide an annual report as required under the Child Poverty Act; to take forward the Children’s and Young People’s Strategy; and to deliver on its obligations under the UNCRC.
ON POLITICS:
I THINK THEY [POLITICIANS]
BROUGHT THE FLAGS STUFF ABOUT RIGHT NOW BECAUSE ALL THESE BENEFITS CUTS ARE COMING IN
AND THEY HOPED THAT EVERYBODY WOULD FOCUS ON THAT
AND NOBODY WOULD SEE THE OTHER BIG ISSUES.
The most progressive change in the new strategy was the integration of the Child Poverty Outcomes Framework,6 which had been developed by the National Children’s Bureau and the Centre for Excellence and Outcomes. This sets out a number of actions with clearly stated outcomes and indicators that can be monitored annually. In addition, it develops a framework to support a cross-departmental approach to reduce child poverty. As a result of consultation feedback, the decision was made to separate the child rights and child poverty elements. A draft child poverty strategy 2014-17 is now in preparation.
PAGE 118 REFLECTIONS
Despite all these changes in the child poverty strategy, Northern Ireland still does not have a comprehensive, coherent, costed and integrated strategy to eliminate child poverty. The Northern Ireland Executive has introduced numerous policies which will certainly help the most deprived families but they will not necessarily eliminate child poverty. The key is to increase the resources or reduce the outgoings of poor families with children. This may involve the Northern Ireland Executive using the limited tax raising powers available to it and redistributing the existing £10 billion budget away from the better-off to the poor.
Against this backdrop, some Departments have attempted to develop new policies to tackle poverty. The Department of Agriculture and Rural Development (DARD), for example, created a £13 million programme to tackle rural poverty and social isolation which included visits to thousands of rural households to encourage uptake of benefits and small grants to encourage rural groups to tackle poverty and social isolation.
Moving forward, how can we galvanise dialogue and hold the government in Northern Ireland to account for its commitments – remember it promised to end child poverty in six years’ time by 2020? Many in Northern Ireland were excited by the passionate debates during the Scottish referendum campaign which showed an appetite for a new kind of society and economy that will protect the most vulnerable and the environment.
The starting point could be the proposed UK-wide devolution settlement with its discussion about devolving fiscal powers of tax, spending and benefits. We know that the Northern Ireland Executive can only meet its legally-binding targets and provide the services outlined in the Child Poverty Act if it can generate extra resources by raising taxes on income and wealth or by sharing existing resources more progressively. We should treat the discussion seriously as an opportunity to mirror the energy of the Scottish referendum debate, to engender a passionate debate about a costed strategy to increase the resources of low income families, reduce their outgoings and agree the policies necessary to pay for them.
The on-going reform of local government could also offer an opportunity for progressive thinking beyond the silo approach. Combined with the proposed statutory duty for government departments to cooperate and proposed children’s
PAGE 119 REFLECTIONS
budgeting, the forthcoming community planning could complement the Children and Young People’s Strategic Partnership’s child-centred focus. The participation of low income children and their families would provide a chance to contribute to local plans for infrastructure investment, job creation, skills development, family and financial support, education, childcare, play and leisure, health, housing and neighbourhoods, as outlined in the child poverty legislation.
Proposals such as extending the vote to 16 year olds, participatory budgeting and young people’s involvement in local planning could also encourage more engagement with politics, higher turnouts like the Scottish example, a stronger democracy and more progressive ideas, commensurate with the scale of the challenge of ending child poverty. These could include influencing to replace the old structures of political parties and manifestos with constituents’ playlists of proposals and selection of those candidates best able to demonstrate ideas for effective implementation.
The ‘Beneath the Surface’ report represents an opportunity for all political parties to re-focus on the duty to end child poverty and for the Northern Ireland Executive, key stakeholders and low income families and children to start discussions about key proposals and the best way forward.
SOME OPTIONS FOR FURTHER DISCUSSION
All the evidence suggests that child poverty levels will reach shocking levels by 2020. The CPA proposes to host a series of public events and roundtables with the participation of the expert authors and key stakeholders over the coming months. They will explore the report findings and discuss a range of options to increase the resources or reduce the outgoings of poor families with children and to promote the wellbeing of all children. We envisage some of the following topics.
PAGE 120 REFLECTIONS
1. THE MERITS OF A COSTED CHILD POVERTY STRATEGY
Measures to increase resources could include inter alia a minimum income guarantee for families of young children, support for a living wage, regulation of zero hour contracts.
Measures to increase resources, and tackle the disproportionate impact of fuel poverty on low income families, could include inter alia job creation schemes to produce zero carbon social housing, retrofitting insulation, other energy efficiency measures to all houses inhabited by poor children.
Measures to reduce outgoings could include inter alia universal affordable childcare, a free school day, access to affordable credit and free advice.
Measures to promote the well-being of children could include inter alia an increase in the unit of resource to primary school children, elimination of the educational attainment gap, specialist support services, such as Sure Start, programmes that help parents support their children’s learning, a childcare strategy that links quality childcare and early learning (educare).
Options to pay for these could include using the limited fiscal powers available to the Northern Ireland Executive to support low income families, such as consideration of a fairer rating system, fair water and prescription charges, a fairer ratio between the highest and lowest paid in the public sector and targeting EU Structural Funds at ending child poverty.
2. THE ROLE OF A HUMAN RIGHTS APPROACH TO ENDING CHILD POVERTY
The Executive’s current obligations under human rights treaties, including the UN Convention on the Rights of the Child (UNCRC) and the International Covenant on Economic, Social and Cultural Rights (ICESCR), are often seen as aspirational. How could their incorporation in robust child rights legislation realise the best interests of the child and the child’s right to an adequate standard of living and the right to social security?
The proposed Delivering Social Change for Children and Young People strategy in January 2014 made a welcome commitment to a children’s budgeting pilot. How could this be developed to help the Executive meet
PAGE 121 REFLECTIONS
its obligation to devote the maximum available resources to fulfil children’s economic, social and cultural rights?
The rights framework with its emphasis on human dignity, non-discrimination and equality could help challenge the rhetoric of the undeserving poor and placement of blame on individuals, and emphasise the structural causes of poverty, such as the lack of investment and jobs in particular areas.
The rights framework could help discussion about the merits of a more equal society and economy to protect the most vulnerable children and the environment.
3. WAYS TO IMPROVE THE MEASUREMENT, UNDERSTANDING AND THE DISSEMINATION OF INFORMATION ON CHILD POVERTY
Official statistics on child poverty are complex and confusing. More clarification could be provided to inform crucial audiences, ranging from MLAs to low income families, on the statistics and different methodologies.
There is a little information available on the costs of current policies and programmes. More could be done to provide detailed information on the web so the public can better understand the current distribution of public expenditure.
Better measurement of child poverty could involve discussion about the merits of the following:
i. including the consensual poverty measure of child poverty annually to complement existing statutory measures.
ii. defining the persistent poverty threshold and publishing a report on the levels of persistent child poverty.
iii. ensuring robust measures to capture the cost of disability. iv. improving measures of the links between the experience of the
conflict, the socialisation of children and the impact on child poverty levels.
PAGE 122 REFLECTIONS
4. HOW TO GARNER EXPERTISE, SHARE BEST PRACTICE & IMPROVE DELIVERY
The appointment of representation from Northern Ireland onto the Commission on Social Mobility and Child Poverty so that Northern Ireland is represented along with the other UK countries.
Establish a body similar to the Scottish ministerial advisory group on child poverty which provides ministers with advice on priorities and actions for ending child poverty and advice on related strategies that deal with inequalities.
A statutory duty to co-operate will support partnership approaches at local and regional level, promote integrated and co-ordinated policy making and delivery and participation of low income households.
OFMDFM ministerial leadership to drive forward all departments’ child poverty commitments will encourage the political will to end child poverty by 2020.
1 Save the Children, A Fair Start for Every Child: NI Executive Summary, Belfast: Save the Children, 2014, p 5 2 Office of the First Minister and deputy First Minister (OFMDFM), Lifetime Opportunities: Government's Anti-Poverty and Social Inclusion Strategy for Northern Ireland, Belfast, 2006, http://www.ofmdfmni.gov.uk/antipovertyandsocialinclusion.pdf accessed 15 October 2014 3 OFMDFM, Improving Children’s Life Chances: The Child Poverty Strategy, 2011, http://www.ofmdfmni.gov.uk/final_child_poverty_strategy_-_agreed_by_executive_-_22_march_2011.pdf accessed 15 October 2014 4 See http://www.ofmdfmni.gov.uk/index/delivering-social-change/delivering-social-change-introduction.htm accessed 20 October 2014 5 OFMDFM, Delivering Social Change for Children and Young People - Consultation Document, 2014, http://www.ofmdfmni.gov.uk/dsc-children-young-people-consultation-2014.pdf accessed 15 October 2014 6 National Children’s Bureau Northern Ireland, Child Poverty Outcomes Framework, Belfast: NCB Northern Ireland, 2013, http://www.ncb.org.uk/media/1076520/child-poverty-outcomes-framework-september-2013.pdf accessed 15 October 2014

The Child Poverty Alliance (CPA) is co-chaired by Save the Children NI and Children in Northern Ireland. The CPA came into being in 2008 as a loose alliance of organisations to raise awareness of child poverty within Northern Ireland. We are an inclusive coalition committed to campaigning for an end to child poverty by working collaboratively with an evidence-based approach.
The CPA has been constructive, pragmatic and solution focused based on the evidence of what will work. We have engaged directly with Government and elected representatives seeking to inform public policy and hold Government accountable for tackling child poverty. We continue to publically advocate on behalf of families and children living in poverty so that policy makers will be more informed of the possible impact of their actions on children living in poverty.
Our Strategic Objectives
• Hold government to account for the application of its strategy and programmes to end child poverty in NI
• Reframe and inform public understanding of child poverty and gain support for measures to support families.
Children in Northern IrelandUnit 9 40 Montgomery RoadBelfastBT6 9HL T: 028 9040 129W: ci-ni.org.uk
Save the Children NIPopper House15 Richmond ParkBelfastBT10 0HBT: 028 9043 1123W: savethechildren.org.uk
For further information please contactthe Child Poverty Alliance c/o: