child and family poverty in saskatchewan: november 2017 · child and family poverty in...
TRANSCRIPT

Child and Family Poverty in
Saskatchewan: November 2017
Garson Hunter, Miguel Sanchez
Social Policy Research Centre
Faculty of Social Work
University of Regina
Regina, Saskatchewan, S4S 0A2
Authors:
Dr. Garson Hunter, Associate Professor, Faculty of Social Work, University of Regina.
Dr. Miguel Sanchez, Associate Professor, Faculty of Social Work, University of Regina.
Acknowledgements: We thank Campaign 2000 for providing data for this report.
Campaign 2000: Campaign 2000 is a non-partisan, cross-Canada coalition of over 120 national,
provincial and community organizations, committed to working together to end child and family poverty in
Canada. Campaign 2000 coordinated the preparation of the 2016 national and provincial poverty report
cards. These can be viewed and downloaded at the web site www.campaign2000.ca.
We encourage readers to download, distribute, photocopy, cite, or excerpt this document provided it is fully
credited and not used for commercial purposes. If you require further information please contact
[email protected] or 306-585-4848.
Suggested Citation: G. Hunter & M. Sanchez (2017). Child and Family Poverty in Saskatchewan:
November 2017. Regina: Social Policy Research Centre, University of Regina.
Data sources for this report. Data in this report come primarily from Statistics Canada, Annual Income
Estimates for Census Families and Individuals (T1 Family File, Final Estimates, 2015) Catalogue no. 72-
212=X2017001 released on July 12, 2017. The User’s Guide for this file states “The T1FF approximates the
total Canadian population” (p. 2). T1FF income data are available through the 2015 year.
Another source of data for this report comes from the Canadian 2016 Census Program. There is a discrepancy
between the T1 Family File and the Census Program File. The T1 Family File Low-Income Measure After-
Tax (LIM) is derived from the taxfile and the Census Data LIM is derived from the Census. The LIM
thresholds from the taxfile are arrayed by number of adults by number of children while the Census
file are organized by household size. Therefore the taxfile income cut-off is considerably less than
the cut-off for the Census. For example, the T1FF income cut-off for a family of 2 adults and 1 child
is $30,962 for the year 2015; the Census income cut-off for the same family would be $38,355.
The T1FF data has also been found to provide estimates below another major income survey in the Canada,
the cross-sectional Canadian Income Survey (CIS) which replaced the longitudinal Survey of Labour and
Income Dynamic (SLID). The median Census family income at the Canada level has been a few percentage
points below. “In 2014 there was a 4.6% difference in the median Census family income at the Canada level
between T1FF and the Canadian Income Survey (CIS)” (Statistics Canada, 13C0016, July 2016, 3).
The T1FF data are therefore a conservative estimate for poverty when compared to the Census
Program estimate or the CIS estimate.
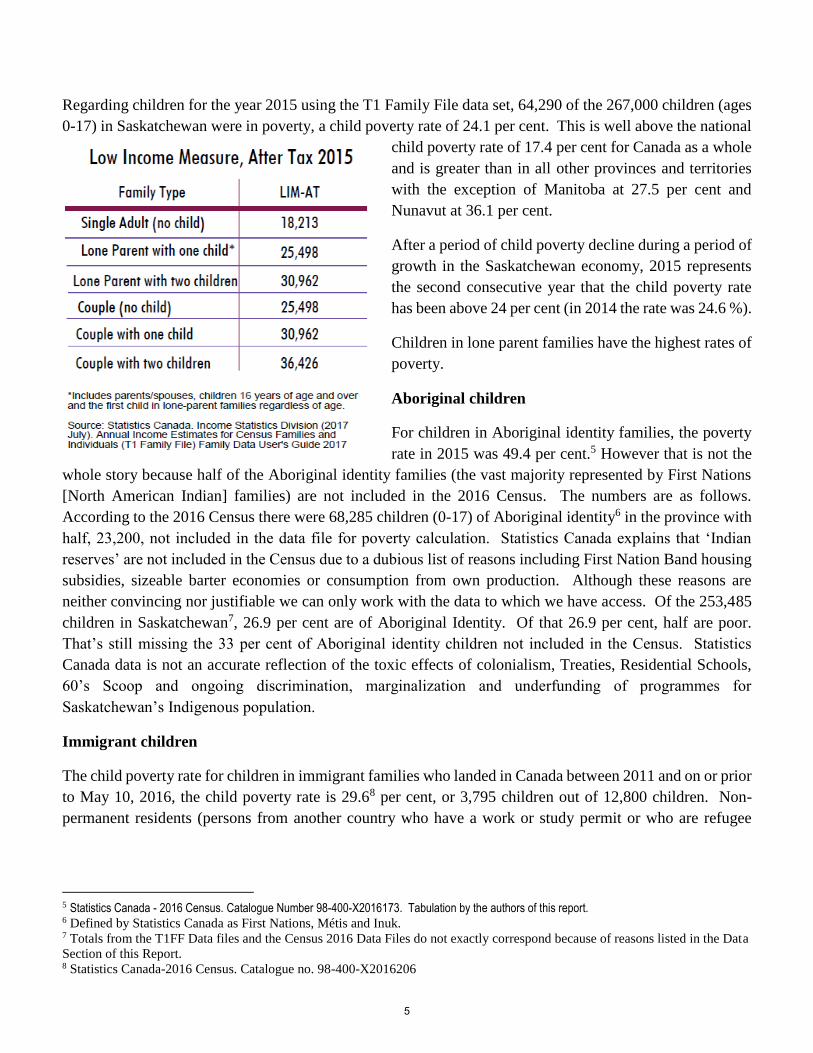
Poverty or low income measure. There is no official measure of poverty in Canada. In this report we use
the Low-Income Measure After-Tax or LIM. This measure of relative poverty uses a poverty level cutoff of
one half of the median income adjusted for each family size. Any person in a household with income less
than the LIM income levels shown in Table 1 is considered to be in poverty. While these LIM cutoffs are not
sensitive to differing regional costs, they provide a standard measure of low income or poverty, making it
possible to compare poverty across Canada and internationally.
2
Note on comparability with earlier reports: Data in this report are not always comparable
with those in earlier Social Policy Research Centre reports since survey data methods
utilized by Statistics Canada have changed.
Statistics Canada Catalogue no. 75-513-x advises users:
“As annual statistics on income are more informative when comparisons can be made over time by
December 2015 Statistics Canada will release a revised series of income statistics which will allow for
the comparison of 2012 and 2013 data to earlier years.
Until revised historical statistics are prepared and analysed to ensure that they are as comparable as possible to the current CIS results the results of the Canadian Income Survey should not be compared to those produced by the Survey of Labour and Income Dynamics or other previous income surveys.”
Did the promised revisions to previous data sets occur? In personal correspondence with Statistics Canada we received the following response. CIS refers to the current data sets, the Canadian Income
Survey; SLID was the previous Survey of Labour and Income Dynamics data sets which followed the previous SCF, the Survey of Labour and Income Dynamics:
“The CIS reports on many of the same statistics as the Survey of Labour and Income Dynamics (SLID), which last reported on income for the 2011 reference year. Prior to SLID, income data came from the Survey of Consumer Finances (SCF). The CIS uses a different methodology compared to that used in SLID. Data from the SLID were revised for the years 2006 to 2011 to allow CIS data to be compared with data for earlier years (Statistics Canada, 2015). However, SLID public use microdata files were not revised. As a result, it is not recommended to compare CIS results with those produced using the SLID PUMFs (Statistics Canada, 2014).” Emphasis in original.
Then, can we not make comparisons to poverty data produced before 2012? It’s important
for the reader to know there has been what some have referred to as a ‘war’ waged on
public data in Canada by the federal government. Interested readers can assess more on
this topic by consulting,
Kingston, Anne. Vanishing Canada: Why we’re all losers in Ottawa’s war on data. Macleans
Magazine, September 18, 2015. http://www.macleans.ca/news/canada/vanishing-canada-
why-were-all-losers-in-ottawas-war-on-data/
and especially,
Dismantling Democracy: Stifling debate and dissent in Canada. Montréal: Voices – Voix,
June 2015. http://voices-voix.ca/en/document/dismantling-democracy-stifling-debate-and-
dissent-canada
Although using a different methodology to gather the sample for the survey than previous methods and the current difficulties with weighting the sample data based upon government meddling with the long form census, the overall goal of creating parametric statistics remains the same. This stands whatever survey methodology was previously employed. The previous surveys were utilized with the goal of producing data representative of all of Canada and that has not changed with the CIS. While acknowledging that there would be deviations between the CIS data sets and the SLID and SCF data sets, these are not considered by this report authors to be large or greatly misleading. To consider them otherwise would be to question the accuracy of the previous surveys or the current survey in producing usable parametric data. This report does not rely on CIS data.
2
3
Once again this year there is a significant number of children living in poverty in Saskatchewan. We believe
is time to reflect and to recall that beginning in 2007 the province’s commodity-driven economy really begun
to flourish. The growing petroleum industry began to realize windfall profits from the rise in oil prices. The
demand for potash and grain had skyrocketed as well. The province experienced tremendous proceeds from
those resources. However, the volatility of fluctuating resource revenues eventually returned and in 2017 the
Saskatchewan Party experiences strong opposition to its decision to emphasise austerity. It is also important
to remember that during the period of unprecedented growth and profits, voices urging prudent allocation of
the revenues were expressed. Cautionary advice such as Selling the Family Silver: Oil and Gas Royalties,
Corporate Profits, and the Disregarded Public1 were published during this time and subsequently ignored.
As early as our November 2006 Report Card on Child Poverty in Saskatchewan, we wrote:
“How do we pay for increased expenditures for poverty programs? The provincial government expenditures
for public service and wealth redistribution as a proportion of its GDP was the third lowest of all ten provinces
during 2002/03, with only Alberta and Ontario having lower expenditures.2
The current high oil prices and
their windfall profits present the opportunity to share the prosperity with the poorest. Rather than following
the current trajectory of reducing royalty rates, the government of Saskatchewan could increase them with
the aim of bettering the lives of the poor. The time to do so is now, before an economic recession produces a
downturn in public revenues.”
During the period of growth the housing costs in both of Saskatchewan’s largest cities doubled. As a snapshot
of the times “Between 2007 and 2008, Saskatoon’s housing prices increased by 51.7%, the largest increase
in the country.” 3 The city of Regina experienced a rental vacancy rate of 0.8%4 during 2009-10.
The increase in the cost of basic needs place greater challenges to the lives of low income families with
children and will not be alleviated by the austerity approach taken by the provincial government.
Those who argue the necessity of austerity measures should be reminded that throughout a similar period of
windfall oil revenue profits the nation of Norway managed to build a trillion-dollar sovereign wealth fund
with its oil/gas revenues.
Child poverty in Saskatchewan
As mentioned in the introduction, the poverty line in this report is derived from the Statistics Canada, Annual
Income Estimates for Census Families and Individuals Final Estimates 2015 data file. LIM-AT is the low
income measure of one-half (50%) of the median income level after tax. The data is adjusted for differences
in family sizes. There is a simple calculation for adjusting family size; dividing family income by the square
root of the number of members in a family. Statistics Canada has applied a different method of assigning a
‘weight’ to different family members however the results would be quite similar. The results of these
calculations are presented in the chart below.
1 Warnock, John. Selling the Family Silver: Oil and Gas Royalties, Corporate Profits, and the Disregarded Public. Canadian
Centre for Policy Alternatives. November 2006. 2 E. Weir. (2004). Saskatchewan at a Crossroads: Fiscal Policy and Social Democratic Politics. Canadian Centre for Policy
Alternatives. <https://www.policyalternatives.ca/publications/reports/saskatchewan-crossroads > 3 Saskatoon Community Plan on Housing and Homelessness 2011-2014, Insightrix Research Inc. March 2011.4 Rental Market report. Canada Mortgage and Housing Corporation. Saskatchewan Highlights, Spring 2010
4
Regarding children for the year 2015 using the T1 Family File data set, 64,290 of the 267,000 children (ages
0-17) in Saskatchewan were in poverty, a child poverty rate of 24.1 per cent. This is well above the national
child poverty rate of 17.4 per cent for Canada as a whole
and is greater than in all other provinces and territories
with the exception of Manitoba at 27.5 per cent and
Nunavut at 36.1 per cent.
After a period of child poverty decline during a period of
growth in the Saskatchewan economy, 2015 represents
the second consecutive year that the child poverty rate
has been above 24 per cent (in 2014 the rate was 24.6 %).
Children in lone parent families have the highest rates of
poverty.
Aboriginal children
For children in Aboriginal identity families, the poverty
rate in 2015 was 49.4 per cent.5 However that is not the
whole story because half of the Aboriginal identity families (the vast majority represented by First Nations
[North American Indian] families) are not included in the 2016 Census. The numbers are as follows.
According to the 2016 Census there were 68,285 children (0-17) of Aboriginal identity6 in the province with
half, 23,200, not included in the data file for poverty calculation. Statistics Canada explains that ‘Indian
reserves’ are not included in the Census due to a dubious list of reasons including First Nation Band housing
subsidies, sizeable barter economies or consumption from own production. Although these reasons are
neither convincing nor justifiable we can only work with the data to which we have access. Of the 253,485
children in Saskatchewan7, 26.9 per cent are of Aboriginal Identity. Of that 26.9 per cent, half are poor.
That’s still missing the 33 per cent of Aboriginal identity children not included in the Census. Statistics
Canada data is not an accurate reflection of the toxic effects of colonialism, Treaties, Residential Schools,
60’s Scoop and ongoing discrimination, marginalization and underfunding of programmes for
Saskatchewan’s Indigenous population.
Immigrant children
The child poverty rate for children in immigrant families who landed in Canada between 2011 and on or prior
to May 10, 2016, the child poverty rate is 29.68 per cent, or 3,795 children out of 12,800 children. Non-
permanent residents (persons from another country who have a work or study permit or who are refugee
5 Statistics Canada - 2016 Census. Catalogue Number 98-400-X2016173. Tabulation by the authors of this report. 6 Defined by Statistics Canada as First Nations, Métis and Inuk. 7 Totals from the T1FF Data files and the Census 2016 Data Files do not exactly correspond because of reasons listed in the Data
Section of this Report. 8 Statistics Canada-2016 Census. Catalogue no. 98-400-X2016206
5
claimants, and their family members sharing the same permit and living in Canada with them) experience a
poverty rate of 40.9 per cent (690 children out of 1,685 children).
The provincial numbers are consistent with the national level of poverty (32%) experienced by children in
immigrant families who “are 13 times more likely to live in chronic low income than individual born in
Canada, or those who immigrated 21 years prior” (2017 Report on Child and Family Poverty in Canada.
Campaign 200, Family Service Toronto. p. 10).
Depth of poverty
Depth of poverty is an important indicator because in addition to the count of the number of poor, depth
conveys information about how far down the poverty lines the poor have fallen. As evidenced in the chart
below, the poor in Saskatchewan have a very large gap to overcome to even reach the poverty line.
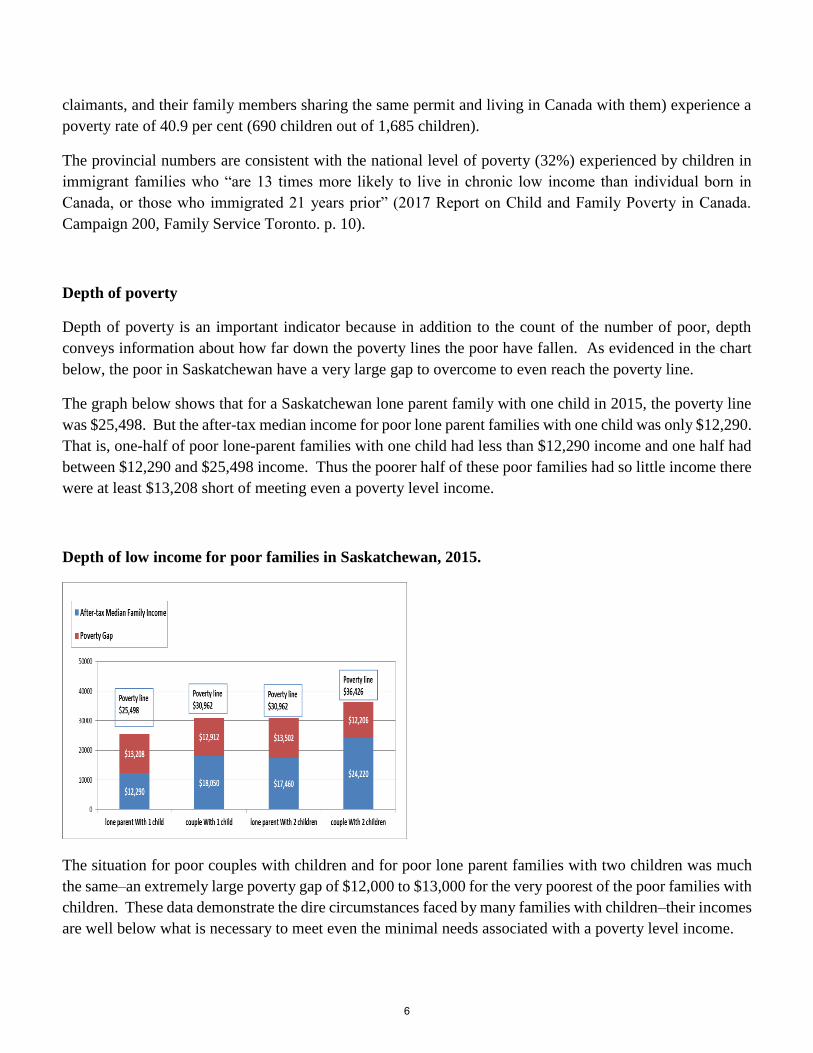
The graph below shows that for a Saskatchewan lone parent family with one child in 2015, the poverty line
was $25,498. But the after-tax median income for poor lone parent families with one child was only $12,290.
That is, one-half of poor lone-parent families with one child had less than $12,290 income and one half had
between $12,290 and $25,498 income. Thus the poorer half of these poor families had so little income there
were at least $13,208 short of meeting even a poverty level income.
Depth of low income for poor families in Saskatchewan, 2015.
The situation for poor couples with children and for poor lone parent families with two children was much
the same–an extremely large poverty gap of $12,000 to $13,000 for the very poorest of the poor families with
children. These data demonstrate the dire circumstances faced by many families with children–their incomes
are well below what is necessary to meet even the minimal needs associated with a poverty level income.
6

Effect of government transfers
Government social programs play an important role in mitigating poverty through transfers in the form of
child tax benefits, tax credits, and social assistance.
Child Poverty Before
Government Programs
(labour market
poverty)
Child Poverty After
Government Program
Spending
32.6% 24.1%
For Saskatchewan in 2015, the child poverty rate of 24.1 per cent would have been 32.6 per cent without
these federal and provincial government transfers. That is, the provincial poverty rate was reduced from one
in three children to one in four through these government transfers. For Canada in 2015, the child poverty
rate of 17.4 per cent would have been 27.87 per cent without these federal and provincial government
transfers. That is, the national poverty rate was reduced from one in four children to one in six through these
government transfers.
Poverty continues in Saskatchewan-What to do now?
From 2004 to 2014, Saskatchewan experienced ten years of exceptionally strong economic growth.
Employment and incomes grew but more so did corporate incomes from profits derived from non-renewable
resources. Were the benefits to the poor and working people in Saskatchewan greatly improved? The
province is only behind Nunavut and Manitoba child poverty levels. The Indigenous peoples, for the most
part, saw the royalties derived from the resources extracted from their traditional lands leave without benefit
to them. The cost of living increased, especially for home ownership along with the price of rents. Was it
all worth it? Depends who you ask.
This report makes no calls on the federal or provincial government of Saskatchewan to do anything about
poverty. For decades, advocacy groups have been asking all levels of government to address poverty and
nothing happens in response. The governments know what the situation is and how to address poverty and/or
low wage poverty, and they do nothing. On the contrary, brazenly the Saskatchewan government had
proposed a one per cent corporate income tax cut while introducing an austerity budget with dramatic budget
cuts for social, educational and other human service need programmes. That tax giveaway is currently on
hold.
Poverty is an essential feature of an economy such as Canada-built on corporate gain maximization and
growing inequality. Poverty stands as a stark reminder to those who work the menial jobs, the jobs with little
or no workplace benefits, no union protection and no employment security. Accept the work as it is offered
on the terms presented to you; if you don’t like it, then you will find it even worse in abject poverty.
7
Rather we call on the advocacy groups to stop going to politicians’ cap in hand, or praising corporate charities
set up to avoid paying their fair tax share. It’s time to confront politicians and the business sector with
determined resolve that the status quo must end. Our history provides wonderful examples of people taking
action in the past. Most faith groups, if they hold to the tenants of their beliefs, must join their voices and
resources in calling for preferential treatment for the poor, the marginalized and those facing discrimination.
Unions and better paid working people must be reminded the Employment Insurance or minimum wage laws
are not the bottom standard, social assistance is the bottom standard. Businesses know that they need to
operate just above the welfare standards; that’s where the minimum standards of employment reside.
Our artists, our musicians, our poets, authors, film makers, painters, photographers, intellectuals? Where are
they in this struggle, where are their contributions? And what of the media; what of journalism’s absolute
failure to those who are poor? The media constructs pedestals for the super-rich while simultaneously
criticizing those who speak out against growing inequality and rising poverty as utopian fantasists. The media
misrepresents and decontextualizes the causes and the consequences of poverty. Ultimately the media
legitimatizes and depoliticizes poverty and inequality. Look no further than the existence of food banks which
were gone from the Canadian landscape until reappearing in the 1980s to become corporate structures of
their own. Rather than challenging the existence of food banks or surplus/wasted food, media campaigns to
support food banks convey the message that hunger is not a political issue, rather hunger is a matter of charity.
Instead of food drive campaigns why is the media not campaigning for adequate welfare benefits? The
answer is obvious, because they would be considered politically controversial topics. As corporate charities
well understand, it’s good business to appear community-minded. Voluntarism and food banks are therefore
portrayed as the appropriate societal response to poverty, hunger and growing income inequality.
The authors of this report will be releasing a series of more reports on the topic of social and economic
injustice in the province of Saskatchewan. Reports will be released that expand the coverage of poverty
beyond children, a report on the growing level of income inequality, a return to the concept of economic
dependency ratios after more that three decades of the examination as well as an in depth exploration of the
introduction and development of the Saskatchewan Party government’s work for welfare programme known
as Accelerated Connections to Employment (ACE).
8