chief joseph dam 2012 two bay uplift spill test: total ... · spill test: total dissolved gas...
TRANSCRIPT

U.S. Army Corps of Engineers Seattle District
Chief Joseph Dam 2012 Two Bay Uplift Spill Test: Total Dissolved Gas Exchange
Prepared by
Kent B. Easthouse
U.S. Army Corps of Engineers, Seattle District
Hydraulics and Hydrology Branch
Water Management Section
Seattle, Washington
September, 2012
Chief Joseph Dam 2012 Two Bay Uplift Spill Test: TDG Exchange
September 2012 i U.S. Army Corps of Engineers
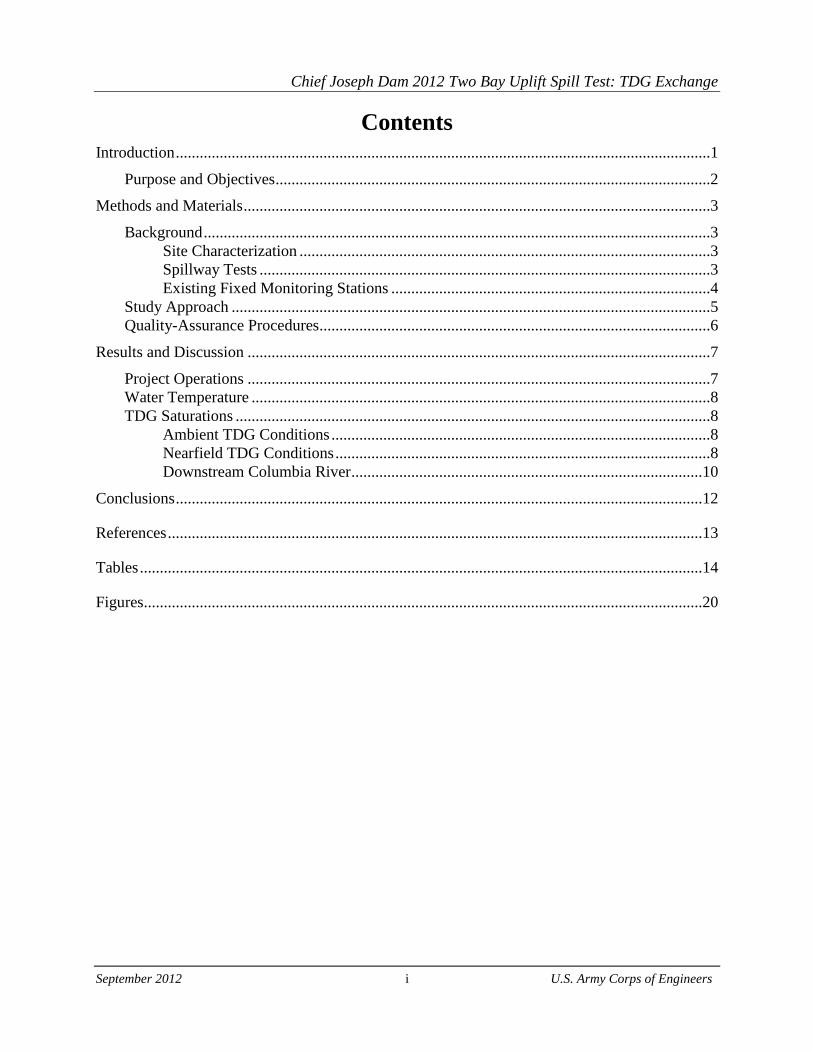
Contents
Introduction ......................................................................................................................................1
Purpose and Objectives .............................................................................................................2
Methods and Materials .....................................................................................................................3
Background ...............................................................................................................................3
Site Characterization .......................................................................................................3
Spillway Tests .................................................................................................................3
Existing Fixed Monitoring Stations ................................................................................4
Study Approach ........................................................................................................................5
Quality-Assurance Procedures..................................................................................................6
Results and Discussion ....................................................................................................................7
Project Operations ....................................................................................................................7
Water Temperature ...................................................................................................................8
TDG Saturations .......................................................................................................................8
Ambient TDG Conditions ...............................................................................................8
Nearfield TDG Conditions ..............................................................................................8
Downstream Columbia River ........................................................................................10
Conclusions ....................................................................................................................................12
References ......................................................................................................................................13
Tables .............................................................................................................................................14
Figures............................................................................................................................................20

Chief Joseph Dam 2012 Two Bay Uplift Spill Test: TDG Exchange
September 2012 ii U.S. Army Corps of Engineers
Tables
Table 1. Summary of total dissolved gas and temperature sampling stations. .............................15
Table 2. Difference between the primary standard thermometer and the laboratory
calibrated instrument. ....................................................................................................16
Table 3. Summary of project operations from March 26 through March 30, 2012. .....................17
Table 4. Statistical summary of total dissolved gas pressures in the Columbia River from
March 26 to March 30, 2012. ........................................................................................18
Table 5. Statistical summary of total dissolved gas saturations in the Columbia River
from March 26 to March 30, 2012. ...............................................................................19
Figures
Figure 1. Location of the study area within the Columbia River watershed. ...............................21
Figure 2. TDG and temperature monitoring stations downstream of Chief Joseph Dam to
Wells Dam. ....................................................................................................................22
Figure 3. TDG and temperature monitoring stations upstream and downstream of Chief
Joseph Dam. ..................................................................................................................23
Figure 4. TDG and temperature monitoring stations at Transect 1 below Chief Joseph
Dam. ..............................................................................................................................24
Figure 5. TDG and temperature monitoring stations at Transect 2 below Chief Joseph
Dam. ..............................................................................................................................25
Figure 6. TDG and temperature monitoring stations at Transect 3 below Chief Joseph
Dam. ..............................................................................................................................26
Figure 7. Right bank spill trajectory (top photo) vs. left bank spill trajectory (bottom
photo) during 30 kcfs/bay spillway release. ..................................................................27
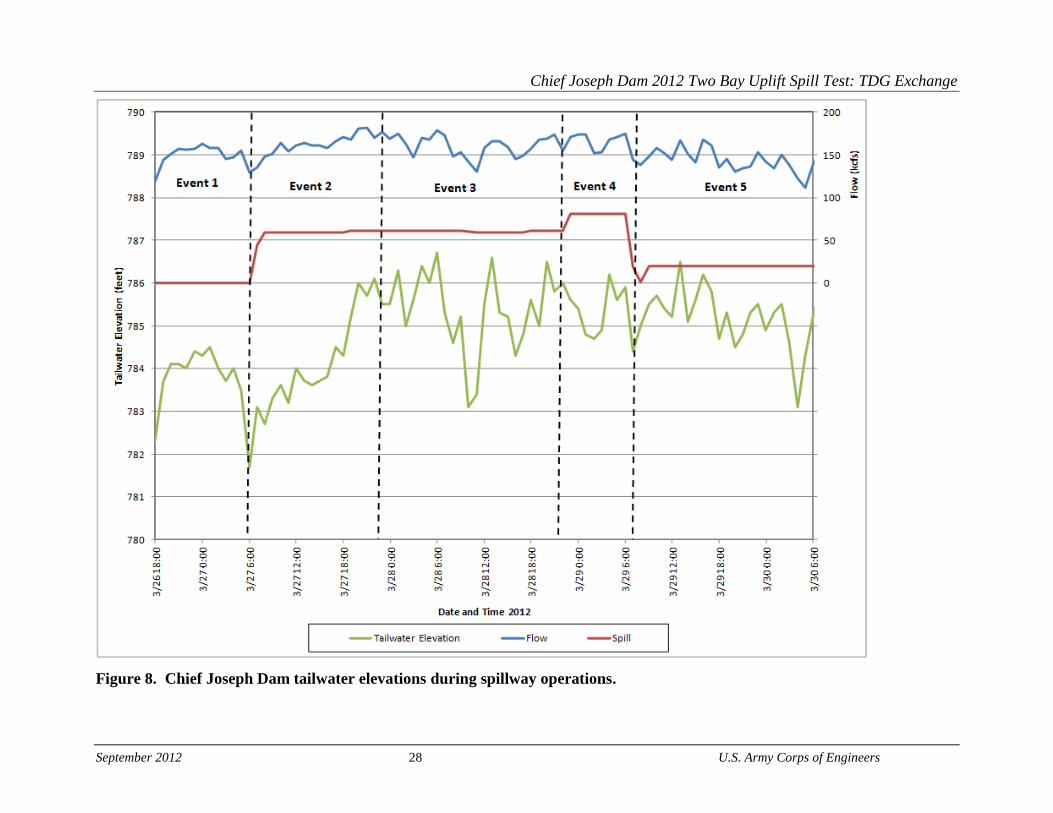
Figure 8. Chief Joseph Dam tailwater elevations during spillway operations. .............................28
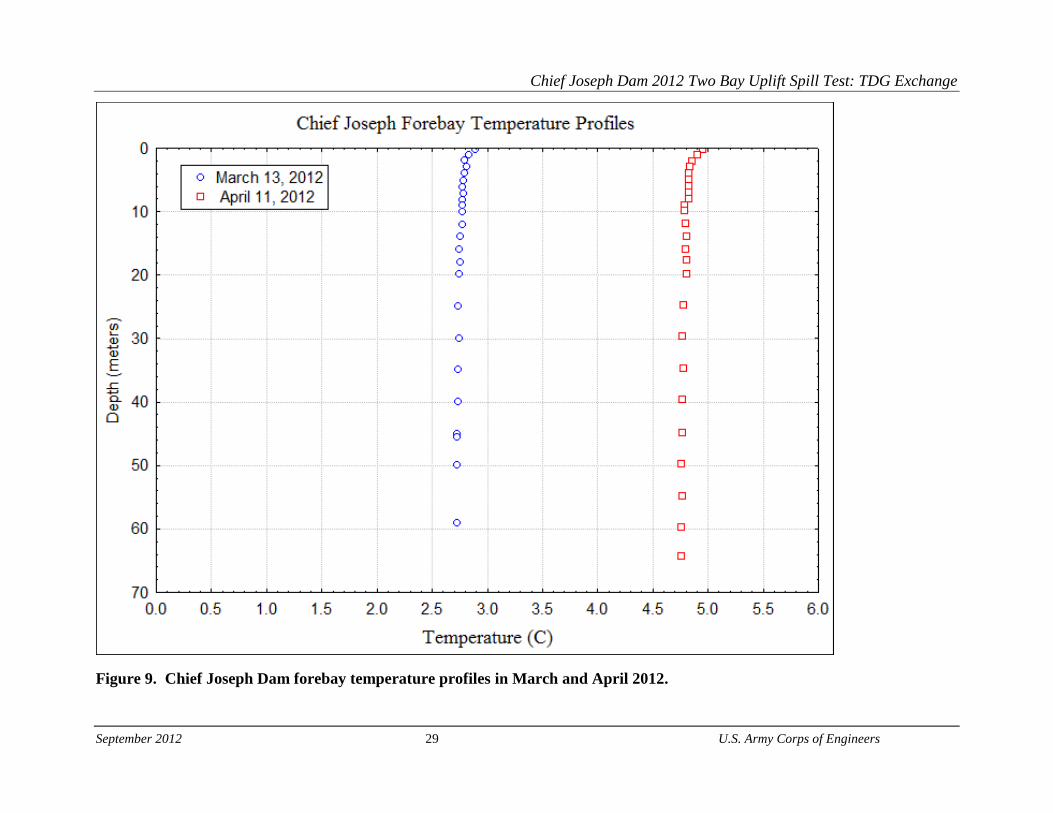
Figure 9. Chief Joseph Dam forebay temperature profiles in March and April 2012. .................29
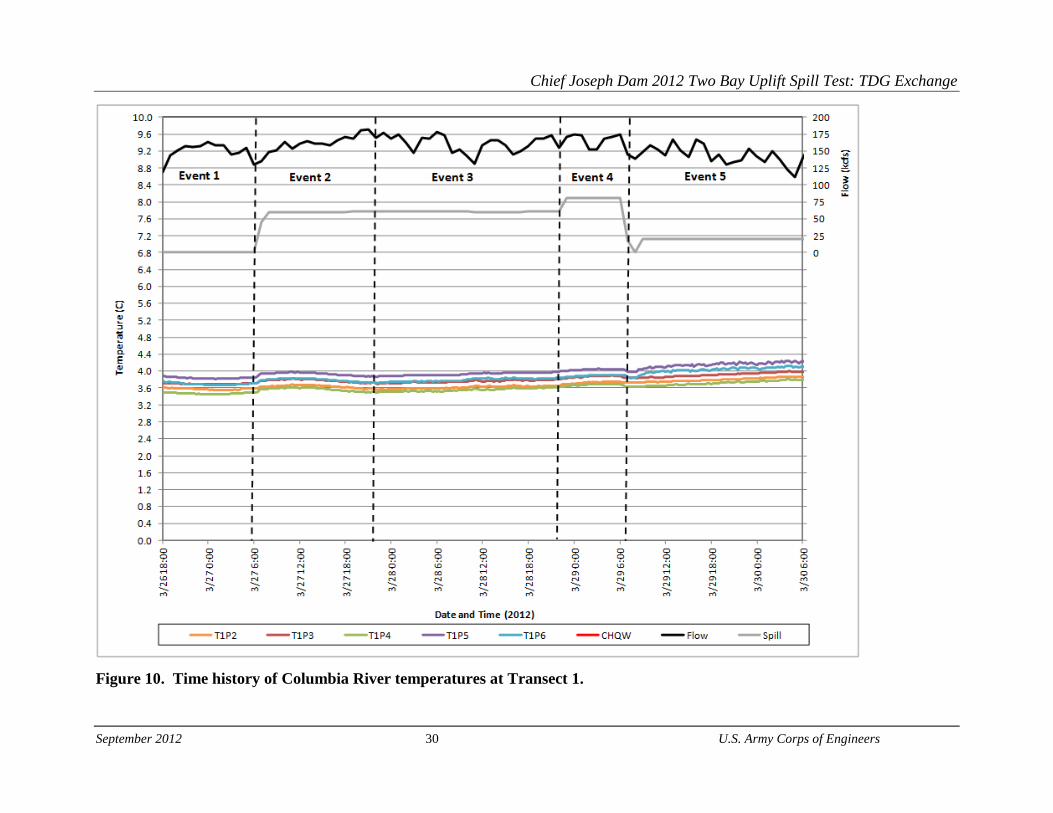
Figure 10. Time history of Columbia River temperatures at Transect 1. .....................................30
Figure 11. Time history of Columbia River TDG saturations immediately downstream of
Chief Joseph Dam measured at Transect 1. ..................................................................31
Figure 12. Time history of Columbia River TDG saturations immediately downstream of
Chief Joseph Dam measured at Transect 1 showing left bank vs. right bank
spill trajectory................................................................................................................32

Chief Joseph Dam 2012 Two Bay Uplift Spill Test: TDG Exchange
September 2012 iii U.S. Army Corps of Engineers
Figure 13. Expanded scale of time history of Columbia River TDG saturations
immediately downstream of Chief Joseph Dam measured at Transect 1
showing left bank vs. right bank spill trajectory. ..........................................................33
Figure 14. Unit spillway discharge vs. TDG saturations for two bay spill events in 2007,
2008, and 2012. .............................................................................................................34
Figure 15. Time history of Columbia River TDG saturations as measured downstream of
Chief Joseph Dam from Transect T2 to Wells Dam. ....................................................35

Chief Joseph Dam 2012 Two Bay Uplift Spill Test: TDG Exchange
September 2012 1 U.S. Army Corps of Engineers
Introduction
The Seattle District (NWS) conducted a spill test in March 2012 to evaluate the effectiveness of
spillway deflectors and joint seal system repairs at reducing uplift pressure increases measured
during spillway operations at Chief Joseph Dam in the 1990’s. During high spill rates, increases
in uplift pressures were measured in some of the uplift pressure cells located under the spillway
of Chief Joseph Dam. Uplift pressures for spill over deflectors with a repaired seal system were
measured during previous spill tests conducted in 2007 and 2008. These spill tests discharged up
to 16 thousand cubic feet per second (kcfs) per bay over two spillway bays (bays 12 and 13) that
contain instrumentation for measuring uplift pressures. These tests showed improved uplift
pressures over pre-deflector/seal repair conditions in the 1990’s, but there were still instruments
showing rising uplift pressures at the end of the 16 kcfs per bay test in 2007 and 2008.
Installation of all joint seal upgrades for the Chief Joseph spillway was completed in 2009. High
spring runoff conditions in both 2010 and 2011 resulted in increased long duration spill events
over all 19 spillway bays at Chief Joseph Dam in those years. Although uplift pressures
remained very low during these spill events, the maximum spill rates were only about 10
kcfs/bay (less than 20% of the spillway potential 63 kcfs/bay). The two previous spill tests in
2007 and 2008 measuring uplift pressures at 16 kcfs/bay were inconclusive and uplift pressures
for spillway discharges greater than 16 kcfs per bay up to the maximum of 63 kcfs per bay have
not been tested. Because the addition of spillway deflectors has changed the frequency and
manner in which the spillway will be used there is a possibility of spilling greater amounts per
bay for longer durations in the future. Consequently, the Seattle District conducted a spill test
which evaluated the combined effect of the monolith joint seal improvements and changes in
pressure distribution due to the installation of the deflectors on uplift pressures for spill rates of
30 kcfs/bay and 40 kcfs/bay.
Total dissolved gas (TDG) supersaturation is generated in the Columbia River during spillway
flows at Chief Joseph Dam. The absorption of atmospheric gasses is caused by the entrainment
of air bubbles into a plunging spill jet resulting in the transfer of gas into solution at depth in the
stilling basin. A detailed investigation of pre-deflector TDG exchange was conducted at Chief
Joseph Dam in 1999 and an investigation of post-deflector TDG exchange was conducted in
2009 (Schneider and Carroll 1999; Schneider 2012). The pre-deflector study determined that
TDG exchange in spillway flows ranged from about 111 to 134 percent and were a direct
function of the specific spillway discharge. The post-deflector study showed that spillway
deflectors substantially reduced TDG exchange in spillway flows with measured TDG
saturations ranging from about 110 to 120 percent. An investigation of TDG exchange for spill
over two bays with deflectors was conducted in 2007 (Schneider 2008). This study determined
that TDG exchange in spillway flows of 16 kcfs/bay over two bays ranged up to 122 percent
saturation.
Total dissolved gas (TDG), water temperature, and associated water quality processes are known
to impact anadromous and resident fishes in the Columbia River. Dams may alter a river’s water
quality characteristics by increasing TDG levels due to releasing water through the spillways and
by altering temperature gradients due to the creation of reservoirs. Spilling water at dams can

Chief Joseph Dam 2012 Two Bay Uplift Spill Test: TDG Exchange
September 2012 2 U.S. Army Corps of Engineers
result in increased TDG levels in downstream waters by plunging the aerated spill water to depth
where hydrostatic pressure increases the solubility of atmospheric gases. Elevated TDG levels
generated by spillway releases from dams can promote the potential for gas bubble trauma in
downstream aquatic biota (Weitkamp and Katz 1980; Weitkamp et al. 2002); this condition is
analogous to decompression sickness, or “the bends,” in human divers. Water temperature has a
significant impact on fish survivability, TDG saturations, the biotic community, chemical and
biological reaction rates, and other aquatic processes.
To address uplift pressure concerns during spillway operations, the Corps conducted a two bay
spill test during March 2012. Two distinct spillway releases of 30 kcfs/bay and 40 kcfs/bay were
scheduled during the study.
Purpose and Objectives
The purpose of the TDG study is to quantify total dissolved gas exchange processes associated
with two bay spillway operations at Chief Joseph Dam and the resultant transport and mixing in
the Columbia River below the project for a distance of about 30 miles to Wells Dam. Although
two bay spillway operations are not common, this type of spill is periodically used to assess dam
safety and uplift pressure concerns at Chief Joseph Dam. Consequently, quantifying TDG
exchange during two bay spill discharges provides the Seattle District with valuable information
for better assessing the potential water quality and biological impacts to the Columbia River
from this type of spill test. The major objectives of this study were:
To monitor TDG saturations in the Columbia River during two bay
spillway releases
To study the lateral mixing of spill and powerhouse water in the Columbia
River downstream of Chief Joseph Dam during two bay spillway releases
To study TDG exchange properties in the Columbia River downstream of
Chief Joseph Dam.
These objectives were addressed using data collection and analysis methods to evaluate
temperature and TDG exchange characteristics in the Columbia River before, during, and after
spillway operations. The study focused on the Columbia River from Chief Joseph Dam to Wells
Dam, Washington.

Chief Joseph Dam 2012 Two Bay Uplift Spill Test: TDG Exchange
September 2012 3 U.S. Army Corps of Engineers
Methods and Materials
Background
Site Characterization
The Columbia River originates in the Rocky Mountains of British Columbia at an elevation
exceeding 3,000 meters and flows northward for several hundred kilometers before flowing
southward through a series of lakes and reservoirs toward the state of Washington (Figure 1).
The Kootenai River and the Pend Oreille River enter the Columbia River north of the
international border, and the Columbia River flows into Lake Roosevelt immediately south of the
border. Lake Roosevelt is the 210 kilometer long reservoir formed by Grand Coulee Dam, a
Bureau of Reclamation (BOR) project located at river kilometer 960. Downstream of Grand
Coulee Dam the river enters Rufus Woods Lake, the 80 kilometer long reservoir formed by Chief
Joseph Dam, a COE project. Chief Joseph Dam is a concrete gravity dam, 70.1 meters high, with
19 spillway bays which abut the right bank. The spillway is controlled by 11-meter wide by
17.7-meter high tainter gates and is designed to pass releases up to 1,200 kcfs at a maximum
water surface elevation of 292.2 meters.
The study area lies within the high-steppe, semiarid desert region of central Washington (Figure
2). The Columbia River in the study area forms the boundary between two distinct geologic
provinces in the State of Washington, the Okanogan Highlands to the north and the Columbia
Plateau to the south (WDNR 2004). The Okanogan Highlands are characterized by rounded
mountains and narrow valleys, and are dominated by metasedimentary rocks. The Columbia
Plateau is characterized by incised rivers, extensive plateaus, and anticlinal ridges. The Plateau
region is dominated by basalt flows laid down by successive volcanic eruptions during the
Miocene (WDNR 2004). Elevations range from about 236 meters at the Columbia River
immediately downstream of Chief Joseph Dam to over 1,000 meters in the mountainous terrain
that rise up from the water in the mid to upper reaches of the reservoir.
The climate of the study area is influenced by easterly moving weather systems from the Pacific
Ocean. Winters are generally cool with November through March being the wettest months.
Summers are warm and dry with little to no precipitation falling from June through September.
The mean annual precipitation in the vicinity of the dam is about 25 centimeters. Total annual
snowfall varies with elevation throughout the study area, with about 40 centimeters near the dam.
The mean annual temperature at the dam is 10C, with extremes recorded in the vicinity of the
dam of – 30C and 43C (USCOE 1985).
Spillway Tests
A detailed investigation of TDG exchange at Chief Joseph Dam with the original spillway was
conducted in 1999 (Schneider and Carroll, 1999). This investigation determined the TDG

Chief Joseph Dam 2012 Two Bay Uplift Spill Test: TDG Exchange
September 2012 4 U.S. Army Corps of Engineers
exchange in spillway flows ranged from 111 to 134 percent and were a direct function of the
specific spillway discharge. The maximum TDG saturation observed in the aerated spillway
release during this study was 174 percent of saturation. The maximum TDG threshold produced
during spillway flows was also found to be a function of the tailwater depth of flow. This
process was responsible for spillway flow to generate significantly higher TDG saturation than
observed during the spill test in 1999.
The construction of two spillway flow deflectors on Bays 12 and 13 were completed by April of
2007 and the TDG exchange properties were evaluated during scheduled spillway operations on
April 22-23, 2007 for spill ranging from 3.9 to 31.2 kcfs (about 2 to 16 kcfs per bay). A linear
relationship between spill discharge and TDG saturation was observed during the two bay spill
tests with the resultant maximum TDG saturation outside of aerated flow of about 120 to 122
percent for the 16 kcfs per bay event. The size of the entrainment discharge associated with the
two bay spill pattern moderated the observed TDG saturation (Schneider, 2008).
Spillway deflector construction was completed in 2009. A spillway deflector TDG exchange
study was conducted at Chief Joseph Dam from April 28 to May 1, 2009 to determine the TDG
exchange characteristics for Chief Joseph Dam with deflectors. Spillway discharges ranged from
18 to 145 kcfs (about 1 to 7 kcfs per bay) during this study. Results showed the TDG exchange
during spillway operations with deflectors was greatly reduced compared to non-deflector
operations (Schneider 2012). For spillway flows over 38 kcfs the magnitude of reduction in
TDG saturation approached 15 percent saturation with spillway flow deflectors. Prior to the
addition of spillway flow deflectors at Chief Joseph Dam, a spillway discharge of as little as 36
kcfs resulted in TDG saturations greater than 120 percent saturation. With spillway flow
deflectors, a uniform spill of 142 kcfs was sustained with TDG levels remaining slightly below
120 percent saturation. TDG saturations were lowest for uniform spillway conditions with TDG
exchange to be influenced by tailwater depth, with higher tailwater depth resulting in greater
TDG saturations.
Existing Fixed Monitoring Stations
Based on the lateral transect TDG saturation data collected by Schneider and Carroll (1999), the
Seattle District installed a fixed monitoring TDG station (CHQW) on the right bank about 1.3
miles downstream of the spillway (Figure 2). Schneider and Carroll (1999) measured TDG
saturations along a lateral transect in the Columbia River immediately downstream of the aerated
zone and measured the highest TDG saturations along the right bank. Although monitoring in
the aerated zone (i.e. immediately downstream of the stilling basin) recorded higher TDG
saturations, it is generally not recommended for monitoring stations because the highly turbulent
aerated water results in dynamic TDG saturations. A rapid and substantial desorption of
supersaturated gas takes place in the aerated zone immediately downstream of the stilling basin
resulting in difficulty accurately measuring TDG saturations. An existing forebay fixed
monitoring station (CHJ) is located on the left bank at the boathouse immediately upstream of
the powerhouse (Figure 2).

Chief Joseph Dam 2012 Two Bay Uplift Spill Test: TDG Exchange
September 2012 5 U.S. Army Corps of Engineers
Study Approach
An array of thirteen (13) instruments, consisting of eleven (11) data loggers and two (2) real-time
instruments, were deployed in the Columbia River to measure lateral and longitudinal TDG
saturations and temperature in the Columbia River generated by Chief Joseph Dam powerhouse
and spillway operations. The general locations of these water quality monitoring stations are
shown in Figures 2, 3, 4, 5, and 6, and a description of each station is presented in Table 1. Data
were collected by the water quality instrumentation at either 15 minute intervals (data loggers) or
60 minute intervals (real-time probes) and included the date, time, instrument depth, water
temperature, TDG pressure, and internal battery voltage. In addition, barometric pressure and
air temperature were monitored near Chief Joseph Dam at the forebay and tailwater fixed
monitoring stations to calculate the TDG percent saturation.
Two real-time instruments were deployed in the Columbia River at the forebay (CHJ) and
tailwater (CHWQ) of Chief Joseph Dam (Figures 2 and 3). Station CHJ is the permanent
forebay fixed monitoring station for Chief Joseph Dam and is positioned in the forebay near the
left bank immediately upstream of the powerhouse. The probe was deployed directly into the
water off of the boathouse’s floating dock at a depth of about 20 feet. This upstream station is
representative of TDG saturations resulting from powerhouse discharges. Station CHQW is the
permanent tailwater fixed monitoring station for Chief Joseph Dam and is positioned along the
right bank of the river, 1.3 miles downstream from the spillway at a location representing about 5
percent normalized distance from the right bank (i.e. 95% from the left bank). The TDG probe
was deployed in an anchored perforated PVC pipe that extended out into the river below the
TDG compensation depth but not to the bottom of the river.
Eleven data loggers were deployed in the Columbia River for the study. Six data loggers (T1P1,
T1P2, T1P3, T1P4, T1P5, and T1P6) were deployed in the river about 1.3 miles downstream of
the spillway at the location of the tailwater Fixed Monitoring Station as outlined in Table 1 and
shown in Figure 4. These instruments were deployed along a transect with station CHQW to
monitor the lateral mixing between spillway and powerhouse flows. The sampling stations were
skewed towards the right bank to best capture the development of the mixing zone between
spillway and powerhouse flows. These stations were positioned in a transect representing 10, 30,
50, 70, 90, and 95 percent normalized distance from the left bank (Figure 4 and Table 1).
The remaining sampling stations were located about 7, 14, and 29 miles downstream of the
project to measure the TDG pressures in the Columbia River under open-channel flow conditions
and before encountering Brewster Flats and the Okanogan River (Figures 5 and 6). Three
instruments (T2P1, T2P2, and T2P3) were located about 7 miles downstream in the Columbia
River positioned in a transect representing 10, 50, and 90 percent normalized distance from the
left bank. Instrumentation for these stations were housed in a perforated PVC pipe housing and
deployed near the bottom of the river with weights and cables. One instrument (T3P1) was
located about 14 miles downstream in the Columbia River at the highway bridge crossing in
Brewster Washington, and positioned at 50 percent normalized distance from the left bank. The
farthest downstream sampling station consisted of one instrument (WELLFB) located about 29
miles downstream of Chief Joseph Dam in the forebay of Wells Dam, as shown previously in

Chief Joseph Dam 2012 Two Bay Uplift Spill Test: TDG Exchange
September 2012 6 U.S. Army Corps of Engineers
Figure 2. This instrument was located about 20 feet deep at the end of a cable and was free to
move with the transient current at this location
All water quality probes used in the study were Hydrolab MiniSonde MS4A/MS5 TDG probes.
Additional instrumentation for both real-time stations consisted of a Common Sensing TBO-L
electronic barometer, a Sutron 9210 XLite DCP, a radio transmitter, and a power source. For
real-time stations, the barometer, TDG probe and DCP were powered by a 12-volt battery that
was charged by a 120-volt AC line.
Quality-Assurance Procedures
Data quality assurance and calibration procedures included calibration of instruments in the
laboratory following procedures outlined in the Corps of Engineers Plan of Action for Dissolved
Gas Monitoring 2011 (USACE 2010). All primary standards were National Institute of Science
and Technology (NIST) traceable and maintained according to manufacturers’ recommendations.
A new TDG membrane was assigned to each probe at the beginning of the study.
Water quality probes were laboratory calibrated using the following procedures. TDG pressure
sensors were checked in air with the membrane removed. Ambient pressures determined from
the NIST traceable mercury barometer served as the zero value for total pressure. The slope for
total pressure was determined by adding known pressures to the sensor. Using a NIST traceable
digital pressure gauge, comparisons were made at pressures of 0 and 300 mm mercury (Hg)
above barometric pressure, which represented TDG saturations from 100 to 139% (Table 2). If
any measurement differed by more than 5 mm Hg from the primary standard, the sensor was
adjusted and rechecked over the full calibration range. As seen in Table 2, most calibrations
were within 0 to 2 mm Hg of total dissolved gas.
Laboratory calibrations of the water quality probe’s temperature sensor were performed using a
NIST traceable thermometer and are shown in Table 2. If the measurements differed by more
than 0.2C, the probe was not used. As seen in Table 2, most calibrations were within 0.1C for
temperature.
Once the real-time data and logger data were received and missing data were flagged, the
following quality assurance review procedures occurred. First, tables of raw data were visually
inspected for erroneous data resulting from DCP malfunctions or improper transmission of data
value codes. Second, data tables were reviewed for sudden increases in temperature, barometric
pressure, or TDG pressure that could not be correlated to any hydrologic event and therefore may
be a result of mechanical problems. Third, graphs of the data were created and analyzed in order
to identify unusual spikes in the data. A quality assurance review of all stations showed that
Station T1P1 failed to log data for the entire deployment period and consequently no data from
that station was used. All other data were acceptable and were used in this report.

Chief Joseph Dam 2012 Two Bay Uplift Spill Test: TDG Exchange
September 2012 7 U.S. Army Corps of Engineers
Results and Discussion
Project Operations
Water quality instruments were deployed on March 26th
and removed on March 30th
, 2012.
During this time period, total river discharge from Chief Joseph Dam ranged from about 110 kcfs
to 180 kcfs, while spillway releases ranged from 0 kcfs to 80 kcfs. A total of 5 distinct events
were classified during this time period (Table 3). From 1600 March 26 to 0700 March 27 no
spill was scheduled, and this period of non-spill background conditions represents Event 1.
From 0700 March 27 to 2300 March 28 spill of 30 kcfs/bay from two bays (spillway bays 12 and
13) were scheduled, and this spill volume represents Events 2 and 3. Event 2 occurred from
0700 March 27 to 2300 March 27 when spillway releases maintained a right bank spill trajectory
(Figure 7). Event 3 occurred from 2300 March 27 to 2300 March 28 when spillway releases
moved from the right bank to the left bank and maintained a left bank spill trajectory (Figure 7).
From 2300 March 28 to 0600 March 29 spill of 40 kcfs/bay from two bays (spillway bays 12 and
13) were scheduled representing Event 4. The spill test concluded at 0600 on March 29th
. For
data management purposes, the 27 hours of spill following the conclusion of the two bay test was
classified as Event 5. This spill event occurred from 0600 March 29 to 0900 March 30 and
consisted of spill of 1kcfs from 18 spillway bays.
Spillway releases from bays 12 and 13 were conducted from 0700 March 27th
through 0600
March 29th
, 2012, with spill discharge ranging from 30 kcfs/bay to 40 kcfs/bay (Table 3). The
powerhouse generation flow rate during the test was constantly changing as scheduled power
production was updated and flow adjustments were implemented. In general, powerhouse flows
were in the 80 kcfs to 110 kcfs range during the two bay spill test (Table 3). Tailwater
elevations ranged from a low of about 781.7 feet at the start of spill during Event 2 to a high of
786.7 feet during Event 3 (Figure 8). The goal of the powerhouse flows was to (1) provide
sufficient depth of submergence over the deflectors to prevent plunging flow conditions and (2)
provide sufficient flow of low TDG water to mix with high TDG spill water to reduce the mixed
river TDG saturations and minimize any downstream impacts. After the start of spill during
Event 2, the tailwater elevation quickly increased and ranged only about 3 feet during spillway
discharges, resulting in relatively constant depths for the water quality probes located
downstream. The depths of all probes ranged from about 20 to 30 feet along Transect 1, 30 to 50
feet along Transect 2, and 15 feet at Transect 3. The depths of the probes placed at the forbay of
Wells and Chief Joseph were greater than 20 feet. Consequently, all water quality probes were
deeper than the compensation depth of 10 feet required to accurately measure a TDG saturation
of 135%. The compensation depth is the depth above which degassing will occur due to
decreased hydrostatic pressure. To measure TDG accurately, a probe must be placed below the
minimum calculated compensation depth.

Chief Joseph Dam 2012 Two Bay Uplift Spill Test: TDG Exchange
September 2012 8 U.S. Army Corps of Engineers
Water Temperature
The forebay of Chief Joseph Dam was not thermally stratified during the study period. Forebay
temperature profiles from March 13th
and April 11th
at 1500 hours are shown in Figure 9. Water
temperatures from the surface to over 60 meters deep in the forebay showed little change and
ranged from about 2.8°C in March to about 4.8°C in April. Consequently, little difference in
water temperature would be expected between spillway flows and powerhouse flows. Figure 10
shows that no lateral water temperature gradients were measured in the Columbia River at
Transect 1 due to the combined spillway and powerhouse releases. The slight 0.1 to 0.2 °C
difference noted along the transect represent differences in temperature calibrations as these
differences exist during flow through the powerhouse in Event 1 prior to any spillway release.
TDG Saturations
Total dissolved gas levels presented in the following sections are reported as either TDG
pressure in millimeters (mm) Hg or as TDG saturation (percent). Water quality monitoring
stations providing information on nearfield TDG processes were stations T1P2-6 and CHQW
while ambient conditions were measured at forebay station CHJ (see Figure 4). Information on
downstream TDG processes were stations T2P1-3, T3P1, and WELLFB (see Figures 2, 5 and 6).
A statistical summary of the TDG pressures and saturations at all water quality stations for event
spillway conditions are presented in Tables 4 and 5.
Ambient TDG Conditions
The ambient TDG pressures measured upstream of Chief Joseph Dam (station CHJ) were
relatively constant throughout the study and did not vary by more than ± 4 mmHg, with
saturations remaining near 102 percent for Events 1 through 5. Pre-spill TDG saturations
measured during Event 1 generally ranged from about 101 to 103 percent across the sampling
array as shown in Table 5. The TDG saturations prior to spill were similar upstream of Chief
Joseph Dam (station CHJ) and across all downstream stations indicating that station CHJ is
representative of TDG saturations passing through the powerhouse.
Nearfield TDG Conditions
During two-bay spillway releases from bays 12 and 13, TDG saturations measured along
Transect 1 showed the development of lateral gradients in TDG between spillway flows along
the right bank (stations T1P4-6 and CHQW) and powerhouse flows along the left bank (stations
T1P2-3) (Figure 11) . The development of a mixing zone results in the redistribution of TDG
pressures at Transect T1, with highest TDG saturations measured near the right bank and lower
TDG saturations measured near the left bank. Because station T1P1 (located at the 10%
normalized distance from the left bank) failed to operate, TDG saturations on the far left bank
associated with unaltered powerhouse discharge were not measured. As seen in Figure 11, TDG
saturations measured at station T1P2 (located at the 30% normalized distance from the left bank)

Chief Joseph Dam 2012 Two Bay Uplift Spill Test: TDG Exchange
September 2012 9 U.S. Army Corps of Engineers
show some influence of spillway TDG mixing with powerhouse flows. TDG saturations
measured at T1P3 (50% normalized distance from left bank) and T1P4 (70% normalized
distance from left bank) show increasing influences from spillway TDG pressures. Stations
T1P5 (90% normalized distance from left bank), T1P6 (95% normalized distance from left bank)
and CHQW (95% normalized distance from left bank) were similar during the study and
generally representative of spillway TDG pressures with little mixing of powerhouse flows.
The TDG saturations measured at Transect 1 during Events 2 and 3 are shown in Figure 11. For
Event 2, median TDG saturations along Transect 1 ranged from 107.5% (792 mm Hg) near the
left bank at T1P2 to 125.4% (923 mm Hg) near the right bank at T1P5 (Tables 4 and 5). The
maximum TDG saturations of 126.1% (927 mm Hg) were measured at the 90% normalized
distance from the left bank with slightly lower TDG saturations measured at the 95% distance.
For Event 3, median TDG saturations along Transect 1 ranged from 105% (770 mm Hg) near
the left bank at T1P2 to 128.4% (941 mm Hg) on the right bank at CHQW (Tables 4 and 5).
Maximum TDG saturations of 129.5 % (951 mm Hg) during Event 3 were similar between right
bank stations at the 90% (T1P5) and 95% (T1P6 and CHQW) normalized distance.
Events 2 and 3 represent a spillway discharge of 30 kcfs/bay from bays 12 and 13 with similar
powerhouse discharges of about 100 kcfs (Table 3). However, these two events are
differentiated by a change in the spillway trajectory from the right bank (Event 2) to the left bank
(Event 3) as shown in Figure 7. The change in spill trajectory from the right bank (Event 2) to
the left bank (Event 3) resulted in about a 3% (20 mm Hg) increase in TDG levels measured at
stations located near the right bank in predominately spillway flow (T1P5, T1P6, CHQW)
(Figures 12 and 13). However, a decrease in TDG levels of about 2-3% (10-20 mm Hg) was
measured at stations located either near the left bank in more powerhouse flow (T1P2 and T1P3)
or at the 70% distance in the mixing zone (T1P4). It is uncertain why the spill trajectory moved
from the right bank to the left bank during the 30 kcfs/bay spillway release from bays 12 and 13.
It is possible that a shift in powerhouse units being operated from the southern end of the
powerhouse to the northern end of the powerhouse resulted in the formation of an eddy that
transitioned the spill trajectory from the right bank to the left bank. The maximum TDG
saturations measured along Transect 1 during the 30 kcfs/bay spill were the result of the spill
having a left bank trajectory as seen in Event 3.
The TDG saturations measured at Transect 1 during Event 4 is shown in Figure 11. Event 4
represents an increase in spillway discharge from 30 kcfs/bay to 40 kcfs/bay, a slight decrease in
powerhouse discharge from about 100 kcfs to 80 kcfs, and continued left bank spillway
trajectory (Table 3). For Event 4, median TDG saturations along Transect 1 ranged from 109.2%
(802 mm Hg) near the left bank at T1P2 to 132.1% (970 mm Hg) on the right bank at CHQW
(Tables 4 and 5). Maximum TDG saturations of 133.2 % (978 mm Hg) were measured at T1P5
with similar maximum TDG levels (132.7% to 132.8%) measured at stations T1P6 and CHQW,
respectively.
Event 5 represents normal spillway operations after the end of the two-bay spill test (Figure 11).
During Event 5, spillway discharge was via a uniform pattern of 1 kcfs/bay from 18 bays with a
powerhouse discharge of about 128 kcfs. Median TDG saturations along Transect 1 ranged from

Chief Joseph Dam 2012 Two Bay Uplift Spill Test: TDG Exchange
September 2012 10 U.S. Army Corps of Engineers
102.2% (743 mm Hg) near the left bank at T1P2 to 108.0% (785 mm Hg) on the right bank at
CHQW (Tables 4 and 5).
The median TDG saturations for two-bay spillway discharges of 30 kcfs/bay and 40kcfs/bay
from bays 12 and 13 clearly show the development of strong lateral gradients in TDG
saturations, with TDG extending farther across the river for the 40kcfs/bay spill event. During
the two-bay tests, the maximum TDG was observed along the right bank at the 90% normalized
distance from shore with slightly lower TDG levels measured along the right bank at the 95%
normalized distance. For spillway flows of 30 kcfs/bay, elevated TDG saturations extended
across at least 50 percent of the Columbia River. For spillway flows of 40 kcfs/bay, elevated
TDG saturations extended across at least 70 percent of the Columbia River.
The TDG saturation data collected at station CHQW during the two-bay test indicates that the
unit spillway discharge is an important causal parameter in determining the TDG exchange in
spillway flows at Chief Joseph Dam. Figure 14 shows station CHQW TDG saturations as a
function of unit spillway discharge. Data collected during two-bay spill events in 2007 and 2008
are included in the figure. A linear relationship between TDG saturation at station CHQW and
unit spillway discharge was apparent over the range of 2 to 40 kcfs/bay. The polynomial
equation of the line is as follows:
TDGsp = -0.0048q2+0.836q+105.99 (r
2=0.9562)
Where:
TDGsp= Total Dissolved Gas Saturation in Spillway Discharges (%)
q = Unit Spillway Discharge (kcfs/bay)
Increases in TDG saturations between Event 2 and 3 when unit spillway discharge was held
constant at 30 kcfs/bay suggest that spillway trajectory is another important parameter in
determining TDG exchange in spillway flows at Chief Joseph Dam. Even though the unit
spillway discharge remained stable at 30 kcfs/bay, maximum TDG saturations measured along
Transect 1 increased by about 3% (20 mm Hg) when the spill trajectory shifted from the right
bank to the left bank.
Downstream Columbia River
Downstream TDG processes were monitored in the Columbia River at distances of about 7 miles
(Transect 2), 14 miles (Transect 3), and 29 miles (Wells Dam Forebay) downstream of Chief
Joseph Dam (see Figure 2). Schneider (2012) concluded that during spillway operations,
Columbia River TDG saturations were generally well mixed at about 14 miles downstream of the
dam at the Brewster WA Highway Bridge, and continued to be well mixed downstream to Wells
Dam. In-river processes such as lateral mixing, tributary dilution, degassing at the air-water
interface, thermal heat exchange, and biological productivity are likely responsible for TDG
saturations in the Columbia River becoming mixed downstream (Schneider 2012).

Chief Joseph Dam 2012 Two Bay Uplift Spill Test: TDG Exchange
September 2012 11 U.S. Army Corps of Engineers
TDG saturations measured downstream of Transect 1 (see Figure 2) decreased with distance
from Chief Joseph Dam as the river approached Wells Dam (Figure 15). Lateral TDG gradients
were present at Transect 2 showing the continued development of the mixing zone between
powerhouse flows along the left bank and spillway flows on the right bank. The TDG
saturations measured at Transects 2 and 3 are shown in Figure 15. For Event 2, median TDG
saturations along Transect 2 ranged from 114.8% (846 mm Hg) near the left bank at T2P1,
117.1% (863 mm Hg) at the mid-river station T2P2, to 118.7% (874 mm Hg) near the right bank
at T2P3 (Tables 4 and 5). For Event 3, median TDG saturations along Transect 2 ranged from
113.5% (833 mm Hg) near the left bank at T2P1, 115.9% (849 mm Hg) at the mid-river station
T2P2, to 118.0% (865 mm Hg) near the right bank at T2P3 (Tables 4 and 5). Maximum TDG
saturations along Transect 2 for Events 2 and 3 were consistently measured at the 90%
normalized distance from the left bank. Median TDG saturations measured at Transect 3 ranged
from 116.8% (858 mm Hg) for Event 2 to 115.7% (847 mm Hg) for Event 3. Schneider (2012)
calculated the average travel time from Chief Joseph Dam to Transects 2 and 3 during spillway
discharge tests in 2009 to range from 3.5 to 4.5 hours to Transect 2 and from 7 to 9 hours to
Transect 3, depending on flow and the elevation of Wells Pool. This range of travel times was
used to calculate the median, maximum, and minimum TDG values for each event at Transects 2
and 3 (Table 4 and 5).
The TDG saturations measured at Transects 2 and 3 during Event 4 are shown in Figure 15. For
Event 4, median TDG saturations along Transect 2 ranged from 117.8% (864 mm Hg) near the
left bank at T2P1, 118.5% (870 mm Hg) at the mid-river station T2P2, to 122.1% (895 mm Hg)
near the right bank at T2P3 (Tables 4 and 5). Maximum TDG saturations along Transect 2 for
Event 4 were consistently measured at the 90% normalized distance from the left bank. Event 5
represents normal spillway operations after the end of the two-bay spill test. Median TDG
saturations along Transect 2 ranged from 103.0% (749 mm Hg) near the left bank at T2P1 to
104.2% (758 mm Hg) near the right bank at T2P3 (Tables 4 and 5). Median TDG saturations
measured at Transect 3 ranged from 119.0% (872 mm Hg) for Event 4 to 103.4% (751 mm Hg)
for Event 5.
The passage of the spill events at the Wells Dam forebay station (WELLFB) was not as
prominent as for stations located at Transects 2 and 3 (Figure 15). Downstream TDG saturations
measured at Wells Dam Forebay (Station WELLFB) show the influence of in-river processes
such as lateral mixing, tributary dilution and degassing at the air-water interface. Schneider
(2012) calculated the average travel time from Chief Joseph Dam to Wells Dam during spillway
discharge tests in 2009 to range from 20 to 24 hours depending on flow and the elevation of
Wells Pool. This range of travel times was used to calculate the median, maximum, and
minimum TDG values for each event at the Wells Dam forebay station (Table 4 and 5). Median
TDG saturations measured at station WELLFB ranged from 114.7% (842 mm Hg) for Event 2 to
115.0% (841 mm Hg) for Event 3, and from 116.9% (850 mm Hg) for Event 4 to 103.8% (759
mm Hg) for Event 5.

Chief Joseph Dam 2012 Two Bay Uplift Spill Test: TDG Exchange
September 2012 12 U.S. Army Corps of Engineers
Conclusions
During two-bay spillway releases from bays 12 and 13, TDG saturations
measured along Transect 1 showed the development of lateral gradients in
TDG between spillway flows along the right bank and powerhouse flows
along the left bank. The development of a mixing zone results in the
redistribution of TDG pressures at Transect T1, with highest TDG
saturations measured near the right bank and lower TDG saturations
measured near the left bank.
The median TDG saturations for two-bay spillway discharges of 30
kcfs/bay and 40kcfs/bay from bays 12 and 13 clearly show the
development of strong lateral gradients in TDG saturations, with TDG
extending farther across the river for the 40kcfs/bay spill event. During
the two-bay tests, the maximum TDG was observed near the right bank at
the 90% normalized distance from shore with slightly lower TDG levels
measured along the right bank at the 95% normalized distance.
The TDG saturation data collected at station CHQW during the two-bay
test indicates that the unit spillway discharge is an important causal
parameter in determining the TDG exchange in spillway flows at Chief
Joseph Dam. Similar results were measured in 2007 and 2008 during two-
bay spill tests. A linear relationship between TDG saturation at station
CHQW and unit spillway discharge was apparent over the range of 2 to 40
kcfs/bay.
Increases in TDG saturations between Event 2 and 3 when unit spillway
discharge was held constant at 30 kcfs/bay suggest that spillway trajectory
is an important parameter in determining TDG exchange in spillway flows
at Chief Joseph Dam.
TDG saturations measured downstream decreased with distance from
Chief Joseph Dam as the river approached Wells Dam. Lateral TDG
gradients were present about 7 miles downstream at Transect 2 showing
the continued development of the mixing zone between powerhouse flows
along the left bank and spillway flows on the right bank.
The passage of the spill events at the Wells Dam forebay station
(WELLFB) was not as prominent as for stations located at Transects 1, 2
and 3. Downstream TDG saturations measured at Wells Dam show the
influence of in-river processes such as lateral mixing, tributary dilution
and degassing at the air-water interface.

Chief Joseph Dam 2012 Two Bay Uplift Spill Test: TDG Exchange
September 2012 13 U.S. Army Corps of Engineers
References
Schneider, M.L. 2008. Chief Joseph Dam: Post deflector field investigation of total dissolved
gas exchange during spill over bays 12 and 13. Prepared for the Seattle District Corps of
Engineers by the U.S. Army Engineer Research and Development Center, Vicksburg, MS.
Schneider, M.L. 2012. Total dissolved gas exchange at Chief Joseph Dam: Post spillway deflectors
April 28-May 1, 2009. Prepared for the Seattle District Corps of Engineers by the U.S. Army
Engineer Research and Development Center, Vicksburg, MS.
Schneider, M.L. and Carroll, J.C. 1999. TDG exchange during spillway releases at Chief Joseph
Dam, near-field study, June 6-10, 1999. Prepared for the Seattle District Corps of Engineers by
the U.S. Army Waterways Experiment Station, Vicksburg, MS.
USCOE 1985. Chief Joseph Dam, Columbia River, Washington Water Control Manual. U.S.
Army Corps of Engineers, Seattle District.
USCOE 2010. Corps of Engineers plan of action for dissolved gas monitoring for 2011. North
Pacific Division, Water Management Division, Reservoir Control Center, Water Quality Unit,
Portland, Oregon.
WDNR 2004. The Geology of Washington. Washington Department of Natural Resources, Web
address: http://www.dnr.wa.gov/geology/geolofwa.htm, Olympia, WA.
Weitkamp, D.E. 1980. A review of dissolved gas supersaturation literature. Transactions of the
American Fisheries Society, 109:659-702.
Weitkamp, D.E., Sullivan, R.D., Swant, T., and J. DosSantos. 2002. Gas bubble disease in resident
fish of the Lower Clark Fork River. Report prepared for Avista Corporation by Parametrix, Inc.

Tables

Chief Joseph Dam 2012 Two Bay Uplift Spill Test: TDG Exchange
September 2012 15 U.S. Army Corps of Engineers
Table 1. Summary of total dissolved gas and temperature sampling stations.
Station Name Latitude Longitude Station Description Station Location
T1P1 48.003410 -119.661220 2.1 kilometers downstream of spillway,
lateral transect
Transect 1: 10% distance from
left bank
T1P2 48.003700 -119.660550 2.1 kilometers downstream of spillway,
lateral transect
Transect 1: 30% distance from
left bank
T1P3 48.004080 -119.660190 2.1 kilometers downstream of spillway,
lateral transect
Transect 1: 50% distance from
left bank
T1P4 48.004129 -119.659236 2.1 kilometers downstream of spillway,
lateral transect
Transect 1: 70% distance from
left bank
T1P5 48.004450 -119.658798 2.1 kilometers downstream of spillway,
lateral transect
Transect 1: 90% distance from
left bank
T1P6 48.004743 -119.658694 2.1 kilometers downstream of spillway,
lateral transect
Transect 1: 95% distance from
left bank
T2P1 48.069560 -119.672090 11.2 kilometers downstream of spillway,
lateral transect
Transect 2: 10% distance from
left bank
T2P2 48.069360 -119.670270 11.2 kilometers downstream of spillway,
lateral transect
Transect 2: 50% distance from
left bank
T2P3 48.068830 -119.668460 11.2 kilometers downstream of spillway,
lateral transect
Transect 2: 90% distance from
left bank
T3P1 48.086767 -119.781517 22.5 kilometers downstream of spillway,
Brewster Wa Highway Bridge
Transect 3: 50% distance from
left bank
CHJ 47.993890 -119.645280 Forebay immediately upstream of
powerhouse
Forebay: 5% distance from
left bank
CHQW 48.004720 -119.658330 2.1 kilometers downstream of spillway,
Wells Dam forebay
Transect 1: 95% distance from
left bank
WELLFB 48.947688 -119.863309 46.7 kilometers downstream of spillway,
lateral transect
Forebay: 50% distance from
left bank

Chief Joseph Dam 2012 Two Bay Uplift Spill Test: TDG Exchange
September 2012 16 U.S. Army Corps of Engineers
Table 2. Difference between the primary standard thermometer and the laboratory
calibrated instrument.
Deviation from
Temp Standard
Station Name Date Calibration Type Temp, ºC BP + 0 BP + 300
T1P1 03/23/12 Pre-Deployment 0.1 1 1
T1P2 03/23/12 Pre-Deployment 0.1 1 1
T1P3 03/23/12 Pre-Deployment 0.0 1 0
T1P4 03/23/12 Pre-Deployment -0.1 1 0
T1P5 03/23/12 Pre-Deployment 0.1 1 0
T1P6 03/23/12 Pre-Deployment 0.0 0 0
T2P1 03/23/12 Pre-Deployment 0.0 0 0
T2P2 03/23/12 Pre-Deployment 0.2 1 1
T2P3 03/23/12 Pre-Deployment -0.2 1 0
T3P1 03/23/12 Pre-Deployment 0.0 1 1
CHJ 03/21/12 Pre-Deployment -0.1 1 1
CHQW 03/21/12 Pre-Deployment -0.1 1 1
WELLFB 03/22/12 Pre-Deployment -0.1 0 0
T1P1 03/30/12 Post-Deployment — 0 0
T1P2 03/30/12 Post-Deployment — 1 1
T1P3 03/30/12 Post-Deployment — 1 1
T1P4 03/30/12 Post-Deployment — 0 0
T1P5 03/30/12 Post-Deployment — 2 0
T1P6 03/30/12 Post-Deployment — -1 -1
T2P1 03/30/12 Post-Deployment — 0 0
T2P2 03/30/12 Post-Deployment — 0 0
T2P3 03/30/12 Post-Deployment — 1 1
T3P1 03/30/12 Post-Deployment — 1 1
CHJ 04/06/12 Post-Deployment 0.0 0 0
CHQW 04/06/12 Post-Deployment 0.0 0 0
WELLFB — Post-Deployment — — —
Deviation from TDG
Standard (mm Hg)

Chief Joseph Dam 2012 Two Bay Uplift Spill Test: TDG Exchange
September 2012 17 U.S. Army Corps of Engineers
Table 3. Summary of project operations from March 26 through March 30, 2012.
Starting Date and Time Ending Date and Time
Duration
(hours)
Mean
Spill
(kcfs)
Mean Spill
Per Bay
(kcfs/bay)
Mean
River Flow
(kcfs)
Mean
Powerhouse
Flow (kcfs)
Event
Number Notes
26-Mar-2012 16:00 27-Mar-2012 07:00 15 0 0 145 145 1 Background, non-spill conditions
27-Mar-2012 07:00 27-Mar-2012 23:00 16 60 30 163 103 2 Right bank spill trajectory
27-Mar-2012 23:00 28-Mar-2012 23:00 24 60 30 160 100 3 Left bank spill trajectory
28-Mar-2012 23:00 29-Mar-2012 06:00 7 80 40 167 87 4 Left bank spill trajectory
29-Mar-2012 06:00 30-Mar-2012 09:00 27 18 1 146 128 5 Uniform spill 1 kcfs from 18 bays

Chief Joseph Dam 2012 Two Bay Uplift Spill Test: TDG Exchange
September 2012 18 U.S. Army Corps of Engineers
Table 4. Statistical summary of total dissolved gas pressures in the Columbia River from March 26 to March 30, 2012.
Event Data T1P2 T1P3 T1P4 T1P5 T1P6 T2P1 T2P2 T2P3 T3P1 CHJ CHQW WELLFB
1 Median 745 744 745 743 741 743 758 746 742 743 744 750
Maximum 746 745 746 746 747 744 758 747 747 745 753 753
Minimum 743 743 744 743 741 742 752 746 742 743 743 747
Count 45 45 45 45 45 41 41 41 51 14 14 75
2 Median 792 854 902 923 916 846 863 874 858 744 916 842
Maximum 814 872 912 927 921 856 867 881 865 744 918 843
Minimum 767 823 872 899 911 831 857 863 832 742 908 818
Count 57 57 57 57 57 55 55 55 53 15 15 31
3 Median 770 825 883 938 938 833 849 865 847 742 941 841
Maximum 794 850 899 950 947 847 853 878 859 744 951 844
Minimum 758 803 866 929 928 822 845 856 834 741 931 838
Count 93 93 93 93 93 91 91 91 89 24 24 38
4 Median 802 869 919 969 968 864 870 895 872 742 970 850
Maximum 818 883 929 978 975 871 875 904 880 742 976 851
Minimum 780 851 909 953 957 852 856 885 857 741 963 844
Count 29 29 29 29 29 27 27 27 27 8 8 15
5 Median 743 743 749 778 782 749 753 758 751 743 785 759
Maximum 745 750 761 785 788 754 756 774 761 743 793 766
Minimum 742 742 744 754 767 747 752 756 714 742 761 758
Count 101 101 101 101 101 99 99 99 85 26 26 19

Chief Joseph Dam 2012 Two Bay Uplift Spill Test: TDG Exchange
September 2012 19 U.S. Army Corps of Engineers
Table 5. Statistical summary of total dissolved gas saturations in the Columbia River from March 26 to March 30, 2012.
Event Data T1P2 T1P3 T1P4 T1P5 T1P6 T2P1 T2P2 T2P3 T3P1 CHJ CHQW WELLFB
1 Median 101.6 101.5 101.5 101.3 101.0 101.1 103.1 101.5 100.9 101.6 101.5 101.9
Maximum 101.9 101.9 101.9 102.1 102.2 101.6 103.5 102.0 101.9 102.0 103.1 103.1
Minimum 101.0 101.1 101.2 101.0 100.8 100.9 102.2 101.4 100.5 101.4 101.1 101.7
Count 45 45 45 45 45 41 41 41 51 14 14 75
2 Median 107.5 115.8 122.5 125.4 124.3 114.8 117.1 118.7 116.8 101.5 124.3 114.7
Maximum 110.6 118.5 123.9 126.1 125.4 116.3 117.8 119.7 117.6 101.6 125.0 115.1
Minimum 104.4 112.0 118.8 122.5 123.9 113.3 116.7 117.7 112.9 101.4 123.7 111.7
Count 57 57 57 57 57 55 55 55 53 15 15 31
3 Median 105.0 112.5 120.6 128.0 128.0 113.5 115.9 118.0 115.7 101.7 128.4 115.0
Maximum 108.3 116.0 122.8 129.5 129.4 115.6 116.5 119.9 117.1 101.9 129.5 115.5
Minimum 103.6 109.8 118.4 126.7 126.6 112.3 115.4 116.9 114.0 101.2 127.2 114.7
Count 93 93 93 93 93 91 91 91 89 24 24 38
4 Median 109.2 118.3 125.1 132.0 131.8 117.8 118.5 122.1 119.0 101.5 132.1 116.9
Maximum 111.4 120.3 126.5 133.2 132.7 118.6 119.3 123.1 120.3 101.6 132.8 117.2
Minimum 106.1 115.8 123.7 129.7 130.2 115.9 116.5 120.4 116.7 101.3 131.0 116.2
Count 29 29 29 29 29 27 27 27 27 8 8 15
5 Median 102.2 102.3 103.0 106.9 107.6 103.0 103.5 104.2 103.4 102.4 108.0 103.8
Maximum 102.6 103.3 104.8 108.1 108.1 103.4 104.1 105.8 104.6 102.6 108.7 105.1
Minimum 101.2 101.2 101.5 102.9 104.7 102.4 103.0 103.7 98.0 101.7 103.8 103.5
Count 101 101 101 101 101 99 99 99 85 26 26 19

Chief Joseph Dam 2012 Two Bay Uplift Spill Test: TDG Exchange
Figures

Chief Joseph Dam 2012 Two Bay Uplift Spill Test: TDG Exchange
September 2012 21 U.S. Army Corps of Engineers
Figure 1. Location of the study area within the Columbia River watershed.

Chief Joseph Dam 2012 Two Bay Uplift Spill Test: TDG Exchange
September 2012 22 U.S. Army Corps of Engineers
Figure 2. TDG and temperature monitoring stations downstream of Chief Joseph Dam to Wells Dam.
Wells Dam
Chief Joseph
Dam
CHJ
CHQW
T1P1-6
T2P1-3
WELFB
10 Kilometers
North
Real Time TDG Station
TDG Logger
T3P1

Chief Joseph Dam 2012 Two Bay Uplift Spill Test: TDG Exchange
September 2012 23 U.S. Army Corps of Engineers
Figure 3. TDG and temperature monitoring stations upstream and downstream of Chief Joseph Dam.
CHJ
North
500 Meters
Real Time TDG Station
TDG Logger

Chief Joseph Dam 2012 Two Bay Uplift Spill Test: TDG Exchange
September 2012 24 U.S. Army Corps of Engineers
Figure 4. TDG and temperature monitoring stations at Transect 1 below Chief Joseph Dam.
150 Meters
North
Real Time TDG Station
TDG Logger

Chief Joseph Dam 2012 Two Bay Uplift Spill Test: TDG Exchange
September 2012 25 U.S. Army Corps of Engineers
Figure 5. TDG and temperature monitoring stations at Transect 2 below Chief Joseph Dam.
North
150 Meters Real Time TDG Station
TDG Logger
T2
P1
T2
P2
T2
P3

Chief Joseph Dam 2012 Two Bay Uplift Spill Test: TDG Exchange
September 2012 26 U.S. Army Corps of Engineers
Figure 6. TDG and temperature monitoring stations at Transect 3 below Chief Joseph Dam.
North
300 Meters TDG Logger
T3P1Columbia River

Chief Joseph Dam 2012 Two Bay Uplift Spill Test: TDG Exchange
September 2012 27 U.S. Army Corps of Engineers
Figure 7. Right bank spill trajectory (top photo) vs. left bank spill trajectory (bottom
photo) during 30 kcfs/bay spillway release.
Chief Joseph Dam 2012 Two Bay Uplift Spill Test: TDG Exchange
September 2012 28 U.S. Army Corps of Engineers
Figure 8. Chief Joseph Dam tailwater elevations during spillway operations.
Chief Joseph Dam 2012 Two Bay Uplift Spill Test: TDG Exchange
September 2012 29 U.S. Army Corps of Engineers
Figure 9. Chief Joseph Dam forebay temperature profiles in March and April 2012.
Chief Joseph Dam 2012 Two Bay Uplift Spill Test: TDG Exchange
September 2012 30 U.S. Army Corps of Engineers
Figure 10. Time history of Columbia River temperatures at Transect 1.

Chief Joseph Dam 2012 Two Bay Uplift Spill Test: TDG Exchange
September 2012 31 U.S. Army Corps of Engineers
Figure 11. Time history of Columbia River TDG saturations immediately downstream of Chief Joseph Dam measured at
Transect 1.

Chief Joseph Dam 2012 Two Bay Uplift Spill Test: TDG Exchange
September 2012 32 U.S. Army Corps of Engineers
Figure 12. Time history of Columbia River TDG saturations immediately downstream of Chief Joseph Dam measured at
Transect 1 showing left bank vs. right bank spill trajectory.

Chief Joseph Dam 2012 Two Bay Uplift Spill Test: TDG Exchange
September 2012 33 U.S. Army Corps of Engineers
Figure 13. Expanded scale of time history of Columbia River TDG saturations immediately downstream of Chief Joseph Dam
measured at Transect 1 showing left bank vs. right bank spill trajectory.

Chief Joseph Dam 2012 Two Bay Uplift Spill Test: TDG Exchange
September 2012 34 U.S. Army Corps of Engineers
Figure 14. Unit spillway discharge vs. TDG saturations for two bay spill events in 2007, 2008, and 2012.

Chief Joseph Dam 2012 Two Bay Uplift Spill Test: TDG Exchange
September 2012 35 U.S. Army Corps of Engineers
Figure 15. Time history of Columbia River TDG saturations as measured downstream of Chief Joseph Dam from Transect T2
to Wells Dam.