chi-med presentation 20160425 30min db-baml · led revlimid & pomalyst global developmen t in...
TRANSCRIPT

Company overview
AIM/Nasdaq:HCM May 2016 Healthcare Conference

Safe harbor statement & disclaimerThis presentation includes statements that are, or may be deemed to be, "forward-looking statements.” These statements are made under the “safe harbor” provisions of the U.S. Private SecuritiesLitigation Reform Act of 1995. These forward-looking statements can be identified by the use of forward-looking terminology, including terms "believes," "estimates," "anticipates," "projects,""expects," "intends," "may," "will," "seeks," or "should" or, in each case, their negative or other variations or comparable terminology, or by discussions of strategy, plans, objectives, goals, futureevents or intentions. These forward-looking statements include all matters that are not historical facts. They include statements regarding Chi-Med's intentions, beliefs or current expectationsconcerning, among other things, Chi-Med's results of operations, financial conditions, research and clinical trials programs, licensing programs, liquidity, prospects, growth, strategies and theindustries in which Chi-Med operates. By their nature, forward-looking statements involve risks and uncertainties because they relate to events and depend on circumstances that may or may notoccur in the future. Forward-looking statements are not guarantees of future performance. Chi-Med's actual results of operations, financial conditions and liquidity, the development of Chi-Med'sresearch and clinical trial programs and the development of the industry in which Chi-Med operates, may differ materially from those suggested or which may be implied by the forward-lookingstatements contained in this presentation. In addition, even if Chi-Med's results of operations, financial conditions and liquidity, the development of Chi-Med's research and clinical trials programs,and the development of the industry in which Chi-Med operates, are consistent with the forward-looking statements contained in this presentation, those results or developments may not beindicative of results or developments in subsequent periods. Numerous factors, including those related to market conditions and those detailed from time-to-time in Chi-Med’s filings with the U.S.Securities and Exchange Commission and on AIM, may cause Chi-Med’s results to differ materially from those anticipated in these forward-looking statements. Many of the factors that willdetermine Chi-Med’s future results are beyond the ability of Chi-Med to control or predict. In light of those risks, uncertainties and assumptions, the events described in the forward-lookingstatements in this presentation may not occur, and Chi-Med cautions you not to place undue reliance on these forward-looking statements. Unless required by applicable law, Chi-Med undertakesno obligation to revise or update any forward-looking statements, or to make any other forward-looking statements, whether as a result of new information, future events or otherwise. Allwritten and oral forward-looking statements attributable to Chi-Med or to the persons acting on Chi-Med's behalf including its advisors and representatives are expressly qualified in their entiretyby the cautionary statements referred to above and contained elsewhere in this presentation.
Nothing in this presentation or in any accompanying management discussion of this presentation constitutes, nor is it intended to constitute or form any part of: (i) an invitation or inducement toengage in any investment activity, whether in the United States, the United Kingdom or in any other jurisdiction; (ii) any recommendation or advice in respect of any securities of Chi-Med; or(iii) any offer for the sale, purchase or subscription of any securities of Chi-Med.
No representation or warranty, express or implied, is made as to, and no reliance should be placed on, the fairness, accuracy, completeness or correctness of the information, or opinions containedherein. Neither Chi-Med, nor any of Chi-Med’s advisors or representatives shall have any responsibility or liability whatsoever (for negligence or otherwise) for any loss howsoever arising from anyuse of this presentation or its contents or otherwise arising in connection with this presentation. The information set out herein may be subject to updating, completion, revision, verification andamendment and such information may change materially.
All references to “Chi-Med” as used throughout this presentation refer to Hutchison China MediTech Limited and its subsidiaries. This presentation should be read in conjunction with Chi-Med's finalresults for the year ended 31 December 2015, copies of which are available on Chi-Med's website (www.chi-med.com).
2

VisionTwo main platforms converging towards vision
Over 3,200-person China sales team – clear focus on Prescription Drugs business (~1,900 medical reps).
Ready to rapidly commercialise Innovation Platform drugs once approved in China.
Cash flow positive w/ net income attributable to Chi-Med equity holders of >$25m in 2015.
Commercial Platforman extensive commercial network in
China pharma
8 clinical drug candidates in 22 studies worldwide.
Many with global first-in-class or best-in-class as well as Breakthrough Therapy potential.
First drug candidates targeted for possible NDA submissions late 2016.
>290-person R&D team.
Innovation Platformsmall molecule targeted therapies in
oncology & immunology
A globally-focused innovative biopharmaceutical company based in China
3

Experienced pharma management team
Management team comprised mainly of returnees averaging ~20 years in multinational pharma & biotech.
Scientific leadership have participated in the discovery & development of global blockbusters.
4
POSITIONEXPERIENCE (yrs)Industry/Chi-Med
ROLE / BACKGROUND
CHRISTIAN HOGG, BSc, MBAChief Executive Officer
27 / 16Led all aspects of the creation, implementation & management of Chi-Med’s strategy, business & IPOs since 2000 start - incl. AZ, Lilly, Nestlé deals & est. of pharma business.
WEIGUO SU, PHDEVP, Chief Scientific Officer
26 / 11Created Chi-Med’s R&D strategy, innovation platform & led all pipeline discovery; Director of Med Chem at Pfizer; Harvard Ph.D./post-doc under Nobel Laureate E. J. Corey.
JOHNNY CHENG, BEc, CAChief Financial Officer
26 / 7Former VP, Finance at BMS China; 8 years with Nestlé China heading finance & control in multiple businesses; KPMG & PWC in Australia & Beijing.
YE HUA, MD, MPH SVP, Clinical & Regulatory Affairs
17 / 2Led Revlimid & Pomalyst global development in multiple myeloma; 15 yrs of global registrations incl. Humira, Zometa, Reclast, Femara, Cardioxane, Proleukin.
ZHENPING WU, PHD, MBASVP, Pharmaceutical Sciences
22 / 8Leads all CMC development & manufacturing for Chi-Med’s pipeline; Sr Director of PS at Phenomix; Director of Pharma Development at Pfizer San Diego; at Roche in Palo Alto.
MAY WANG, PHDSVP, Bus. Dev. & Strategic Alliances
21 / 5Leads alliance mgmt & BD for Chi-Med; long career in research, primarily biology, strategic alliance management, partnering & business development with Eli Lilly.
MARK LEE, BEng, MBASVP, Corp. Finance & Development
16 / 6Focuses on strategic management, overall corporate operations & alliance support; Former US/UK banker advising & raising capital for major pharma & biotech.

Innovation PlatformNear term: Driving for first product launches
Mid-longer term: Building a pipeline for future growth
5

Exceptional scale for pre-approval biotech15 years with approx. $330m invested to-date
6
Large-scale fully integrated in house platform chemistry, biology, pharmacology, DMPK, tox., CMC, C&R, and translational organizations working together seamlessly and continuously.
China clinical speed major unmet medical needs (3.4 million new cancer patients / year[2]), rapid development and regulatory support. Allows for study of multiple indications, PoC in China.
Competitive costs overall clinical costs, particularly pre-PoC, a fraction of US or Europe.
Constancy of purpose 15 years with continuous financial support.
[1] Headcount as of 31 January 2016; Chem. = Chemistry; DMPK = Drug, Metabolism, & Pharmacokinetics; Tox. = Drug Safety Evaluation; PS = Pharmaceutical Science (CMC); Mfg = Manufacturing; Reg. = Regulatory; BD = Business Development; [2] Frost & Sullivan.
One of the leading China-based innovators in oncology & immunology
OUR ADVANTAGES290 SCIENTISTS & STAFF[1]
183 with advanced technical degrees21 M.D.s48 doctorate degrees
Medicinal Chem. 17%
Biology 7%
Pharmacology8%
DMPK 6%
Tox. 2%
Analytical Chem. 8%
Process Chem. 7%
Formulation 6%
Other PS 3%
Mfg. 13%
Clinical & Reg. 10% BD & Corp/
Admin 11%

Chemistry is our edgeSuperior small molecules w/ global first-in-class or best-in-class potential
Focus on kinase selectivity No off-target kinase inhibition means compound is more
potent, attains better target coverage and is less toxic. Combinability – clean compounds allow for combinations
with other TKIs, immuno-therapy and chemotherapy agents.
Fragment-based design of NCEs[1]
We have internally created/designed all our drug candidates.
7
>90%
70~90%
40~70%
<40%
Inhibition at 1 µM
E.g. fruquintinib: designed to only inhibit VEGFR 1/2/3
E.g. savolitinib: designed to eliminate potential kidney tox.
E.g. Use of co-crystal structuresFocus on small molecules interactions with kinases
Optimize binding to on-target protein, for potency.
Minimize binding to off-target proteins for selectivity.
Lilly SGX-523 Novartis/Incyte INC-280
Pfizer PF-04217903 Janssen JNJ-38877605
savolitinib
2-quinolinone metabolite in humans in 1st gen c-Met compounds has dramatically reduced solubility and appeared to crystallize in the kidney resulting in obstructive toxicity. [2]
[1] Novel Chemical Entities; [2] Diamond, S.; et. al.: Species-specific metabolism of SGX523 by aldehyde oxidase, Drug Metabolism and Disposition, 2010, 38, 1277-85.
Screening at 1µM against 253 KinasesSource: Sun et al., Cancer Biology & Therapy
15:12, 1635--1645; December 2014.

Program Target Partner Study number/Indication Status Line Target patient Combo therapy Site Preclin. Ph.I Proof-of-concept Ph.III
Savolitinib (AZD6094 / volitinib)
c-Met
1. Papillary renal cell carcinoma (A) report interim data in 2016 1st All Global *2. Papillary renal cell carcinoma (P) start Ph. Ib H1 2016 - All immunotherapy UK *3. Clear cell renal cell carcinoma (P) start Ph. Ib H1 2016 2nd VEGF TKI ref. UK *4. Clear cell renal cell carcinoma (P) start Ph. Ib H1 2016 2nd VEGF TKI ref. immunotherapy UK *5. Non-small cell lung cancer (A) enrolling 2nd EGFR TKI ref. Tagrisso® (T790M) Global *6. Non-small cell lung cancer (A) enrolling 3rd EGFR/T790M TKI Tagrisso® (T790M) Global *7. Non-small cell lung cancer (A) enrolling 2nd EGFR TKI ref. Iressa® (EGFR) China *8. Non-small cell lung cancer (A) enrolling 1st c-Met O/E China *9. Gastric cancer (A) enrolling - c-Met+ China *10. Gastric cancer (A) enrolling - c-Met O/E China *11. Gastric cancer (A) enrolling - c-Met+ docetaxel (chemo) China *12. Gastric cancer (A) enrolling - c-Met O/E docetaxel (chemo) China *
Fruquintinib[1] VEGFR 1/2/314. Colorectal cancer (A) enrolling 3rd All China *15. Non-small cell lung cancer (A) report full data 2016 3rd All China n/a *16. Gastric cancer (A) enrolling 2nd All paclitaxel (chemo) China *
SulfatinibVEGFR/ FGFR1
17. Neuroendocrine tumors (A) Ph. Ib/II enrol. complete 1st All China *17a. Pancreatic NET (P) enrolling 1st All China *17b. Non-pancreatic NET (A) enrolling 1st All China *
18. Neuroendocrine tumors (A) enrolling 2nd All US *19. Thyroid cancer (A) enrolling 2nd Radiotherapy ref. China *
HMPL-523 Syk20. RA, MS, lupus (A) Ph. I complete – All Aus *21. Hematological cancers (A) enrolling 2nd/3rd All Aus *
Epitinib EGFRm+ 22. Non-small cell lung cancer (A) enrolling 1st EGFRm+ brain mets China *Theliatinib EGFR WT 23. Esophageal, solid tumors (A) enrolling 1st EGFR wild-type China *HMPL-689 PI3Kδ 24. Hematological cancers (P) enrolling 2nd/3rd All Aus *
HMPL-004NF-κB
(TNF-α, etc)
Ulcerative colitis (Mild-mod. induction) under internal review 2nd 5ASA ref. 5ASA Global n/a *Ulcerative colitis (Mild-mod. mainten.) under internal review 2nd 5ASA ref. 5ASA Global n/a *Crohn's disease under internal review 1st All Global n/a *
HMPL-453 FGFR1/2/3 Solid tumors IND submitted 1st All – *Research Novel Inflammation ongoing 1st All – *
25 clinical trials by mid-201615 possible Breakthrough Therapy indications and 8 combination studies
8
Oncology Immunology
Notes: (A) = active clinical trial; (P) = planned clinical trial; * = when an NDA submission is possible based on the receipt of favorable clinical data; Proof-of-concept = Phase Ib/II study (the dashed lines delineate the start and end of Phase Ib); combo = in combination with; brain mets = brain metastasis; VEGF = vascular endothelial growth factor; TKI = tyrosine kinase inhibitor; EGFR = epidermal growth factor receptor; NET = neuroendocrine tumors; ref = refractory, which means resistant to prior treatment; T90M= EGFR resistance mutation; EGFRm+ = epidermal growth factor receptor activating mutations; EGFR wild-type = epidermal growth factor receptor wild-type; 5ASA = 5-aminosalicyclic acids; chemo = chemotherapy; c-Met+ = c-Met gene amplification; c-Met O/E = c-Met over-expression; MS = Multiple Sclerosis; RA = Rheumatoid Arthritis; Aus = Australia; UK = United Kingdom; US = United States; EU = Europe; Global = >1 country.[1] Clinical study #13 is omitted because it has been recently completed.
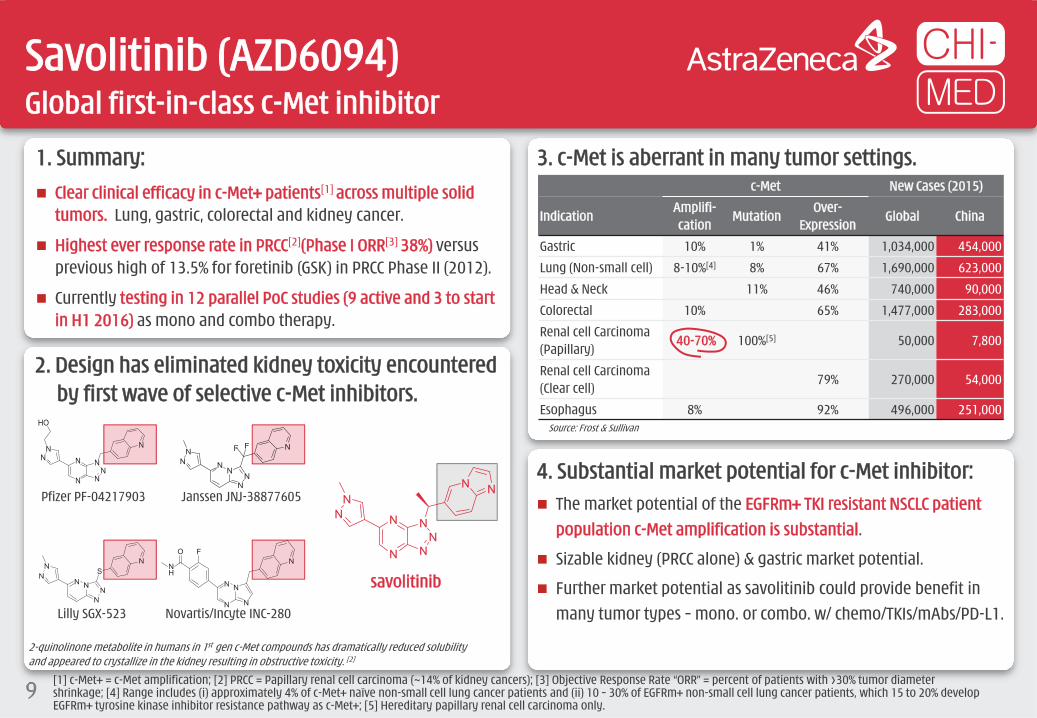
1. Summary: Clear clinical efficacy in c-Met+ patients[1] across multiple solid
tumors. Lung, gastric, colorectal and kidney cancer.
Highest ever response rate in PRCC[2](Phase I ORR[3] 38%) versus previous high of 13.5% for foretinib (GSK) in PRCC Phase II (2012).
Currently testing in 12 parallel PoC studies (9 active and 3 to start in H1 2016) as mono and combo therapy.
3. c-Met is aberrant in many tumor settings.c-Met New Cases (2015)
IndicationAmplifi-cation
MutationOver-
ExpressionGlobal China
Gastric 10% 1% 41% 1,034,000 454,000
Lung (Non-small cell) 8-10%[4] 8% 67% 1,690,000 623,000
Head & Neck 11% 46% 740,000 90,000
Colorectal 10% 65% 1,477,000 283,000
Renal cell Carcinoma (Papillary)
40-70% 100%[5] 50,000 7,800
Renal cell Carcinoma (Clear cell)
79% 270,000 54,000
Esophagus 8% 92% 496,000 251,000
Savolitinib (AZD6094)Global first-in-class c-Met inhibitor
9
4. Substantial market potential for c-Met inhibitor: The market potential of the EGFRm+ TKI resistant NSCLC patient
population c-Met amplification is substantial.
Sizable kidney (PRCC alone) & gastric market potential.
Further market potential as savolitinib could provide benefit in many tumor types – mono. or combo. w/ chemo/TKIs/mAbs/PD-L1.
2. Design has eliminated kidney toxicity encountered by first wave of selective c-Met inhibitors.
Lilly SGX-523 Novartis/Incyte INC-280
Pfizer PF-04217903 Janssen JNJ-38877605
savolitinib
2-quinolinone metabolite in humans in 1st gen c-Met compounds has dramatically reduced solubility and appeared to crystallize in the kidney resulting in obstructive toxicity. [2]
Source: Frost & Sullivan
[1] c-Met+ = c-Met amplification; [2] PRCC = Papillary renal cell carcinoma (~14% of kidney cancers); [3] Objective Response Rate “ORR” = percent of patients with >30% tumor diameter shrinkage; [4] Range includes (i) approximately 4% of c-Met+ naïve non-small cell lung cancer patients and (ii) 10 – 30% of EGFRm+ non-small cell lung cancer patients, which 15 to 20% develop EGFRm+ tyrosine kinase inhibitor resistance pathway as c-Met+; [5] Hereditary papillary renal cell carcinoma only.

[1] c-Met+ = c-Met amplification; [2] ORR = percent of patients with >30% tumor diameter shrinkage; [3] DCR = percent of patients with tumor diameter growth <20%.
Savolitinib (AZD6094)Highest ever response rate seen in c-Met+ kidney cancer patients[1]
10
5. Kidney cancer -- Papillary Renal Cell Carcinoma (PRCC).
-100%
-80%
-60%
-40%
-20%
0%
20%
40%
60%
Best
per
cent
age
chan
ges v
s. ba
selin
e (%
)
Objective Response Rate[2]: 38% Disease Control Rate[3]: 75%
Chromosome7 gainFocal Met Gene gainNo changes (Chr/FM)
2017 MET 7 (concomitant lesions)
0 10 20 30 40 50 60 70 80 90 100Weeks on treatment
6. Phase I data gradual & durable response in c-Met+ patients.
PRCC is ~14% of ~366,000/yr. new kidney cancer cases.
There are no current approved treatments for PRCC.
Global Phase II PRCC study started May 2014. Completed enrollment in Oct 2015.
Chance for US NDA submission by end of 2016, subject to supportive Phase II data and potential Breakthrough Therapy designation.
3007 MET 2 1008 MET 4
1010 MET 3
1007 MET 2
2011 MET 23005 MET 4
2007 MET 6
60%
40%
20%
0%
-20%
-40%
-60%
-80%
Line by patient ID
Color by copy number
MET 10MET 2MET 3MET 4MET 6MET 7
Baseline
>24 mo.

7. EGFRm+ TKI[1] resistant NSCLC[2][3].
Savolitinib (AZD6094)Combinations likely the answer. >$1 billion in c-Met+ NSCLC
1.7 million NSCLC patients per year
SCLC / Unknown21%
EGFRm+30%
Kras15%
$2.1b 2015 sales
Treatment Naive NSCLC
Days on study
(US$ millions unless otherwise stated)
Tum
or V
olum
e (m
m3 )
Days on study
Savolitinib + Tagrisso®
Savolitinib + Iressa®
Tum
or V
olum
e (m
m3 )
EGFR TKI RESISTANT, T790M-, C-MET+ Prolonged tumor growth
suppression via combining savolitinib with Iressa® (gefitinib) orTagrisso® (AZD9291).
EGFR TKI RESISTANT, T790M+, C-MET+ Prolonged and total
tumor growth suppression via combining savolitinib & Tagrisso®.
8. Clear pre-clinical data shows combination potential in EGFR TKI resistant NSCLC.
Vehicle
Tagrisso®
Iressa®
Savolitinib1,500
1,000
500
010 13 15 17 20 22 24 27 29 31 34 36 38 41 43 45 48 50 52 55
1,000
800
600
400
200
00 20 40 60 80 100 120
Vehicle
Savolitinib
Tagrisso®
Savolitinib + Tagrisso®
T790M+45%
c-MET+ / T790M-~10%
100% resistance to TKIs – Iressa®
& Tarceva®[1]
EGFR TKI resistancemechanisms in NSCLC
SCLC / Unknown21%
>$3.0b Est. peak sales
>$1.0b Est. peak sales
11 [1] EGFR TKIs = Epidermal Growth Factor Receptor Tyrosine Kinase Inhibitors including gefitinib = Iressa®; erlotinib = Tarceva®; AZD9291/osimertinib = Tagrisso®; [2] NSCLC = Non-small cell lung cancer (~85% of all lung cancer); [3] Frost & Sullivan.
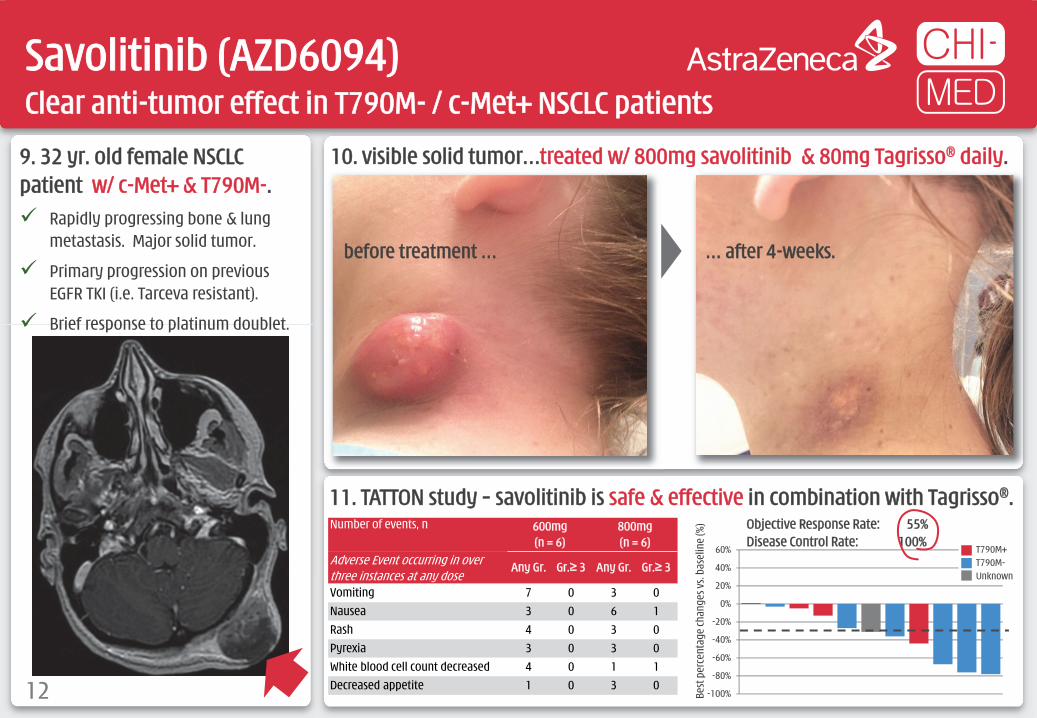
9. 32 yr. old female NSCLC patient w/ c-Met+ & T790M-. Rapidly progressing bone & lung
metastasis. Major solid tumor.
Primary progression on previous EGFR TKI (i.e. Tarceva resistant).
Brief response to platinum doublet.
10. visible solid tumor…treated w/ 800mg savolitinib & 80mg Tagrisso® daily.
-100%
-80%
-60%
-40%
-20%
0%
20%
40%
60% T790M+T790M-Unknown
Objective Response Rate: 55% Disease Control Rate: 100%
Best
per
cent
age
chan
ges v
s. ba
selin
e (%
)
11. TATTON study – savolitinib is safe & effective in combination with Tagrisso®.
Savolitinib (AZD6094)Clear anti-tumor effect in T790M- / c-Met+ NSCLC patients
12
Number of events, n 600mg (n = 6)
800mg (n = 6)
Adverse Event occurring in over three instances at any dose
Any Gr. Gr.≥ 3 Any Gr. Gr.≥ 3
Vomiting 7 0 3 0Nausea 3 0 6 1Rash 4 0 3 0Pyrexia 3 0 3 0White blood cell count decreased 4 0 1 1Decreased appetite 1 0 3 0
before treatment … … after 4-weeks.

HMPL-523Potential first-in-class Syk inhibitor in immunology – Phase II in planning
13
2. RA expected to be a $45 billion market in 2020 with B-cell pathway; anti-TNF; & JAK the main focus.
3. Substantial market potential remains in RA. mAbs intravenous administration and shut down immune
system for 4-6 weeks – high infection / lymphoma risks.
First-in-class JAKs in RA limited by compound-related toxicity.
Syk inhibition shown to benefit patients – but fostamatinib failed due to major off-target toxicity.
1. Syk, the most upstream B-cell pathway kinase target, is clinically validated in rheumatoid arthritis (“RA”), but currently Chi-Med & Gilead are the only companies pursuing.
P
P
P
PP
PLYN
SYK
BTK
B-Cell Receptor
CD79
Cell Membrane
PLCɣ2
PKCβ
NF-κB
A BAKT
mTORPI3Kδ
PIP2 PIP3
P
Pro-inflammatory cytokines
GS-9876
Fostamatinib
[1] Approved drug = ®; All other clinical candidates: mAb = antibody (extracellular); small molecule (intracellular); [2] 2014 sales in immunology only.
IKK
Humira®
Rituxan®
Legend [1]
Immunology (Imm.)
TNFα
JAK2
JAK1
STATP
STATP
Xeljanz®
Baricitinib
Filgotinib
ABT-494
(Methotrexate-IR: placebo adjusted)ACR20 ACR50 ACR70
2014 Sales ($billion) [2]
B-Cell receptor -- mAbsRituxan® (24-Week) 33% 21% 11% 1.4Anti-TNFα/NF-κB -- mAbsHumira® (24-Week) 33% 29% 18% 12.5Remicade® (24-Week) 30% 22% 8% 9.2Enbrel® (24-Week) 44% 36% 15% 8.5JAK Inhibitors -- Small moleculesXeljanz® (24-Week) 25% 23% 13%
0.3Xeljanz® (12-Week) 28% 21% 8%baricitinib 4mg QD (12-Week) 30% 28% 14% n/afilgotinib 100mg BID (12-Week) 35% 40% 23% n/aABT-494 24mg QD (12-Week) 32% 24% 18% n/aSyk Inhibitor -- Small moleculefostamatinib 100mg BID (24-Week) 32% 24% 18% n/a
IL-6 Receptor
TNFα Receptor
TNF receptorassociated
factors (TRAFs)
Remicade®
Enbrel®
HMPL-523
Hematological Cancer (Onc.)

5. HMPL-523 – far superior selectivity to fostamatinib…………and very strong efficacy in preclinical RA models.
[1] RA = Rheumatoid Arthritis; [2] QD = one dose per day; BID = two doses per day; QOD = one dose every other day; PO = by mouth (i.e. orally); IP = by Intraperitoneal injection; Naïve = model score without induced arthritis; [3] Fostamatinib is a prodrug of the SYK inhibitor R406 - Phase II study data per N ENGL J MED 363;14; *: HMPL data and Eun-ho Lee, 2011; ** Birth Defects Research (Part A) 2009, 85: 130-6.
HMPL-523Superior selectivity, better target coverage & efficacy vs. fostamatinib
14
Selectivity HMPL-523 IC50 (nM) fostamatinib IC50 (nM)
Syk enzyme 25 ± 5 (n=10)* 54 ± 16 (n=10)*
JAK 1,2,3 enzyme >300, >300, >300* 120, 30, 480*
FGFR 1,2,3 >3,000, >3,000, >3,000 89, 22, 32*
FLT3 enzyme 63* 9*
LYN enzyme 921* 160*
Ret enzyme >3,000* 5**
KDR enzyme 390 ± 38 (n=3)* 61 ± 2 (n=3)*
KDR cell 5,501 ± 1,607 (n=3)* 422 ± 126 (n=3)*
ACR50 ACR70
4. Fostamatinib good Phase II[3] RA dose response… …but GI toxicity, infection & 23% put on antihypertensives.
Patie
nts (
%)
Patie
nts (
%)
Month Month
100mg twice daily
150mg once daily
Placebo
100mg twice daily
150mg once daily
† P < 0.05 for comparison with placebo group; ALT = alanine aminotransferase.
Placebo
-1
4
9
14
19
pH2.1 HCl 1 3 10 30 10 MPK,QOD IP
10 MPK,BID, PO
Naïve Vehicle HMPL-523 (MPK, QD, PO) Enbrel Fosta.
Sum
of R
at A
nkle
Hist
opat
holo
gy sc
ores
Percent of patientsPlacebo (n = 153)
150mg QD (n = 152)
100mg BID (n = 152)
Diarrhea 3.0% 11.8% † 19.1% †Upper respiratory infection 7.1 7.2 14.5 †Urinary tract infection 4.6 3.3 5.9Nausea 4.6 5.9 4.6Neutropenia 0.7 6.6 † 5.9 †Headache 5.2 6.6 5.9Abdominal pain 2.6 6.6 † 5.9 †ALT >3x ULN 2.0 3.9 3.9Dizziness 2.0 2.6 4.6Hypothyroidism 2.6 2.6 3.3Cough 2.6 2.0 3.3

1. The B-cell signaling is critical in hematological cancerwith three breakthrough therapies recently approved. Sales in 2015 of Imbruvica® were $1.3 billion; Zydelig® $0.1 billion;
Jakafi® $0.6 billion; & Rituxan® $5.9 billion[2].
P
P
P
PP
PLYN
SYK
BTK
B-Cell Receptor
CD79
Cell Membrane
PLCɣ2
PKCβ
NF-κB
A BAKT
mTORPI3Kδ
PIP2 PIP3
P
Imbruvica®
Pro-inflammatory cytokines
Entospletinib Zydelig®
Jakafi®
[1] ASH = American Society of Hematology; [2] Rituxan® 2015 sales in oncology only; [3] chronic lymphocytic leukemia (“CLL”) & small lymphocytic lymphoma (“SLL”); [4] CYP3A4, CYP2D6 and CYP 1A2; [5] Approved Drug = ®; All others are clinical candidates.
IKK
Rituxan®
Legend [5]
Hematological Cancer (Onc.)
Immunology (Imm.)
TNFα
JAK2
JAK1
STATP
STATP
HMPL-523Syk exciting target emerging in oncology – Lymphoma Phase I ongoing
15
IL-6 Receptor
TNFα Receptor
TNF receptorassociated
factors (TRAFs)
HMPL-523 HMPL-689
2. Entospletinib ASH[1] Dec 2015 data – 65% Nodal Response Rate in CLL & SLL[3].
3. Entospletinib potential for overcoming resistance to Zydelig® (PI3Kδ) & Imbruvica® (BTK).
TAK-659
4. Entospletinib not a perfect compound. Poor solubility/oral absorption & high variation in drug exposure. Some CYP[4] inhibition & increased risk of drug-drug interaction.
Entospletinib in B-cell malignancies
Best
Cha
nge
in S
PD fr
om B
asel
ine
(%)
Best
Cha
nge
in S
PD fr
om B
asel
ine
(%)
Nodal response rate: 44.4% (95% CI 13.7‒78.8%)
Sharman et al, “Phase 2 Trial of Entospletinib, a Selective Syk Inhibitor, in Chronic Lymphocytic Leukemia and Small Lymphocytic Lymphoma” and “Clinical Activity of Entospletinib, a Selective Syk Inhibitor, in Patients With Chronic Lymphocytic Leukemia Previously Treated With an Inhibitor of B-Cell Receptor Pathway Signaling”, ASH Meeting 2015.
Acalabrutinib

[1] Among small molecule tyrosine kinase inhibitors and to the best of Chi-Med’s knowledge.PR = Partial Response; DCR = Disease Control Rate.
FruquintinibThe most selective VEGFR inhibitor in clinical trials globally[1]
16
>90%
70~90%
40~70%
<40%
Inhibition at 1 µM
Screening at 1µM against 253 Kinases
1. Designed to only inhibit VEGFR 1,2, 3...
Day=14, 6mg QD
Day=14, 5mg QD
Day=14, 4mg QD
Day=14, 2mg QD
Day=28, 2mg QD
Time (h)
Plas
ma
Conc
entr
atio
n (n
g/m
L)
0 3 6 9 12 15 18 21 24
EC80 (>80% pVEGFR inhibition)
EC50 (>50% pVEGFR inhibition)
600
500
400
300
200
100
Sutent® (sunitinib) Nexavar® (sorafenib) Stivarga® (regorafenib) Tivozanib Fruquintinib
Kinase profileVEGFR1,2,3, PDGFRβ, FLT3, CSF-1R, c-Kit, Ret
RAF, VEGFR2, PDGFRβ, Flt3, c-Kit, FGFR1
VEGFR1,2,3, Raf, Ret, c-Kit, PDGFR
VEGFR1,2,3, BRK, PDGFRα, PDGFRβ, c-Kit, Tie2, EphB2
VEGFR1,2,3
AUC at ED50/ED60 in mouse (ng/mL*hr) 2,058 25,473 na 1,640 898
MTD in human (mg/day) 50, qd 400, bid 160, qd 1.5, qd 4, qd; 6, 3wk/1wk
AUC, 0~24h at Steady state MTD (ng/mL*hr) 592 47,780 x2 (D28) 58,270 (D21) 1,180 (D28) 5,000~6,000 (D28)
Efficacy in Phase I22 patientsPR: 4 (18%), DCR: 27%
45 patients (≥100 mg bid)PR: 1 (2%), DCR: 58%
53 patientsPR: 3 (6%), DCR: 66%
37 evaluable patientsPR: 1 (3%) DCR: 51%
34 evaluable patientsPR: 13 (38%), DCR: 82%
2. Selectivity and potency superior to competitor drugs.
...limits off-target toxicity & allows for full & sustained target inhibition.

[1] Objective Response Rate (“ORR”) = patients with >30% tumor diameter shrinkage; [2] Disease Control Rate (“DCR”) = % patients with <20% tumor diameter growth; [3] PoC = proof of concept; [4] CRC = colorectal cancer; [5] CTA = Clinical Trial Application; [6] Objective Response Rate (“ORR”) = patients with >30% tumor diameter shrinkage; Disease Control Rate (“DCR”) = % patients with <20% tumor diameter growth; Progression Free Survival (“PFS”) = % of patients with <20% tumor diameter growth at 16 weeks; Overall Survival (“OS”) = % patients alive at 9 months.
FruquintinibBest-in-class VEGFR inhibitor
17
4. Led to fast development in China … Partnered with Lilly (Oct-2013) to provide
resource for PoC[3] in multiple tumor types.
Proceeded to Phase Ib CRC[4] study while we waited for Phase II/III CTA[5] approval in China.
China PoC driving global development plan.
3. Leading to outstanding Phase Ia tumor response …
26%
17%
16%*
8% 8% 6%*
-1%
-3%
-4%* -5%
-7%
-12%
-15%
*-1
5%-1
5%-1
7%-1
8%-1
9%-2
1%-2
1%-3
1%-3
2%-3
3%-3
4%-3
4%-3
5%-3
8%-4
0%-4
1%-4
3%-4
7%-5
9%**
-69%
-100
%
-100%
-80%
-60%
-40%
-20%
0%
20%
40%
% ch
ange
in ta
rget
lesio
ns tu
mor
vo
lum
e fro
m b
asel
ine
Objective Response Rate: 38%
Disease Control Rate: 82%
Colorectal Cancer Phase Ib Study[6]
RegimenObjective
Response RateDisease
Control Rate≥16-wk Progression
Free Survival
Fruquintinib Phase Ib (China)3rd Line colorectal cancer
5mg 3/1 wk (N = 42)
10.3% 82.1% 66.7%
Stivarga®
(regorafenib)Phase III (Asia)3rd Line colorectal cancer
160mg 3/1 wk (N = 136)
4.4% 51.5% 33.8%
Placebo (N = 68)
0.0% 7.4% 2.9%
Population No. of
Patients PR (pts.) SD (pts.) ORR[1] DCR[2]
Intent to Treat population (ITT) 40 13 15 33% 70%
Evaluable patients 34 13 15 38% 82%Colorectal cancer 10 3 6 30% 90%Non-small cell lung cancer 6 4 1 67% 83%Breast cancer 7 2 5 29% 100%Gastric cancer 2 1 0 50% 50%Other 9 3 3 33% 67%
…across multiple solid tumor types.

FruquintinibPhase II cash payments from Lilly – $33.1 million in 2015
18
6. Latest status: Non-small cell lung cancer (3rd line) – Study 15 Phase II PoC study (91pts.) enrolled in ~9 months (Jun 2014-Mar 2015). Top
line results clearly met primary end point of PFS.
Phase III (“FALUCA”, ~520 pts.) started enrolment in China in Dec 2015.
Gastric cancer (2nd line) – Study 16 Phase Ib dose finding study (w/Taxol®) started early 2015. Second cohort
complete (at dose >EC50 24hr. inhibition). Combinability key to maximize market potential. Initiate 2L gastric cancer Phase II study in China H2 2016.
Fruquintinib global development Submit US IND in 2016. Start Phase I bridging study (Caucasians) early 2017.
7. Development Plan:
PossibleLaunchSubmit
5. Colorectal cancer status (3rd line) – Study 14 Phase II PoC study (71 pts.) enrolled in ~4 months (April-Aug 2014).
Clearly met primary endpoint of PFS: 70% reduction in risk of progression. Safety profile consistent.
Phase III registration study (“FRESCO”, ~420 pts.) started enrollment in Dec 2014. 25 centers in China. Expect to complete enrollment in May 2016. Primary endpoints: overall survival, secondary endpoints: ORR, DCR.
Phase III FRESCO study will be un-blinded when a predetermined number of deaths (Overall Survival events) – China FDA submission follow unblinding. Publish top –line results end 2016 or early 2017.
Time from randomization (Months)
0
10
20
30
40
50
60
70
80
90
100
PFS
Prob
abili
ty (%
)
1 2 3 4 5 6 70 8
Fruquintinib (n=47)
Placebo (n=24)
Events, n 36 (76.6%) 21 (87.5%)
Median, months
4.73 (2.86, 5.59)
0.99 (0.95, 1.58)
Stratified HR [95% CI]: 0.30 [0.15-0.59] P<0.001
KAPLAN-MEIER PLOT OF PFS (Investigator Review)
CHINA 2013 2014 2015 2016
Colorectal cancer(3rd line)
Non-small cell lungcancer (3rd line)
Gastric cancer (2nd linecombination w/ Taxol®)
GLOBAL
Phase IbPhase II
Phase III
Phase II
Phase II
Phase III
Ph. III
Global studies
Ph Ib DF

-6%-9% -10% -10%
-17%-20% -21% -22%
-25%-28%
-32% -33%-38%
-42%
-50% -51%
-60% -61%-70%
-60%
-50%
-40%
-30%
-20%
-10%
0%M Lu Lv R P P P S R P T M D P P M R P
2. Favorable Phase Ia efficacy in NET patients.
[1] ORR = percent of patients with >30% tumor diameter shrinkage (Note: Intent to Treat ITT population = 21; patients evaluable for efficacy = 18; 3 patients withdrawn/lost to follow-up/AE); [2] DCR = percent of patients with tumor diameter growth <20%; [3] CTA = Clinical Trial Application (for Phase II/III in China).
SulfatinibVEGFR/FGFR1 – Highest ORR ever seen in neuroendocrine tumors (“NET”)
19
Best tumor response in 18 evaluable NET patients
1. High NET prevalence & no broadly effective drugs.
3. Sulfatinib clear superiority. ORR far superior to Sutent® & Afinitor®. Results of ongoing Phase Ib/II (81 NET
patients) in-line with expectations. Initiated China Phase III registration study in
non-pancreatic NET patients (SANET-ep). Began U.S. clinical development in Q4 2015.
Chan
ge in
tum
or si
ze (%
) fro
m
base
line
D = DuodenumLv = LiverLu = LungS = Sacroiliac
M = MetastaticP = PancreaticR = RectalT = Thymus
UNITED STATESIncidence Survival Prevalence Prevalence
(new cases /year) (% patients – 5 years) (Est. patients) (Est. % of all NET)
Stomach 1,140 54% 8,432 6.0%Duodenum 722 56% 5,341 3.8%Jejunum/Ileum 2,545 63% 18,832 13.4%Cecum 608 62% 4,497 3.2%Colon 760 48% 5,622 4.0%Rectum 3,267 59% 24,173 17.2%Pancreas 1,215 56% 8,995 6.4%Liver 152 32% 1,124 0.8%Appendix 570 64% 4,216 3.0%
Total GI NET 10,977 58% 81,232 57.8%Lung 5,128 61% 37,946 27.0%Other 2,887 63% 21,362 15.2%
All NET 18,992 60% 140,540 100.0%
Objective Response Rate: 44.4% Disease Control Rate: 100%
Source: Frost & Sullivan.
Sandostatin®
(octreotide) / Placebo
Afinitor®
(everolimus) / Placebo
Sutent®
(sunitinib) / Placebo
Somatuline Depot®
(lanreotide) / Placebo
sulfatinib
NET Approval Mid-gut Pancreatic PancreaticGastrointestinal
(Antigen Ki67<10%)All NET efficacy
Median PFS (months) 14.3/6.0 11.0 / 4.6 11.4 / 5.5 NR / 18.0 18.3
Hazard Ratio 0.34 0.35 0.42 0.47p-value 0.000072 <0.001 <0.001 <0.001Objective Response Rate[1] 2% / 2% 5% / 2% 9% / 0% NR 38%Disease Control Rate[2] 69% / 40% 73% / 51% 72% / 60% NR 86%

EpitinibHighly encouraging early efficacy data in NSCLC w/ brain metastasis
20
3. Clear efficacy in preclinical brain tumor models.
0
1,000
2,000
3,000
4,000
5,000
6,000
Brain Plasma
epitinib erlotinib
0500
1,0001,5002,0002,5003,0003,500
Brain Plasma
epitinib
Exposures in Model 1 (2.5 mpk, po) Exposures in Model 2 (5 mpk, po)
AUC
(ng/
ml*
hr)
2. Clear superior exposure in brain vs. Tarceva®.
1. Major need for EGFR TKI which penetrates BBB. Current EGFR TKIs (erlotinib & gefitinib) have low blood brain
barrier (“BBB”) penetration. If NSCLC metastasizes to brain (eventually ~50% of patients[1]) current TKIs less effective.
4. Phase Ib – epitinib human efficacy in lung & brain.
[1] Li B, Bao YC, Chen B, et al. Therapy for non-small cell lung cancer patients with brain metastasis. Chinese-German J Clin Oncol, 2014, 13: 483–488. Note: erlotinib = Tarceva®.
Lung Baseline +36 days
Brain Baseline +36 days
ControlDay 23
epitinib25 mg/kg
Day 23
x109
2.5
2.0
1.5
1.0
0.5
p/sec/cm^2/sr
Color ScaleMin = 5.00e7Max = 2.50e9

TheliatinibStrong affinity to wild-type EGFR kinase
21
1. Major unmet medical need for wild-type EGFR activation tumors
Tumor TypesWild-type: Gene
AmplificationWild-type: Over
ExpressionMutations
Lung (Non-small cell)
29% 62%10-30% (tyrosine kinase
inhibitors approved)
Esophagus 8-30% 30-90%12% (esophageal adenocarcinoma)
Stomach 29% 44-52% <5%
Colorectal 4.5%53% (monoclonal
antibodies approved)8%
Head and neck 10-30%66-84% (monoclonal antibodies approved)
42% (EGFR variant III)
Glioblastoma 36-51% 54-66%27-54%
(EGFR variant III)
EGFR activation affects multiple tumor types with many remaining unaddressed.
Current EGFR tyrosine kinase inhibitor are less effective at treating solid tumors with wild-type EGFR activation.
There are few effective treatments for head & neck, esophageal and non-small cell lung cancers.
100
80
60
40
20
00 50 100 150 200 250 300
Baseline Theliatinib (HMPl-309) Erlotinib (Tarceva®) Gefitinib (Iressa®)Time (min)
Phos
o-pe
ptid
e (%
)
3. Superior anti-tumor activity of Theliatinib in pre-clinical studies in tumors with wild-type EGFR 5- to 10-fold more potency than Tarceva®. Sustained target occupancy.
designed to have strong binding affinity to the wild-type EGFR kinase – sustained target occupancy or “slow-off” characteristic.
2. Theliatinib is a potent and highly selective oral EGFR inhibitor engineered to have significantly greater binding affinity to wild-type EGFR proteins
Source: Frost & Sullivan.

HMPL-689Designed to be a best-in-class inhibitor of PI3Kδ – Phase I started in April
22
4. HMPL-689 more potent and more selective than idelalisib & duvelisib
2. PI3Kδ inhibitors being developed in a very broad range of indications
Zydelig® (idelalisib) in B-cell malignancies: Phase Ib Waterfall plot (n=125)
1. PI3Kδ now a proven target PI3Kδ activation associated with allergy,
inflammation & oncology. Evidence that PI3Kδ inhibitors effective in
ibrutinib-resistant mutant population.
[1] COPD = Chronic obstructive pulmonary disease; SLE = Systemic lupus erythematosus; MS = Multiple Sclerosis.
3. HMPL-689 -- Important assetDesigned to improve on existing PI3Kδ inhibitors: Improved isoform selectivity (sparing PI3Kγ). Improved potency at whole blood level (>5x
more potent than idelalisib) to cut compound related toxicity.
Improved PK properties particularly efflux and drug/drug interaction due to CYP inhibition / induction, critical for combo therapy.
Enzyme IC50 (nM) HMPL-689 Zydelig® duvelisib
PI3Kδ 0.8 (n = 3) 2 1
PI3Kγ (fold vs. PI3Kδ) 114 (142x) 104 (52x) 2 (2x)
PI3Kα (fold vs. PI3Kδ) >1,000 (>1,250x) 866 (433x) 143 (143x)
PI3Kδ human whole blood CD63+ 3 14 15
PI3Kβ (fold vs. PI3Kδ) 87 (109x) 293 (147x) 8 (8x)
SPD
of M
easu
red
Lym
ph N
odes
(b
est %
chan
ge fr
om b
asel
ine)
Individual Patients (N=125)
Compound Indication Status Issue
Zydelig®
(idelalisib) PI3Kδ
Gilead Sciences
Chronic lymphocytic leukaemia, non-Hodgkin’s lymphoma Registered High incidence of liver toxicity seen with idelalisib (150mg bid)
Hodgkin’s lymphoma Phase II Trial
Waldenstrom’s hypergammaglobulinaemia Preclinical
AMG-319 PI3Kδ Amgen
B-cell lymphoma, non-Hodgkin’s lymphoma, T-cell lymphoma, chronic lymphocytic leukaemia
Phase I Trial
duvelisib[1]
(IPI-145) PI3Kγ/δ
AbbVie / Infinity
B-cell lymphoma, non-Hodgkin’s lymphoma, chronic lymphocytic leukaemia
Phase III Trial Need to spare PI3Kγ --serious infection seen with duvelisib due to strong immune suppression
Asthma, rheumatoid arthritis Phase II Trial
COPD, SLE, psoriasis, MS transplant rejection, allergy, acute lymphocytic leukaemia, T-cell lymphoma
Phase I Trial

HMPL-004 – Heavy pill burden/compliance issuesReformulation – HM004-6599 (>70% active) vs. HMPL-004 (~15% active)
23
Strong Phase IIb data in UC (co-treat w/ 5-ASA)[2][3]… …but surprised by overall NATRUL-3 IA[4] result…
...but HMPL-004 works well in 5-ASA failure patients… …particularly if difficult to treat patients stratified.
[1] Post-hoc analysis of IA: sub-group base sizes in these analyses are small and should be viewed for general indication purposes only; [2] UC = Ulcerative colitis; [3] 1,800mg/day HMPL-004 plus Mesalamine (5-ASA) versus Mesalamine (5-ASA) alone (Placebo-arm); [4] IA = Phase III Interim Analysis conducted at ~1/3rd patient enrolment.
Placebo + 5-ASA (N = 52) 2,400mg/day + 5-ASA (N = 57)
Remission
Placebo + 5-ASA >1yr. (N = 28) 2,400mg/day + 5-ASA >1yr. (N = 28)
Placebo + 5-ASA (N = 52) 1,800mg/day + 5-ASA (N = 51)
Placebo + 5-ASA >1yr. (N = 27) 2,400mg/day + 5-ASA >1yr. (N = 25)
17.0%
39.0%18.0%
32.0%
0%
10%
20%
30%
40%
50%
60%
70%
80%
17.3% 15.8%
15.4%24.6%
0%
10%
20%
30%
40%
50%
10.7%
28.6%14.3%
25.0%
0%
10%
20%
30%
40%
50%
60%
11.1%
32.0%11.1%
20.0%
0%
10%
20%
30%
40%
50%
60%
p-value = 0.7364
p-value = 0.5604
p-value = 0.013
p-value = 0.0003
p-value = 0.0926
p-value = 0.0286
p-value = 0.0654
p-value = 0.0259
35.0%
71.0%
32.7%
40.5%
52.0%
22.2%
53.6%
25.0%
2.3XPlacebo
2.9XPlacebo
2.7XPlacebo
RemissionResponse
RemissionResponse
RemissionResponse
RemissionResponse
RemissionResponse
RemissionResponse
RemissionResponse
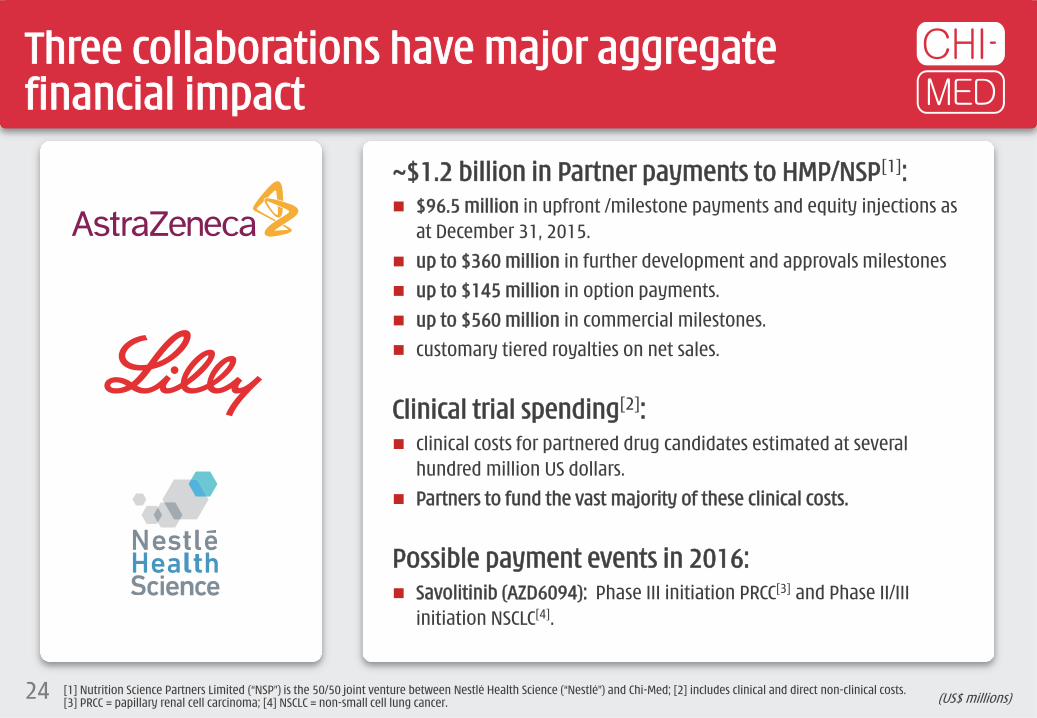
Three collaborations have major aggregate financial impact
24
~$1.2 billion in Partner payments to HMP/NSP[1]: $96.5 million in upfront /milestone payments and equity injections as
at December 31, 2015. up to $360 million in further development and approvals milestones up to $145 million in option payments. up to $560 million in commercial milestones. customary tiered royalties on net sales.
Clinical trial spending[2]: clinical costs for partnered drug candidates estimated at several
hundred million US dollars. Partners to fund the vast majority of these clinical costs.
Possible payment events in 2016: Savolitinib (AZD6094): Phase III initiation PRCC[3] and Phase II/III
initiation NSCLC[4].
[1] Nutrition Science Partners Limited (“NSP”) is the 50/50 joint venture between Nestlé Health Science (“Nestlé") and Chi-Med; [2] includes clinical and direct non-clinical costs. [3] PRCC = papillary renal cell carcinoma; [4] NSCLC = non-small cell lung cancer. (US$ millions)

China Commercial PlatformEstablished high-performance pan-China pharma sales organization
Profitable, fast growth & cash generating – to fund drug R&D
25

~1,900 Rx Sales People
A powerful Rx Commercial Platform in ChinaChi-Med management run all day-to-day operations
26
407 (22%)
122 (6%)
Notes: 2010 Population – China State Census; CV = Cardiovascular; CNS = Central nervous system.
CV Medical Reps: 385 (22%)CNS Medical Reps: 22 (21%)HSP Sales staff: 0 (0%)
NORTHPop’n: 320m (23%)
CV Medical Reps: 744 (42%)CNS Medical Reps: 46 (45%)HSP Sales staff: 31 (100%)
EASTPop’n: 393m (28%)
CV Medical Reps: 465 (26%)CNS Medical Reps: 25 (24%)HSP Sales staff: 0 (0%)
CENTRAL-SOUTHPop’n: 383m (28%)
CV Medical Reps: 114 (7%)CNS Medical Reps: 8 (8%)HSP Sales staff: 0 (0%)
SOUTHWESTPop’n: 190m (14%)
CV Medical Reps: 59 (3%)CNS Medical Reps: 2 (2%)HSP Sales staff: 0 (0%)
WESTPop’n: 100m (7%)
National Coverage:~300 cities & towns. ~16,500 hospitals. ~80,000 doctors.
New team of 100 CNS repsbuilt in past 9 months.
490(26%)
821(43%)
61(3%)
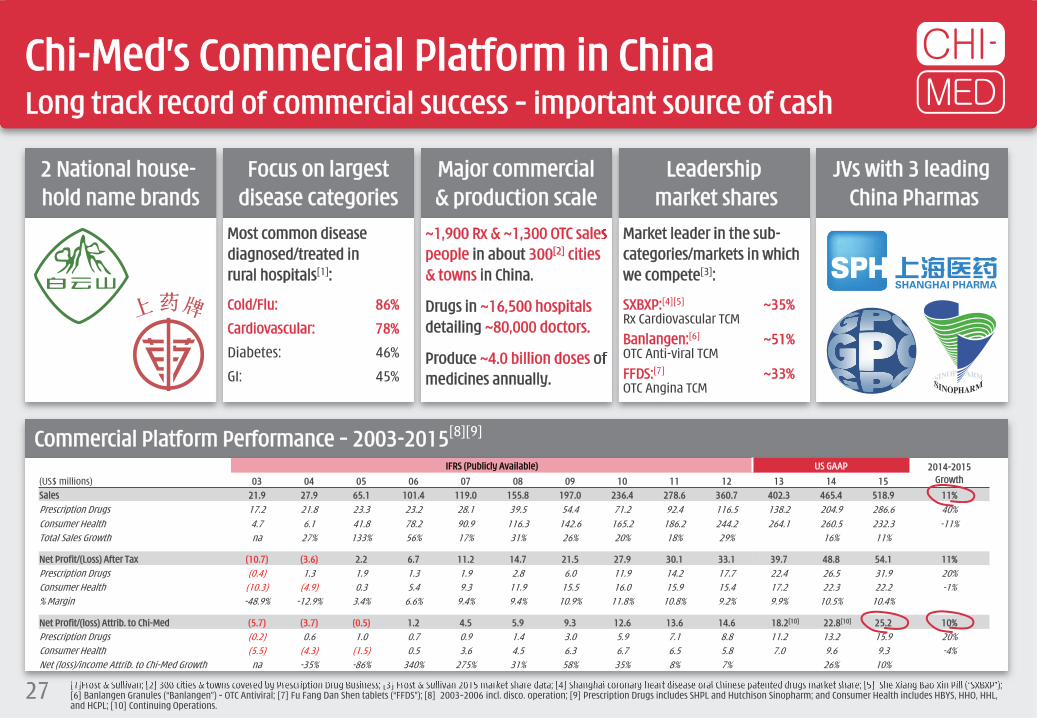
2 National house-hold name brands
Focus on largestdisease categories
Major commercial& production scale
Leadershipmarket shares
JVs with 3 leadingChina Pharmas
Most common disease diagnosed/treated in rural hospitals[1]:
Cold/Flu: 86%
Cardiovascular: 78%
Diabetes: 46%
GI: 45%
~1,900 Rx & ~1,300 OTC sales people in about 300[2] cities & towns in China.
Drugs in ~16,500 hospitalsdetailing ~80,000 doctors.
Produce ~4.0 billion doses of medicines annually.
Market leader in the sub-categories/markets in which we compete[3]:
SXBXP:[4][5] ~35%Rx Cardiovascular TCMBanlangen:[6] ~51%OTC Anti-viral TCMFFDS:[7] ~33%OTC Angina TCM
Chi-Med’s Commercial Platform in ChinaLong track record of commercial success – important source of cash
27
Commercial Platform Performance – 2003-2015[8][9]
[1]Frost & Sullivan; [2] 300 cities & towns covered by Prescription Drug Business; [3] Frost & Sullivan 2015 market share data; [4] Shanghai coronary heart disease oral Chinese patented drugs market share; [5] She Xiang Bao Xin Pill (“SXBXP”); [6] Banlangen Granules (“Banlangen”) – OTC Antiviral; [7] Fu Fang Dan Shen tablets (“FFDS”); [8] 2003–2006 incl. disco. operation; [9] Prescription Drugs includes SHPL and Hutchison Sinopharm; and Consumer Health includes HBYS, HHO, HHL, and HCPL; [10] Continuing Operations.
IFRS (Publicly Available) US GAAP 2014-2015 Growth(US$ millions) 03 04 05 06 07 08 09 10 11 12 13 14 15
Sales 21.9 27.9 65.1 101.4 119.0 155.8 197.0 236.4 278.6 360.7 402.3 465.4 518.9 11%Prescription Drugs 17.2 21.8 23.3 23.2 28.1 39.5 54.4 71.2 92.4 116.5 138.2 204.9 286.6 40%Consumer Health 4.7 6.1 41.8 78.2 90.9 116.3 142.6 165.2 186.2 244.2 264.1 260.5 232.3 -11%Total Sales Growth na 27% 133% 56% 17% 31% 26% 20% 18% 29% 16% 11%
Net Profit/(Loss) After Tax (10.7) (3.6) 2.2 6.7 11.2 14.7 21.5 27.9 30.1 33.1 39.7 48.8 54.1 11%Prescription Drugs (0.4) 1.3 1.9 1.3 1.9 2.8 6.0 11.9 14.2 17.7 22.4 26.5 31.9 20%Consumer Health (10.3) (4.9) 0.3 5.4 9.3 11.9 15.5 16.0 15.9 15.4 17.2 22.3 22.2 -1%% Margin -48.9% -12.9% 3.4% 6.6% 9.4% 9.4% 10.9% 11.8% 10.8% 9.2% 9.9% 10.5% 10.4%
Net Profit/(loss) Attrib. to Chi-Med (5.7) (3.7) (0.5) 1.2 4.5 5.9 9.3 12.6 13.6 14.6 18.2[10] 22.8[10] 25.2 10%Prescription Drugs (0.2) 0.6 1.0 0.7 0.9 1.4 3.0 5.9 7.1 8.8 11.2 13.2 15.9 20%Consumer Health (5.5) (4.3) (1.5) 0.5 3.6 4.5 6.3 6.7 6.5 5.8 7.0 9.6 9.3 -4%Net (loss)/income Attrib. to Chi-Med Growth na -35% -86% 340% 275% 31% 58% 35% 8% 7% 26% 10%

Catalysts / Highlights
28

Multiple 2016 Catalysts
29
H2 2015Savolitinib (c-Met) Phase II enrollment complete (109pts.) – Global papillary renal cell carcinoma
(“PRCC”).
o Initiate Phase Ib – immunotherapy combo studies in kidney cancer (UK).
Fruquintinib (VEGFR 1/2/3) Phase II China 3L colorectal cancer data – ESMO Sept 2015.
China 3L non-small cell lung cancer (“NSCLC”) – Successful Phase II results triggering $10 million milestone payment and Initiation of pivotal Phase III.
Conclude Phase Ib dose finding – China 2L gastric combo (Taxol®).
Sulfatinib (VEGFR/FGFR) Phase Ib/II enrollment complete (81pts.) – China neuroendocrine tumors
(“NET”).
Initiate pivotal Phase III – China advanced carcinoid (all non-pancreatic NET).
Initiate pivotal Phase III – China Pancreatic NET (Mar 2016).
Phase I PK bridging initiation – US NET.
Initiate Phase II – China Thyroid cancer (Mar 2016).
HMPL-523 (Syk) Phase I completion (multiple-dose) – Australia (healthy volunteers/RA).
Initiate Phase I in hematological cancer – Australia (Jan 2016).
HMPL-689 (PI3Kδ) Initiate Phase I in healthy volunteers – Australia (Apr 2016).
Epitinib (EGFR) Phase Ib proof-of-concept (“PoC”) – NSCLC with brain metastasis.
2016Savolitinib (c-Met)o PRCC Phase II PoC publication; potential Phase III initiation; potential for Breakthrough
Therapy application & possible US NDA submission.
o Global Savolitinib/Tagrisso® combo. NSCLC – publish Phase Ib PoC data and Initiate Phase II/III – potential for Breakthrough Therapy application.
o China savolitinib/Iressa® combo. 2L NSCLC – publish Phase Ib PoC data.
o Initiate Phase Ib – immunotherapy combo. studies in kidney cancer (UK).
HMPL-523 (Syk)o Phase I dose escalation complete with potential PoC signal – Australia (oncology CLL/NHL).
o Initiate global Phase II PoC immunology (Rheumatoid arthritis).
Fruquintinib (VEGFR 1/2/3)o Phase III enrollment complete – China 3L colorectal cancer; possible China NDA submission.
o Phase II China 3L NSCLC data publication.
o Initiate Phase II PoC – China 2L Gastric cancer Taxol® combo.
Sulfatinib (VEGFR/FGFR)o Initiate pivotal Phase III – China Pancreatic NET.
o Initiate Phase II PoC – US NET; publish China Phase Ib/II NET data.
EGFR Inhibitorso Epitinib – release China Phase Ib data; Initiate China Phase III; start US development.
o Theliatinib – initiate Phase Ib in China esophageal and head & neck cancer.
HMPL-689 (PI3Kδ)o Initiate Phase I in healthy volunteers & hematological cancer – Australia.
HMPL-453 (Selective FGFR)o Initiate Phase I – China &/or Australia (oncology).

Chi-Med investment highlights
30
High-potential clinical pipeline – first candidates targeting NDA submissions in late 2016. 4 pivotal Phase III studies underway.
Savolitinib (AZD6094) – potential first-in-class c-Met inhibitor – chance to submit for US approval in late 2016. Highest ever ORR in c‐Met+ patients; possible Breakthrough Therapy application in papillary renal cell carcinoma.
HMPL-523 – potential first-in-class Syk inhibitor. Phase I in healthy volunteers complete & Phase I CLL[1] enrolling. Plan to start global Phase II PoC in Rheumatoid arthritis in 2016.
Fruquintinib – highly selective VEGFR inhibitor – potential to submit for China approval in late 2016 or early 2017. Possible for best-in-class; pivotal Phase III studies (mono) in colorectal & lung well underway; Phase II (combo) in gastric in H2 2016.
Sulfatinib – Breakthrough Therapy potential in neuroendocrine tumors (“NET”). Highest ever ORR in NET for a tolerable therapy; two China pivotal Phase III NET studies underway and plan to start US Phase II in 2016.
Epitinib – unmet need for a BBB penetrating EGFR TKI – emerging efficacy in NSCLC w/ brain metastasis. Phase II/III start in 2016 if Phase Ib results continue positive.
HMPL-689 – >5x more potent than idelalisib and much more selective than duvelisib. Phase I started in April 2016.
Productive/efficient & established discovery platform – focus on selectivity.
Extensive & profitable Rx Commercial Platform in China – to launch our new drug innovations.[1] CLL = Chronic Lymphocytic Leukaemia.
AppendicesFinancial Results
Corporate StructureProperty Portfolio
China Pharma Market StructurePeer Groups
31

[1] Net Income/(Loss) = Net income/(Loss) attributable to Chi-Med; [2] NSP = Nutrition Science Partners Limited; [3] Non-cash accretion relates to increased estimated value of Mitsui’s share in Innovation Platform, which was exchanged for Chi-Med shares in July 2015; [4] Including adjustment for accretion on redeemable non-controlling interests.
2015 Financial Results
32
Revenues
Net Income/(Loss)[1]
36.5
87.3
178.2
2013 2014 2015
23.9
(7.3)8.0
2013 2014 2015
Change2013 2014 2015 13-14 14–15
Revenues 36.5 87.3 178.2 139% 104%Unconsolidated JV Revenues 385.8 398.4 392.7
Net Income/(Loss) [1]
Innovation Platform 15.5 (22.2) (3.8) n/a n/aBase HMP Operations 24.3 (13.8) (0.0)50% share of Nestle JV (NSP) [2] (8.8) (8.4) (3.8)
Commercial Platform (Con’t. Operations) 18.2 22.8 25.2 26% 10%Prescription Drugs Business 11.2 13.2 15.9Consumer Health Business 7.0 9.6 9.3
Chi-Med Group Costs (8.4) (9.0) (13.4) 8% 49%Head office overheads/expenses (6.1) (6.4) (10.9)Interest/tax (2.3) (2.6) (2.5)
Discontinued Operations (1.4) 1.0 - n/a n/a
Net Income/(Loss) on Ops. Attrib. to Chi-Med 23.9 (7.3) 8.0 n/a n/a
EPS Attrib. to Company (Basic) 0.46 (0.14) 0.15 n/a n/a
Accretion per share on redeemable non-controlling interests (Mitsui) – NON-CASH [3] - (0.48) (0.79)
EPS Attrib. to Ordinary Shareholders (Basic)[4] 0.46 (0.62) (0.64) n/a n/a
Group ResultsStatement of Operations Summary
(US$ millions)(US GAAP)

Innovation Platform Commercial Platform
Financial performance of main platformsSustainable biotech business model – >$180 million available cash[1]
33
Revenues [2]
Net Income [3] [4]
16.5
67.0
126.2
2013 2014 2015
18.2 22.8 25.2
2013 2014 2015
Revenues
Net Income/(Loss) [3]
20.120.3
52.0
2013 2014 2015
15.5
(22.2) (3.8)
2013 2014 2015
(US$ millions)(US GAAP)
[1] Includes Q1 2016 Cash and cash equivalents and unutilized banking facilities + approximate net proceeds from Nasdaq offering; [2] Only includes revenues of subsidiaries for Prescription Drugs and Consumer Health businesses – excludes joint ventures; [3] Net Income/(Loss) = Net Income/(Loss) attributable to Chi-Med; [4] Continuing Operations.

(US$ millions)
86.5
70.4
4.4 (33.8)[1]
9.9 (1.2)
(4.5)(2.2)
65.8
Cash & Cash EquivalentsJan 1, 2014
Operating activities
Investing activities
Financing activities
FX Diff Cash & Cash EquivalentsJan 1, 2015
Operating activities
Investing activities
Financing activities
FX Diff Cash & Cash Equivalents
Dec 31, 2015
8.3 (15.2)[2] (0.6) (0.5)
39.6
46.9
26.9
38.9 (9.4) 8.9[4] (5.5) (1.0)31.9
38.5
Cash flow of Chi-Med & its Subsidiaries & Proportional Share of Joint Ventures (SHPL, HBYS, NSP)
Proportional Share of Cash & Cash Equivalents of Joint Ventures (SHPL, HBYS, NSP)
Cash flow under Equity Accounting
Cash & Cash Equivalents of Chi-Med & its Subsidiaries
9.0 2.3[3]
Financing – Stable at both Group and JV levels
34
[1]Share of bank deposits maturing > 3 months of $13.8m reclassified to S-T investment, & share of capital expenditure of $26.8m, offset by share of receipt of government grant ($6.1m) & new cash from acquired new subsidiary ($0.7m); [2]Bank deposits maturing > 3 months of $12.2m reclassified to S-T investment, & capital expenditure of $3.7m offset by new cash acquired new subsidiary ($0.7m); [3]Share of bank deposits maturing >3 months of $21.7m matured in 2015 reclassified from S-T investment, share of receipt in advance of land compensation of $15.6m, & share of receipt of government grant of $1.6m offset by share of capital expenditure ($36.6m); [4] Bank deposits maturing > 3 months of $12.2m matured in 2015 reclassified from S-T investment, offset by capital expenditure of $3.3m.

Chi-Med Group Level (at 31 Dec 2015)
Cash & Cash Equivalents: $31.9m (end-2014: $38.9m)Cash from short-term investment in 2015: $12.2mOther operating activities: ($11.5m)
Capital MarketsUK IPO: ~$75m in 2006Nasdaq: ~$96m in 2016
Chi-Med GroupOperating costs: $12.3m
R&D project spendSpending 2015: $64.1m (2014: $45.5m)
JV Level (at 31 Dec 2015)
Cash & Equivalents: $2.6m(end-2014: $6.2m)
$6.4m
$40.5m$23.1m[1]
$3.5m
$37.5m
PropertySHPL Land compensation
(US$ millions)
$12.3mR&D DivisionCash & Cash Equivalents: $14.9m (end-2014: $11.4m)
$10.1m
$3.9m
Bank loans (at 31 Dec 2015)
Drawn down: $26.5mUnutilised facility: Open
Pharma PartnersAstraZeneca; Janssen; Nestlé; Eli Lilly
VC/PEMitsui
Bank loans (at 31 Dec 15)
Drawn-down: $50.0mUnutilised facility: $6.9m
ESOP Proceeds of exercise
$1.4m
CAPEXSHPL/HBYS new factory const.
JV Level – SHPL/HBYS (at 31 Dec 2015)
Cash & Cash Equivalents: $74.3m (end-2014: $47.6m)
$64.8m
$2.0m[2]
35
$31.1m
2015 inter-group cash flow>$180m in cash available – ~$60m in undrawn bank facilities
$3.2m
[1] Costs paid directly by partners (e.g. Eli Lilly, AstraZeneca & Janssen payments). – estimated by partner guidance or invoices; [2] offset by $2.0m shareholders’ loan to NSP.

[1] NPAT = Net income/(loss) after tax attributable to Chi-Med; [2] Held through an 80% owned subsidiary.
Chi-Med Group structure - major entities
36
Non-Consolidated Joint Ventures
Chi-Med SubsidiariesChi-Med Group LevelRevenue: $178.2m (2014: $87.3m)Net Income Attributable to Chi-Med Equity Holders: $8.0m (2014: -$7.3m)Cash & Cash Equivalents: $31.9m at 31 December 2015 (end-2014: $38.9m)
Innovation PlatformRevenue: $52.0m (2014: $20.3m)NPAT[1]: -$3.8m (2014: -$22.2m)
Nutrition Science Partners (“NSP”)Botanical Drug /GI Disease R&DPartner: Nestlé Health Science
Revenue: nil (2014: nil)
Hutchison MediPharma (“HMP”)Oncology/Immunology Drug R&DMinority: None
Revenue: $52.0m (2014: $20.3m)
50%
99.8%
Commercial PlatformRevenue of Subs & JVs: $518.9m (2014: $465.4m)NPAT attributable to Chi-Med: $25.2m (2014: $22.8m)
Consumer Health
Shanghai Hutchison Pharmaceuticals (“SHPL”)Prescription DrugsPartner: Shanghai Pharma Group
Revenue: $181.1m (2014: $154.7m)
Hutchison Sinopharm (“HSP”)
Rx Drug Commercial Co.Partner: Sinopharm Group
Revenue: $105.5m (2014: $50.2m)
Hutchison Baiyunshan Chinese Medicine Co. (“HBYS”)Over-the-counter Drugs (“OTC”)Partner: Guangzhou Pharma Hlds.Revenue: $211.6m (2014: $243.7m)
Hutchison Hain Organic (“HHO”)Health Related Consumer Prods.Partner: Hain Celestial Group
50% 51%
50%50%[2]
Prescription Drugs

[1] GSP = Good Supply Practice Certification (license to sell and distribute third party drug products).
A Strategic Rx Drug Commercial Platform in ChinaEstablished to launch our innovative drugs
37
3rd Party & Related Party
Products
NYGB & HBYS GSP[1] – OTC commercialMinority: Nanyang GuanbaoSales Reps: ~1,300 staff
Hutchison Sinopharm (“HSP”)Pharma GSP[1] Commercial Co.Partner: Sinopharm GroupCommercial & Admin.: ~70 staff
2015 Revenue: $105.5m (2014: $50.2m)
SHPL GSP[1] Co. -- Rx Drug commercialSales offices: ~300 cities & towns in ChinaSales Reps: ~1,870 staff
SHPL – Prescription (Rx) DrugsPartner: Shanghai Pharma GroupManufacturing & Admin. (~500 staff)74 drug manufacturing licenses
2015 Revenue: $181.1m (2014: $154.7m)
80%
HOLDCO
HBYS -- Over-the-counter (OTC) Drugs Partner: Guangzhou Pharma Hlds.Manufacturing & Admin. (~760 staff)147 drug manufacturing licenses
2015 Revenue: $211.6m (2014: $243.7m)
60% / 100%
50%
51%50%
100%
Prescription (Rx) Drugs Consumer Health
37
(US$ millions)[1] SOP = Start of Production post China Good Manufacturing Practice certification.
560 meters
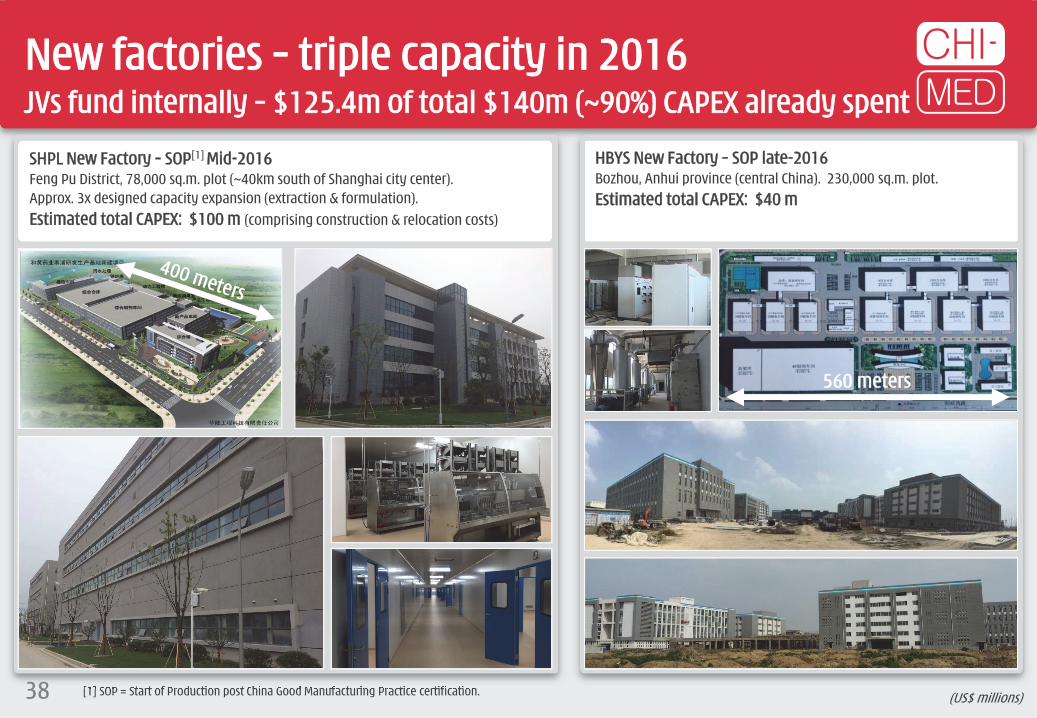
SHPL New Factory – SOP[1] Mid-2016Feng Pu District, 78,000 sq.m. plot (~40km south of Shanghai city center).Approx. 3x designed capacity expansion (extraction & formulation).Estimated total CAPEX: $100 m (comprising construction & relocation costs)
HBYS New Factory – SOP late-2016Bozhou, Anhui province (central China). 230,000 sq.m. plot.Estimated total CAPEX: $40 m
New factories – triple capacity in 2016JVs fund internally – $125.4m of total $140m (~90%) CAPEX already spent
38

SHPL old factory site surrender – December 2015~$120 million cash compensation/subsidies – cash fully paid in 2016
39 [1] Approximate distance (direct line) to Central Business District (CBD); [2] Approximate distance (direct line) to nearest Shanghai Metro station.
SHPL Old Factory
CBD
Outer Ring Road
Inner Ring Road
Qi Lian Shan Metro
SHPL Old Factory
Wu Wei Road Metro
Dec 2015: agreement to surrender land use rights.
~$105 million total cash compensation. ~$31 million received in 2015, ~$74m in H2 2016.
~$13 million total book value.
~$15 million in additional subsidies.
“Taopu Smart City” new science & tech, commercial and residential area. Re-zoned in 2014. 12km from CBD.
4.6 sq.km. new development zone.
Old SHPL factory classified as residential.

[1] Estimated Auction Price based on Nov 24th 2014 Auction Price of 163 Tong Bao Road Plot.; [2] Based on Guangzhou government new urban redevelopment policy combined with precedent land auctions in the vicinity of HBYS Plot 1 and Plot 2. (US$ millions)
800m
1,100m
8-10 Tong Bao Road (65,055 sq.m. plot of land):Auction Date: May 6th 20132.2 plot ratio, 143,121 sq.m. of residential floor area.Actual Auction Price[1]: $305.1 million ($2,132/sq.m.).
HBYS Plot 1 (59,400 sq.m. plot of land)
HBYS Plot 2 (26,700 sq.m. plot of land):2.2 plot ratio, ~58,740 sq.m. of residential floor area.Estimated Auction Price[1]: $128.8 million ($2,244/sq.m.).
Tong He Metro Station (opened November 2010)
163 Tong Bao Road (131,647 sq.m. plot of land):Auction Date: November 24th 2014~3.5 plot ratio, 460,765 sq.m. of residential floor area.Actual Auction Price: $1,034 million ($2,244/sq.m.).
HBYS Plot 1&2 – 9km from Guangzhou city centerProperty compensation expected in the range of ~$150 million[2]
40

Tufts Conventional Model[1 ]:
Clinical Development 8.2 yrsUS Approval times 0.6 yrsTime to Launch 8.8 yrs
Phase 1 to 2 -- transition probability
Phase 2 to 3 -- transition probability
Phase 3 to Submission -- transition probability
Submission to Approval -- probability
Breakthrough Therapy Model ("BT")[2 ]:
Clinical Development 8.2 yrsUS Approval times 0.6 yrsTime to Launch 5.5 yrs
Interim Analysis Phase 2 (confirm Phase I data, submit BTT) -- probability
Breakthrough Therapy Designation (based on Interim Analysis data) -- probability
Submission to Approval -- probability
9 0 .5 %
P h .2 a
>5 0 %
P h .2 b
>9 0 %
>8 5 %
>9 0 %
6 9 .7 %
3 7 .9 %
4 1 .1 %
9 0 .5 %
P h a s e 3 (C on fi r m a tor y )
Yr 7 Yr 8
P h a s e 1 : 9 .8 % P h a s e 2 : 1 4 .1 % P h a s e 3 : 3 7 .2 %
Yr 1 Yr 2 Yr 3 Yr 4 Yr 5 Yr 6
[1] Tufts Center for the Study of Drug Development (Feb 2010) – Transition probabilities for small molecule oncology drugs based on data of the 50 largest pharmaceutical companies 1993 through June 2009; [2] Hypothetical probabilities for BT estimated by Chi-Med – for general reference only, probabilities will vary dramatically based on scale/quality of Phase I data.
General criteria for BT in oncology: 1. Rare cancer type – life-threatening, currently untreatable/limited treatments.
2. Clear understanding of molecular pathways of disease – patient stratification.
3. Unprecedented efficacy – substantial treatment effects in large enough patient pool early in clinical development.
Examples of BTs: Imbruvica®: Phase I ORR 82% (9/13) (Ph.II 67%, 50/75) in chronic lymphocytic leukemia;
ORR 75% (3/4) (Ph.II 69%, 47/69) in mantle cell lymphoma.
Tagrisso®: Ph I ORR 64% (57/89) in T790M+ non-small cell lung cancer.
ceritinib: Ph I ORR 56% (45/80) in ALK+ crizotinib relapsed.
palbociclib: Ph I ORR 25% (9/36) in HR positive breast cancer. BTT for combo with letrozole in ER+, HER2- post menopausal breast cancer (PFS 26.1mo vs. 7.5mo).
volasertib: Ph I/II ORR 31% (13/42) in acute myeloid leukemia, ineligible for remission therapies (combo with cytarabine).
Breakthrough Therapy ModelRedefining risk & development speed in oncology
41

[1] Compound annual growth rate; [2] CEIC; [3] The Basic Medical Insurance Scheme for Urban Employees Residents plus Rural Cooperative Medical Schemes.
China pharmaceutical industry growth 17% CAGR[1] from 2011-2015 – one of the highest rated industries in China with average P/E ratio of 42 for the 61 listed companies (slide 45).
Government healthcare spending grew 19% CAGR[2] from 2010 – 2013 and continues to increase rapidly – Strategic priority.
Expansion of State Medical Insurance Schemes[3] – Link to increased drug reimbursement & sales.
Per capita Healthcare Spending
USA$8,845/capita
27xChina
$322/capita
Medical Insurance Enrollment[3]
160(12%)
223(17%)
China pharma market set to become the second largest globally by 2016
42
Source: National Bureau of Statistics.Source: WHO 2015 report (2012 data).
Million people (% Chinese population)
18% CAGR(2006-2014)
317(24%)
432 (32%)
536(40%)
401(30%)
473(35%)
573(42%)
06 07 08 09 10 11 12 13 14
598(44%)
105.4 130.7
156.0 183.0 196.0
226.5256.3
292.0
343.4
398.4(US$ billions)
PRC Pharmaceutical Market Size
Source: Frost & Sullivan.
15% CAGR(2016E-2020E)
17% CAGR(2011-2015)
11 12 13 14 15 16 17 18 19 20
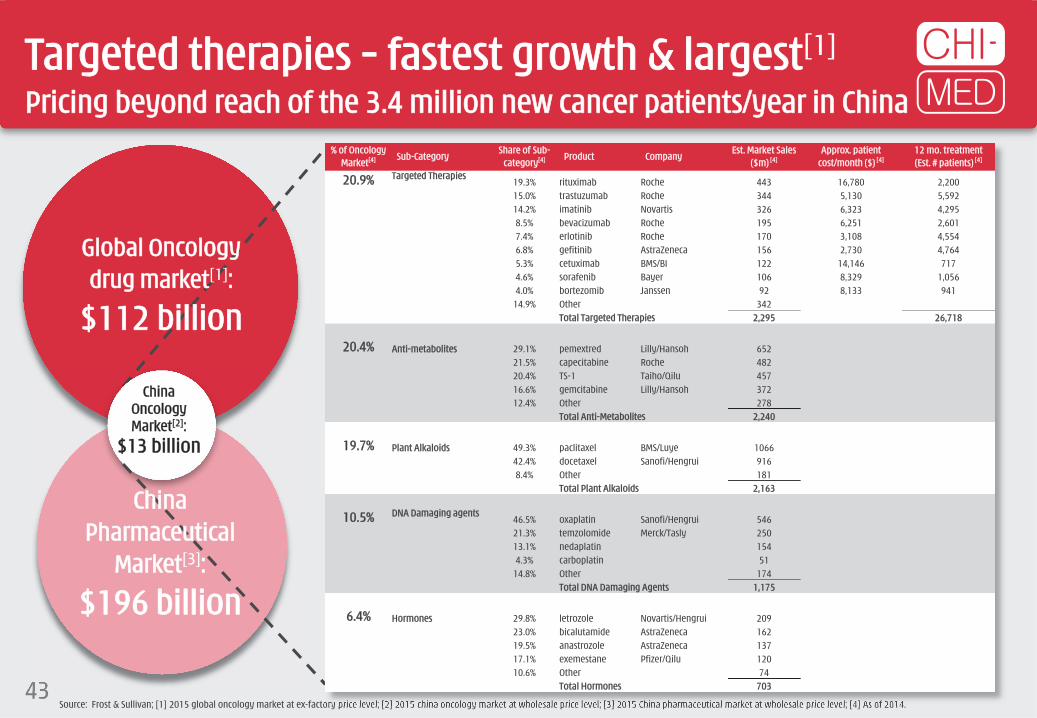
Targeted therapies – fastest growth & largest[1]
Pricing beyond reach of the 3.4 million new cancer patients/year in China
43Source: Frost & Sullivan; [1] 2015 global oncology market at ex-factory price level; [2] 2015 china oncology market at wholesale price level; [3] 2015 China pharmaceutical market at wholesale price level; [4] As of 2014.
ChinaOncology Market[2]:
$13 billion
Global Oncologydrug market[1]:
$112 billion
China Pharmaceutical
Market[3]:
$196 billion
% of Oncology Market[4] Sub-Category
Share of Sub-category[4] Product Company
Est. Market Sales ($m) [4]
Approx. patient cost/month ($) [4]
12 mo. treatment (Est. # patients) [4]
20.9% Targeted Therapies19.3% rituximab Roche 443 16,780 2,20015.0% trastuzumab Roche 344 5,130 5,59214.2% imatinib Novartis 326 6,323 4,2958.5% bevacizumab Roche 195 6,251 2,6017.4% erlotinib Roche 170 3,108 4,5546.8% gefitinib AstraZeneca 156 2,730 4,7645.3% cetuximab BMS/BI 122 14,146 7174.6% sorafenib Bayer 106 8,329 1,0564.0% bortezomib Janssen 92 8,133 941
14.9% Other 342Total Targeted Therapies 2,295 26,718
20.4% Anti-metabolites 29.1% pemextred Lilly/Hansoh 65221.5% capecitabine Roche 48220.4% TS-1 Taiho/Qilu 45716.6% gemcitabine Lilly/Hansoh 37212.4% Other 278
Total Anti-Metabolites 2,240
19.7% Plant Alkaloids 49.3% paclitaxel BMS/Luye 106642.4% docetaxel Sanofi/Hengrui 9168.4% Other 181
Total Plant Alkaloids 2,163
10.5% DNA Damaging agents46.5% oxaplatin Sanofi/Hengrui 54621.3% temzolomide Merck/Tasly 25013.1% nedaplatin 1544.3% carboplatin 51
14.8% Other 174Total DNA Damaging Agents 1,175
6.4% Hormones 29.8% letrozole Novartis/Hengrui 20923.0% bicalutamide AstraZeneca 16219.5% anastrozole AstraZeneca 13717.1% exemestane Pfizer/Qilu 12010.6% Other 74
Total Hormones 703

(US$ millions unless otherwise stated)
Drug R&D Division proxy peer group (1/2)HMP – A very deep pipeline and a very large organization/operation
44 Proxy Peer Group Criteria: companies in oncology/immunology; listed on NASDAQ; multiple Phase II clinical studies and 0-3 Phase III studies ongoing; some collaborations with multinational pharmaceutical companies; market capitalisation between $700 million and $7.5 billion (4 March 2016 data).Source: Company data, FactSet.
Mkt Cap 2015 Clinica l Pipeline # of # of studiesSym Name 4 Mar '16 15 Feb '15 10 Jul '14 Sales EBITDA Drug Studies Phase Partner drugs P1 P2 P3
Ofatumumab CLL, follicular lymphoma 1xP3, Approved Novartis 8 6 3 4Ofatumumab (subcutaneous formulation)
Pemphigus vulgaris, relapsing remitting multiple sclerosis, neuromyelitis optica 2xP3, P2 GSK, transfer to Novartis
Daratumumab Multiple myeloma, Non-Hodgkin's lymphoma P3, P2 Janssen
Tisotumab vedotin Solid cancers P1 Seattle Genetics
Teprotumumab Graves' orbitopathy, diabetic macular edema P2, P1 River Vision
HuMax-TAC-ADC Lymphoma, acute myeloid leukemia 2x P1 ADC Therapeutics
HuMax-IL8 Metastatic solid tumors P1 Cormorant Pharmaceuticals
JNJ-61186372 NSCLC P1 Janssen
JUNO Juno 4,402 3,664 NA 3,468 267 18 (237) JCAR015 Acute lymphoblastic leukemia, non-Hodgkin’s lymphoma P2, P1 – 6 5 2 0JCAR017 Pediatric acute lymphoblastic leukemia, adult non-Hodgkin’s lymphoma P1 –
JCAR014 Adult B cell malignancies P2 –
JTCR016 AML, NSCLC P1 –
JCAR023 Neuroblastoma, solid tumors P1 –
JCAR018 B Cell Malignancies P1 Opus Bio
Filgotinib Rheumatoid arthritis, Crohn's disease 2xP2 Gilead 5 4 2 0GLPG1690 Idiopathic pulmonary disease P1 –
GLPG1837 Cystic fibrosis P1 AbbVie
GLPG1972 Osteoarthritis P1 Servier
GLPG2222 Cystic fibrosis P1 AbbVie
TSRO Tesaro 1,764 1,389 1,141 1,655 275 0 (233) Rolapitant NK-1 receptor inhibitor: chemo-induced nausea and vomiting (CINV) Marketed, P1 – 2 3 1 2Niraparib PARP inhibitor: Ovarian cancer treatment/maintenance, BRCA+breast cancer, Ewing's sarcoma 2x P3, P2, 2x P1 –
AGIO Agios 1,668 4,342 1,300 1,351 ~200 59 (115) AG-221 IDH2m inhibtor: R/R AML, frontline AML, MDS/hematologic malignancies, solid tumors P3, P1/2, 4xP1 Celgene 5 11 4 2AG-120 IDH1m inhibitor: AML, R/R AML, MDS/hematologic malignancies, frontline AML, solid tumors,
IHCCP3, P2, P1/2, 4x P1 Celgene (ex-US rights)
AG-881 pan-IDHm inhibitor: R/R AML, solid tumors 2xP1 CelgeneAG-348 PK (R) activator: PK deficiency P2 –AG-519 PK (R) activator: PK deficiency P1 –
PBYI Puma 1,590 6,290 1,962 1,374 ~200 0 (213) PB272 (neratinib) Adjuvant breast cancer, metastatic breast cancer, metastatic breast cancer with brain mets, neoadjuvant breast cancer, HER2 mutated NSCLC, HER2 mutated breast cancer, HER2 mutated solid tumors
P3 completed, P3, 7x P2 – 1 0 7 2
1,368 1,857 309 895 25 0 (99) Abaloparatide-SC Osteoporosis (subcutaneous Injection) MAA submitted 3 1 2 0Abaloparatide-TD Osteoporosis (transdermal patch) P2
RAD1901 Vasomotor symptoms, Estrogen Receptor (ER) + breast cancer P2a completed, P1 Novartis Pharmaceuticals
52.0 (3.8) AZD6094 (savolitinib) c-Met TKI: PRCC x2, CCRCC x2, NSCLC x4, GC x4 P2, 11xP1b AstraZeneca
Fruquintinib VEGFR TKI: CRC, NSCLC, GC 2xP3, P1b Eli Lilly By end of Q1 2016Sulfatinib VEGFR/FGFR TKI: Neuroendocrine tumor x4, thyroid cancer 2xP3, 2xP2, P1 – 8 18 3 4HMPL-523 SYK TKI: Inflammation (RA/MS/Lupus) 2xP1 –
Epitinib EGFR TKI: NSCLC with brain mets P1b –
Theliatinib EGFR TKI: oesophageal, other solid tum. P1 –
HMPL-689 PI3Kδ TKI: hematological cancers P1 –
HMPL-004 UC induction, UC maintenance, Crohn's Under review Nestlé Health Science
6,710 173 168 87GEN-DK Genmab 7,219 4,241 2,168
1,638 ~400 66 (98)
>290
GLPG-NL Galapagos 2,043 669 601
Hutchison MediPharma
RDUS Radius Health
Ent. Value Staff

(US$ millions unless otherwise stated)
Drug R&D Division proxy peer group (2/2)HMP – A very deep pipeline and a very large organization/operation
45 Proxy Peer Group Criteria: companies in oncology/immunology; listed on NASDAQ; multiple Phase II clinical studies and 0-3 Phase III studies ongoing; some collaborations with multinational pharmaceutical companies; market capitalisation between $700 million and $7.5 billion (4 March 2016 data).Source: Company data, FactSet.
Mkt Cap 2015 Clinical Pipe line # of # of studiesSym Name 4 Mar '16 15 Feb '15 10 Jul '14 Sales EBITDA Drug Studies Phase Partner drugs P1 P2 P3
1,196 1,376 1,111 1,383 379 119 (201) Iclusig (ponatinib) ABL inhibitor: CML, Ph+ ALL, AML, lung cancer, gastrointestinal stromal tumors, medullary thyroid cancer, biliary cancer
Marketed, P3, 7x P1 5 regional partners 3 7 1 1
Brigatinib (AP26113) ALK inhibitor: NSCLC P1/2 –
AP32788 NSCLC Pre-clinical –
1,179 1,106 339 1,038 27 4 (120) Ad-RTS-IL-12 DNA-based IL-12 modulator: metastatic breast cancer, GBM P2, P1 Intrexon
CAR/Cytokine product B-cell malignancy P1 Intrexon
ADRO Aduro 1,055 NA NA 609 81 49 (26) CRS-207 Pancreatic cancer, mesolthelioma, ovarian cancer 2x P2, P1 Incyte 11 4 2 0ADU-623 Glioblastoma P1 –
ADU-214 Lung cancer P1 Janssen
ADU-741 Prostate cancer P1 Janssen
7 others Palpable tumors, oncology Pre-clinical Novartis, Genmab
938 484 633 1,118 98 37 (120) Cometriq (Cabozantinib) Medullary thyroid cancer, advanced renal cell carcinoma Marketed, NDA/MAA submitted, P3, P2
Ipsen (ex-US, Canada, Japan) 6 2 7 1
Cobimetinib MEK inhibitor: Unresectable locally adv or met melanoma Approved, P2, P1b/2, P1 Genentech XL888 HSP90 inhibitor: solid tumors P1 –SAR245408 PI3K inhibitor: Adv or recurr endometrial cancer, ER/PR+ HER2- breast cancer P2 SanofiSAR245409 PI3K/mTOR inhibitor P1b/2 SanofiCS-3150 Non-steroidal MR antagonist 2x P2b (in Japan) Daiichi-Sankyo
828 2,339 1,303 579 136 0 (293) Rociletinib EGFR inhibitor: 1L/2L/3L NSCLC NDA/MAA submitted, P3, 2xP2, P1b/2
–
Rucaparib PARP inhibitor: ovarian cancer treatment/maintenance P3, 2x P2 –
Lucitanib FGFR1-2/VEGFR1-3/PDGFRα-ß inhibitor: breast cancer, lung cancer 3x P2 Servier (ex-US & Japan)
808 1,879 1,262 518 161 5 (126) Rintega (Rindopepimut) EGFRv3 inhibitor: Front-line GBM, recurrent GBM P3, P2 – 5 1 10 1Glembatumumab vedotin Glycoprotein NMB inhibitor: TNBC, metastaic melanoma 2x P2 –
Varlilumab CD27: Lymphomas/leukemias/solid tumors,metastatic melanoma, renal cell carcinoma 5x P1/2 –
CDX-1401 (mab) NY-ESO-1 tumour antigen: Metastatic melanoma P2 –
CDX-301 (mab) Flt3 inhibitor: Hematopoietic stem cells, B-cell lymphomas P2, P1 –
720 619 935 705 317 57 (98) Mirvetuximab soravtansine ADC: FRα+ ovarian and other solid tumor P2, P1 Merck
Coltuximab savtansine CD19+ antibody: diffuse large B-cell lymphoma P2 Returned by Sanofi
IMGN-529 ADC: CD37+ Non-hodgkins lymphoma and CLL P2 –
Kadcyla (Herceptin ADC) HER2+ met BC 2L, met BC 1L, BC others, gastric, NSCLC Marketed, P3 Roche; TPG bought all royalties
Isatuximab CD38 antibody: r/r multiple myeloma P2 Sanofi
Indatuximab ravtansine ADC targeting CD138: multiple myeloma, triple negative met breast cancer, met bladder cancer P2, P1 Biotest
9 others, all partnered Solid tumors, Mesothelioma, Glioblastoma, Kidney, P-cad+ cancer P2, 6xP1 Amgen, Bayer, Lilly, Novartis, Sanofi, Takeda, CytomX
AVERAGE (ALL 14) 1,913 2,327 1,089 5 4 4 1MEDIAN (ALL 14) 1,282 1,857 1,126 5 4 3 1
52.0 (3.8) AZD6094 (savolitinib) c-Met TKI: PRCC x2, CCRCC x2, NSCLC x4, GC x4 P2, 11xP1b AstraZeneca
Fruquintinib VEGFR TKI: CRC, NSCLC, GC 2xP3, P1b Eli Lilly By end of Q1 2016Sulfatinib VEGFR/FGFR TKI: Neuroendocrine tumor x4, thyroid cancer 2xP3, 2xP2, P1 – 8 18 3 4HMPL-523 SYK TKI: Inflammation (RA/MS/Lupus) 2xP1 –
Epitinib EGFR TKI: NSCLC with brain mets P1b –
Theliatinib EGFR TKI: oesophageal, other solid tum. P1 –
HMPL-689 PI3Kδ TKI: hematological cancers P1 –
HMPL-004 UC induction, UC maintenance, Crohn's Under review Nestlé Health Science
2
815 6 1
02 2 1
EXEL Exelixis
3 0 8
>290
ARIA Ariad
Hutchison MediPharma
Ent. Value Staff
IMGN ImmunoGen
ZIOP Ziopharm
CLVS Clovis
CLDX Celldex

China Commercial Platform has substantial value Chi-Med’s Commercial Platform continues to perform well relative to our peer group.
The real market value, based on peer group multiples is approximately $1.5 billion.[3]
Considering our share in the JVs, Chi-Med’s share of this value is approximately $680 million.
46[1] Total aggregate PRC domestic results of Chi-Med’s 6 Commercial Platform companies (HBYS, SHPL, Hutchison Sinopharm, HHO, HHL, & HCPL), excluding discontinued operations; [2] Price Earnings Ratio as at June 30, 2015: Trailing Twelve Month PE weight averaged based on market capitalisation); [3] Peer group multiple of 27 x $53.9million -- Reported LTM 2015 NPAT).
Peer Group: 10 companies (excl. Chi-Med) selected as ALL listed and profitable mainland Chinese OTC/RX pharma manufacturing companies, with a focus on similar product types, and estimated 2014 Net Sales in the ~$400-1,000 million range.
(US$ millions)
NET SALES NET PROFIT VALUATION
Code2013 2014
LTM2015 Jun
13-14Growth
2013 2014LTM
2015 Jun13-14
GrowthLTM
MarginMarket
Cap.P/E[2]
CHI-MED Commercial Platform -- Subsidiaries/JVs[1] 402.3 465.4 505.2 16% 39.7 48.8 53.9 23% 11% na na
Tianjin Zhong Xin Pharma 600329 912.8 1,076.4 1080.4 18% 54.8 57.6 62.6 5% 6% 2,146 29Li Zhu Pharma 000513 701.5 842.1 916.0 20% 79.6 84.1 93.4 6% 10% 2,353 32Shandong Dong E E Jiao 600422 610.0 608.9 733.5 0% 185.3 208.4 231.8 13% 32% 4,303 18Zhejiang Kang En Bai Pharma 600572 444.1 544.0 624.8 22% 69.0 110.5 132.2 60% 21% 1,778 27Kunming Pharma 000423 544.4 625.8 646.2 15% 35.8 46.7 56.2 31% 9% 2,672 24Guizhou Yi Bai Pharma 600750 423.0 479.5 530.9 13% 65.5 73.1 57.0 12% 11% 1,705 35Jin Ling Pharma 000919 395.8 421.0 449.3 6% 28.9 37.2 39.4 29% 9% 974 34Jiangsu Kang Yuan 600557 338.7 389.3 418.4 15% 45.7 49.1 53.5 7% 13% 1,583 30Jiang Zhong Pharma 600750 421.9 430.5 419.7 2% 26.4 40.5 47.2 54% 11% 1,058 21Zhuzhou Qian Jin Pharma 600479 299.6 333.3 345.7 11% 19.6 17.9 16.3 -9% 5% 707 46Peer Group -- Weight Avg. (10 Comps. excl. Chi-Med) 509.2 575.1 616.5 13% 61.0 72.5 79.0 19% 13% 1,928 27
61 Listed China Pharma. Companies -- Weight Average 822.7 915.4 960.1 11% 60.1 67.2 73.1 12% 8% 2,305 42

Thank you