chemicals sector future growth opportunities - africa must be part of your strategy
TRANSCRIPT

Chemicals Sector Future Growth Opportunities
Is Africa a Part of Your Strategy?
Mani James, Operations Director, Africa
Ross McLean, President, Dow Africa
Chemicals, Materials, and Food
2 July 2014
© 2014 Frost & Sullivan. All rights reserved. This document contains highly confidential information and is the sole property of Frost & Sullivan. No part of it may be circulated, quoted, copied or otherwise reproduced without the written approval of Frost & Sullivan.

2
Today’s Presenters
Mani JamesOperations Director- Africa
Frost & Sullivan, AfricaCape Town
Functional Expertise
• Over 13 years of management and strategy consulting experience, having worked for clients in North America, South East Asia, Asia Pacific and Africa.Particular expertise in:
- Market assessment and analysis
- Strategy creation and implementation
- Market entry and expansion strategies
- Customer analysis and segmentation
- Competitive strategy
- Solutions modeling and implementation
Industry Expertise
� Experience base covering a broad range of sectors, working with senior executives to develop and implement strategies across a range of geographies, with particular expertise in:
- Petrochemicals, bio-fuels, materials handling, food additives and chemicals in Africa
- Industrial automation and supply chain management
- Manufacturing
Ross McLeanPresident
Dow AfricaJohannesburg
Ross McLean, is leader for Sub-Saharan Africa and oversees Dow’s growth and expansion across the region.
Ross joined Dow in August 1997 as Finance Director of the South African agricultural chemicals division. Assuming the role of Regional Finance Director for Dow’s Africa operations in 2001, he later added the role of Country Leader and Managing Director for South Africa, to his responsibilities. During this period, Ross led several transactions to divest non-core assets in South Africa, managing successive organizational changes to realign the local team to support Dow’s ongoing business.
Relocating to Dubai in 2006, Ross assumed responsibility for various business development projects in India and the Middle East while developing Dow’s market entry strategy for Africa. Ross has over 20 years experienced in chemicals and related industries. His career spans finance, general management, mergers & acquisitions and strategic development roles in South Africa, the United Kingdom and the United Arab Emirates.

3
Focus Points
1. Occasion for the Analyst Briefing
2. Mega Trends: Then and Now
3. Case Study on DOW Chemical Company – Africa Story
4. Mega Trends: Fast Forward to 2022
4
Poll Question 1
Which group of sub-Saharan African countries are anticipated to provide future growth opportunities after South Africa, Nigeria, Kenya, and Ghana?
• Uganda, Tanzania, Ethiopia, and Rwanda
• Mozambique, Angola, Tanzania, and Zambia
• Rwanda, Uganda, Botswana, Ethiopia, and Namibia

5
Agenda
This analyst briefing:
o Mega Trends in 2010
o Success story in Africa – Dow Africa
o Mega Trends 2022
o Q & A Session

6
Urbanisation: Then and Now
Water and Wastewater Treatment
Construction & Infrastructure (Chemicals)
Urbanisation rates will continue to increase in all African regions
62%50% 51%
24%
63%
50% 52%
25%
Urbanisation as a % of Total Population: 2010 2014
Revenue Prediction in 2010 for 2013
Actual Revenues
in 2013
SouthAfrica
$916.3M $855.0M
Nigeria $241.2M $215.0M
Kenya $88.6M $82.5M
Revenue Prediction in 2010 for 2013
Actual Revenues
in 2013
SouthAfrica
$174.8M $160.0M
Kenya $73.2M $67.5M
Nigeria $160.5M $155.0M
South Africa Nigeria Ghana Kenya
Revenue Prediction in 2010 for 2013
Actual Revenues in
2013
South Africa $19.7B $19.6B
Nigeria $16.3B $16.0B
Revenue Prediction in 2010 for 2013
Actual Revenues in
2013
South Africa $4.5B $4.4B
Nigeria $273.4M $274.0M
Kenya $106.5M $105M
Ke
y D
rive
rs
for
co
ntin
ued g
row
th
Water and wastewater treatment growth to increase to achieve millennium development goals
Urbanisation and growing middle income earners continue to drive demand for commodity products
Materials – Packaging
Oil & Gas – Petrochemicals
Source: IMF, Frost & Sullivan

7
2010
2010
2010
2010
Road Rail Electricity Airports Telecom
2013
2013
2013
2013
Road Rail Electricity Airports Telecom
Infrastructure Development: Then and Now
Road and rail = km per 1000 capita; Electricity = MW per 1000 capita; Airports and telecom per capita
$XXBKenya ($B) Ghana ($B) South Africa ($B)Nigeria ($B)
15%
Investment since 2010
to 2013 to $2.9B
Investment since 2010
to 2013 to $1.5B
4%
Investment since 2010
to 2013 to $6.5B
7%
Infr
astr
uctu
re
Eff
icie
ncy
Ra
nkin
g
109 Ghana
135 Nigeria
1
148
102 Kenya
66 South Africa
6.4 4.525.4
15.284.6
64.2
Planned spend 2010-2013
Actual spend 2010-2013
10.75.9
Planned spend 2010-2013
Actual spend 2010-2013
Planned spend 2010-2013
Actual spend 2010-2013
Planned spend 2010-2013
Actual spend 2010-2013
Source: IMF, World Bank, PWC, Frost & Sullivan

8
Sustainability: Then and Now
HydroFossil Fuels (includes nuclear for SARenewables
2010 2013
2010 2013
Kenya: Energy Mix Evolution
South Africa: Energy Mix Evolution
2010 2013
Ghana: Energy Mix Evolution
2010 2013
Nigeria: Energy Mix Evolution
15%
KenyaAgriculture yield
by 2030 with a
2% GDP
investment in a green economy
24%
South AfricaIncrease crop yields by 2030 –investing in ecological practices
Source: The Financial Times Limited, Frost & Sullivan
Trillion cubic feet shale gas reserves in South Africa
468
Planned or possible investment in the US by chemicals companies to use shale gas
$91B
Reduction in price since 2011 for ethane in the US produced from shale feedstock
>1/3
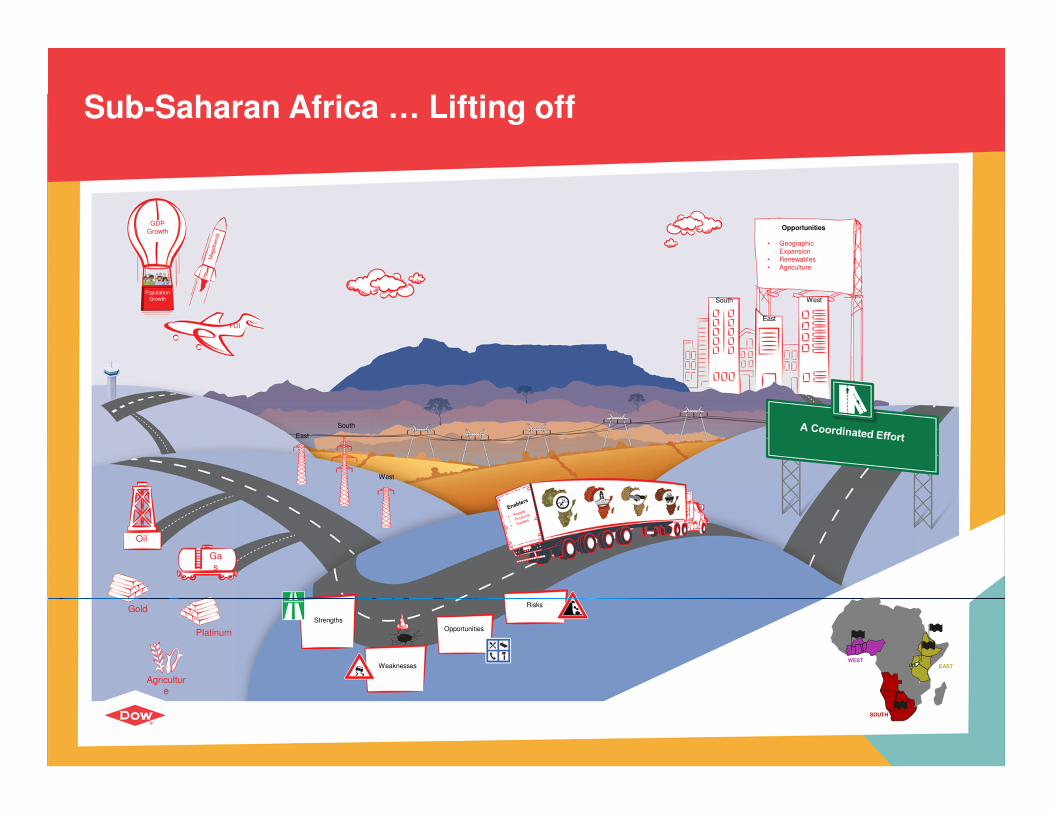
Sub-Saharan Africa … Lifting off
EAST
SOUTH
WEST
GDP Growth
Population Growth
FDI
South
West
East
Oil
Gas
Strengths
Weaknesses
Opportunities
RisksGold
Agriculture
Opportunities
• Geographic Expansion
• Renewables• Agriculture
South West
East
Platinum

10
Mega Trends: Fast Forward to 2022
Urbanisation and Infrastructure Development
Energy Demand and Resource
Drain
Water and Food Scarcity
Supply Chain Efficiencies
Emerging African Economies

11
Emerging African Economies
• x
South Africa
Nigeria
Kenya
Ghana
IndicatorAngola Tanzania
2014 GDP ($ billion) 129.79 36.61
GDP Growth Rate (2015-2019)
5.6% 7.0%
Manufacturing Size($ million in 2012)
7,220.4 2,609.2
Ease of Doing Business (2014) 179/189 145/189
Indicator Zambia Mozambique
2014 GDP ($ billion) 24.85 17.35
GDP Growth Rate (2015-2019)
6.6% 7.8%
Manufacturing Size($ million in 2012)
1,723.6 *1,573.9
Ease of Doing Business (2014) 83/189 139/189
Source: IMF, World Bank, Frost & Sullivan* 2011 data
Rw
anda
MATZ and
RUBEN
INTRODUCING...

12
Poll Question 2
Have you identified the right distribution partners for your African Growth Strategy?
• Yes
• Not sure, time will tell
• No, we are searching for alternatives
13
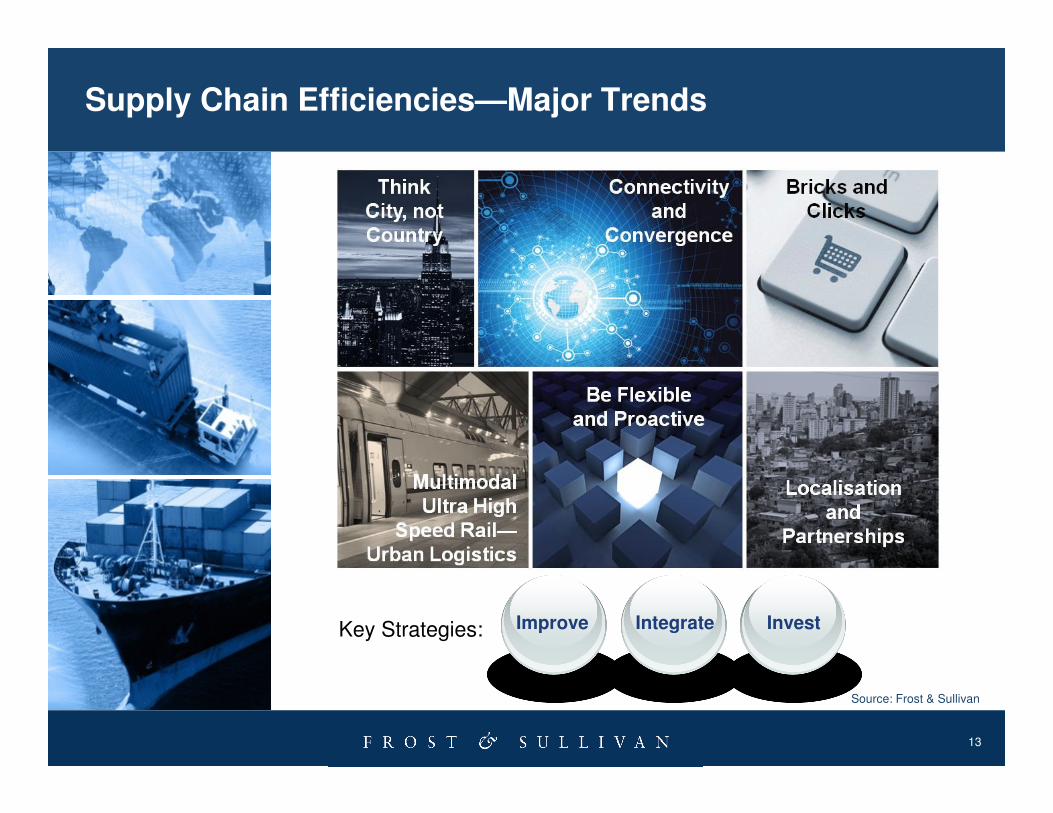
Supply Chain Efficiencies—Major Trends
Source: Frost & Sullivan
Improve Integrate InvestKey Strategies:

14
Supply Chain Efficiencies—Logistics Performance Index
Source: World Bank, Frost & Sullivan
Logistics Performance Index, Global, 2010 and 2014
Year Rank Score
Angola2014 112 2.54
2010 142 2.25
Tanzania2014 138 2.33
2010 95 2.60
Zambia2014 123 2.46
2010 138 2.28
Mozambique2014 147 2.23
2010 136 2.29
Uganda2014 - -
2010 66 2.82
Ethiopia2014 104 2.59
2010 123 2.41
Namibia2014 93 2.66
2010 152 2.02
Botswana2014 120 2.49
2010 134 2.32
Rwanda2014 80 2.76
2010 151 2.04
Growth of African Cities% increase, 2010- 2025 forecast
0 50 100
Cape Town
Johannesburg
Durban
Cairo
Casablanca
Algiers
Alexandria
Douala
Accra
Ibadan
Lagos
Dakar
Abidjan
Addis Ababa
Luanda
Kinshasa
Nairobi
Dar es Salaam

15
Urbanisation and Infrastructure Development—$28 billion will be invested in transport corridor development
Road
Rail
Ports
$9.2 billion
$14.8 billion
$3.5 billion
Roads in good condition
Western 72%
Central 49%
Eastern 82%
Southern 100%
Container dwell times (International standard: 7 days)
Western 11-30 days
Eastern 5-28 days
Southern 4-8 days
Freight transport by rail
Western 11%
Central 2%
Eastern 2%
Southern 85%
Existing road networks will be rehabilitated and expanded to create nine Trans-African Highways
Rail networks will be extended and upgraded to complement the Trans-African highways
Capacity building at ports will decrease bottlenecks and support growth in trade and industry
Ten transport corridors are being developed across the region to improve road and rail networks and increase port capacity
Current State of Transport Infrastructure:
*based on active projects in 2013 Source: World Bank; Frost & Sullivan

16
Energy Demand and Resource Drain—African Trade Corridors: What is driving their development and why?
C
B Bauxite
UraniumGold
Copper
Diamonds Oil
Gas Timber
KEY:
Iron Ore
Coal
C
CC
CC
C
C
BB
B
Is the Green Economy relevant to Africa? Source: EIA; Frost & Sullivan
Angola:
• Second-largest oil producer in SSA with 1.8 million barrels per day in 2013
• Second-largest volume of proved natural gas reserves in SSA in 2014 (9.71 trillion cubic feet)
• First LNG plant opened in 2013 in Soyo
Mozambique:
• Contains 4.5 trillion cubic feet of proved natural gas reserves
• First commercial crude oil production to take place in Inhassoro in 2014
Tanzania:
• Produces small volumes (32.8 billion cubic feet in 2012) of natural gas for own use
• Future export opportunities with offshore natural gas discoveries

17
Water and Food Scarcity
2012 Global Hunger Index
Level of Severity
Angola 24.1 Alarming
Tanzania 19.3 Serious
Zambia 23.3 Alarming
Mozambique 23.3 Alarming
Uganda 16.1 Serious
Ethiopia 28.7 Alarming
Namibia 13.2 Serious
Botswana 13.7 Serious
Rwanda 19.7 Serious
Source: IFPRI, Frost & Sullivan
Increase in net food imports at constant prices in sub-Saharan Africa since 2000 (FAO).>60%
Cereal yield (kg per hectare) vs. rate of developed countries
Sub-Saharan African share of the global crop protection market
5%
Fertilizers used per hectare (aim is 50kg) compared to 80kg, the world average.
Soil degradation. Annual mineral nutrient loss ranges from 30kg to 60kg per hectare (Henao & Baanante).
75%
27%
9kg
In Africa:
Income from crop production
Annual value of grain is lost postharvest
70%
15%
Ageing infrastructure, water leakages
Dam rehabilitation
Treatment plants need to keep pace with urbanisation
1
34
5
2
Severity

18
Key Take-Aways – Success factors in Africa
Key Cash cow products in the broad range
Strengthen e-commerce platforms
Affordable product pricing
Strong local Distributor partnerships
Country and city specific strategy
Regulatory and incentive policies by country
Trusted brand & loyalty -Strong local presence
Key
Success Factors
Aggressive product promotion
“Do not judge me by my successes, judge me by how many times I fell down and got back up again” Nelson Mandela
19
Next Steps
Develop Your Visionary and Innovative SkillsGrowth Partnership Service Share your growth thought leadership and ideas or
join our GIL Global Community
Join our GIL Community NewsletterKeep abreast of innovative growth opportunities

20
Your Feedback is Important to Us
Growth Forecasts?
Competitive Structure?
Emerging Trends?
Strategic Recommendations?
Other?
Please inform us by “Rating” this presentation.
What would you like to see from Frost & Sullivan?
21
https://twitter.com/frostsullivansa
Follow Frost & Sullivan on Facebook, LinkedIn, SlideShare, and Twitter
http://www.facebook.com/FrostandSullivan
http://www.linkedin.com/companies/4506
http://www.slideshare.net/FrostandSullivan

22
For Additional Information
Samantha James
Corporate Communications
African Operations
+27 21 680 3574
Mani James
Operations Director
African Operations
+27 21 680 3208
Avril Harvey
Team leader
Chemicals, Materials and Food
+27 21 680 3283
Danielle Kruger
Strategic Account Manager
Chemicals , Materials and Food
+27 21 680 3262