charity investment annual 2018 - cazenove capital
TRANSCRIPT

Charity Investment Annual 2018

Charity Investment Annual 20182

Charity Investment Annual 2018 1
Welcome
In this annual we pull together a collection of interesting articles that we believe are useful reading for long-term charity investors. We capture some of the current talking points and cover updates in regulatory and investment thinking that may be relevant to the management of your charitable assets.
Giles Neville Head of Charities
ContentsInvestment thoughtsStrong foundations 2
Our world in data 4
The case for active asset management 6
Value for Money 12
The company earnings at risk from rising carbon prices 14
Lessons for the long term 16
Sector thoughtsIn the sector press 18
Association of Charitable Foundations Giving Trends 2017 Research 21
The UK Civil Society Almanac 2017 22
Governance thoughtsCharity Governance Code 24
Investment committees 25
Investment Committee Example terms of reference 27
ContributorsGavin Ralston Head of Thought Leadership
Elroy Dimson Judge Business School, Cambridge
Kate Rogers Head of Policy, Charities
Andrew Howard Head of Sustainability Research

Charity Investment Annual 20182
Strong foundationsHow are charitable foundations planning for the long term during short-term uncertainty? Charity Finance, with the support of Cazenove Charities, convened a panel of experts and Ian Allsop noted their opinions. An extended version of this article originally appeared in Charity Finance Magazine in May 2017 and appears online at civilsociety.co.uk
The UK has a strong and vibrant foundation sector, the members of which have to strike a balance between present and future beneficiaries. Their independence and longevity of funding gives them an ability to influence and shape policy in both the short and long term. But how do they plan for tomorrow without becoming distracted by what is happening today? And are current models of governance able to maximise the effectiveness that foundations have?
Maintaining spending Karl Wilding, director of public policy and volunteering at NCVO, cites evidence of how foundations behaved following the disruption of the financial crisis. Referring to the NCVO UK Civil Society Almanac, he says: “From 2008/09, foundations carried on making grants because they were needed more than ever. There was a clear message that beneficiaries wouldn’t be abandoned.”
Returning to the present, Matthew Cox, investment director at the Esmée Fairbairn Foundation, says his organisation is carrying on as usual. “Our biggest risk is not hitting our long-term return target, which is inflation plus four per cent, and our job in the short term is to not get distracted from that. There are secondary risks of market uncertainty and volatility, but while we would be concerned that they would hit our cash flow, we would hope that the portfolio has been set up to deal with that. We lock up money for the long term, but have a liquidity reserve to free up cash in the short term.” Cat Fraser, principal – investments at Wellcome Trust, echoes this. “Our focus is on cash flow now more than ever. We have committed to spending £5bn in the next five years.”
For David Renton, director of finance and investment at Guy’s and St Thomas’ Charity, foundations must hold their nerve. “If we get too worried in the short term, it affects our long-term thinking. We need to have the confidence to stick to our risk levels. It can be difficult to predict the markets. They are currently riding high despite political uncertainty – we shouldn’t fixate on value today or else we won’t stay in shape for the long term.”
For James Fitzpatrick, the big challenge is about balancing the need to conserve capital, generate income and spend money. He asks: “There is always uncertainty, but how should foundations best manage the balance between money in – the finance side – and money out – the grantmaking?” Renton mentions the introduction of a spending rule at Guy’s that is aimed at dealing with this. “We’d had a committee looking at investments, and it was quite divorced from the team doing grants. The advent of the spending rule was to try to bring those together; so how much investment risk we need to take in order to generate what we’re spending. There is an element of smoothing included, so if markets change, the spending doesn’t change so dramatically.
Investment thoughts
Panellists:
Matthew Cox, Investment Director, Esmée Fairbairn Foundation
James Fitzpatrick, Director, Joseph Levy Foundation
Cat Fraser, Principal - Investments, Wellcome Trust
Giles Neville, Head of Charities, Cazenove Capital
David Renton, Director of Finance and Investment, Guy’s and St Thomas’ Charity
Karl Wilding, Director of Public Policy and Volunteering, NCVO

Charity Investment Annual 2018 3
Smoothing allows a longer-term horizon for spending decisions – even if we model a 20 per cent fall in markets and them staying down for five years, actually we still have a 90 per cent degree of confidence in what we will have to spend. And that’s enormously powerful because then we can start funding longer-term programmes.” Giles Neville, head of charities at Cazenove Capital, observes that in the short term, investment is about responding to opportunity. “Are you picking up long-term trends? Are your targets realistic? Investors should look at demographics, and issues such as global inclusivity versus isolationism. It is about using the here and now to assess an impact on returns in the long term. It can be difficult, but it is important.”
Perfect timing All of which illustrates the importance of timing when making investment decisions. Neville reflects on the specific conflict that exists between the short and long term in terms of trustee decision-making, especially in times of nervousness. “Do they have enough of a sense of security to ensure they are less likely to sell at the wrong time?” Fraser recalls that when she joined Wellcome at the end of 2008, there were plenty of concerns about the wisdom of buying global equities after the collapse of Lehman Bros. However, after a healthy debate, her investment committee was supportive of the actions the investment team was taking. “Having an empowered investment team is really helpful in making difficult decisions like this in a timely fashion,” she says.
Renton says there is a risk of selling stocks at the wrong moment. “You don’t want to rush for the exit at the wrong time. Policies that smooth are helpful as they provide the framework to have a discussion and offer greater investment freedom. “It is also about monitoring and providing information,” he says. “If you can look back and see patterns from history, it can provide reassurance in difficult times.” Cox agrees that as long-term investors, this can help overcome nervous or over-cautious trustee reactions. “You need to spend time on communicating the investment process when times are good so that everyone is aligned when the more challenging market conditions arrive, as they inevitably do.”
Supportive governance Fitzpatrick raises the issue of governance when managing for the long term. “In my experience, the default position of boards is to conserve. When developing investment strategy, boards should seek external expertise if they don’t have the expertise themselves. But there is a risk that they end up with a product that they don’t have the skills to implement effectively.” He says the problem is not recruiting trustees per se, but recruiting trustees with the right skills. “Foundations are charities with capital. Therefore we probably find it easier than other charities to recruit trustees. ‘Come and help us spend money’ is an attractive proposition. But do all foundations use skills audits to identify the range of specific skills required? It may be possible to find trustees with financial expertise, but not specifically investment-related.”
Renton argues that the governance challenge for the foundation sector is that organisations are effectively running two businesses. “We are managing money and spending for impact. Does our governance always reflect that? It is important to have both angles represented on boards.” Cox thinks that the lines between spending and managing the investment portfolio have become increasingly blurred. “There is much more direct engagement from the board now; trustees are more clued-up.”
Wilding suggests that for better strategic philanthropy, some organisations might consider collaboration to bring greater scale. Fitzpatrick agrees. “Are there opportunities to pool resources? It is beholden on individual foundations to identify opportunities for collectively using assets. “However,” he continues, “it can be difficult bringing people together. Sometimes independence can go too far. Being independent for the sake of it has an opportunity cost.” Cox highlights collaborative investor engagement as an example of how to make a long-term impact. “There is a link between businesses that are managed in a sustainable way and long-term value creation for shareholders.” Indeed, Neville concludes that there are opportunities for foundations to collaborate directly with the corporate sector, as companies are increasingly recognising the importance of expressing social values, especially given the importance placed on this by millennials. “Ultimately, charities have a collective knowledge and history of effecting change that the corporate world doesn’t.”

Charity Investment Annual 20184
1820 1840 1860 1880 1900 1920 1940 1960 1980 20152000
6 not living inextreme poverty
94 living in extreme poverty
90 not living inextreme poverty
10 living in extreme poverty
1820 1840 1860 1880 1900 1920 1940 1960 1980 20152000
83 have not attainedany education
17 have basiceducation or more
14 have not attainedany education
86 have basic education or more
1820 1840 1860 1880 1900 1920 1940 1960 1980 20142000
88 are not ableto read
12 are ableto read
15 are not ableto read
85 are able to read
Our world in dataExtreme Poverty
Basic Education
Literacy
Data sources: Extreme Poverty: Bourguignon & Morrison (2002) up to 1970 — World Bank 1981 and later (2015 is a projection).Education: OECD for the period 1820 to 1960. IIASA for the time thereafter.Literacy: OECD for the period 1820 to 1990. UNESCO for 2004 and later.
All these visualizations are from OurWorIdInData.org an online publication that presents the empirical evidence on how the world is changing.

Charity Investment Annual 2018 5
1820 1840 1860 1880 1900 1920 1940 1960 1980 20152000
99 not livingin a democracy
1 livingin a democracy
44 not livinga democracy
56 livingin a democracy
1820 1840 1860 1880 1900 1920 1940 1960 1980 201520000 vaccinated
14 not vaccinated
86 vaccinated
1820 1840 1860 1880 1900 1920 1940 1960 1980 20152000
57 survive the first5 years of life
43 die before theyare 5 years old
96 survive thefirst 5 years of life
4 die before theyare 5 years old
The world as 100 people over the last two centuries
Democracy
Vaccination against diphtheria, pertussis (whooping cough), and tetanus
Child Mortality
Data sources: Democracy: Politiy IV index (own calcluation of global population share)Vaccination: WHO (Global data are available for 1980 to 2015 — the DPT3 vaccination was licenced in 1949)Colonialism: Wimmer and Min (own calcluation of global population share)Continent: HYDE databaseChild mortality: up to 1960 own caluclations based on Gapminder; World Bank thereafter

Charity Investment Annual 20186
The case for active asset managementThe shift of money from active to index funds seems decisive proof of investors’ belief in the superiority of passive investing. According to Broadridge, the financial data provider, nearly $2.4 trillion has flowed into passive Exchange Traded Funds (ETFs) in the US over the last 15 years, while $500 billion has flowed out of active funds. But seemingly unstoppable investment trends have a habit of reversing unexpectedly.
Our research suggests that investors should keep an open mind:
– Some of the data overstates the case for passive
– It is wrong to extrapolate from the US that the index is hard to beat in all markets
– Passively replicating many bond market indices is almost impossible.
– Active management needs to be judged over lengthy time periods.
We also find that some of the benefits of active management have been overlooked. Active managers:
– Hold companies to account
– Help to direct capital into faster-growing industries
– Work to improve standards of governance and make businesses more sustainable.
The classic academic view of active management was proposed by Professor William Sharpe, who argued1 that, “after costs, the return on the average actively managed dollar will be less than the return on the average passively managed dollar.” In reaching this conclusion, he assumed that the index represented the entire range of investment opportunities, and that all participants were motivated by the same objectives.
Since Sharpe many researchers have demonstrated that markets are less efficient than once thought, and that investors’ behavioural biases create opportunities for arbitrage by active managers2. Moreover, not all investors necessarily want to beat the market.
1. “The Arithmetic of Active Management”, Financial Analysts’ Journal, Jan/Feb 1991.
2. For instance, Andrew Lo argues in Adaptive Markets, Princeton University Press, 2017, that humans are incapable of the rational thinking required to underpin efficient markets.
Hedge funds, for example, aim to generate strong absolute returns. Central banks manage the supply of money by investing in bond markets, while governments that own stakes in companies may seek to maintain employment or control natural monopolies.
This extends to individual savers and pensioners, many of whom seek an outcome that meets a savings goal or enhances their income before or during retirement. For these investors, success is likely to depend on allocating to the right asset classes. This cannot be done passively. There is no index that can be aligned with a real world outcome such as inflation plus 4%.
We have written before3 about the inadequacies of a purely passive approach to asset allocation. Dynamic asset allocation can make for better outcomes. It may be enhanced by the greater use of ETFs as tools for trading in and out of markets. Nonetheless, it is an active skill and cannot be replicated cheaply.
A newer dimension in the active/passive debate is factor investing (or smart beta).4 Such rules-based strategies have tended to outperform market capitalisation-weighted indices over most past periods. Not only has factor investing outperformed the indices most passive funds use (Figure 1), it has delivered excess returns more cheaply than traditional active management.
3. Asset allocation: We can’t afford to be passive, Schroders, October 2016.
4 For more see “Understanding Factors”, Investment Horizons, issue 6, Schroders 2016.
Gavin Ralston Head of Thought Leadership
Gavin Ralston is Head of Official Institutions and Thought Leadership at Schroders. The first role involves managing Schroders' relationships with government institutions, including central banks, sovereign wealth funds and national pension funds. Gavin is also responsible for the production, coordination and distribution of the firm's thought leadership material. He joined Schroders in 1980 and is based in London.

Charity Investment Annual 2018 7
Passive reality looks less rosyMuch of the data used to demonstrate the weakness of active management comes from US equities. We accept that the indices in large cap US equities have been hard to beat consistently, but it is wrong to extrapolate this conclusion to other markets. This becomes clear when the real experience of an investor in non-US markets is investigated.
It is often assumed that the performance a passive investor experiences is equivalent to that of the market index. In reality, indices suffer neither trading nor management costs. A more realistic comparison is with the performance of passive funds themselves, such as ETFs, that bear real management fees and trading costs. Conducting such an exercise, as we have done in Figure 2, suggests that in many markets the argument that most active funds underperform is far from clear cut. The bottom row of Figure 2 shows the percentage of funds that have outperformed respective ETFs in the 5-year period. In calculating the percentages, we have included the performance of closed and open ended funds.
Figure 2: A realistic reflection of investors’ experience shows active in a better light ETF cumulative returns vs. benchmark five years to 31 March 2017
UK equities
EM equities
Eurozone equities
Japan equities
Global aggregate US HY
EMD US dollars
ETF 51.2% 1.1% 37.3% 36.4% 17.8% 27.4% 27.2%
Benchmark 53.0% 4.1% 38.0% 39.1% 18.7% 35.1% 32.0%
Difference -1.8% -3.0% -0.7% -2.7% -0.9% -7.8% -4.9%
Proportion of active fundsunderperforming the ETF
29% 51% 63% 54% 44% 32% 60%
Returns are shown in US dollars except for UK equities in sterling. Includes actual performance of funds closed and opened during the period. Source: UK equities, iShares Core FTSE 100 UCITS ETF; Emerging Markets equities: iShares MSCI Emerging Markets ETF; Eurozone equities, iShares MSCI Eurozone ETF; Japanese equities, iShares MSCI Japan ETF; Global Aggregate, Vanguard Global Bond Index fund – Institutional hedged (USD); US high yield, SPDR® Bloomberg Barclays High Yield Bond ETF; EMD, iShares J.P. Morgan USD Emerging Markets Bond ETF.
Figure 1: Five equally-weighted factors have beaten the index
The data measures an equally-weighted portfolio of five MSCI factor indices: value, quality, min vol, momentum and small size, rebalanced monthly. Source: MSCI and Schroders. Data to 30 April 2017.
0
50
100
150
200
250
300
350
400
450
20162014201220102008200620042002
MSCI ACWI-smart beta portfolio MSCI ACWI

Charity Investment Annual 20188
Looking at this more closely, we focused on two equity sectors, UK and emerging markets, to show how active performance has varied over time. We looked at monthly excess returns, net of fees – in this case against the index. Unlike previous studies, we included only funds that are benchmarked to a broad index. By doing so, we excluded the funds that are either not benchmarked, or funds that employ a specific strategy, such as (Environmental, Social and Governance) or special situations. Figures 3 and 4 display the percentage of active funds that have outperformed their benchmarks on a rolling five-year basis. We acknowledge that these numbers include survivorship bias since only funds that have a full five years of performance history at a given date were included in the calculation.
Data from the UK (Figure 3) shows that the performance of active managers is cyclical, but that there have been several periods, including the present, when well over 60% of active funds have outperformed net of fees5. Figure 4 shows a similar pattern for active emerging markets equities, with active performance improving steadily since 2008.
There is also good evidence that managers who perform well over the longer term experience significant periods of underperformance in the short term. The Vanguard Group published a study in 20156 which showed that, of the 552 active US equity funds which had beaten the index over the previous 15 years, 98% had underperformed in four or more individual years.
This is an important consideration for investors who use active managers: they are more likely to achieve good outcomes if they do not abandon a strategy after a short period of underperformance.
Another important consideration for the investor is the fees they are charged. We measured active performance against indices net of fees, which, as discussed, penalises performance as the index bears no costs. Assuming a 0.30% average annual passive fee7 for UK equities over a 26-year period, the passive fund would have trailed the benchmark by 8%. So while many active funds may have underperformed the index, 100% of passive funds have underperformed.
The point about measuring the real cost of passive management is most visible in emerging markets, where the costs of acquiring market exposure have been higher (until recently typically 0.75%) than in developed markets. Of course, the cost of passive has fallen significantly in the last few years, raising the standard against which active managers will be measured in future, but in many markets passive costs are still material.
5. We discuss the conditions when active managers tend to outperform in our research paper, The acid test of active management.
6. https://personal.vanguard.com/pdf/ISGKEY.pdf, October 2015.
7. The Vanguard ETF tracking the FTSE 100 had an expense ratio of 0.40% up to 2015, according to Morningstar data.
Figure 3: Active performance has improved in the UK… UK percentage of funds outperforming (rolling five years) (%)
Investment Association primary retail share class active UK equity funds domiciled in the UK in sterling. Source: Morningstar, Schroders. Data to March 2017.
0
10
20
30
40
50
60
70
80
90
20162013201020072004200119981995
Figure 4: …and amongst active emerging markets funds Percentage of emerging markets funds outperforming (rolling five years) (%)
Active EM equity funds domiciled in the US denominated in US dollars; retail share class with longest history. Source: Morningstar, Schroders. Data to March 2017.
0
10
20
30
40
50
60
70
80
201620132010200720042001

Charity Investment Annual 2018 9
Getting the measure of the dataAs suggested earlier, outcomes depend on the market and asset class chosen, which generally involves an active decision. For many investors, another decision that naturally flows from this choice is which benchmark to use. In some asset classes, like the S&P500 for large cap US equities, there is broad agreement. Elsewhere, however, there is plenty of room for choice, which can have a big effect on the outcome. For example, two widely-used indices for small cap investing in the US are the S&P SmallCap 600 and the Russell 2000, but the difference in returns between them has been 2.8% per annum over the last ten years. The size of this gap means this is an important active decision for the supposedly passive investor. The choice is not made easier by the fact that, according to Bloomberg News8, there are now more benchmark indices in the US than listed securities.
But outcomes also depend on how they are measured. Much of the data used to compare active and passive outcomes is sourced from SPIVA, part of S&P Dow Jones Indices. A recent SPIVA report9 stated that over 88% of large cap equity funds in
8. 12 May 2017 and The hidden risks of going passive, Schroders, June 2014.
9. SPIVA US Scorecard Year-end 2016, April 2017. All large cap equity funds measured against S&P500 Index.
the US underperformed the S&P500 Index in the latest five-year period. This conclusion on the US is reinforced from other sources, but there are weaknesses in the SPIVA methodology (see box: Scoring the referee), which call into question the assumption that poor outcomes for active investors are inevitable.
There is also a tendency to extrapolate from the US market to the conclusion that other equity markets are hard to beat. In truth the US is different – apart from anything else, domestic institutional ownership is much higher than elsewhere.
The table in Figure 5 shows five-year performance for a range of asset classes outside the US, using both SPIVA data and alternative measures of active performance.
It covers the number of active funds in our sample at the start of the period (March 2012), those still in existence five years later, those that that were liquidated (including the number that underperformed prior to closure), those launched during this period, plus the number of those that underperformed. This analysis provides evidence that the SPIVA data overstates the number of active funds that underperform net of fees. In six sectors out of seven the adjustments we have made lead to the conclusion that fewer active funds underperform.
Figure 5: Pointing a brighter spotlight at the data helps level the differences
Fund population UK equities EM equitiesEurozone equities
Japan equities
Global aggregate US HY
EMD US dollars
Funds at 31 March 2012
312 147 137 157 39 161 87
Of which survivors 237 (76%) 118 (80%) 105 (77%) 98 (62%) 32 (82%) 129 (80%) 70 (80%)
Underperformed 71 (30%) 46 (39%) 77 (73%) 62 (63%) 20 (63%) 108 (84%) 59 (84%)
Of which were liquidated
75 (24%) 29 (20%) 32 (23%) 59 (38%) 7 (18%) 32 (20%) 17 (20%)
Underperformed 43 (57%) 25 (86%) 18 (56%) 37 (63%) 3 (43%) 30 (94%) 15 (88%)
New funds 25 107 21 39 6 40 31
Underperformed 5 (20%) 73 (68%) 11 (52%) 22 (56%) 3 (50%) 33 (83%) 20 (65%)% of funds underperforming indices
Published SPIVA numbers
50% 75% 88% 69% 37% 86% 86%
SPIVA methodology adjusted for stated fund benchmarks
47% 51% 80% 77% 69% 87% 87%
Adjusted for actual performance of closed funds
37% 48% 69% 63% 59% 86% 85%
Further adjusted for new funds
35% 57% 67% 62% 58% 85% 80%
Past performance is not a guide to future performance and may not be repeated. Data covers five years to 31 March, 2017. SPIVA methodology is used but funds are measured against their published benchmark whereas SPIVA mainly use S&P indices. Source for fund population: Morningstar. Returns are excess returns net of fees adjusted for survivorship bias. In case of multiple share classes, either IA primary retail share class (UK equities) or oldest retail share class (other sectors) is used.

Charity Investment Annual 201810
Active wins in fixed incomeBond indices have weaker theoretical foundations than equity indices. There is little logic in investing in an index that gives higher weight to the borrowers who have issued more debt, such as the Italian government in developed markets or the Venezuelan government in an emerging markets context. On top of this, the level of turnover (and therefore costs) in bond indices is much higher because new securities – which make up 20% of bond market capitalisation in any given year – have to be included in the index.
A clear illustration of these points comes from high yield and emerging markets debt sectors. In high yield, the largest ETF, the SPDR Bloomberg Barclays High Yield Bond ETF (“JNK”) has tracked its benchmark index (the Bloomberg Barclays High Yield Very Liquid Index) poorly (Figure 6, blue bars). There is a similar picture in emerging markets debt, where the largest ETF tracking the US dollar index (“EMB” or iShares JP Morgan USD Emerging Markets Bond ETF) has underperformed by 0.8% annualized in five years (Figure 6, purple bars)10.
Even in investment grade corporate bonds, the annual shortfall in ETF returns against the index is 0.4%. This bears out the point that bond markets do not lend themselves to index investing and an active manager does not need to beat the index to do a better job than passive.
It is true that, as Figure 5 shows, the average active manager in high yield and emerging markets debt has not done well against indices either. However, given that it is passive funds and not indices that are investible, the scale of ETFs’ shortfall in fixed income is a better measure of the real benchmark.
The social purpose of active managementFinally, it is worth considering the role active investors play in the broader economy and society. Without active managers, prices in capital markets would be set purely on the relative capitalisation of companies, meaning there would be no mechanism to enhance efficiency or maximise returns for the benefit of the economy as a whole. There is already evidence that recent large flows into passive funds are leading to distortions in markets11.
Moreover, we would contend that the stewardship activities of active investors raise returns in the capital markets by encouraging higher standards of corporate governance and directing capital into faster growing industries. This is a role governments in both Europe and Asia are encouraging: in Japan, in particular, policymakers are keen to see stewardship lead to better capital allocation, and everywhere managers are expected to exercise their voting rights responsibly. Many investors are implementing environmental, social and governance (ESG) principles. To do so passively relies on good quality ESG ratings, yet there is little evidence of their ability to provide early warning of problems. We would contend that a competent active manager is better placed to anticipate and avoid ESG issues.
10. See also The Mirage of Emerging Markets Debt ETFs, Schroders, April 2017.
11. See The Paradox of passive. Beware of feedback loops, Schroders, August 2017.
Figure 6: Two large bond ETFs have consistently underperformed their indices (%)
Chart shows annualised returns in US dollars to 30 April 2017, net of fees, for the SPDR Bloomberg Barclays High Yield Bond ETF (JNK), whose benchmark is the Bloomberg Barclays High Yield Very Liquid Index, and the iShares J.P. Morgan USD Emerging Markets Bond ETF (EMB), whose benchmark is the JPM EMBI Global Core Index. Source: Bloomberg, iShares, JP Morgan and SSgA. Past performance is not a guide to future performance and may not be repeated.
0
2
4
6
8
10
Since 28/11/075yr3yr
Bloomberg Barclays HighYield Very Liquid Index
JPM EMBI Global Core Index
JNK EMB
Scoring the referee SPIVA is widely used as a scorecard of active and passive performance, largely because it deals with survivorship bias. It does so, however, by assuming that any fund which has closed or been merged into another fund has underperformed its benchmark. This assumption is not universally valid. We tested UK equity funds that had closed in the past ten years and found that 20% had outperformed before closure. In addition, SPIVA assigns a benchmark to each fund from the S&P Index series irrespective of the actual benchmark used. By contrast, we use stated benchmarks in calculating excess returns. Finally SPIVA does not measure the performance of funds launched since the start of the measurement period. Making these adjustments means that the percentage of funds that underperformed is almost invariably less than the figure published by SPIVA.

Charity Investment Annual 2018 11
ConclusionMuch of the data used to make the case for passive management overstates the argument: closer analysis suggests many investors in active equity strategies have beaten passive funds after fees. It is true that the characteristics of the US equity market make this the hardest market to beat, but we believe it is incorrect to extrapolate from the US to other equity markets, where there is no evidence that active performance is on a secular downtrend. In bond markets capitalisation-weighted indices are both illogical ways to invest, and hard to track. And for investors who need to achieve a particular outcome, passive may be an impractical solution as they will need to allocate to the right assets and therefore need the skill of an active manager. Factor-based strategies provide useful additional tools, and could be an attractive complement to capitalisation-weighted
passive approaches. Active managers also play an important and increasingly recognised role in the wider economy as stewards of the businesses they own and rational allocators of capital. The best approach for investors and asset owners should be to use active, factor investing and passive management alongside each other, choosing active in markets where it is likely to add value or where they have the resources to identify active skill. However, investors need to recognise that active performance is cyclical: selling out of a strategy with a strong philosophy and process after a short period of underperformance risks locking in that underperformance. But the potential value added from active management remains a critical tool in maximising return from a broad portfolio, and we believe that active management will in time start to regain share from passive.

Charity Investment Annual 201812
Value for MoneyThe fees charged to charities by their investment managers continue to be in the spotlight. However, there is no common approach or methodology for reporting or analysing costs. Fees are often bundled or estimated, leading to a difference between those stated and those actually paid. In an era of low interest rates and low global growth, precious basis points of positive returns can be eroded through fees. The introduction of European financial regulation, MiFID II, requires companies providing investment management services to be more transparent than ever about the fees they charge. But even then, Trustees will need to ensure they are getting the best value for money out of their investment managers.
Defining value for moneyGood value for money is the optimal use of resources to achieve the intended outcomes. It is not about achieving the lowest price.
Kate Rogers, Head of Policy, and Giles Neville, Head of Charities at Cazenove Capital, ran a series of working groups over 2017 with a collection of charity representatives from all backgrounds addressing how value for money metrics can be applied to investment management. Amy Browne, Portfolio Manager at Cazenove Charities, summarises their findings in our report and sets out nine practical insights to guide your way through the process of assessing value for money.
1. Appraise outcomes relative to objectivesAs a charity investor, the best place to start is with your objectives: What are we trying to achieve with our assets? If your charity has investments, it should have a written investment policy that sets out what it is aiming to achieve with those investments. Apart from demonstrating good governance, a written policy provides a framework for making good investment decisions and managing resources efficiently.
In applying resources to the objectives (i.e. paying a fee), how can you best assess whether your manager is achieving them? Have in mind a list of outcomes that you would like to see demonstrated.
2. You are paying for much more than just performanceAccording to our feedback, the primary outcome that trustees are looking to achieve is good risk-adjusted performance. Generating a good level of financial return is clearly an important objective. However, identifying good performance is only part of the solution; finding individuals or firms with whom the institution can build a long-term relationship is often equally important.
This is a case in point when it comes to changing managers. Investment committees consider changing their managers for all sorts of reasons and it is unusual that a patch of poor performance is the only factor. Grounds for changing managers vary from consistently poor returns, to persistent breaches in investment guidelines or problems with the overall quality of service. Equally, if the services they offer change –perhaps they no longer offer investment advice, custody or cash management – then this can also be a prompt to seek an alternative option. These point to the multiplicity of roles that you are paying your investment managers to carry out in return for a fee. Put simply, the services provided by your manager go far beyond simply picking good investments.
Amy Browne Portfolio Manager
Amy Browne joined Cazenove in 2016, bringing with her seven years of investment experience having previously worked for GAM and Sarasin & Partners. Amy holds a 1st class BA (Hons) History degree from the University of York and is responsible for a range of charity mandates.

Charity Investment Annual 2018 13
3. Don’t simply focus on measurable outcomesIt is relatively easy to measure return, risk and cost. But that does not mean that these are the only outcomes that charity investors should be seeking. The provision of good advice is often crucial, as is safe custody and effective deal implementation. A trusted relationship, with helpful day-to-day service and timely, clear and accurate financial reporting is also valuable.
4. There is no zero cost optionActive or passive? Self-managed or outsourced? The answer to these questions will have a material impact on the fees you pay. However, it is important to note that there is no zero cost option. Even the cheapest index trackers will charge a fee and there will be a cost to owning them via a platform, including fees for custody and administration. You will, therefore, achieve market returns, but less a margin.
5. It is important to know what the costs areThe opacity of investment management fees can make it hard to know what you have paid to whom. 2018 sees the introduction of MiFID II which aims to improve transparency on costs, requiring companies providing investment management services to report the fees they charge. This should help trustees identify the cost of managing their investments.
6. Know how much you are prepared to pay and what active benefit you are expectingAs there is no zero cost option, trustees will need to debate whether to pay lower fees for passive management or to increase the fee budget in the belief that active management will deliver enhanced returns.
7. Consider the balance between private and public benefitIf managers outperform net of fees does it matter what you pay them?
In our research we came across investors holding the belief that as long as the charity was better off net of fees then the absolute level of fees doesn’t matter. We would challenge this view, and believe that the Charity Commission would also view the balance between private benefit (to the investment manager) and public benefit (to the charity) as important.
8. Diversification comes at a priceSince it’s a like-for-like comparison, it is relatively easy to assess the value for money represented by funds in the various equity markets or other single asset classes. It is much more difficult when we consider multi-asset portfolios. Counter-intuitively passive multi-asset portfolios are often less diversified than active portfolios. Active portfolios may cost more, but additional fees are hopefully paying not only for good positive performance but, because of the enhanced diversification, potentially less severe losses when markets turn negative.
9. Appraise active value added against a passive portfolioWhen looking at the measurable outcomes of return, risk and cost; a useful comparison might be ‘what would an equivalent passive portfolio have delivered’. This takes into account the difference in cost in a passive portfolio alongside any impact on returns and risk. It is more accurate in appraising value for money than market benchmarks as it takes into account the fact that there is not a zero cost alternative.
The full report can be downloaded on our website here http://www.cazenovecapital.com/uk/charities/insights/charity-investment/value-for-money/
Charity Investment Annual 201814
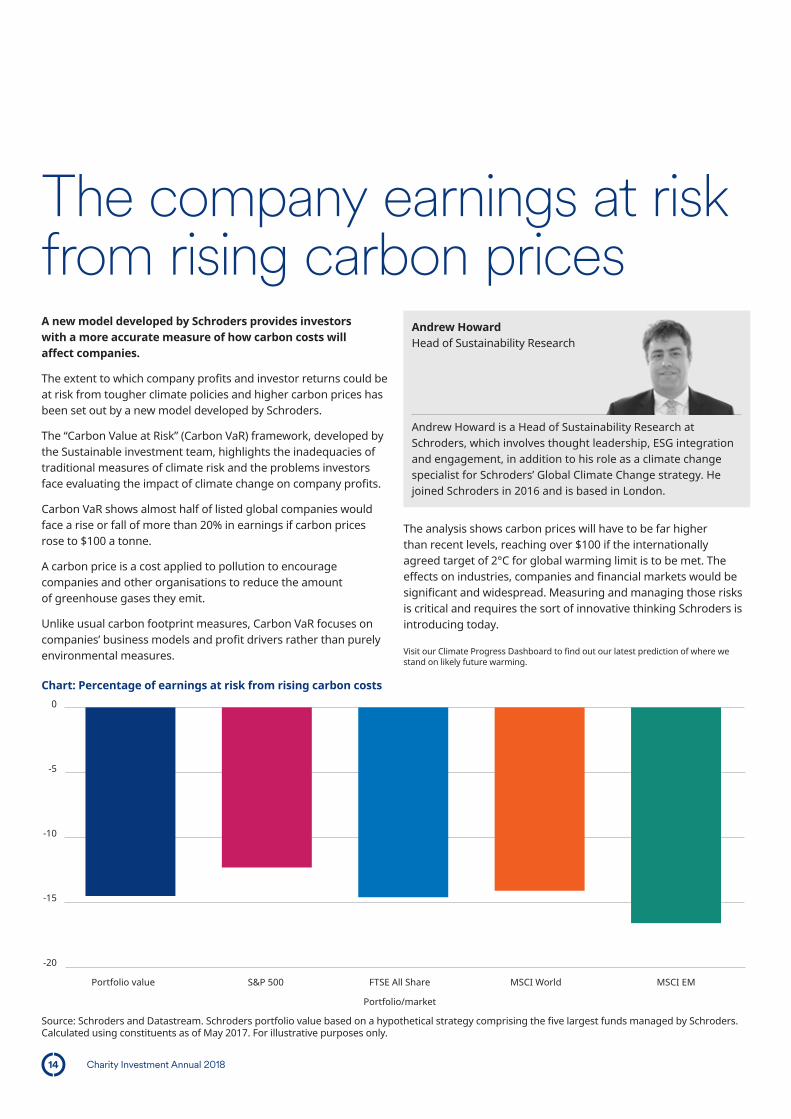
The company earnings at risk from rising carbon pricesA new model developed by Schroders provides investors with a more accurate measure of how carbon costs will affect companies.
The extent to which company profits and investor returns could be at risk from tougher climate policies and higher carbon prices has been set out by a new model developed by Schroders.
The “Carbon Value at Risk” (Carbon VaR) framework, developed by the Sustainable investment team, highlights the inadequacies of traditional measures of climate risk and the problems investors face evaluating the impact of climate change on company profits.
Carbon VaR shows almost half of listed global companies would face a rise or fall of more than 20% in earnings if carbon prices rose to $100 a tonne.
A carbon price is a cost applied to pollution to encourage companies and other organisations to reduce the amount of greenhouse gases they emit.
Unlike usual carbon footprint measures, Carbon VaR focuses on companies’ business models and profit drivers rather than purely environmental measures.
The analysis shows carbon prices will have to be far higher than recent levels, reaching over $100 if the internationally agreed target of 2°C for global warming limit is to be met. The effects on industries, companies and financial markets would be significant and widespread. Measuring and managing those risks is critical and requires the sort of innovative thinking Schroders is introducing today.
Andrew Howard Head of Sustainability Research
Andrew Howard is a Head of Sustainability Research at Schroders, which involves thought leadership, ESG integration and engagement, in addition to his role as a climate change specialist for Schroders’ Global Climate Change strategy. He joined Schroders in 2016 and is based in London.
Chart: Percentage of earnings at risk from rising carbon costs
Source: Schroders and Datastream. Schroders portfolio value based on a hypothetical strategy comprising the five largest funds managed by Schroders. Calculated using constituents as of May 2017. For illustrative purposes only.
-20
-15
-5
-10
0
Portfolio value S&P 500 FTSE All Share
Portfolio/market
MSCI World MSCI EM
Visit our Climate Progress Dashboard to find out our latest prediction of where we stand on likely future warming.

Charity Investment Annual 2018 15
What is Carbon Value at Risk?Carbon VaR measures the impact of rising carbon costs on a company’s profitability more accurately than those provided by carbon footprint analyses.
The effects of rising carbon prices on companies will be both dynamic and complex:
– Companies’ costs will rise in proportion to the total emissions generated by themselves and their suppliers.
– Selling prices are likely to rise to offset cost increases at an industry level.
– Demand should fall reflecting the sensitivity of customers to prices in each market affected, shrinking companies’ sales and costs.
Carbon VaR takes these linkages into account to gauge the impact on industry profits, using an estimating process to capture the three key variables of emissions, price and changing demand.
It’s also important to include all greenhouse gas emissions required to produce and sell a product, which conventional measures of carbon exposure do not.
The analysis also underlines the inadequacies of traditional measures of climate risk.
The problem with carbon footprintsCarbon footprints have become one of the most familiar ways for investors to gauge the impact of their investments on the environment.
A carbon footprint is a measure of the impact our activities have on the environment measured in units of carbon dioxide. So, if you drive a car to get to work or take a plane to go on holiday you leave a carbon footprint.
Businesses are the same. Everyday their operations create carbon emissions. A company’s carbon footprint typically relates the emissions it generates to its revenue or market capitalisation.
Such measures of “carbon intensity”, even if they are consistent, are often poor indicators of the effects of climate change on profitability or value. As a result, they provide little clue to the effect of carbon emissions on company earnings.
The curious case of Apple and SamsungThe example of Apple and Samsung is worth considering.
The two rivals sell fundamentally similar consumer electronics. Yet Samsung’s carbon footprint is significantly higher than Apple’s, because Apple outsources most of its manufacturing whereas Samsung manufactures more products itself.
In climate terms, this is an irrelevance: the emissions created by producing and selling both sets of products are in reality much the same.
To get an accurate picture, an investor clearly needs to get a handle not just on the company’s own emissions, but also those emanating from its suppliers. Carbon footprints, as currently conceived, don’t incorporate that information.
It follows that investors who rely on carbon footprints to guide their portfolios may face risks that they and their managers are not addressing.
Without innovative tools to help navigate a new environment of carbon reduction, investors will find it hard to reach their investment destinations, which is why the Carbon VaR model was created.
Charity Investment Annual 201816
Lessons for the long termThis year we welcomed Professor Elroy Dimson from Judge Business School, Cambridge as our guest speaker at our Annual Charity Investment Lecture.
Write up by Nick Bence-Trower, Portfolio Director, Cazenove Charities.
Following in the footsteps of Danny Truell from the Wellcome Trust, David Swensen of the Yale Endowment, and Professor John Kay, we were delighted to welcome Professor Elroy Dimson to deliver the fourth annual Cazenove Charities Investment Lecture on 24th May at the Royal Institution. The theme of the talk was ‘lessons from the long term’ and he drew upon 117 years of data, gathered from 23 countries for equity, bonds, cash and inflation.
This vast data set shows how much things have changed over the decades. In the 1900s bonds were the main asset class, soon to be overtaken by equity markets, in what Professor Dimson termed the ‘triumph of the optimists’. Those early investors that believed in companies offering a share of their profits were rewarded handsomely, which is what equity holders and most long term charity investors continue to rely on today.
In 1900, the UK was the biggest equity market in the world, representing 25% of global equity market capitalisation compared to the US share of 15%. In 2017 however, as an aggregate, US listed companies are larger than the rest of the world combined, having leapt to 58% of the equity market – whilst the UK has shrunk to just 7%. Whole industries that once were hugely significant, such as railways, are now much smaller component of markets – whilst new industries, such as Information Technology, form the cornerstones of today’s investment markets.
There are clear parallels between today’s ‘stranded assets’ and the disappearing industries of the past. In recent investment memory, this term has been used to describe oil reserves owned by large oil companies that, because of global warming,
may not be able to be burnt and may therefore be valueless. Professor Dimson compared this with the canals in the 19th century – assets that were fundamental to the transportation of goods until railways were invented. Canals still existed and were still used, but their relative importance had been significantly diminished, in other words they were ‘stranded assets’. Similar concept, different century.
It was also interesting to reflect on how the past has shaped our portfolios today. Modern portfolio theory talks of diversification, or not putting all your eggs in the equity basket. This was developed in the 1950s, when equity investors had only just recovered the value that was lost in the 1920s when the equity market fell by 75%. It took two decades to recoup the real value of assets invested in that period.
Professor Dimson shared three lessons from the past to help charity investors with long-term time horizons think about their investment strategies today.
Elroy Dimson Judge Business School, Cambridge
Elroy Dimson chairs the Newton Centre for Endowment Asset Management at Cambridge Judge Business School, and is Emeritus Professor of Finance at London Business School. He is a Non-Executive Director of FTSE International, is on the Steering Committee of the Financial Economists' Roundtable, and is an Advisory Council member for Financial Analysts Journal. He is a Fellow of the Royal Historical Society, Honorary Fellow of CFA UK and of the Institute of Actuaries. His PhD is from London Business School.

Charity Investment Annual 2018 17
1 Expect lower returnsMost people overestimate expected returns after inflation. Professor Dimson believes that we are now in a low-return
world and are unlikely to benefit from a return to higher expected returns in the near term. Furthermore, history shows that contrary to popular belief, it is the companies in low-growth countries that tend to perform better than those in high growth countries. In his opinion, whilst equites are expected to offer inflation plus 3% to 3.5% per annum over the long term, traditional equity/bond portfolios would only generate inflation plus 2% per annum. This could present a challenge for charity investors seeking perpetuity and spending 3% to 4% per annum.
2 A long-term view brings benefitsMany charity investors benefit from an investment time horizon spanning several generations. Although some
elect to ‘spend out’ if this is in the interests of their mission, most foundations benefit from an extended investment perspective and are able to capitalise on equity performance – with history showing equity investors are consistently rewarded over the long term. That said, it was noted that equities do not always act as a good hedge against inflation in the short term.
3 Costs eat returnsIn a lower-return world, cost control is more important. With an increasing number of complex investment
strategies available, investors must be conscious of the costs involved in investing in them. Although complex strategies may work, they can be expensive – and higher returns can be materially reduced by costs.
These three lessons from the past should help charity investors with long term time horizons think about their investment strategies today. Professor Dimson’s expectations for a more challenging return environment perhaps emphasises the need for active management to generate excess returns – whilst keeping a watchful eye on costs. It also highlights the importance of focusing on the long term, and avoiding being distracted by short term oscillations and noise.
The lecture was warmly received by representatives from well over one hundred charities and after an insightful Q&A session, attendees retired for drinks and canapés in the impressive surroundings of the library.

Charity Investment Annual 201818
In the sector press
Sector thoughts
In these short columns for Third Sector magazine, Kate Rogers, covers spending rates, inequality and 7 lessons for investors.
Mandatory spending ratesFor as long as I have been managing investments for charities, there has been a debate about the ‘right’ amount of investment assets for a charity or foundation. How much should be saved for future beneficiaries and how much should be spent on charitable purposes today.
The debate continues. In the recent months, I’ve read and heard opposing views on whether the UK should introduce mandatory spending rates for charities with assets. In the US, Foundations are required to spend a minimum of 5% of their assets per year, in Canada this number is 3.5%.
Supporters of mandatory payout ratios suggest that once assets are ‘charitable’ there is no reason to accumulate them. In extremis, some encourage Foundations to spend out in their entirety, pointing to the c£100bn of UK foundation assets as capital that they believe could be put to better social use now.
Although I agree it is important that trustees remember that their key duty is to the mission, and that the assets serve that purpose, I don’t support the notion that a mandatory payment is necessarily the best way to improve long term social value.
Some foundations and endowments are ‘permanently endowed’, meaning the trustees have a legal duty to balance the needs of current and future beneficiaries, that the capital cannot be spent; but must be preserved through the generations. But these are the exceptions rather than the rule, as most foundations and endowments are in fact expendable. Despite this, many trustees seek to set their spending at a level that is sustainable into perpetuity, believing that this approach best supports their mission over the long term.
And it is right that spending decisions are made with the mission in mind. I can see that there would be a powerful argument for an environmental charity spending more to combat climate change now, rather than saving for the future. Whereas Foundations
tackling ongoing issues, could justify spending some now and investing the rest in order to support future expenditure.
But what is this sustainable spending amount? In 2013 Richard Jenkins and I co-authored a research paper1, published by the Association of Charitable Foundations, looking at how trustees could reach a decision on the most appropriate spending rate to support their charitable aims. We found that many trustees of Foundations were seeking perpetuity, basing spending rates on long term investment expectations. Analysis suggests expenditure of around 4% as a sustainable level for a multi-asset investment approach, although perpetuity is only ever a probability. This means that a Foundation with capital of £10m could spend it all today; or spend the same amount over a 25 year period whilst also retaining the original investment for the future.
I don’t think there is a right answer to how much a Foundation should spend or save, as it will depend on individual circumstances; the mission, the environment and the opportunities for creating impactful social change. In my experience Foundations are already thinking carefully about their spending, about using their assets in ways to maximising their impact, and I can’t see that a mandatory spending rate would enhance this.
1. www.cazenovecharities.com/spendingdecisions
Kate Rogers Head of Policy, Charities
Kate Rogers is Head of Policy at Cazenove Charities, responsible for sector engagement as well as co-managing a common investment fund, the Charity Multi-Asset Fund. She has eighteen years experience, specialising in charity investment. Kate is chair of the Charity Investors Group (CIG), and a governor of the Cripplegate Foundation. She regularly writes for the sector press and has co-authored two reports on endowment and foundation investment governance published by the Association of Charitable Foundations.

Charity Investment Annual 2018 19
Inequality and the failings of economic theoryI had the pleasure of listening to Darren Walker the president of the Ford Foundation at an event at the LSE in the Autumn. The Foundation, with an endowment of $12bn, spends over $0.5bn a year fighting inequality in the belief that this is the defining challenge of our time.
They identify five underlying drivers of inequality;
1. persistent prejudice and discrimination based on gender, race or disability;
2. entrenched cultural narratives that undermine fairness, tolerance, and inclusion;
3. failure to invest in and protect vital public goods such as education and natural resources;
4. unequal access to government decision making and resources and
5. unfair rules of the economy that magnify unequal opportunity and outcomes.
It is the last of these that as investors we may be able to influence. The Ford Foundation certainly believe they can. Their ‘inclusive economies’ programme seeks to encourage business, government and civil society to work together to reduce inequality and promote growth and prosperity for everyone.
There is plenty of evidence to support the fact that economic inequality is unhelpful for economic prosperity over the long term. In the UK, the Equality Trust highlight research showing that high levels of income inequality are associated with economic instability – with more equal societies able to support longer periods of sustainable growth.
Darren Walker would label us, the asset owners and charity investors, as the ‘privileged’. Our generosity is not enough; we must seek justice, interrogating our own behaviours to see how we can bring about change. In his view, capitalism served the privileged well but failed many. For a sustainable future we need our economies to work for more people.
This is a theme picked up by Kate Raworth in her recent book ‘Doughnut Economics’ (and TED talk of the same name). Described as a ‘renegade economist’ she explains how current economic theory has failed us. That the focus on economic growth has led to the destruction of the environment, and favoured the few, amplifying inequality without improving wellbeing.
Instead, she argues that we should be trying to meet the needs of all, within the means of the planet; without valuing growth above all else. The ‘doughnut’ represents the delicate balance between achieving too little for society (the hole in the middle) and achieving too much so that ecological resources are threatened (beyond the outer ring of the doughnut). Economies that achieve this balance, would be less likely to be as unequal.
So what can you do, to seek justice, to encourage an inclusive economy? As charity investors you are part-owners of companies and your share holdings give you influence. You can use this position to change the narrative, to encourage businesses to place less value on short term profit metrics and to focus instead on long term sustainability. It might mean that short term financial returns are less attractive as businesses invest for the future but it should enhance the longer term rewards, for you and for the rest of society.
Charity Investment Annual 201820
Investment Book ClubBook reviews aren’t usually my thing. Mostly because two young kids and a wandering mind makes it increasingly difficult for me to read anything substantial from cover to cover these days. This helps explain why a nice short essay, recently published in the Financial Analysts Journal, is my chosen specialist subject for the month.
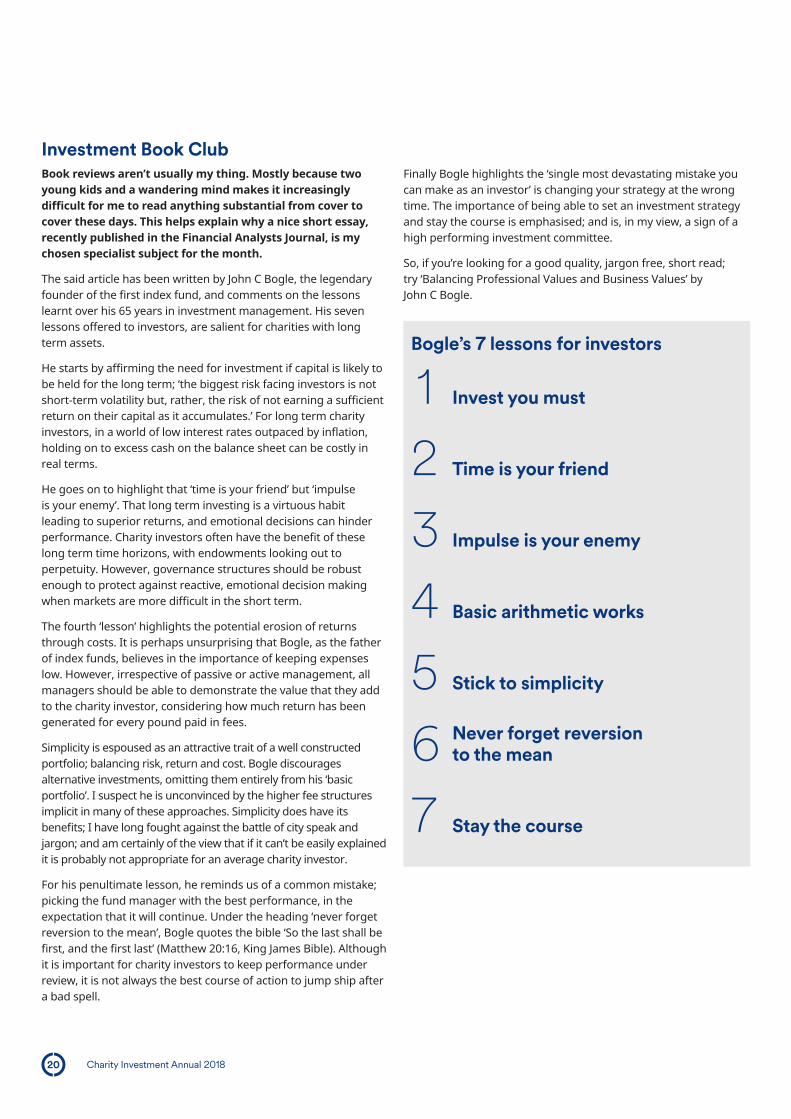
The said article has been written by John C Bogle, the legendary founder of the first index fund, and comments on the lessons learnt over his 65 years in investment management. His seven lessons offered to investors, are salient for charities with long term assets.
He starts by affirming the need for investment if capital is likely to be held for the long term; ‘the biggest risk facing investors is not short-term volatility but, rather, the risk of not earning a sufficient return on their capital as it accumulates.’ For long term charity investors, in a world of low interest rates outpaced by inflation, holding on to excess cash on the balance sheet can be costly in real terms.
He goes on to highlight that ‘time is your friend’ but ‘impulse is your enemy’. That long term investing is a virtuous habit leading to superior returns, and emotional decisions can hinder performance. Charity investors often have the benefit of these long term time horizons, with endowments looking out to perpetuity. However, governance structures should be robust enough to protect against reactive, emotional decision making when markets are more difficult in the short term.
The fourth ‘lesson’ highlights the potential erosion of returns through costs. It is perhaps unsurprising that Bogle, as the father of index funds, believes in the importance of keeping expenses low. However, irrespective of passive or active management, all managers should be able to demonstrate the value that they add to the charity investor, considering how much return has been generated for every pound paid in fees.
Simplicity is espoused as an attractive trait of a well constructed portfolio; balancing risk, return and cost. Bogle discourages alternative investments, omitting them entirely from his ‘basic portfolio’. I suspect he is unconvinced by the higher fee structures implicit in many of these approaches. Simplicity does have its benefits; I have long fought against the battle of city speak and jargon; and am certainly of the view that if it can’t be easily explained it is probably not appropriate for an average charity investor.
For his penultimate lesson, he reminds us of a common mistake; picking the fund manager with the best performance, in the expectation that it will continue. Under the heading ‘never forget reversion to the mean’, Bogle quotes the bible ‘So the last shall be first, and the first last’ (Matthew 20:16, King James Bible). Although it is important for charity investors to keep performance under review, it is not always the best course of action to jump ship after a bad spell.
Finally Bogle highlights the ‘single most devastating mistake you can make as an investor’ is changing your strategy at the wrong time. The importance of being able to set an investment strategy and stay the course is emphasised; and is, in my view, a sign of a high performing investment committee.
So, if you’re looking for a good quality, jargon free, short read; try ‘Balancing Professional Values and Business Values’ by John C Bogle.
Bogle’s 7 lessons for investors
1 Invest you must
2 Time is your friend
3 Impulse is your enemy
4 Basic arithmetic works
5 Stick to simplicity
6 Never forget reversion to the mean
7 Stay the course

Charity Investment Annual 2018 21
Association of Charitable Foundations Giving Trends 2017 ResearchWe were delighted to host the launch of the Foundation Giving Trends 2017 research with the Association of Charitable Foundations. Using data from the Top 300 Foundation Grant-Makers the research gives a useful picture of the giving, income and assets of the top UK independent charitable foundations.
Key findings included: – The combined net assets of the Top 300 Foundations
reached a record high of almost £60 billion, growing by 10% compared to 2016 data.
– Investment income grew by 5.5%, more than double the rate of annual voluntary income from new gifts. Investment income represents 41% of the income of the Top 300 Foundations.
– Listed investments remain the largest component of Foundation investments, unlisted investments have increased their share of the value of the portfolio. This reflects holdings in privately-owned companies and investment in private equity.
– At least 10% of the Top 300 Foundations make programme related and social investments.
– Grant-making by the Top 300 foundations reached a record high of £2.9 billion; growing by 12% over the last 12 months. This represents 15% of all UK private giving (£19.1 billion)
– 63% of Foundations increased grant-making more than inflation.
– Foundations annual spending power is equivalent to 0.4% UK government spending, but they often punch far above their weight; using their independence, long-term focus and creativity to find solutions to immediate need and long-term problems.
– Foundations are increasingly collaborating with each other and with public and private sector partners to drive innovative social change (as in the report).
For more information and to download a copy of the report please visit the Association of Charitable Foundations website herehttp://www.acf.org.uk/policy-practice/research-publications/foundation-giving-trends-2017

Charity Investment Annual 201822
Income 45.5bn
Individuals20.6
Donations 7.6Legacies 2.5
Fees for services 6.2Fundraising 4.3
Voluntary sector 3.4Other institutions 0.1
Individuals 0.3Government bodies and universities 2.6
Cost of generating voluntary income 1.5Cost of generating earned income 3.9
Cost of managing investments 0.5
Grants 2.9Contracts and fees 12.4
Grants 3.0Earned 1.0
Donations 1.0Earned 0.9
GovernmentSources15.3
Voluntary sector4.0
Investments3.3Investments3.3
Spending 43.3bn
Charitableactivities
30.2
Grants6.4
Cost ofgenerating funds
5.9
Governance0.9
Retained income andcapital expenditure
2.2
Private sector1.9
National Lottery0.5
The UK Civil Society Almanac 2017We were pleased to sponsor the NCVO Almanac which gives a unique picture of the UK voluntary sector's financial health. data.ncvo.org.ukIncome and spending of the UK voluntary sector, 2014/2015 (£bn)
Source NCVO/TSRC, Charity Commission

Charity Investment Annual 2018 23
Income 45.5bn
Individuals20.6
Donations 7.6Legacies 2.5
Fees for services 6.2Fundraising 4.3
Voluntary sector 3.4Other institutions 0.1
Individuals 0.3Government bodies and universities 2.6
Cost of generating voluntary income 1.5Cost of generating earned income 3.9
Cost of managing investments 0.5
Grants 2.9Contracts and fees 12.4
Grants 3.0Earned 1.0
Donations 1.0Earned 0.9
GovernmentSources15.3
Voluntary sector4.0
Investments3.3Investments3.3
Spending 43.3bn
Charitableactivities
30.2
Grants6.4
Cost ofgenerating funds
5.9
Governance0.9
Retained income andcapital expenditure
2.2
Private sector1.9
National Lottery0.5

Charity Investment Annual 201824
Charity Governance CodeThe updated charity governance code was published in 2017. There are seven principles which make up this Code. These principles build on the assumption that a charity is meeting its core legal and regulatory responsibilities as a foundation.
1 Organisational purpose The board is clear about the charity’s aims and ensures that these are being delivered effectively and sustainably.
2 Leadership Every charity is led by an effective board that provides strategic leadership in line with the charity’s aims and values.
3 Integrity The board acts with integrity, adopting values and creating a culture which help achieve the organisation’s charitable purposes. The board is aware of the importance of the public’s confidence and trust in charities, and trustees undertake their duties accordingly.
4 Decision-making, risk and control. The board makes sure that its decision-making processes are informed, rigorous and timely and that effective delegation, control and risk assessment and management systems are set up and monitored.
5 Board effectiveness The board works as an effective team, using the appropriate balance of skills, experience, backgrounds and knowledge to make informed decisions.
6 Diversity The board’s approach to diversity supports its effectiveness, leadership and decision-making.
7 Openness and accountability The board leads the organisation in being transparent and accountable. The charity is open in its work, unless there is good reason for it not to be.
Governance thoughts

Charity Investment Annual 2018 25
Making investment committees workCazenove Charities is pleased to support the Association of Chairs’ new briefing: Making board committees work, which offers suggestions for board Chairs on getting the best from committees.
Kate Rogers, Head of Policy, has summarised her top tips for how your board Chair can contribute to the success of your investment committee:
Purpose
1 Create a compelling statement of how the investment committee contributes to the mission of the charity. What is the purpose of the investment portfolio? Are the investment objectives clearly defined and do they reflect the investment portfolio’s purpose? All board and committee members should have approved the investment policy.
2 A formal terms of reference makes clear where authority lies. But it is also about creating focus which will help you to engage the Committee, and be useful for the board. An unfocused committee wastes the time of it members and the charity’s resources.
People
3 Take time to get the right people on the committee and to create expectations about their attendance and contribution. Many successful investment committees insist that meeting papers are read and digested ahead of the meeting so that precious time is focussed on discussion rather than relaying information.
4 Of course you want investment expertise, but what kind of experience will be helpful and compliment other committee members’ experience? Beware of expertise that is too narrow, out of date, or too vehemently voiced. Value the voice of the non-expert and give them sufficient induction to be confident about speaking up.
5 Encourage the committee to recognise when it needs external advice and to consider how it will assure itself of the quality of that advice. Clearly define the committee’s expectations of the advisors and in particular what should be covered in meetings with them to add the most value to the relationship.
Performance of the committee
6 Use an annual meeting between board Chair and committee Chair to review the Committee’s achievements in the last year and to agree key objectives for the committee for the year ahead. If necessary update the terms of reference.
7 Agree on when and how the work of the Committee will feature on the main Board agenda.
8 Create a culture and practice of regular review of effectiveness. Each year, review whether membership needs refreshing. Explore whether the committee Chair still has the time and commitment to serve, if not, agree a plan to find a successor.

Charity Investment Annual 201826

Charity Investment Annual 2018 27
Investment committee Example terms of referenceThis document was prepared by Kate Rogers, Head of Policy, Cazenove Charities, with reference to the recommendations of the Association of Chairs briefing Making board committees work and its companion Making investment committees work and through research into current practice.
This is for information purposes and is intended to be a helpful prompt for investment committees rather than a template or advice.
1 Purpose and objectives
The investment committee’s role is one of strategic direction and oversight of the organisation’s investment assets.
The investment portfolio represents an important asset for the charity, with investment income representing a significant part of annual total income. The committee fulfils an essential role in the long term stewardship of these assets in order to further the aims of the charity.
The committee is established to determine, implement and review an investment strategy to deliver the organisation’s agreed investment objectives as follows:
– to at least maintain the real value of the investment portfolio over the long term
– to generate a consistent and sustainable return to fund annual expenditure
– to deliver the investment objectives within an acceptable level of risk
The committee is responsible for establishing a detailed investment policy, within the powers conferred under the charity’s governing documents and relevant legislation and guidance. This will be established in the context of the charity’s overall strategy to fulfil the charitable aims.
The investment policy will set out the investment objectives, risk tolerance, liquidity requirements, time horizon, responsible investment policy and operational arrangements for implementation, monitoring and reporting.
2 Roles and responsibility
2.1 Develop and maintain committee governance documents – Draft, review, revise and recommend to the Trustees for
their approval the following governance documents
a. The charity’s written investment policy including its treasury and responsible investment policy.
b. the committee terms of reference.
2.2 Assess investment strategy and risk – review and agree the long term investment strategy to meet the
investment objectives set out in the written investment policy.
2.3 Select investment advisor(s) – recommend to the Trustees the appointment or
termination of investment consultants where appropriate.
– recommend to the Trustees appointment or termination of investment manager(s).
– agree the terms of the appointment of investment consultants or managers; including level of portfolio management discretion, custody and dealing arrangements, and fees.
– set and review with the investment manager(s) appropriate investment mandates ensuring consistency with the written investment policy and long term investment strategy.
2.4 Monitor and evaluate investment performance, service and cost
– monitor the long term performance of the investment portfolio against the investment objective, ensuring compliance with the written investment policy.
– establish appropriate performance benchmarks for the investment managers and monitor and evaluate performance over relevant time horizons.
– periodically review the fees paid and appraise value for money.
– monitor the liquidity to ensure that the spending commitments can be met.
2.5 AuthorityThe Trustees’ express approval shall be required for the following
– changes to the written investment policy, including the overall financial objective and responsible investment policy.
– Appointments to the committee.
– Termination or appointment of investment consultants or managers.
– Changes to these terms of reference.

Charity Investment Annual 201828
3 Membership
– The committee shall consist of no fewer than three Trustees, to include the Chair of Trustees, and two external members with relevant expertise. Committee members are appointed, and may be removed, by the Trustees at their discretion.
– Members are selected using a skills assessment to ensure specialist knowledge is used, alongside more generalist lay members. External members will be offered an induction and all committee members will be offered ongoing training and support to ensure skills and relevant knowledge are up to date.
– The committee shall comprise of no more than seven members.
– Member terms of office will be for three years, renewable twice.
– The quorum shall be two Trustee members and one external member.
– The Chair shall be elected from within the committee’s members on an annual basis.
– The Finance Director and the Chief Executive will attend the meeting.
– The Finance Director (or his/her designate) will act as Secretary to the committee.
4 Meetings
– The investment committee shall normally meet twice a year.
– Meetings may be convened at the request of any member of the Committee or by the Chief Executive or Finance Director.
– Notice of meetings shall be given to all committee members, and papers circulated in advance.
– Meetings may be held in person or by telephone.
6 Evaluating performance
– The committee will evaluate its own performance, collectively and individually, on a regular basis.
– Key objectives for the committee will be agreed and if necessary the terms of reference will be updated, with approval from the Trustees.
5 Minutes and reporting
– The investment committee will table minutes of its proceedings and recommendations to the board of trustees on a routine basis and will make an annual report to the board of trustees.
– The investment committee relies on the reports provided by management and the investment consultant and managers in order to carry out its responsibilities and duties.

Charity Investment Annual 2018 29

Important informationPast performance is not a guide to future performance. The value of an investment and the income from it may go down as well as up and investors may not get back the amount originally invested.
This document is issued by Cazenove Capital which is a trading name of Schroder & Co. Limited, 12 Moorgate, London, EC2R 6DA, authorised by the Prudential Regulation Authority and regulated by the Financial Conduct Authority and the Prudential Regulation Authority. This document is intended to be for information purposes only. The views and opinions contained herein are those of the author, and do not necessarily represent the house view. The material is not intended to provide, and should not be relied on for investment advice or recommendations. Opinions stated are matters of judgment, which may change. Information herein is believed to be reliable, but Cazenove Capital does not warrant its completeness or accuracy. This does not exclude or restrict any duty or liability that Cazenove Capital has to its customers under the Financial Services and Markets Act 2000 (as amended from time to time) or any other regulatory system. For your security, communications may be recorded and monitored. SCH30195.
cazenovecharities.com
Giles Neville Head of Charities
Tel: 020 7658 6975 [email protected]
Alex Baily Portfolio Director, Charities
Tel: 020 7658 1108 [email protected]
Nicholas Orr Portfolio Director, Charities
Tel: 020 7658 3285 [email protected]
Kate Rogers Head of Policy, Charities
Tel: 020 7658 2480 [email protected]
Lucinda Napier Portfolio Director, Charities
Tel: 020 7658 1106 [email protected]
Tom Montagu-Pollock Portfolio Director, Charities
Tel: 020 7658 3726 [email protected]
Contact us