j.p. morgan cazenove pan european small mid-cap ceo
TRANSCRIPT
J.P. Morgan Cazenove Pan European Small Mid-Cap CEO Conference Virtual | 18 March 2021
J.P. Morgan Cazenove Pan European Small Mid-Cap CEO ConferenceInvestor presentationMarch 18th, 2021
2
Agenda
Group Highlights
White Cement Global Leadership
2020 Results and 2021 guidance
Industrial Plan 2021-2023 update
Appendix
3
8
14
25
34
3
Group Highlights
Trakya plant, Turkey
4
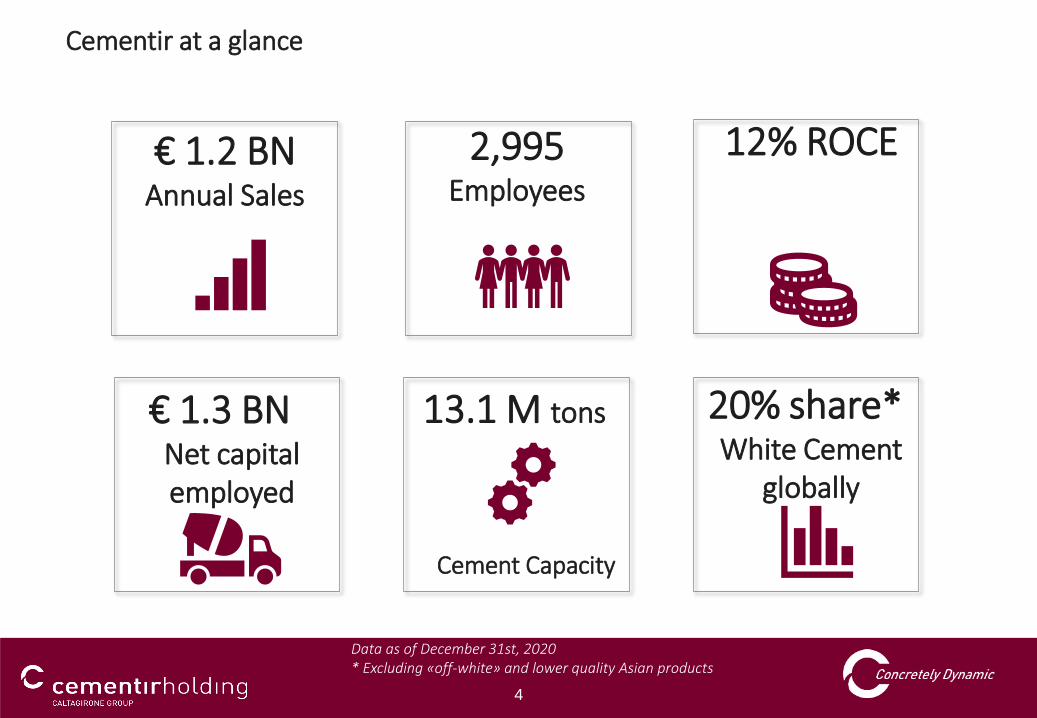
Cementir at a glance
€ 1.3 BNNet capital employed
13.1 M tons
Cement Capacity
€ 1.2 BNAnnual Sales
2,995Employees
20% share*White Cement
globally
12% ROCE
Data as of December 31st, 2020* Excluding «off-white» and lower quality Asian products
5
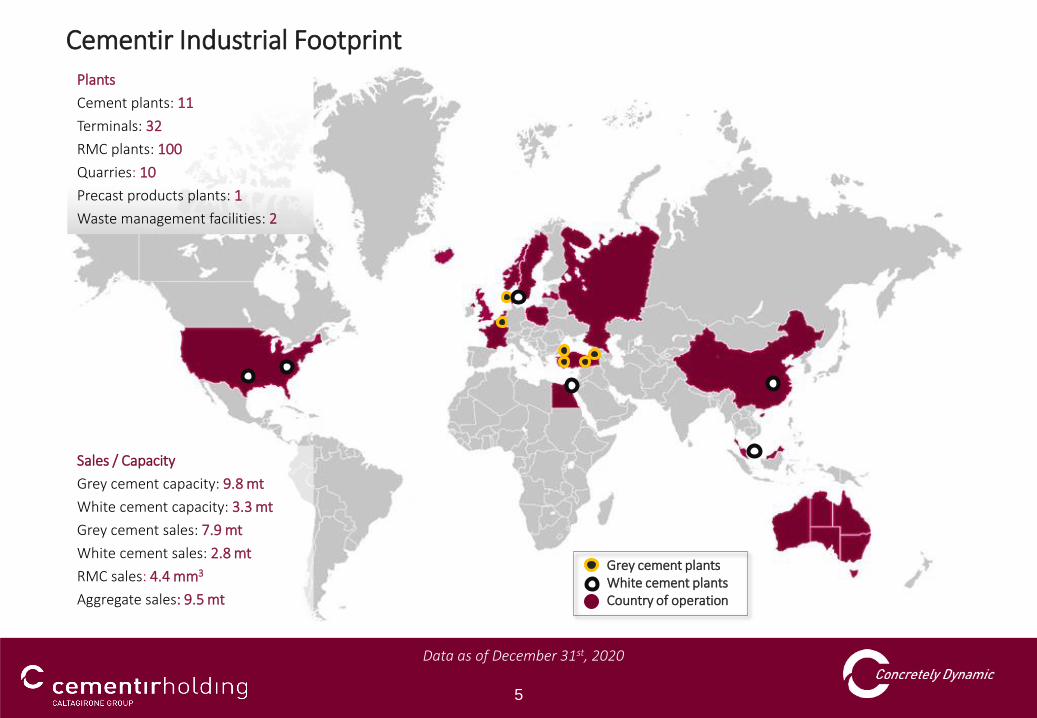
Cementir Industrial FootprintPlants
Cement plants: 11
Terminals: 32
RMC plants: 100
Quarries: 10
Precast products plants: 1
Waste management facilities: 2
Sales / Capacity
Grey cement capacity: 9.8 mt
White cement capacity: 3.3 mt
Grey cement sales: 7.9 mt
White cement sales: 2.8 mt
RMC sales: 4.4 mm3
Aggregate sales: 9.5 mt
Grey cement plantsWhite cement plantsCountry of operation
Data as of December 31st, 2020
6
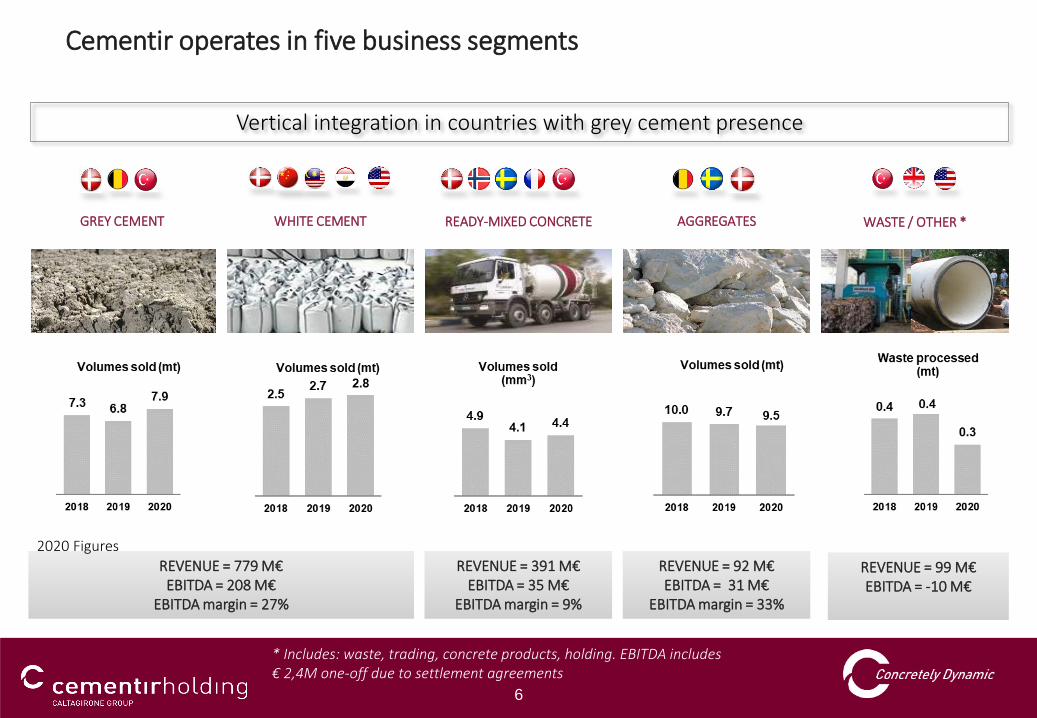
Cementir operates in five business segments
Vertical integration in countries with grey cement presence
GREY CEMENT WHITE CEMENT READY-MIXED CONCRETE AGGREGATES WASTE / OTHER *
REVENUE = 779 M€EBITDA = 208 M€
EBITDA margin = 27%
REVENUE = 391 M€EBITDA = 35 M€
EBITDA margin = 9%
REVENUE = 92 M€EBITDA = 31 M€
EBITDA margin = 33%
REVENUE = 99 M€ EBITDA = -10 M€
2020 Figures
* Includes: waste, trading, concrete products, holding. EBITDA includes € 2,4M one-off due to settlement agreements
7
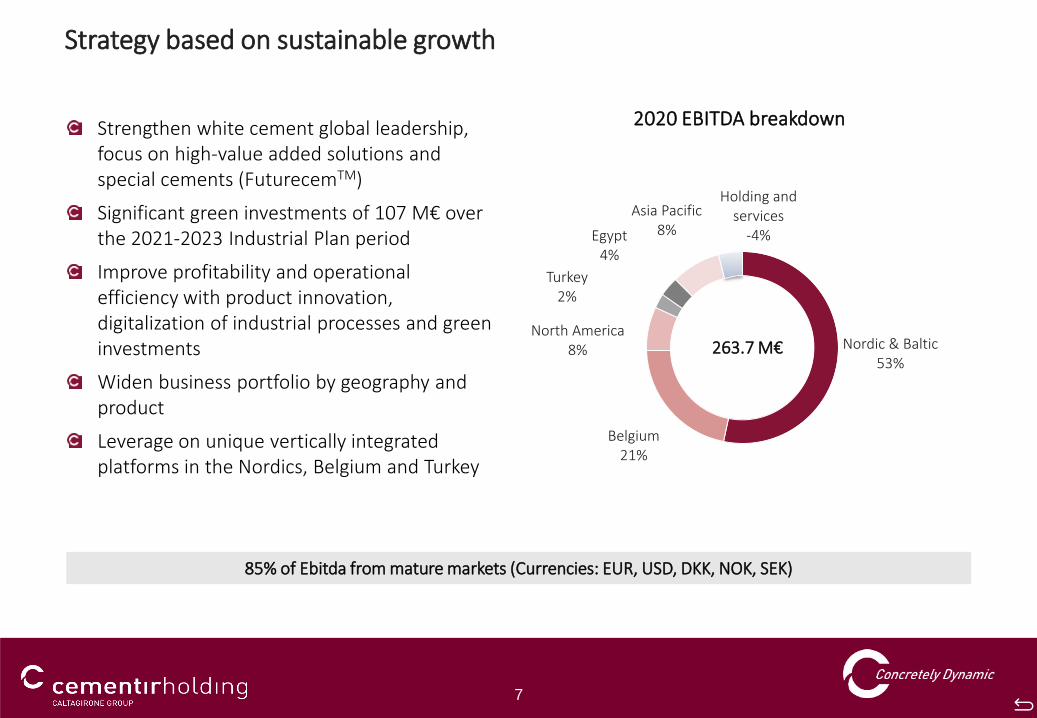
Strengthen white cement global leadership, focus on high-value added solutions and special cements (FuturecemTM)
Significant green investments of 107 M€ over the 2021-2023 Industrial Plan period
Improve profitability and operational efficiency with product innovation, digitalization of industrial processes and green investments
Widen business portfolio by geography and product
Leverage on unique vertically integrated platforms in the Nordics, Belgium and Turkey
Strategy based on sustainable growth
Nordic & Baltic53%
Belgium21%
North America8%
Turkey2%
Egypt4%
Asia Pacific8%
Holding and services
-4%
2020 EBITDA breakdown
85% of Ebitda from mature markets (Currencies: EUR, USD, DKK, NOK, SEK)
263.7 M€
8
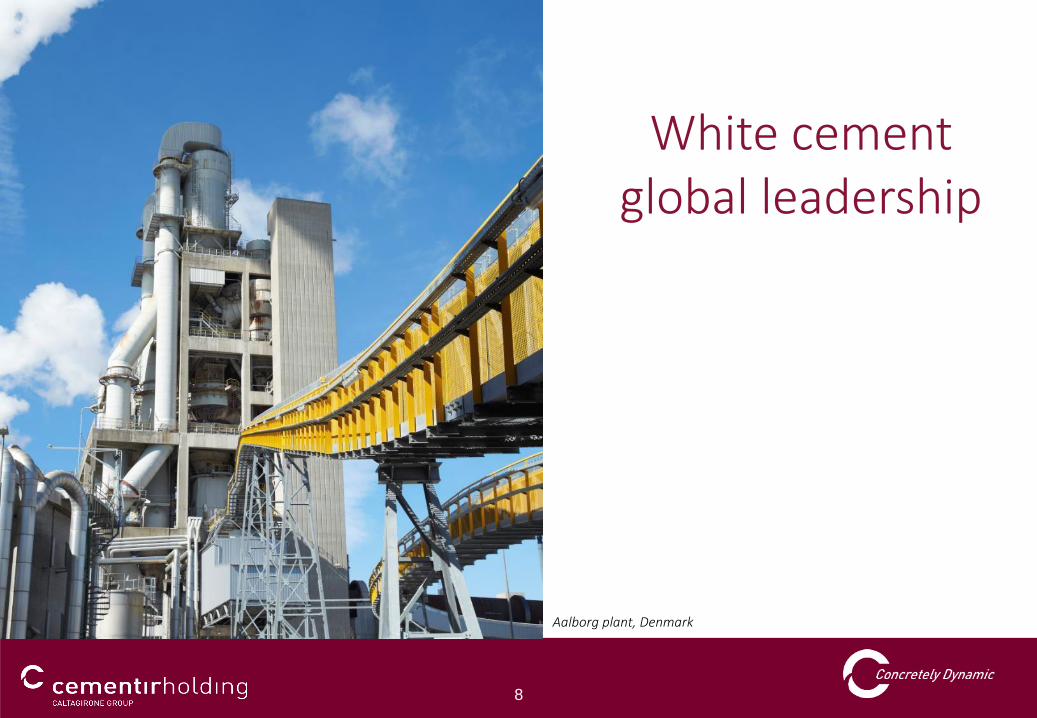
White cement global leadership
Aalborg plant, Denmark
9
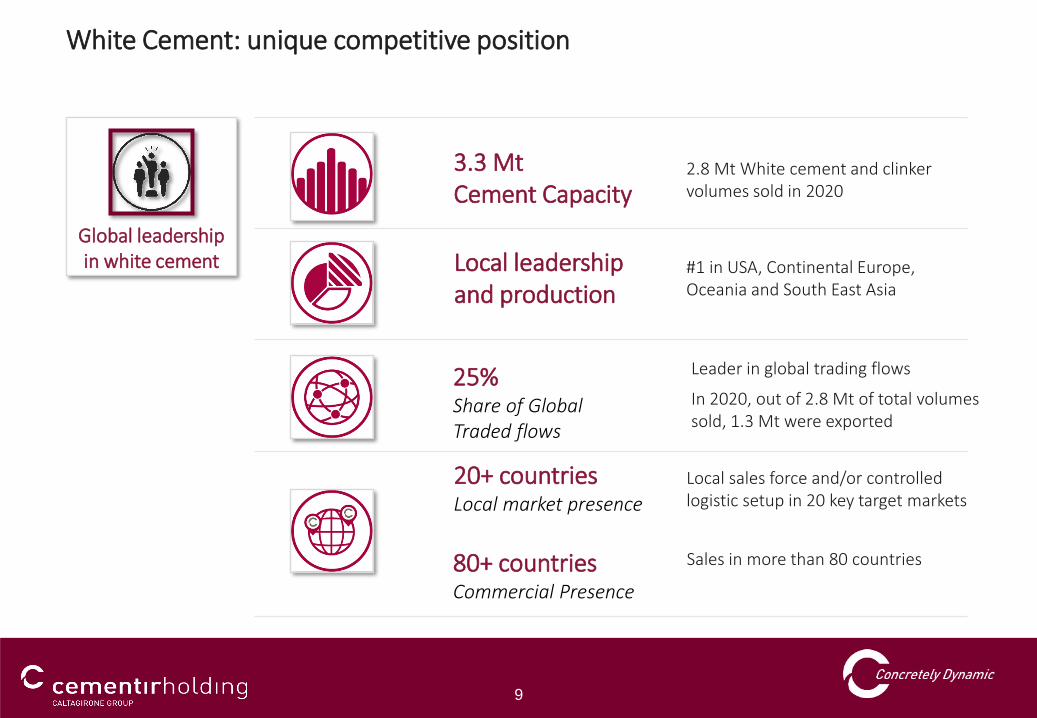
White Cement: unique competitive position
2.8 Mt White cement and clinker volumes sold in 2020
Global leadership in white cement
3.3 Mt Cement Capacity
Local leadership and production
25%Share of GlobalTraded flows
20+ countriesLocal market presence
#1 in USA, Continental Europe, Oceania and South East Asia
Leader in global trading flows
In 2020, out of 2.8 Mt of total volumes sold, 1.3 Mt were exported
Local sales force and/or controlled logistic setup in 20 key target markets
80+ countriesCommercial Presence
Sales in more than 80 countries
10
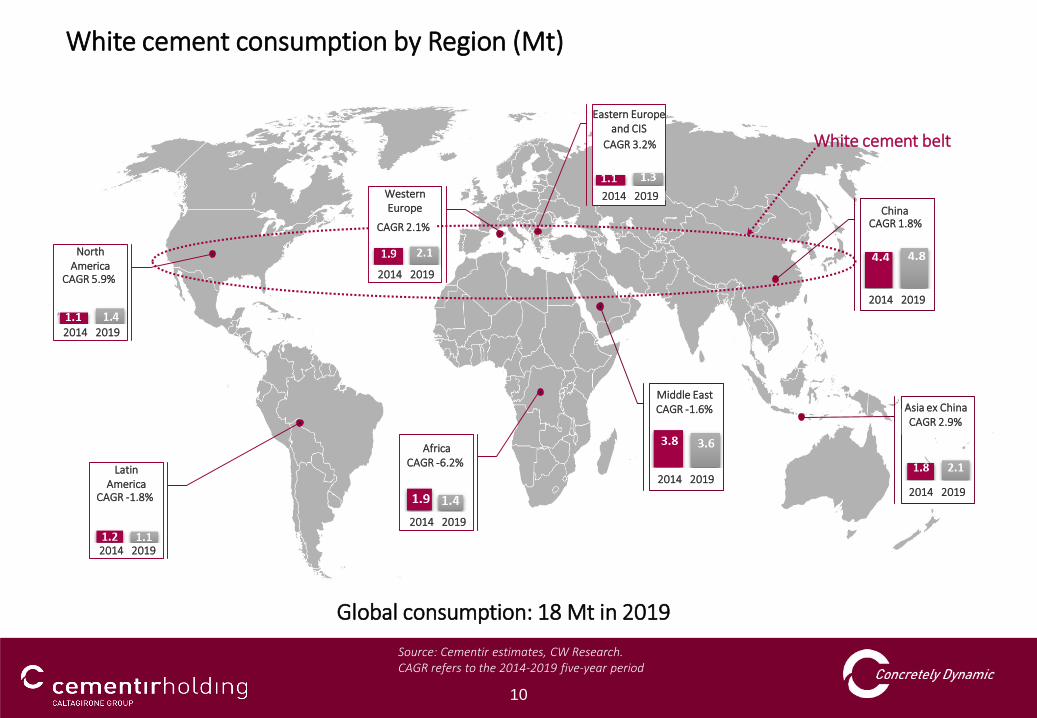
Source: Cementir estimates, CW Research. CAGR refers to the 2014-2019 five-year period
Global consumption: 18 Mt in 2019
White cement consumption by Region (Mt)
CAGR 1.8%
WesternEurope
Eastern Europe and CIS
China
White cement belt
2014 2019
2014 2019
CAGR 2.9%Asia ex China
2014 2019
CAGR -1.6%Middle East
2014 2019
CAGR 3.2%
2014 2019
CAGR 2.1%
Africa
2014 2019
CAGR -6.2%Latin
America
2014 2019
CAGR -1.8%
North America
2014 2019
CAGR 5.9%
11
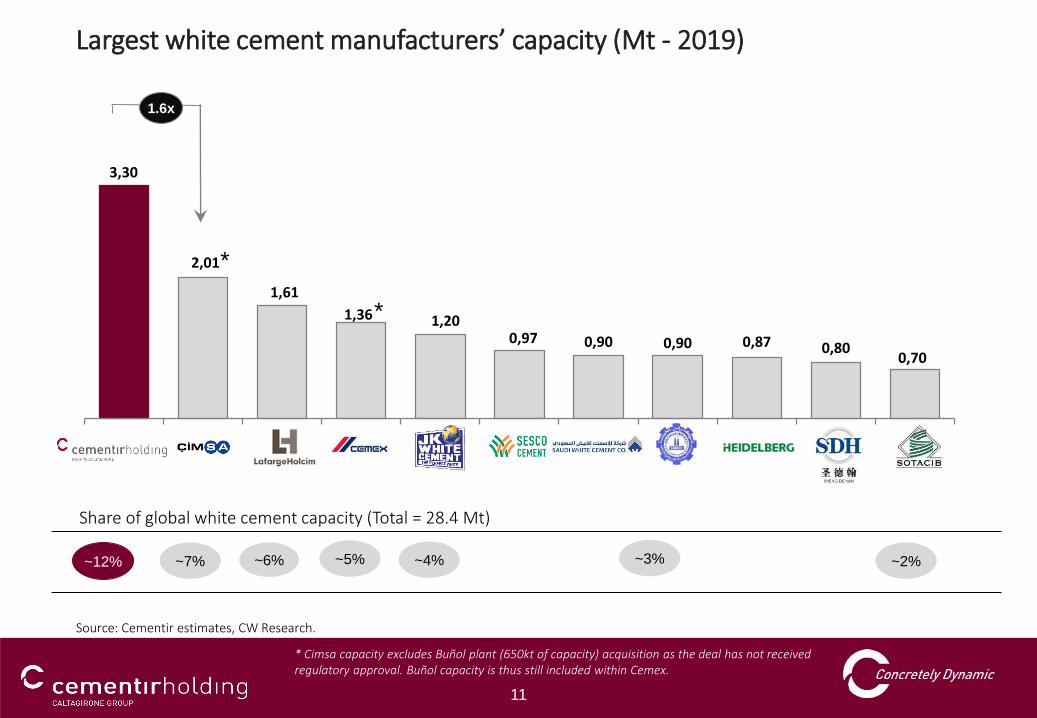
Largest white cement manufacturers’ capacity (Mt - 2019)
3,30
2,01
1,61
1,36 1,20 0,97 0,90 0,90 0,87 0,80
0,70
1.6x
~12% ~7% ~4% ~3% ~2%~5%~6%
*
*
* Cimsa capacity excludes Buñol plant (650kt of capacity) acquisition as the deal has not received regulatory approval. Buñol capacity is thus still included within Cemex.
Share of global white cement capacity (Total = 28.4 Mt)
Source: Cementir estimates, CW Research.
12
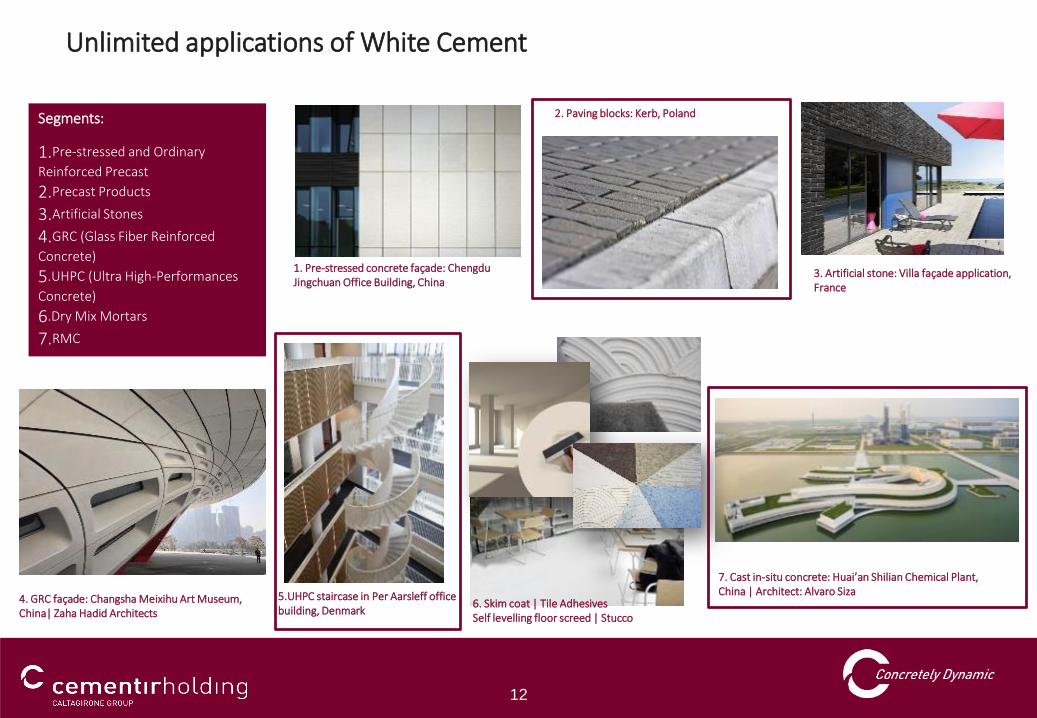
Segments:
1.Pre-stressed and Ordinary
Reinforced Precast
2.Precast Products
3.Artificial Stones
4.GRC (Glass Fiber Reinforced
Concrete)
5.UHPC (Ultra High-Performances
Concrete)
6.Dry Mix Mortars
7.RMC
Unlimited applications of White Cement
1. Pre-stressed concrete façade: Chengdu Jingchuan Office Building, China
2. Paving blocks: Kerb, Poland
7. Cast in-situ concrete: Huai’an Shilian Chemical Plant, China | Architect: Alvaro Siza
6. Skim coat | Tile AdhesivesSelf levelling floor screed | Stucco
4. GRC façade: Changsha Meixihu Art Museum, China| Zaha Hadid Architects
5.UHPC staircase in Per Aarsleff office building, Denmark
3. Artificial stone: Villa façade application, France
13
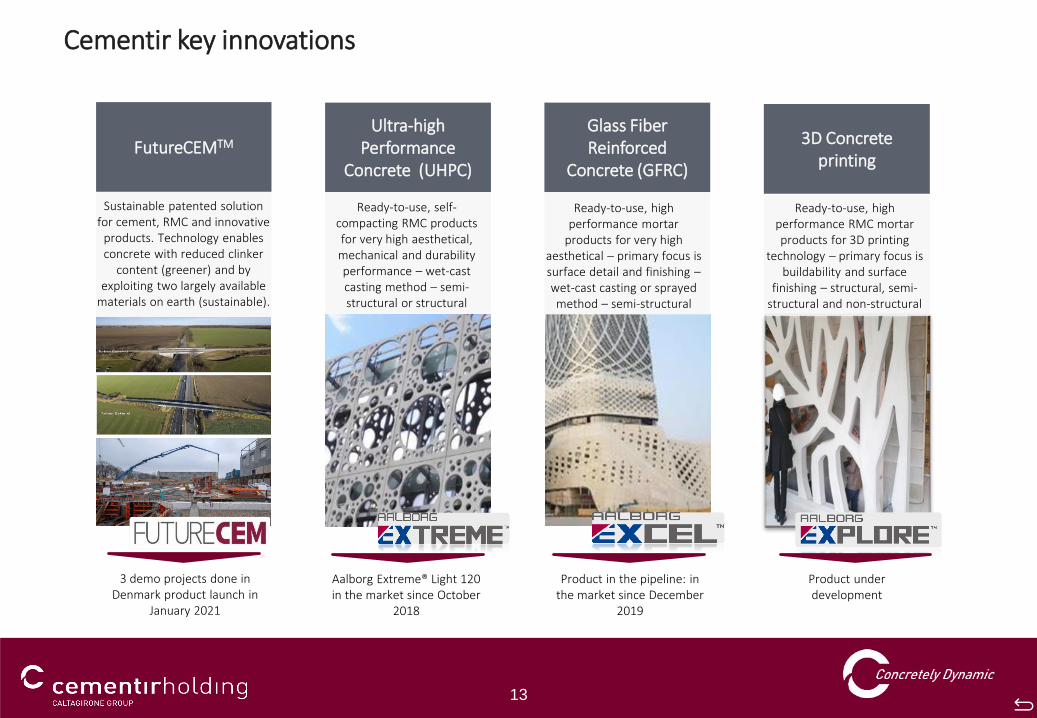
Sustainable patented solution for cement, RMC and innovative
products. Technology enables concrete with reduced clinker
content (greener) and by exploiting two largely available
materials on earth (sustainable).
Cementir key innovations
Ultra-high Performance
Concrete (UHPC)
Glass Fiber Reinforced
Concrete (GFRC)
3D Concrete printing
FutureCEMTM
Ready-to-use, self-compacting RMC products for very high aesthetical,
mechanical and durability performance – wet-cast casting method – semi-structural or structural
Ready-to-use, high performance mortar
products for very high aesthetical – primary focus is surface detail and finishing –wet-cast casting or sprayed method – semi-structural
Ready-to-use, high performance RMC mortar products for 3D printing
technology – primary focus is buildability and surface
finishing – structural, semi-structural and non-structural
Aalborg Extreme® Light 120 in the market since October
2018
Product in the pipeline: in the market since December
2019
Product under development
3 demo projects done in Denmark product launch in
January 2021
14
2020 Resultsand
2021 Guidance
15
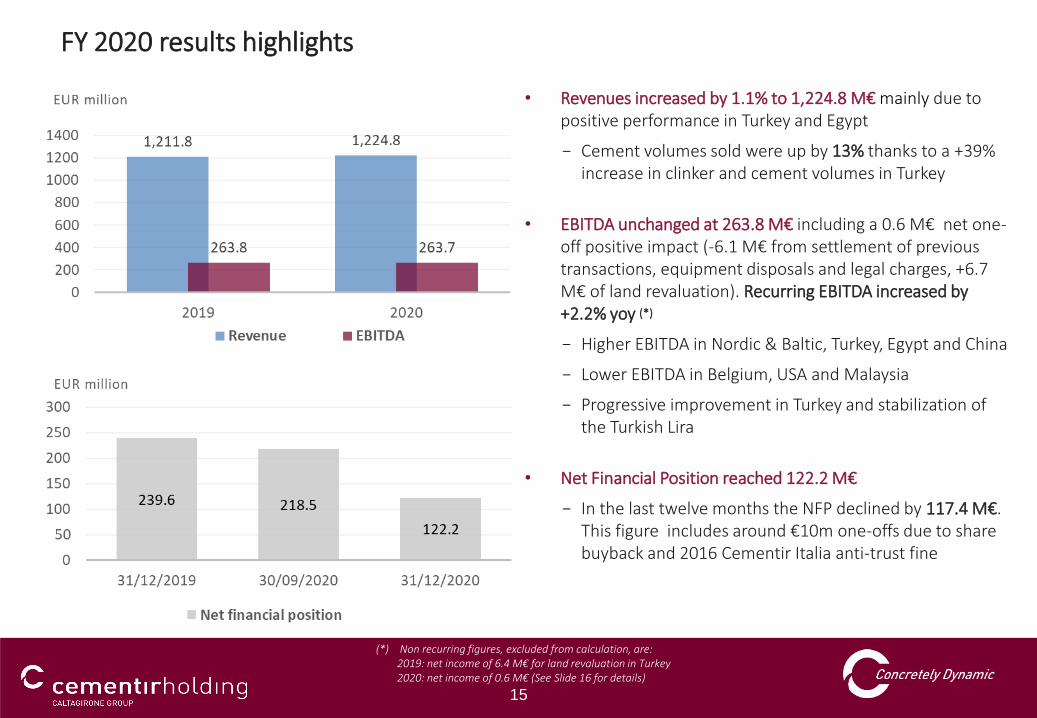
• Revenues increased by 1.1% to 1,224.8 M€ mainly due to positive performance in Turkey and Egypt
− Cement volumes sold were up by 13% thanks to a +39% increase in clinker and cement volumes in Turkey
• EBITDA unchanged at 263.8 M€ including a 0.6 M€ net one-off positive impact (-6.1 M€ from settlement of previous transactions, equipment disposals and legal charges, +6.7 M€ of land revaluation). Recurring EBITDA increased by +2.2% yoy (*)
− Higher EBITDA in Nordic & Baltic, Turkey, Egypt and China
− Lower EBITDA in Belgium, USA and Malaysia
− Progressive improvement in Turkey and stabilization of the Turkish Lira
• Net Financial Position reached 122.2 M€
− In the last twelve months the NFP declined by 117.4 M€. This figure includes around €10m one-offs due to share buyback and 2016 Cementir Italia anti-trust fine
FY 2020 results highlights
(*) Non recurring figures, excluded from calculation, are:2019: net income of 6.4 M€ for land revaluation in Turkey2020: net income of 0.6 M€ (See Slide 16 for details)
16
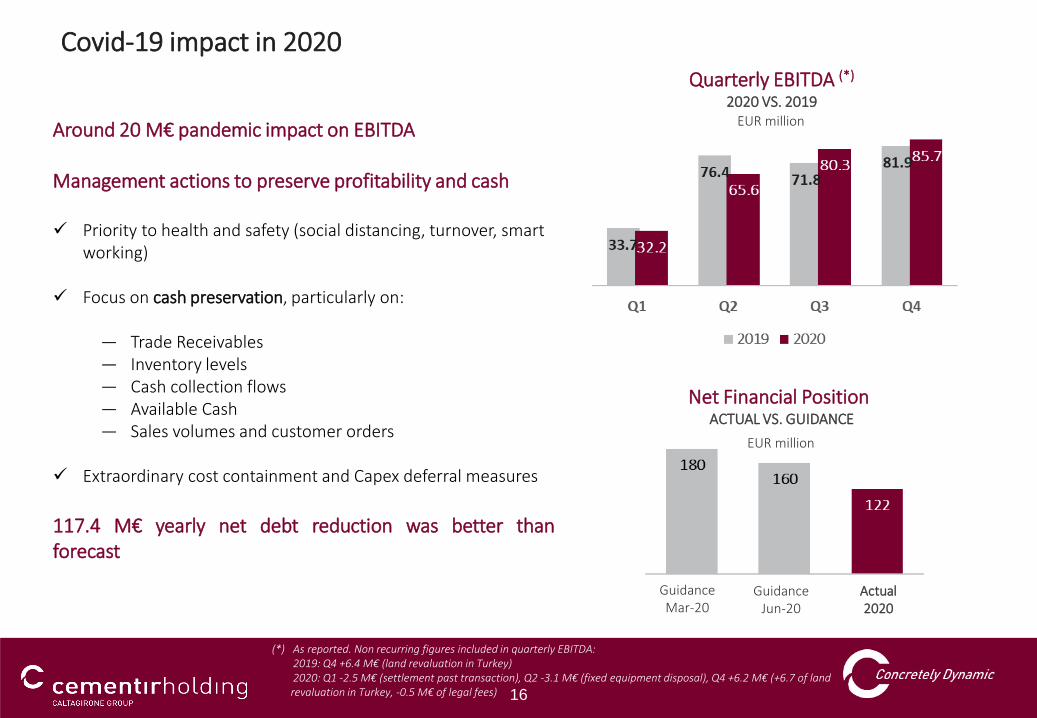
Covid-19 impact in 2020
Around 20 M€ pandemic impact on EBITDA
Management actions to preserve profitability and cash
✓ Priority to health and safety (social distancing, turnover, smart working)
✓ Focus on cash preservation, particularly on:
― Trade Receivables― Inventory levels― Cash collection flows― Available Cash― Sales volumes and customer orders
✓ Extraordinary cost containment and Capex deferral measures
117.4 M€ yearly net debt reduction was better thanforecast
Quarterly EBITDA (*)
2020 VS. 2019EUR million
Net Financial Position ACTUAL VS. GUIDANCE
EUR million
GuidanceMar-20
GuidanceJun-20
Actual2020
(*) As reported. Non recurring figures included in quarterly EBITDA:2019: Q4 +6.4 M€ (land revaluation in Turkey)2020: Q1 -2.5 M€ (settlement past transaction), Q2 -3.1 M€ (fixed equipment disposal), Q4 +6.2 M€ (+6.7 of land revaluation in Turkey, -0.5 M€ of legal fees)
17
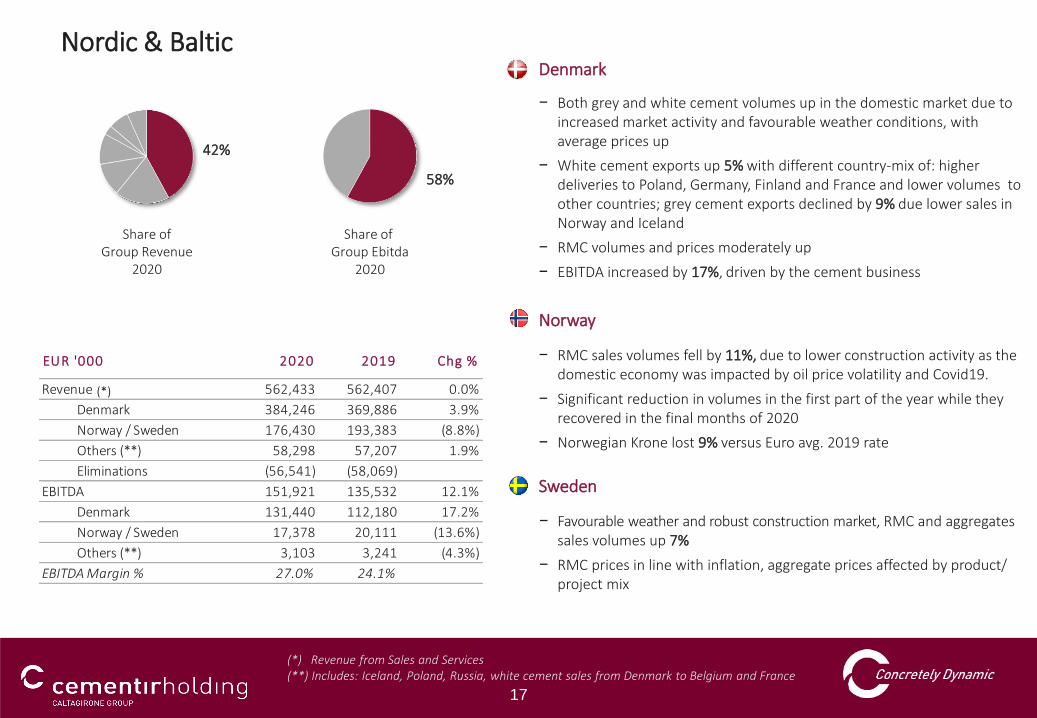
Revenue 562,433 562,407 0.0%
Denmark 384,246 369,886 3.9%
Norway / Sweden 176,430 193,383 (8.8%)
Others (**) 58,298 57,207 1.9%
Eliminations (56,541) (58,069)
EBITDA 151,921 135,532 12.1%
Denmark 131,440 112,180 17.2%
Norway / Sweden 17,378 20,111 (13.6%)
Others (**) 3,103 3,241 (4.3%)
EBITDA Margin % 27.0% 24.1%
2019 Chg %EUR '000 2020
• Denmark
− Both grey and white cement volumes up in the domestic market due to increased market activity and favourable weather conditions, with average prices up
− White cement exports up 5% with different country-mix of: higher deliveries to Poland, Germany, Finland and France and lower volumes to other countries; grey cement exports declined by 9% due lower sales in Norway and Iceland
− RMC volumes and prices moderately up
− EBITDA increased by 17%, driven by the cement business
• Norway
− RMC sales volumes fell by 11%, due to lower construction activity as the domestic economy was impacted by oil price volatility and Covid19.
− Significant reduction in volumes in the first part of the year while they recovered in the final months of 2020
− Norwegian Krone lost 9% versus Euro avg. 2019 rate
• Sweden
− Favourable weather and robust construction market, RMC and aggregates sales volumes up 7%
− RMC prices in line with inflation, aggregate prices affected by product/ project mix
Nordic & Baltic
(*) Revenue from Sales and Services(**) Includes: Iceland, Poland, Russia, white cement sales from Denmark to Belgium and France
Share of Group Revenue
2020
Share of Group Ebitda
2020
42%
58%
(*)
18
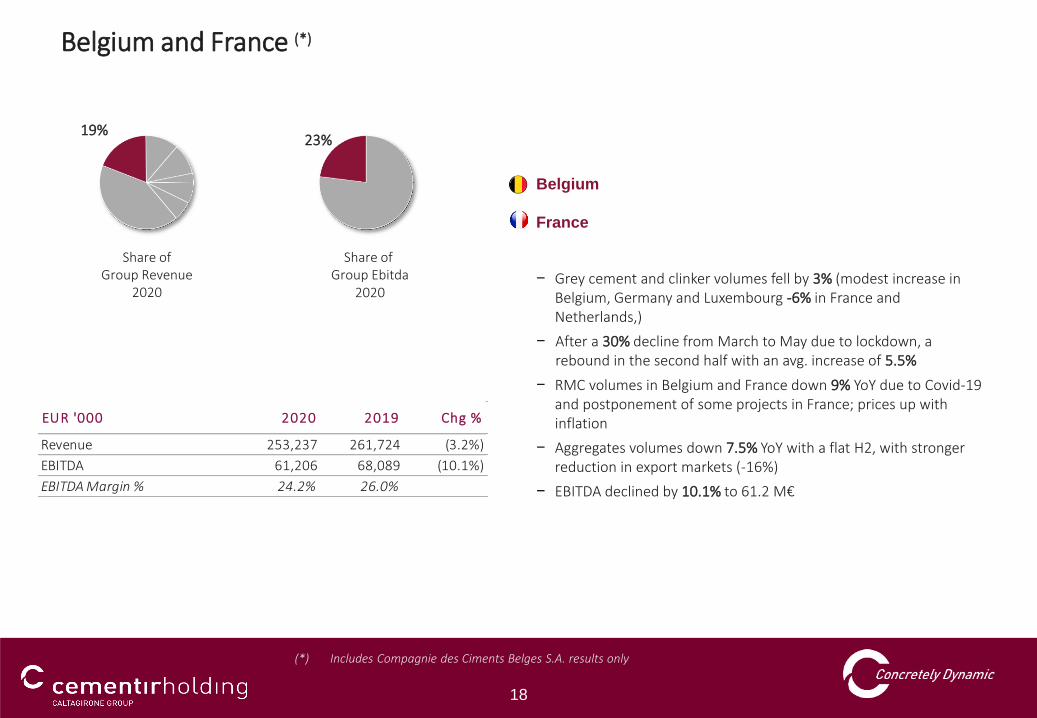
• Belgium
• France
− Grey cement and clinker volumes fell by 3% (modest increase in Belgium, Germany and Luxembourg -6% in France and Netherlands,)
− After a 30% decline from March to May due to lockdown, a rebound in the second half with an avg. increase of 5.5%
− RMC volumes in Belgium and France down 9% YoY due to Covid-19 and postponement of some projects in France; prices up with inflation
− Aggregates volumes down 7.5% YoY with a flat H2, with stronger reduction in export markets (-16%)
− EBITDA declined by 10.1% to 61.2 M€
Belgium and France (*)
19%23%
(*) Includes Compagnie des Ciments Belges S.A. results only
Share of Group Revenue
2020
Share of Group Ebitda
2020
Revenue 253,237 261,724 (3.2%)
EBITDA 61,206 68,089 (10.1%)
EBITDA Margin % 24.2% 26.0%
2020 2019 Chg %EUR '000
19
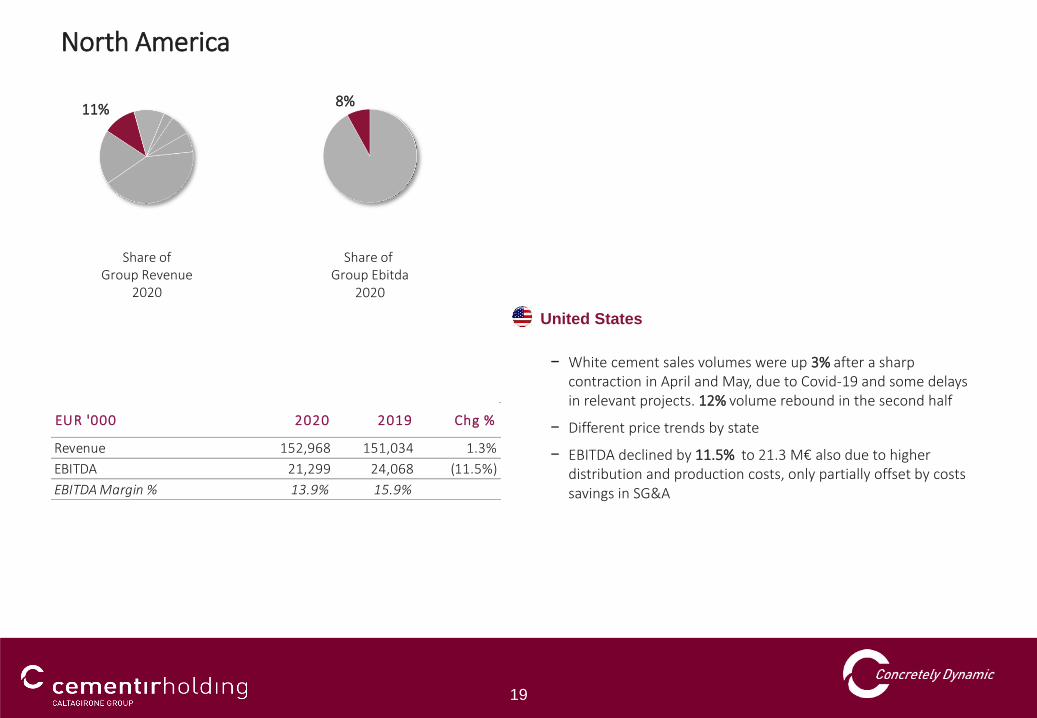
• United States
− White cement sales volumes were up 3% after a sharp contraction in April and May, due to Covid-19 and some delays in relevant projects. 12% volume rebound in the second half
− Different price trends by state
− EBITDA declined by 11.5% to 21.3 M€ also due to higher distribution and production costs, only partially offset by costs savings in SG&A
North America
11%8%
Share of Group Revenue
2020
Share of Group Ebitda
2020
Revenue 152,968 151,034 1.3%
EBITDA 21,299 24,068 (11.5%)
EBITDA Margin % 13.9% 15.9%
2020 2019 Chg %EUR '000
20
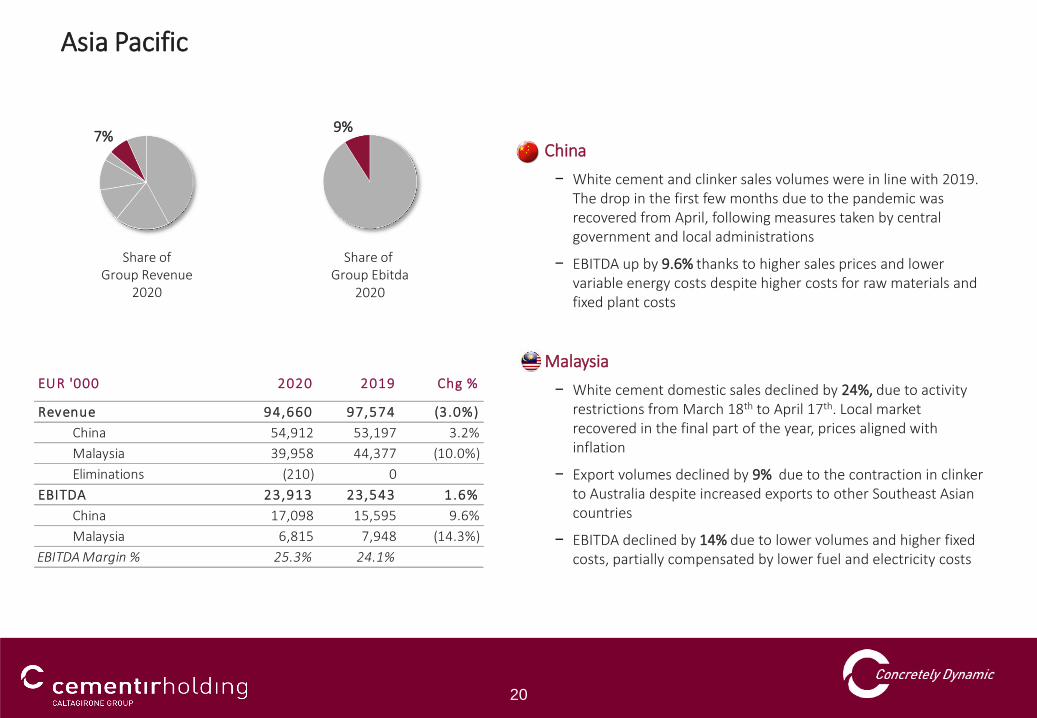
• China
− White cement and clinker sales volumes were in line with 2019.The drop in the first few months due to the pandemic was recovered from April, following measures taken by central government and local administrations
− EBITDA up by 9.6% thanks to higher sales prices and lower variable energy costs despite higher costs for raw materials and fixed plant costs
• Malaysia
− White cement domestic sales declined by 24%, due to activity restrictions from March 18th to April 17th. Local market recovered in the final part of the year, prices aligned with inflation
− Export volumes declined by 9% due to the contraction in clinker to Australia despite increased exports to other Southeast Asian countries
− EBITDA declined by 14% due to lower volumes and higher fixed costs, partially compensated by lower fuel and electricity costs
Asia Pacific
7%9%
Share of Group Revenue
2020
Share of Group Ebitda
2020
Revenue 94,660 97,574 (3.0%)
China 54,912 53,197 3.2%
Malaysia 39,958 44,377 (10.0%)
Eliminations (210) 0
EBITDA 23,913 23,543 1.6%
China 17,098 15,595 9.6%
Malaysia 6,815 7,948 (14.3%)
EBITDA Margin % 25.3% 24.1%
2020 2019EUR '000 Chg %
21
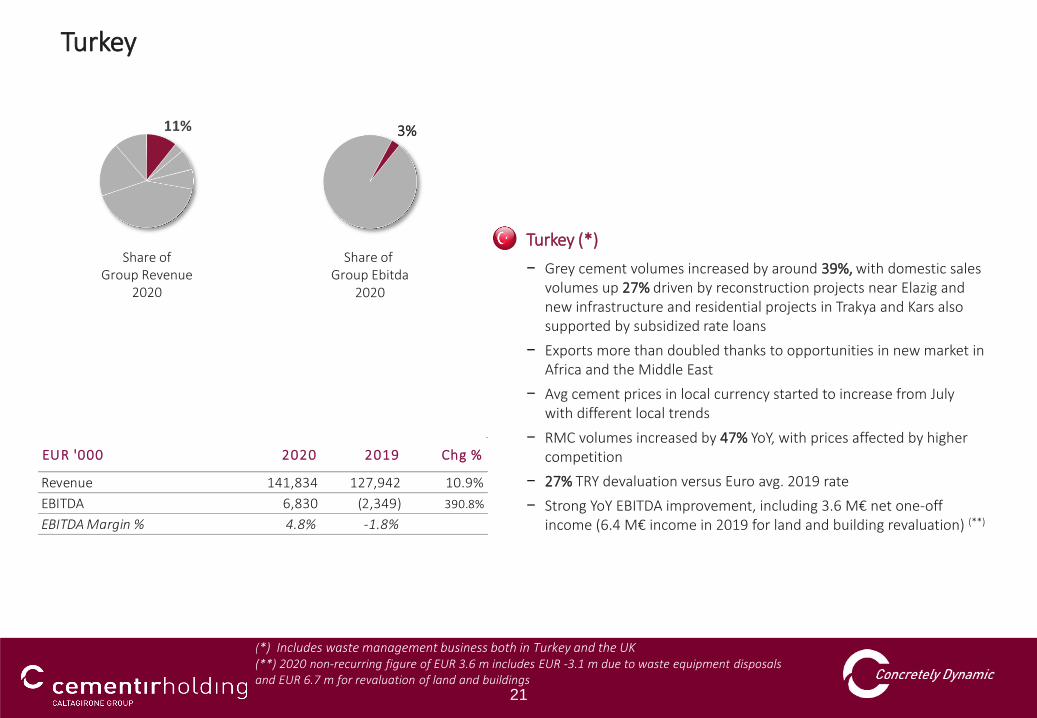
• Turkey (*)
− Grey cement volumes increased by around 39%, with domestic sales volumes up 27% driven by reconstruction projects near Elazig and new infrastructure and residential projects in Trakya and Kars also supported by subsidized rate loans
− Exports more than doubled thanks to opportunities in new market in Africa and the Middle East
− Avg cement prices in local currency started to increase from July with different local trends
− RMC volumes increased by 47% YoY, with prices affected by higher competition
− 27% TRY devaluation versus Euro avg. 2019 rate
− Strong YoY EBITDA improvement, including 3.6 M€ net one-off income (6.4 M€ income in 2019 for land and building revaluation) (**)
Turkey
11%
(*) Includes waste management business both in Turkey and the UK(**) 2020 non-recurring figure of EUR 3.6 m includes EUR -3.1 m due to waste equipment disposals and EUR 6.7 m for revaluation of land and buildings
Share of Group Revenue
2020
Share of Group Ebitda
2020
Revenue 141,834 127,942 10.9%
EBITDA 6,830 (2,349) 390.8%
EBITDA Margin % 4.8% -1.8%
2020 Chg %2019EUR '000
3%
22
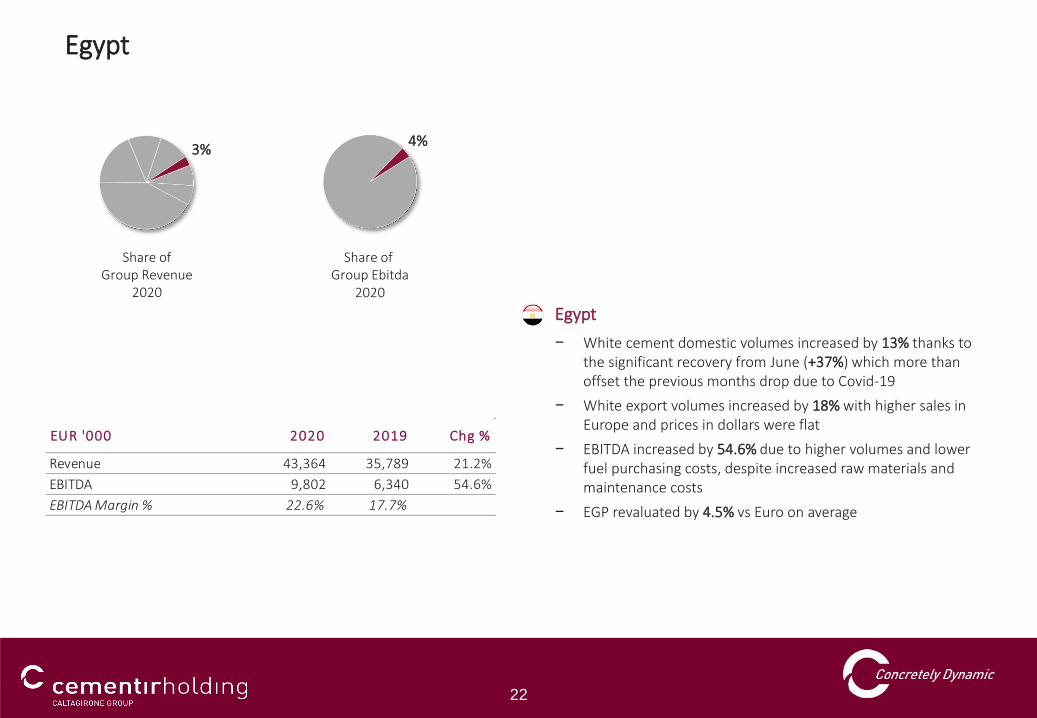
• Egypt
− White cement domestic volumes increased by 13% thanks to the significant recovery from June (+37%) which more than offset the previous months drop due to Covid-19
− White export volumes increased by 18% with higher sales in Europe and prices in dollars were flat
− EBITDA increased by 54.6% due to higher volumes and lower fuel purchasing costs, despite increased raw materials and maintenance costs
− EGP revaluated by 4.5% vs Euro on average
Egypt
3%4%
Share of Group Revenue
2020
Share of Group Ebitda
2020
Revenue 43,364 35,789 21.2%
EBITDA 9,802 6,340 54.6%
EBITDA Margin % 22.6% 17.7%
EUR '000 2020 2019 Chg %
23
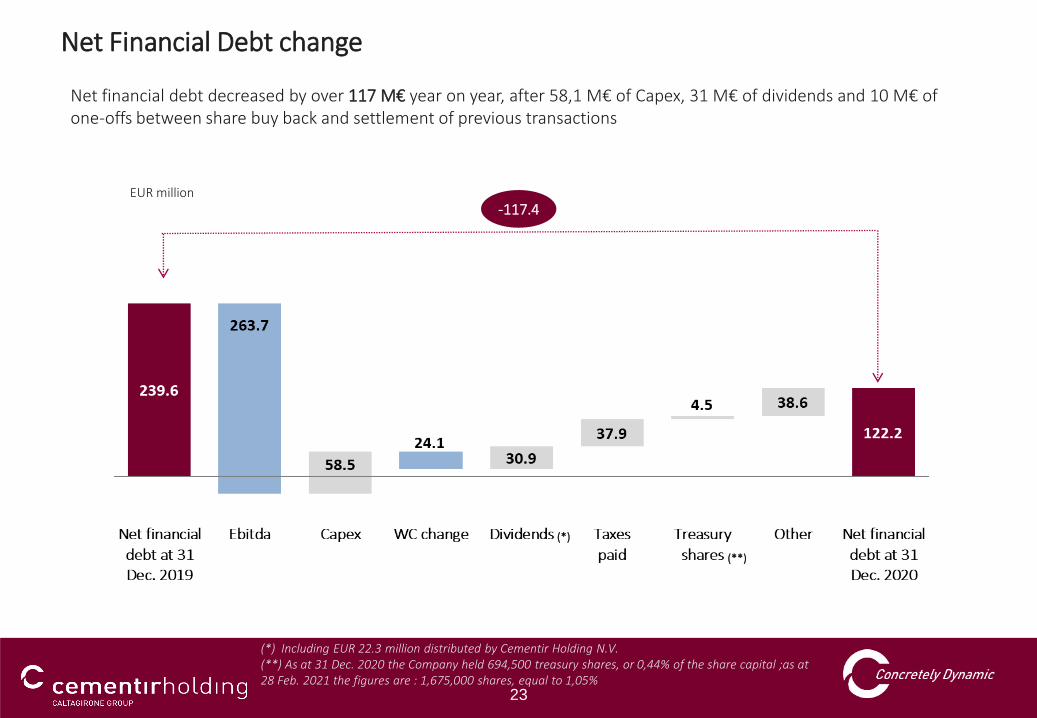
EUR million
Net financial debt decreased by over 117 M€ year on year, after 58,1 M€ of Capex, 31 M€ of dividends and 10 M€ ofone-offs between share buy back and settlement of previous transactions
-117.4
Net Financial Debt change
(*)
(*) Including EUR 22.3 million distributed by Cementir Holding N.V.(**) As at 31 Dec. 2020 the Company held 694,500 treasury shares, or 0,44% of the share capital ;as at 28 Feb. 2021 the figures are : 1,675,000 shares, equal to 1,05%
(**)
24
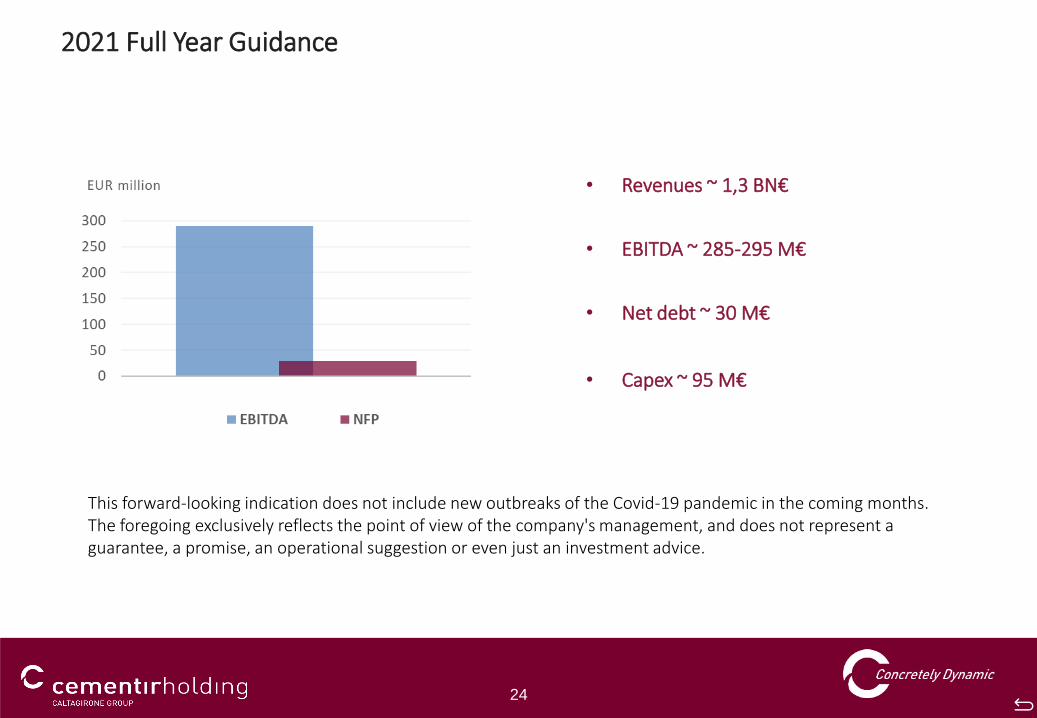
2021 Full Year Guidance
• Revenues ~ 1,3 BN€
• EBITDA ~ 285-295 M€
• Net debt ~ 30 M€
• Capex ~ 95 M€
This forward-looking indication does not include new outbreaks of the Covid-19 pandemic in the coming months.The foregoing exclusively reflects the point of view of the company's management, and does not represent a guarantee, a promise, an operational suggestion or even just an investment advice.
25
Industrial Plan 2021-2023
update
Trakya plant, Turkey
26
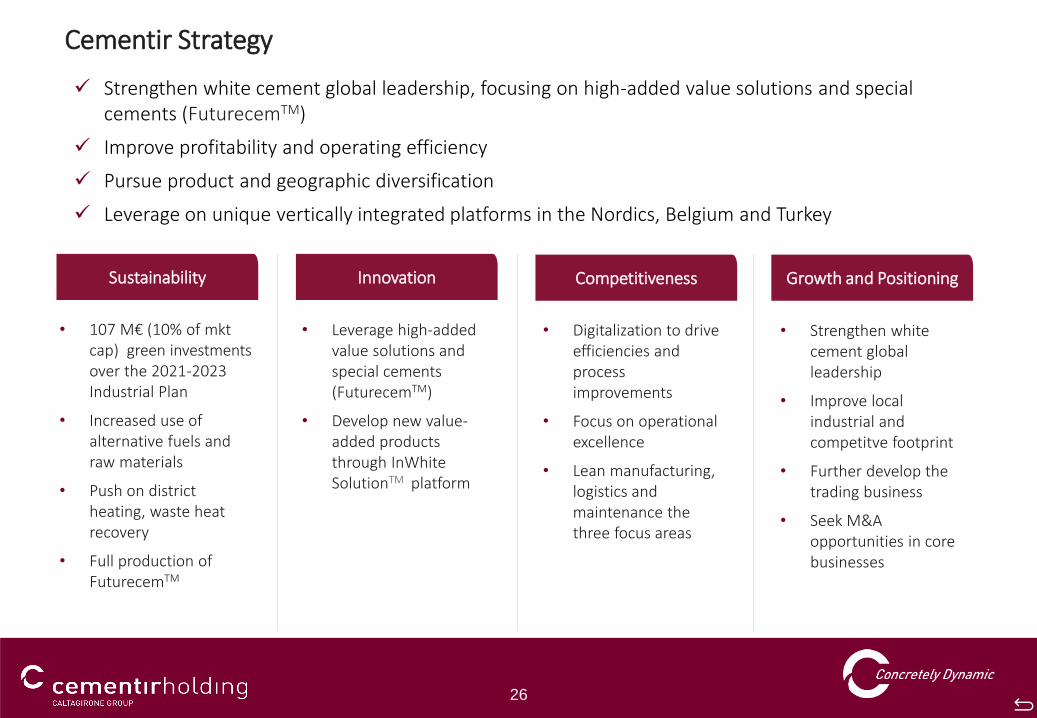
• Strengthen white cement global leadership
• Improve local industrial and competitve footprint
• Further develop the trading business
• Seek M&A opportunities in core businesses
Cementir Strategy
Growth and PositioningCompetitivenessInnovationSustainability
• Digitalization to drive efficiencies and process improvements
• Focus on operational excellence
• Lean manufacturing, logistics and maintenance the three focus areas
• Leverage high-added value solutions and special cements (FuturecemTM)
• Develop new value-added products through InWhiteSolutionTM platform
• 107 M€ (10% of mktcap) green investments over the 2021-2023 Industrial Plan
• Increased use of alternative fuels and raw materials
• Push on district heating, waste heat recovery
• Full production of FuturecemTM
✓ Strengthen white cement global leadership, focusing on high-added value solutions and special cements (FuturecemTM)
✓ Improve profitability and operating efficiency
✓ Pursue product and geographic diversification
✓ Leverage on unique vertically integrated platforms in the Nordics, Belgium and Turkey
27
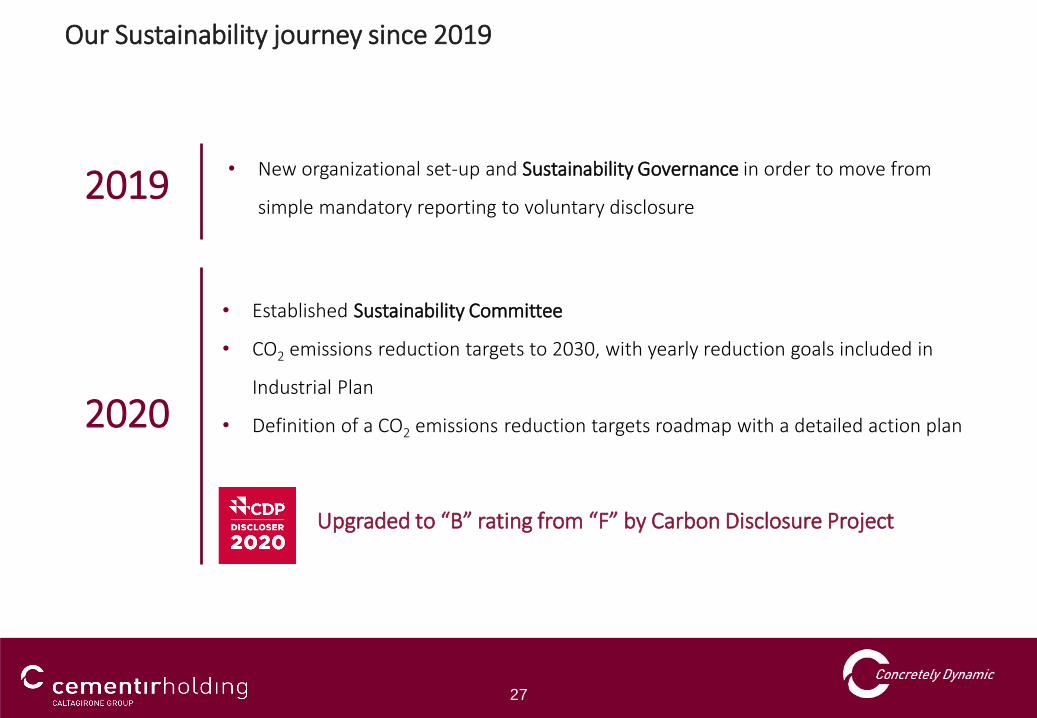
Our Sustainability journey since 2019
• New organizational set-up and Sustainability Governance in order to move from
simple mandatory reporting to voluntary disclosure2019
2020
• Established Sustainability Committee
• CO2 emissions reduction targets to 2030, with yearly reduction goals included in
Industrial Plan
• Definition of a CO2 emissions reduction targets roadmap with a detailed action plan
Upgraded to “B” rating from “F” by Carbon Disclosure Project
28
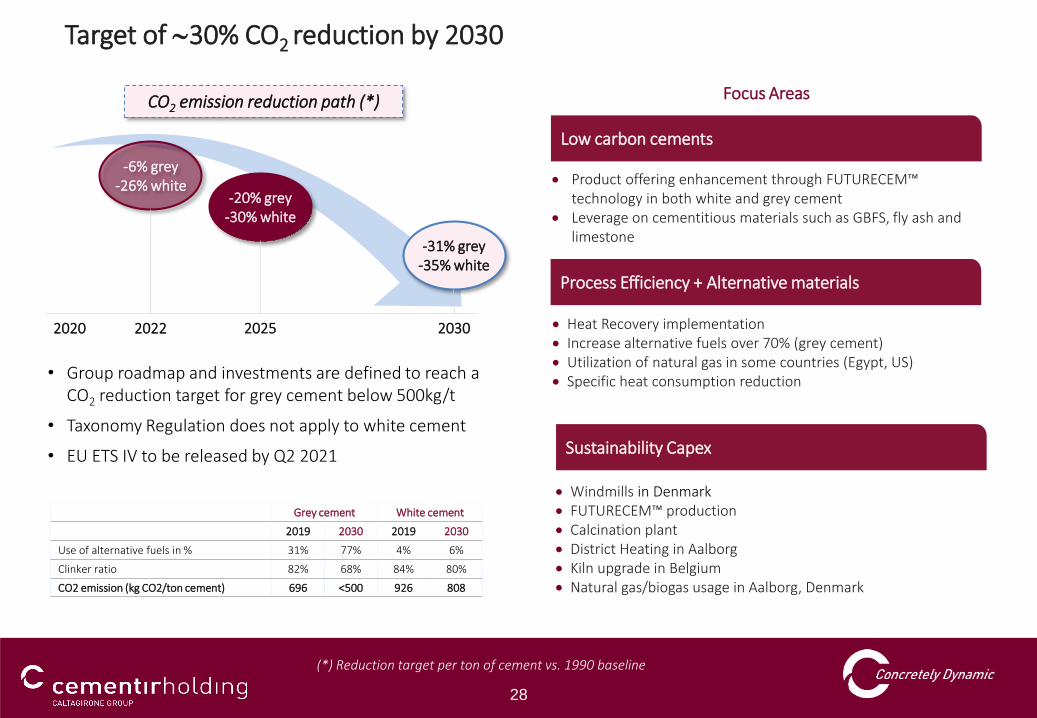
Target of 30% CO2 reduction by 2030
2020 2022 2025 2030
Focus Areas
• Product offering enhancement through FUTURECEM™ technology in both white and grey cement
• Leverage on cementitious materials such as GBFS, fly ash and limestone
Low carbon cements
• Heat Recovery implementation • Increase alternative fuels over 70% (grey cement)• Utilization of natural gas in some countries (Egypt, US)• Specific heat consumption reduction
Process Efficiency + Alternative materials
• Windmills in Denmark• FUTURECEM™ production• Calcination plant• District Heating in Aalborg • Kiln upgrade in Belgium• Natural gas/biogas usage in Aalborg, Denmark
Sustainability Capex
-6% grey-26% white
-20% grey-30% white
-31% grey-35% white
CO2 emission reduction path (*)
(*) Reduction target per ton of cement vs. 1990 baseline
Grey cement White cement
2019 2030 2019 2030
Use of alternative fuels in % 31% 77% 4% 6%
Clinker ratio 82% 68% 84% 80%
CO2 emission (kg CO2/ton cement) 696 <500 926 808
• Group roadmap and investments are defined to reach a CO2 reduction target for grey cement below 500kg/t
• Taxonomy Regulation does not apply to white cement
• EU ETS IV to be released by Q2 2021
29
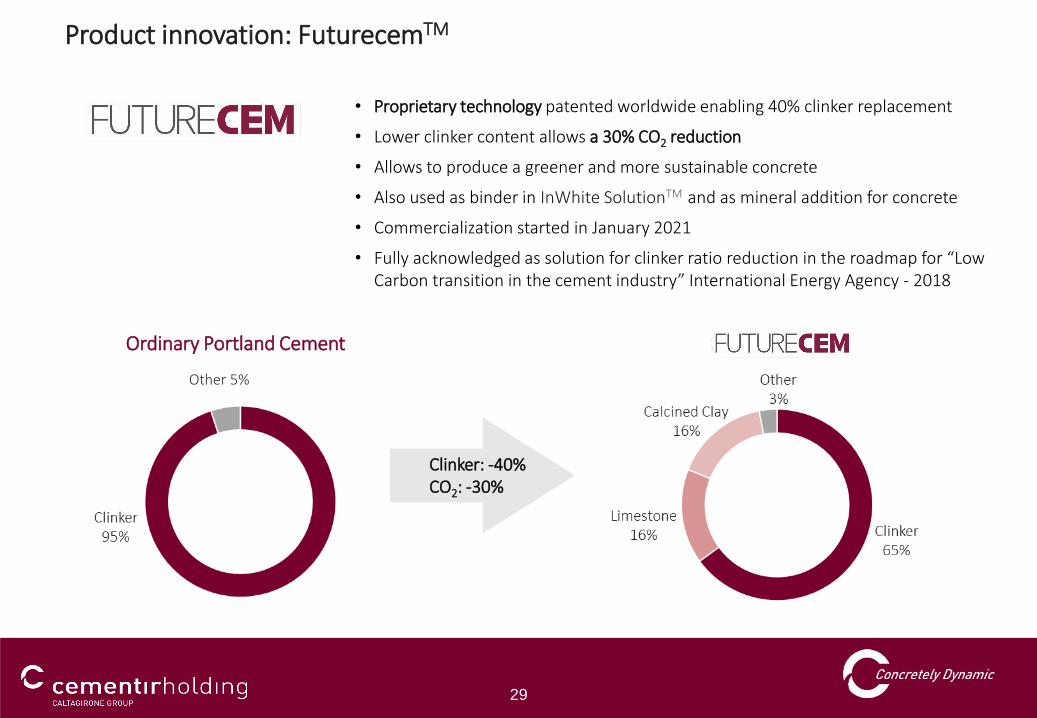
Product innovation: FuturecemTM
• Proprietary technology patented worldwide enabling 40% clinker replacement
• Lower clinker content allows a 30% CO2 reduction
• Allows to produce a greener and more sustainable concrete
• Also used as binder in InWhite SolutionTM and as mineral addition for concrete
• Commercialization started in January 2021
• Fully acknowledged as solution for clinker ratio reduction in the roadmap for “Low Carbon transition in the cement industry” International Energy Agency - 2018
Ordinary Portland Cement Futurecem
Clinker: -40%CO2: -30%
Other 5%
30
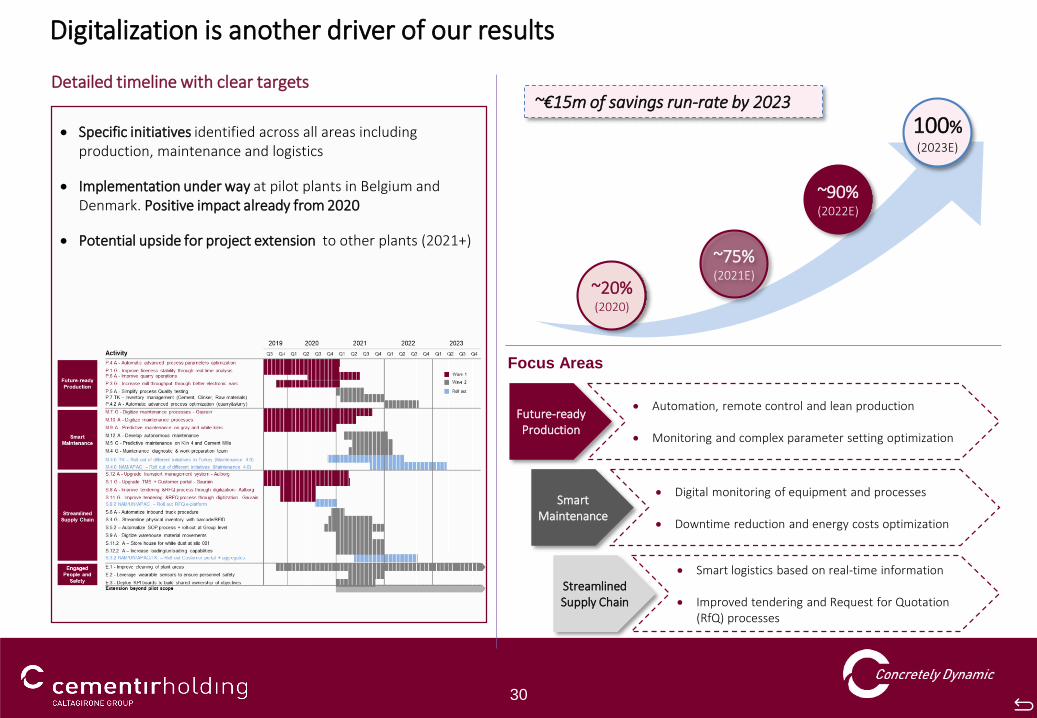
Digitalization is another driver of our results
Detailed timeline with clear targets
Focus Areas
• Specific initiatives identified across all areas including production, maintenance and logistics
• Implementation under way at pilot plants in Belgium and Denmark. Positive impact already from 2020
• Potential upside for project extension to other plants (2021+)
Future-readyProduction
• Automation, remote control and lean production
• Monitoring and complex parameter setting optimization
SmartMaintenance
• Digital monitoring of equipment and processes
• Downtime reduction and energy costs optimization
Streamlined Supply Chain
• Smart logistics based on real-time information
• Improved tendering and Request for Quotation (RfQ) processes
~€15m of savings run-rate by 2023
~20%(2020)
~75%(2021E)
~90%(2022E)
100%(2023E)
31
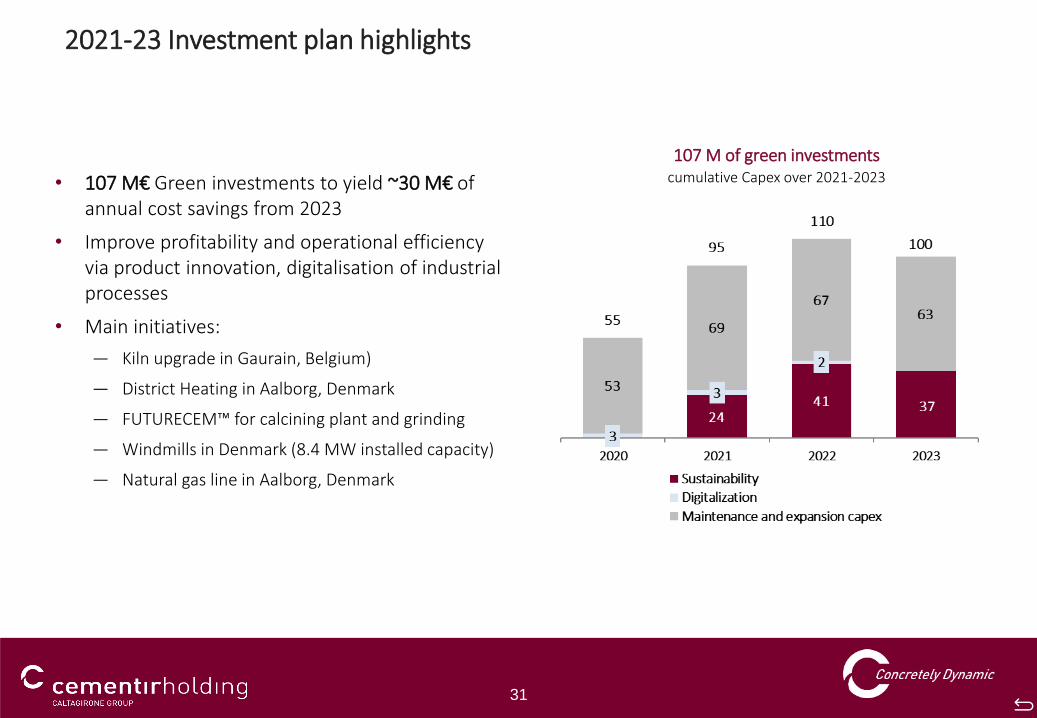
• 107 M€ Green investments to yield ~30 M€ of annual cost savings from 2023
• Improve profitability and operational efficiency via product innovation, digitalisation of industrial processes
• Main initiatives:
― Kiln upgrade in Gaurain, Belgium)
― District Heating in Aalborg, Denmark
― FUTURECEM™ for calcining plant and grinding
― Windmills in Denmark (8.4 MW installed capacity)
― Natural gas line in Aalborg, Denmark
2021-23 Investment plan highlights
107 M of green investmentscumulative Capex over 2021-2023
32
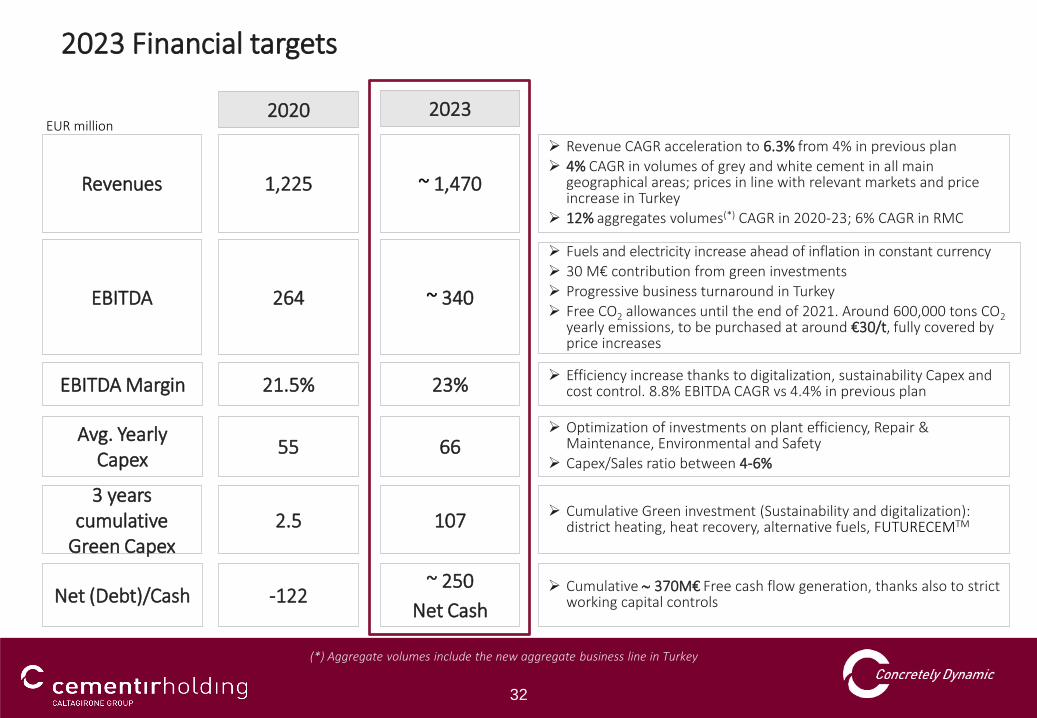
➢ Cumulative 370M€ Free cash flow generation, thanks also to strict working capital controls
➢ Optimization of investments on plant efficiency, Repair & Maintenance, Environmental and Safety
➢ Capex/Sales ratio between 4-6%
➢ Fuels and electricity increase ahead of inflation in constant currency➢ 30 M€ contribution from green investments➢ Progressive business turnaround in Turkey➢ Free CO2 allowances until the end of 2021. Around 600,000 tons CO2
yearly emissions, to be purchased at around €30/t, fully covered by price increases
➢ Revenue CAGR acceleration to 6.3% from 4% in previous plan ➢ 4% CAGR in volumes of grey and white cement in all main
geographical areas; prices in line with relevant markets and price increase in Turkey
➢ 12% aggregates volumes(*) CAGR in 2020-23; 6% CAGR in RMC
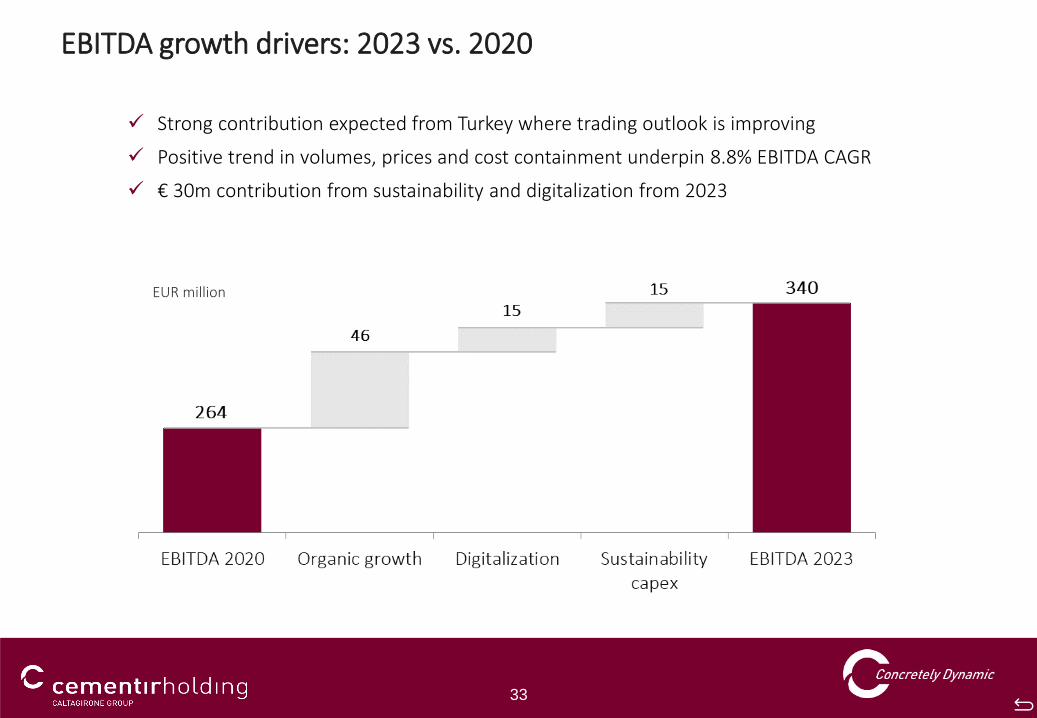
Revenues 1,225 ~ 1,470
EBITDA 264 ~ 340
Avg. Yearly Capex
55 66
Net (Debt)/Cash -122~ 250
Net Cash
2020 2023EUR million
➢ Efficiency increase thanks to digitalization, sustainability Capex and cost control. 8.8% EBITDA CAGR vs 4.4% in previous planEBITDA Margin 21.5% 23%
➢ Cumulative Green investment (Sustainability and digitalization): district heating, heat recovery, alternative fuels, FUTURECEMTM
3 years cumulative
Green Capex2.5 107
2023 Financial targets
(*) Aggregate volumes include the new aggregate business line in Turkey
33
EBITDA growth drivers: 2023 vs. 2020
✓ Strong contribution expected from Turkey where trading outlook is improving
✓ Positive trend in volumes, prices and cost containment underpin 8.8% EBITDA CAGR
✓ € 30m contribution from sustainability and digitalization from 2023
EUR million
34
Appendix
Gaurain plant, Belgium
35
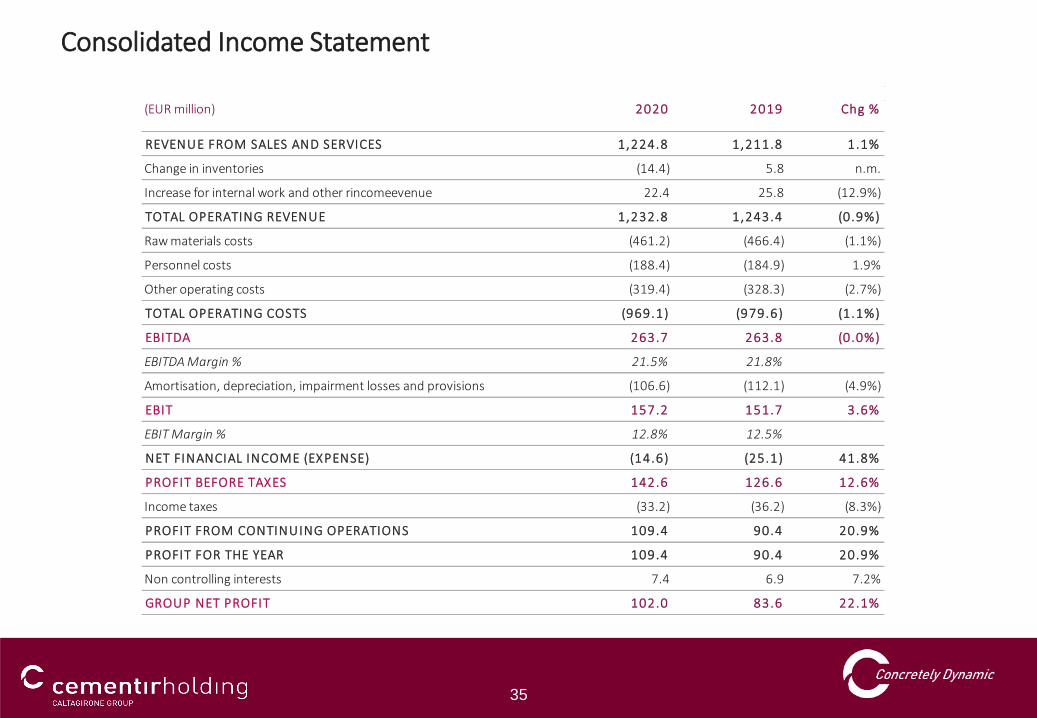
Consolidated Income Statement
REVENUE FROM SALES AND SERVICES 1,224.8 1,211.8 1.1%
Change in inventories (14.4) 5.8 n.m.
Increase for internal work and other rincomeevenue 22.4 25.8 (12.9%)
TOTAL OPERATING REVENUE 1,232.8 1,243.4 (0.9%)
Raw materials costs (461.2) (466.4) (1.1%)
Personnel costs (188.4) (184.9) 1.9%
Other operating costs (319.4) (328.3) (2.7%)
TOTAL OPERATING COSTS (969.1) (979.6) (1.1%)
EBITDA 263.7 263.8 (0.0%)
EBITDA Margin % 21.5% 21.8%
Amortisation, depreciation, impairment losses and provisions (106.6) (112.1) (4.9%)
EBIT 157.2 151.7 3.6%
EBIT Margin % 12.8% 12.5%
NET FINANCIAL INCOME (EXPENSE) (14.6) (25.1) 41.8%
PROFIT BEFORE TAXES 142.6 126.6 12.6%
Income taxes (33.2) (36.2) (8.3%)
PROFIT FROM CONTINUING OPERATIONS 109.4 90.4 20.9%
PROFIT FOR THE YEAR 109.4 90.4 20.9%
Non controlling interests 7.4 6.9 7.2%
GROUP NET PROFIT 102.0 83.6 22.1%
Chg %(EUR million) 2020 2019
36
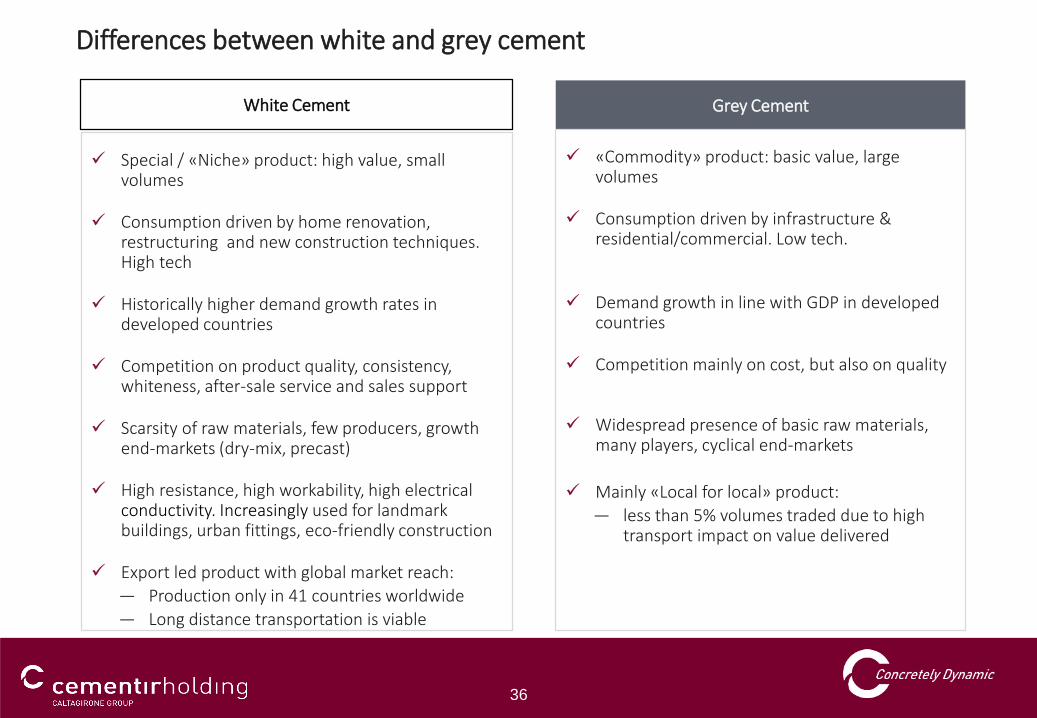
White Cement
✓ Special / «Niche» product: high value, small volumes
✓ Consumption driven by home renovation, restructuring and new construction techniques. High tech
✓ Historically higher demand growth rates in developed countries
✓ Competition on product quality, consistency, whiteness, after-sale service and sales support
✓ Scarsity of raw materials, few producers, growthend-markets (dry-mix, precast)
✓ High resistance, high workability, high electricalconductivity. Increasingly used for landmark buildings, urban fittings, eco-friendly construction
✓ Export led product with global market reach:
― Production only in 41 countries worldwide
― Long distance transportation is viable
Grey Cement
✓ «Commodity» product: basic value, large volumes
✓ Consumption driven by infrastructure & residential/commercial. Low tech.
✓ Demand growth in line with GDP in developedcountries
✓ Competition mainly on cost, but also on quality
✓ Widespread presence of basic raw materials, many players, cyclical end-markets
✓ Mainly «Local for local» product:
― less than 5% volumes traded due to high transport impact on value delivered
Differences between white and grey cement
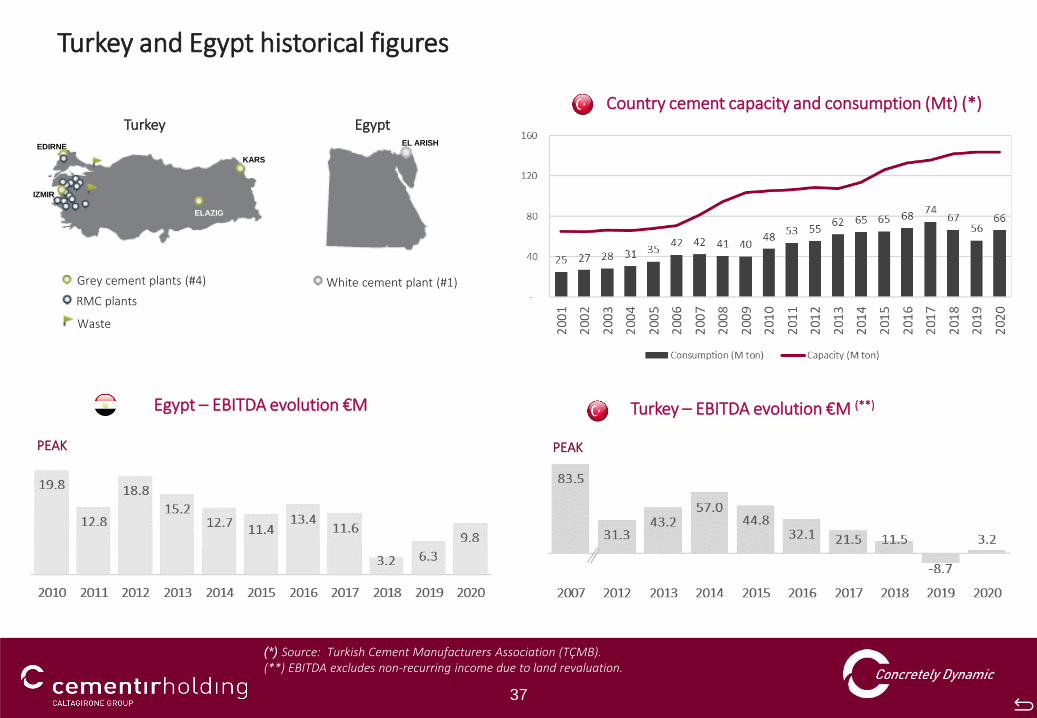
37
White cement plant (#1)Grey cement plants (#4)
RMC plants
Waste
Turkey Egypt
Turkey and Egypt historical figures
Turkey – EBITDA evolution €M (**)Egypt – EBITDA evolution €M
Country cement capacity and consumption (Mt) (*)
(*) Source: Turkish Cement Manufacturers Association (TÇMB).(**) EBITDA excludes non-recurring income due to land revaluation.
PEAKPEAK
KARS
ELAZIG
IZMIR
EDIRNEEL ARISH
38
•This presentation has been prepared by and is the sole responsibility of Cementir Holding N.V. (the“Company”) for the sole purpose described herein. In no case may it or any other statement (oral orotherwise) made at any time in connection herewith be interpreted as an offer or invitation to sell orpurchase any security issued by the Company or its subsidiaries, nor shall it or any part of it nor the fact ofits distribution form the basis of, or be relied on in connection with, any contract or investment decision inrelation thereto. This presentation is not for distribution in, nor does it constitute an offer of securities forsale in Canada, Australia, Japan or in any jurisdiction where such distribution or offer is unlawful. Neitherthe presentation nor any copy of it may be taken or transmitted into the United States of America, itsterritories or possessions, or distributed, directly or indirectly, in the United States of America, its territoriesor possessions or to any U.S. person as defined in Regulation S under the US Securities Act 1933 asamended.
•The content of this document has a merely informative and provisional nature and is not to be construedas providing investment advice. The statements contained herein have not been independently verified. Norepresentation or warranty, either express or implied, is made as to, and no reliance should be placed on,the fairness, accuracy, completeness, correctness or reliability of the information contained herein. Neitherthe Company nor any of its representatives shall accept any liability whatsoever (whether in negligence orotherwise) arising in any way in relation to such information or in relation to any loss arising from its use orotherwise arising in connection with this presentation. The Company is under no obligation to update orkeep current the information contained in this presentation and any opinions expressed herein are subjectto change without notice. This document is strictly confidential to the recipient and may not be reproducedor redistributed, in whole or in part, or otherwise disseminated, directly or indirectly, to any other person.
•The information contained herein and other material discussed at the presentation may include forward-looking statements that are not historical facts, including statements about the Company’s beliefs andcurrent expectations. These statements are based on current plans, estimates and projections, and projectsthat the Company currently believes are reasonable but could prove to be wrong. However, forward-looking statements involve inherent risks and uncertainties. We caution you that a number of factors couldcause the Company’s actual results to differ materially from those contained or implied in any forward-looking statement. Such factors include but are not limited to: trends in company’s business, its ability toimplement cost-cutting plans, changes in the regulatory environment, its ability to successfully diversify andthe expected level of future capital expenditures. Therefore, you should not place undue reliance on suchforward-looking statements. Past performance of the Company cannot be relied on as a guide to futureperformance. No representation is made that any of the statements or forecasts will come to pass or thatany forecast results will be achieved.
•By attending this presentation or otherwise accessing these materials, you agree to be bound by theforegoing limitations.
Investor Relations:
Phone +39 06 32493305
Email [email protected]
Web Address:
www.cementirholding.com
2021 Financial Calendar:
9 March Full year 2020 Results
21 April AGM
13 May First Quarter Results
28 July First Half Results
11 November Nine Months Results
Disclaimer and Other information
Stock listing information:
Milan Stock Exchange
Ticker: CEMI.IM (Reuters)
Ticker: CEM.IM (Bloomberg)
Registered Office:
Zuidplein 361077 XV – Amsterdam, The Netherlands