characterization of used oil in stormwater runoff in ... · pdf filecharacterization of used...
TRANSCRIPT

CHARACTERIZATION OF USED OIL IN STORMWATER RUNOFF IN CALIFORNIA
SEPTEMBER 2006
Joan E. Denton, Ph.D., Director Office of Environmental Health Hazard Assessment California Environmental Protection Agency

-i-
CHARACTERIZATION OF USED OIL IN STORMWATER RUNOFF IN CALIFORNIA
PREPARED BY California Environmental Protection Agency
Office of Environmental Health Hazard Assessment (OEHHA) Integrated Risk Assessment Branch (IRAB)
Linda Mazur Carmen Milanes Karen Randles Chuck Salocks
REVIEWED BY Val F. Siebal, Chief Deputy Director, OEHHA
George V. Alexeeff, Deputy Director for Scientific Affairs, OEHHA David M. Siegel, Chief, OEHHA/IRAB
ACKNOWLEDGMENTS OEHHA staff wish to thank the following for their contributions to, and/or review of, this report:
Jennifer Bitting, Central Coast Regional Water Quality Control Board Bob Boughton, Department of Toxic Substances Control Suhas Chakraborty, Colorado River Basin Regional Water Quality Control Board Kristie Chung, Los Angeles Regional Water Quality Control Board Leo Cosentini, State Water Resources Control Board Brian Currier, Office of Water Programs, California State University, Sacramento Robert Erlich, Lahontan Regional Water Quality Control Board Douglas Feay, Lahontan Regional Water Quality Control Board Tony Felix, San Diego Regional Water Quality Control Board Bruce Fujimoto, State Water Resources Control Board Fred A. Gonzales, Los Angeles County Department of Public Works Jatin Khandwala, Central Valley Regional Water Quality Control Board John Merrifield, Los Angeles County Department of Public Works Kevin Oertel, Central Coast Regional Water Quality Control Board Vic Pal, San Francisco Bay Regional Water Quality Control Board Michael Roth, Santa Ana Regional Water Quality Control Board John Short, North Coast Regional Water Quality Control Board Ejigu Solomon, Los Angeles Regional Water Quality Control Board Dana Stokes, California Integrated Waste Management Board Kristin Yee, California Integrated Waste Management Board

TABLE OF CONTENTS
EXECUTIVE SUMMARY ............................................................................................. iii
1.0 INTRODUCTION...................................................................................................... 1 1.1 APPROACH ................................................................................................................ 1
2.0 USED OIL IN RUNOFF: ENVIRONMENTAL AND HUMAN IMPACTS...... 2 2.1 SOURCES OF USED OIL IN RUNOFF.............................................................................. 2 2.2 CONSTITUENTS OF CONCERN ..................................................................................... 3 2.3 FATE AND TRANSPORT IN SURFACE WATERS.............................................................. 4 2.4 ADVERSE EFFECTS OF USED OIL IN RUNOFF ............................................................... 5
3.0 MEASURING OIL AND GREASE IN STORMWATER RUNOFF ................... 6
3.1 STORMWATER DISCHARGES: REGULATORY BACKGROUND....................................... 6 3.2 FACTORS AFFECTING POLLUTANT LEVELS IN STORMWATER RUNOFF......................... 7 3.3 STORMWATER RUNOFF SAMPLING ........................................................................... 10 3.4 ANALYTICAL METHODS........................................................................................... 10 3.5 SOURCES OF UNCERTAINTY IN STORMWATER MONITORING DATA ........................... 11
4.0 A REVIEW OF OIL AND GREASE DATA REPORTED ................................. 12 4.1 OIL AND GREASE IN RUNOFF FROM DISCRETE SOURCES ........................................... 12
4.1.1 Parking lots..................................................................................................... 12 4.1.2 Highways......................................................................................................... 17 4.1.3 Industrial facilities .......................................................................................... 20
4.2 OIL AND GREASE IN RUNOFF FROM URBAN CATCHMENTS ........................................ 23 4.3 OIL AND GREASE IN DISCHARGES INTO RECEIVING WATERS .................................... 26 4.4 ECOLOGICAL AND HUMAN HEALTH CONSIDERATIONS ............................................. 27
5.0 OIL AND GREASE LOADING ESTIMATES..................................................... 27 5.1 METHODOLOGY....................................................................................................... 28 5.2 ANNUAL OIL AND GREASE MASS LOADING ESTIMATES: LOS ANGELES COUNTY..... 29
5.2.1 Input data ........................................................................................................ 31 5.2.2 Mass loading calculations .............................................................................. 32 5.2.3 Estimated volume of used oil in runoff ........................................................... 33
5.3 ESTIMATED OIL AND GREASE LOADING STATEWIDE................................................. 34 5.4 UNCERTAINTY ANALYSIS ........................................................................................ 35 5.5 COMPARISON WITH OTHER LOADING ESTIMATES..................................................... 36
5.5.1 Storm-specific loadings................................................................................... 36 5.5.2 Oil and grease loading estimates from other studies...................................... 37
6.0 FINDINGS................................................................................................................ 37
REFERENCES................................................................................................................ 42
-i-

APPENDICES Appendix A Stormwater Runoff: Regulatory Background Appendix B California Industrial Stormwater Discharges Appendix C Annual Runoff Volume, Los Angeles County Watersheds Appendix D Estimated Mass Loading Calculations for Los Angeles County Watersheds LIST OF FIGURES Figure 1. Combined vs. separate storm sewer systems draining an urban watershed ....... 8 Figure 2. Stormwater monitoring..................................................................................... 16 Figure 3. Oil and grease concentrations in highway runoff, frequency distribution ....... 19 Figure 4. Oil and grease data from Annual Report for Storm Water Discharges
Associated with Industrial Activities............................................................... 22 Figure 5. Oil and grease data from the National Stormwater Quality Database.............. 25 Figure 6. Los Angeles County’s watersheds.................................................................... 30 Figure 7. Estimated annual oil and grease loadings, Los Angeles County watersheds ... 33 LIST OF TABLES Table 1. Oil spill observation glossary ............................................................................. 4 Table 2. Reported oil and grease concentrations (mg/l) from selected studies. ............. 13 Table 3. Summary of oil and grease (O&G) data from Annual Report for Storm Water
Discharges Associated with Industrial Activities ............................................. 21 Table 4. Oil and grease concentrations by land use category (as of mid-2003) from the
National Stormwater Quality Database............................................................ 25 Table 5. Reported annual mean concentrations for oil and grease in Los Angeles
County, 1994-2005........................................................................................... 28 Table 6. Total runoff volume reported for the mass emission/stream gaging stations,
Los Angeles County ......................................................................................... 31 Table 7. Estimated annual oil and grease loadings, Los Angeles County watersheds ... 32 Table 8. Estimated annual volume of used oil in runoff, Los Angeles
County watersheds ........................................................................................... 34 Table 9. Estimated annual oil and grease loadings, statewide........................................ 35 Table 10. Oil and grease loadings for monitored events, compared to estimated loadings
for average runoff year. .................................................................................... 36
-ii-

EXECUTIVE SUMMARY Runoff from urban areas has been identified as one of the leading sources of water quality impairment of the nation’s surface waters, having been associated with changes in flow, increased sedimentation, higher water temperature, lower dissolved oxygen, degradation of aquatic habitat structure, loss of fish and other aquatic populations, and decreased water quality. This runoff is the primary transport system moving pollutants from the landscape to wetlands, streams, lakes and coastal waters. Although the effects of runoff on specific waters vary and are often not fully assessed, pollutants carried by runoff are known to have potentially harmful effects on drinking water supplies, recreation, fisheries, and wildlife. Among the pollutants in runoff are oil and oil byproducts, which are known to contain harmful constituents such as metals and polycylic aromatic hydrocarbons (PAHs). The extent by which these materials are polluting stormwater runoff and the ultimate receiving waters is largely unknown. In this report, the Office of Environmental Health Hazard Assessment (OEHHA) reviews stormwater monitoring data for the purpose of characterizing used oil pollution in stormwater runoff. Stormwater runoff refers to water transported through stormwater conveyance systems during and after storm events. In 2004, about 58 percent of the 150 million gallons of lubricating oil sold in California was recycled; about 20 to 40 percent is assumed to be combusted or leaked as a result of use. Additionally, about 150 million gallons of industrial oil were sold, of which 33 million gallons (22 percent of volume sold) were recycled. Used oil that is leaked, spilled or improperly disposed of can be carried in stormwater runoff, eventually entering and threatening the environmental health of receiving water bodies. It has been reported that petroleum hydrocarbons in urban runoff as well as in aquatic sediment in urban areas are primarily associated with used crankcase oil. Monitoring conducted by municipalities and industrial facilities pursuant to stormwater regulatory programs (more specifically, the National Pollutant Discharge Elimination System or NPDES stormwater program) provides a major source of data on urban stormwater quality. Among the pollutants this monitoring quantifies is “oil and grease,” which is collectively regulated as a conventional water pollutant. Direct comparisons of the oil and grease concentrations reported by the studies reviewed in this report are problematic due to differences in sampling protocols, analytical methods, quality assurance/quality control processes, data analysis and other factors between studies. Nevertheless, qualitative conclusions can be drawn about relative patterns that are evident from the data. While the concentrations show considerable variability, typical concentrations are generally less than 5 milligrams per liter (mg/l), and seldom exceed 10 mg/l. In general, the highest oil and grease concentrations tend to be reported in runoff sampled from discrete sources (e.g., parking lots and industrial facilities) before dilution, partitioning, adherence to particulates, settling, and other fate processes occur. Among
-iii-

these discrete sources, higher oil and grease concentrations have been reported in runoff from industrial facilities than from highways and parking lots. While occasional “spiked” concentrations above 10 mg/l are reported for highways and parking lots, much higher levels in the thousands of mg/l have been reported for industrial facilities (in more recent years, maximum values have declined). Higher concentrations are often associated with industries whose operations involve vehicles, heavy equipment and engines, and petroleum product processing or use. These include transportation facilities, petroleum bulk stations, lubricating oil blenders and re-refiners, refuse industries, metal fabricators, and automobile dismantlers. Even with these industries, however, oil and grease concentrations show sporadic spikes, rather than consistently high levels. The occasional spikes may be the result of non-compliance with, or the ineffectiveness of engineering controls or best management practices. Monitoring designed to characterize runoff from catchment areas with a predominant land use indicates that oil and grease concentrations tend to be higher in commercial areas (i.e. retail and office buildings) compared to areas with other land uses. Mean concentrations as high as 13 mg/l have been reported for commercial areas, compared to mean values ranging from 0 to 0.9 mg/l for agricultural areas, which tend to have the lowest oil and grease concentrations. Oil and grease concentrations measured at mass emission monitoring stations (typically at outfalls to a receiving water body) by municipalities in Southern California were generally below 5 mg/l. In Los Angeles County, where watersheds ranged from the ultra-urban to the relatively undeveloped, annual mean oil and grease concentrations averaged over multiple years were very similar among all watersheds, although year-to-year variability within a watershed and differences between watersheds for certain years may be significant. Finally, oil and grease concentrations reported in earlier studies (from around the 1980s to early 1990s) tended to be higher than in more recent studies. A possible explanation for this may be that less crankcase oil has been leaking from more recent years’ vehicle fleets. Data for Los Angeles County were used for deriving crude estimates of annual oil and grease loadings – i.e., the amount of oil and grease discharged into receiving water bodies each year. A simple, screening level calculation was used to estimate annual loadings as the product of pollutant concentration and runoff volume. Oil and grease loadings were estimated to range from approximately 1.7 million pounds to 13 million pounds annually for Los Angeles County. These values correspond to approximately 0.23 million to 1.8 million gallons of used oil. Using these estimated values, total loadings Statewide were derived mathematically to range from 16 million to 120 million pounds. This roughly corresponds to 2.2 million to 16 million gallons of used oil, with 6.1 million gallons as the estimated volume for an average runoff year. These volumes are about 3 to 25 percent of the 64 million gallons of lubricating oil sold but not recycled (and about 1 to 9 percent of the 176 million gallons of lubricating and industrial oil sold but not recycled).
-iv-

It is difficult to establish the ecological and human health implications of the typical concentrations reported in runoff and the loading estimates for oil and grease. Numeric water quality criteria for aquatic life or human health protection have not been adopted for “oil and grease” for purposes of the Clean Water Act. However, numeric criteria for aquatic life protection have been established for some constituents found in used oil, i.e., arsenic, cadmium, chromium, lead, nickel and zinc (40 CFR 131.38). A screening level analysis performed by OEHHA showed that, at the typical oil and grease concentrations in runoff, these used oil constituents are likely to occur at concentrations up to five orders of magnitude lower than freshwater and saltwater aquatic life water quality criteria. Nevertheless, these constituents may pose a long-term risk to the aquatic ecosystem because of their tendency to accumulate in sediment over time. The ecological effects of used oil discharges in stormwater runoff entering receiving water bodies are influenced not only by individual constituents, but also by multiple factors, including the presence of other chemicals, the type and size of the receiving body, the frequency and duration of the discharge, the potential for dispersion, and the biological diversity of the receiving water ecosystem. Complex environmental processes acting on the oil, along with the highly variable nature of the used oil discharge, present a challenge in assessing the impacts of the discharge on the aquatic ecosystem. Human health impacts will depend upon whether or not exposures to constituents of concern occur from direct contact, ingestion of contaminated water or via the food chain. Studies linking adverse health effects in humans following exposure to used oil contaminants in the aquatic environment were not found. The relationship between the estimated loadings and the amount of used oil that is improperly disposed of cannot be established. However, the amount of used oil in stormwater runoff can more likely be attributed to leaks and spills from vehicle engines and other equipment, or from industrial activities, than incidents of illegal disposal. Further, the monitoring that yields mass emissions data is unlikely to capture episodic incidents of illegal disposal. OEHHA is unable to ascertain how close these estimates are to actual amounts of used oil in runoff being discharged into receiving water bodies. There is considerable uncertainty in the estimate, given limitations relating to how close the concentrations in the samples represent actual concentrations of the pollutant, the inability of the commonly used analytical method to distinguish between petroleum-based hydrocarbons and biological lipids, and the appropriateness of extrapolating statewide loadings from estimates derived for a single county. In the absence of a more refined analysis, however, these estimates can be used as a baseline for planning and mitigation purposes.
-v-

1.0 Introduction Stormwater runoff is the primary transport system moving pollutants from the landscape to wetlands, streams, lakes and coastal waters. Runoff from urban areas has been identified as one of the leading sources of water quality impairment of the nation’s surface waters. Problems associated with runoff include changes in flow, increased sedimentation, higher water temperature, lower dissolved oxygen, degradation of aquatic habitat structure, loss of fish and other aquatic populations, and decreased water quality due to increased levels of nutrients, metals, hydrocarbons, bacteria, and other constituents (U.S. EPA, 2005a). Although the effects of runoff on specific waters vary and are often not fully assessed, pollutants carried by runoff are known to have potentially harmful effects on drinking water supplies, recreation, fisheries, and wildlife (U.S. EPA, 2006). The Office of Environmental Health Hazard Assessment (OEHHA) has conducted an evaluation of information on the presence of used oil in stormwater runoff in California; the presence of oil and oil byproducts is of concern because these materials are known to contain harmful constituents such as metals and polycylic aromatic hydrocarbons. Stormwater runoff, for purposes of this report, refers to water transported through stormwater conveyance systems during and after storm events. The California Integrated Waste Management Board (CIWMB) reports that in 2004, approximately 150 million gallons of lubricating oil were sold in California, and about 87 million gallons were recycled; similarly, about 145 million gallons of industrial oil were sold, of which approximately 33 million gallons were recycled (CIWMB, 2006). About 20 to 40 percent of the lubricating oil sold is assumed to be combusted or leaked as a result of use. Improper disposal of used oil down storm drains, into lakes or rivers, or with garbage may also occur (CIWMB, 2003). Used oil that is leaked, spilled or improperly disposed of can be carried in stormwater runoff, eventually entering and threatening the environmental health of receiving water bodies. The extent by which used oil and oil byproducts are polluting stormwater runoff and the ultimate receiving waters is largely unknown. Monitoring studies report oil concentrations in runoff from highways, industrial facilities and at the base of watersheds. Models have been developed to estimate pollutant loadings in stormwater runoff. In this report, OEHHA utilizes existing stormwater monitoring data to characterize sources of oil and grease released in stormwater runoff, typical concentrations found in stormwater runoff, and approximate amounts entering California’s surface waters via runoff. 1.1 Approach OEHHA searched for runoff monitoring data for lubricating oil, industrial oil, and used oil. Information sources included peer-reviewed publications; State, local and federal reports; and discussions with staff at the State Water Resources Control Board (SWRCB), Regional Water Quality Control Boards (RWQCBs), the California
-1-

Department of Transportation (Caltrans) and other entities. It was found that hydrocarbon compounds in stormwater are typically measured as “oil and grease,” which can include animal fats, vegetable oils, soaps, and other biological oils, in addition to petroleum constituents. OEHHA thus compiled data on oil and grease, and evaluated these in order to select the datasets most appropriate for characterizing oil and grease pollution in California stormwater. OEHHA also reviewed models currently used to estimate pollutant loadings in stormwater, or the mass of a contaminant carried in stormwater discharges into a receiving water body per unit of time. OEHHA applied a simple model to estimate oil and grease annual loads for Los Angeles County watersheds. These watersheds represent a wide range of land use characteristics – from “ultra-urban” to predominantly undeveloped. Pollutant loading estimates were calculated for minimum, average and maximum runoff volumes to reflect the variability in runoff amounts from year to year. A “unit load” of oil and grease in urban runoff was calculated in order to extrapolate to a statewide loading associated with urban areas. Comparisons were made with other oil and grease loading studies to determine how close the estimates in this report are to the loading estimates derived by other investigators. 2.0 Used Oil in Runoff: Environmental and human impacts 2.1 Sources of used oil in runoff Petroleum hydrocarbons in urban runoff from different land use sites have been reported to be primarily associated with used crankcase oil (Latimer et al., 1990). This determination was based on laboratory analysis of hydrocarbons and the polycyclic aromatic hydrocarbons or PAHs they contain (the latter, referred to as the “PAH signature,” was used to discriminate between virgin and used crankcase oils). The investigators found that the particulates in runoff were considerably enriched in crankcase oil compared to street dust, roadside soil and vegetation, and atmospheric deposition. One possible explanation for this is that the oil may be derived from wash-off of crankcase oil deposited by cars in the center of the travel lanes and/or direct dumping of oil down storm drains. Another study (Brown, et al., 1985) characterized stormwater runoff and subsequent hydrocarbon distribution in receiving waters and sediments as part of the City of Tampa’s Nationwide Urban Runoff Program. The hydrocarbon characterization of suspended particulate matter and sediments from Hillsborough Reservoir, River and Bay showed a dominance of crankcase oil-like material. The fact that the type of petroleum found in sediment (crankcase oil) very closely resembles that found in stormwater runoff strongly implicates runoff as the primary source of sediment contamination. While the amount of oil leaked from vehicles is not known, one model developed in New Zealand estimates the rate of oil lost to roadways to be 2.8 ml of lubricating oil per 1,000 kilometers driven for cars and light commercial vehicles, and 2.1 ml per 1,000 kilometers for most buses (Ministry of Transport, 2002). Based on the oil loss rate
-2-

for cars and light commercial vehicles and using the number of vehicle miles traveled in 2004 (Caltrans, 2004a), an estimated 210,000 gallons of lubricating oil per year may be leaked onto State highways*. This may be an overestimate, since New Zealand’s fleet appears to be older – and thus more prone to leak -- than California’s: the median age of New Zealand cars is about 10 years, compared to 5 years for California. (Ministry of Transport, 2004; DOF, 2004a). Other sources of oil and grease in runoff include hydraulic fluid leaks from vehicles, and lubricant leaks from construction, farm and other off-road or heavy equipment. In addition, oils used in industrial processes may be discharged into storm drains, particularly when “best management practices” (BMPs) are not followed. BMPs are runoff control practices designed to reduce the pollutants contained in discharges to the storm drain system and/or receiving waters. Finally, the illegal disposal of used oil into storm drains may still occur when motor oil is changed by “do-it-yourselfers.” 2.2 Constituents of concern Crankcase oil consists primarily of a base lubricating oil with variable chemical composition, depending on the source of the crude oil and processes used during refining. Lubricating oil is a heavy end distillate of crude oil containing straight chain and branched alkanes (approximately 45 percent of total hydrocarbons), cycloalkanes (approximately 30 percent) and aromatic hydrocarbons (approximately 25 percent) (Potter and Simmons, 1998). Very small amounts of PAHs are present in newly refined lubricating oil. Various additives comprise 10 to 20 percent of the volume of finished lubricating oil. These additives may contain zinc, magnesium, molybdenum, phosphorus, sulfur and bromine compounds (U.S. EPA, 1984). Used crankcase oil contains, in addition to the complex mixture of hydrocarbons and additives present in the formulated product, contaminants associated with its use as an engine lubricant. Sources of contamination include additive breakdown products (e.g., metals); engine “blow-by” (i.e., material which leaks from the engine combustion chamber into the crankcase where the oil resides); burnt oil, metal particles from engine wear; and incomplete products of combustion of gasoline (U.S. EPA, 1984). Used oil contains small amounts of arsenic, cadmium, chromium, lead and nickel. These substances have been shown to produce acute and chronic toxicity in aquatic organisms at extremely low levels (U.S. EPA, 2000a). In addition, these substances have been associated with a wide range of toxic effects in humans, including death following ingestion of large doses, cancer, and skin irritation. Used motor oil can become “enriched” with PAHs during the operation of an automobile engine. These contaminants concentrate in lubricating oil via transfer from gasoline or diesel fuel as combustion products (Pruell and Quinn, 1988). In one study, total PAH concentrations increased until about 4,000 miles to 14.5 milligrams per gram used oil
* Oil loss rate: 2.8 ml/1,000 km;
Vehicle miles traveled (VMT) statewide in 2004: 180,153 million miles [2.8ml/1,000km]*[1,000km/621miles]*180,153,000,000miles*0.00026gallons/ml = 211,000 gallons
-3-
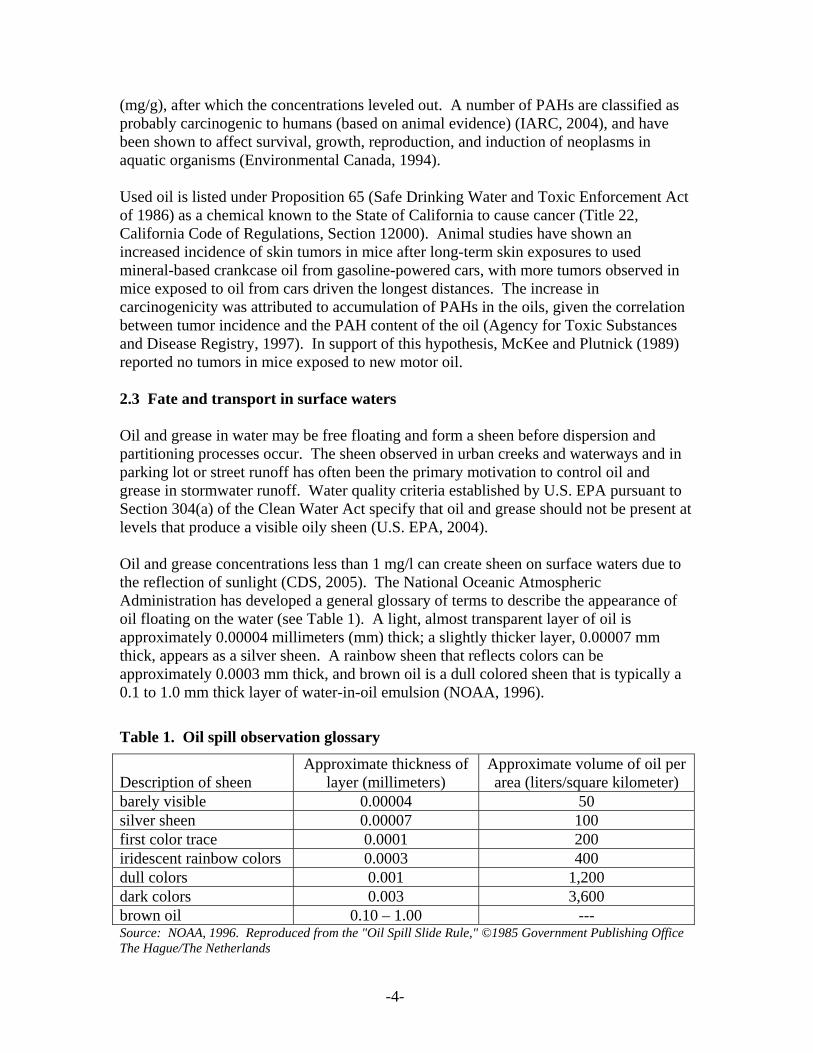
(mg/g), after which the concentrations leveled out. A number of PAHs are classified as probably carcinogenic to humans (based on animal evidence) (IARC, 2004), and have been shown to affect survival, growth, reproduction, and induction of neoplasms in aquatic organisms (Environmental Canada, 1994). Used oil is listed under Proposition 65 (Safe Drinking Water and Toxic Enforcement Act of 1986) as a chemical known to the State of California to cause cancer (Title 22, California Code of Regulations, Section 12000). Animal studies have shown an increased incidence of skin tumors in mice after long-term skin exposures to used mineral-based crankcase oil from gasoline-powered cars, with more tumors observed in mice exposed to oil from cars driven the longest distances. The increase in carcinogenicity was attributed to accumulation of PAHs in the oils, given the correlation between tumor incidence and the PAH content of the oil (Agency for Toxic Substances and Disease Registry, 1997). In support of this hypothesis, McKee and Plutnick (1989) reported no tumors in mice exposed to new motor oil. 2.3 Fate and transport in surface waters Oil and grease in water may be free floating and form a sheen before dispersion and partitioning processes occur. The sheen observed in urban creeks and waterways and in parking lot or street runoff has often been the primary motivation to control oil and grease in stormwater runoff. Water quality criteria established by U.S. EPA pursuant to Section 304(a) of the Clean Water Act specify that oil and grease should not be present at levels that produce a visible oily sheen (U.S. EPA, 2004). Oil and grease concentrations less than 1 mg/l can create sheen on surface waters due to the reflection of sunlight (CDS, 2005). The National Oceanic Atmospheric Administration has developed a general glossary of terms to describe the appearance of oil floating on the water (see Table 1). A light, almost transparent layer of oil is approximately 0.00004 millimeters (mm) thick; a slightly thicker layer, 0.00007 mm thick, appears as a silver sheen. A rainbow sheen that reflects colors can be approximately 0.0003 mm thick, and brown oil is a dull colored sheen that is typically a 0.1 to 1.0 mm thick layer of water-in-oil emulsion (NOAA, 1996).
Table 1. Oil spill observation glossary
Approximate thickness of layer (millimeters)
Approximate volume of oil per area (liters/square kilometer) Description of sheen
barely visible 0.00004 50 silver sheen 0.00007 100 first color trace 0.0001 200 iridescent rainbow colors 0.0003 400 dull colors 0.001 1,200 dark colors 0.003 3,600 brown oil 0.10 – 1.00 --- Source: NOAA, 1996. Reproduced from the "Oil Spill Slide Rule," ©1985 Government Publishing Office The Hague/The Netherlands
-4-

In general, when oil comes into contact with water, a partitioning of various volatile compounds, PAHs and metals takes place. Depending on their chemical and physical characteristics, the various constituents are subjected to several fate processes, including volatilization, sinking, emulsification, agglomeration, photodegradation and biodegradation (ATSDR, 1997). Investigators have reported 81 to 96 percent of the hydrocarbon load in stormwater runoff is attached to particulates, indicating that adsorption to particles is the primary method of pollutant transport (Stenstrom et al., 1984). During a rainfall, the particulates are washed into storm drains and may attach to matter and settle or eventually deposit in receiving water sediments. Concentrations of oil and grease and heavy metals are generally higher in the smaller particulate fractions (Barrett et al., 1995). These finer grains have lower settling velocities and remain in runoff longer than larger grains. Schueler et al. (1994) reported that the bottom sediments of many small, highly urbanized estuaries are heavily contaminated with PAHs and metals and that runoff from urban hydrocarbon hotspots (e.g., gas stations, parking lots) appears to be a major contributing factor. Certain constituents of used oil, notably the PAHs and metals, have a tendency to accumulate in sediments and enter into the food chain. Since PAHs and metals enter waterways as a result of many human activities (e.g., combustion of fossil fuels followed by deposition of particles on watersheds and waterways), it is difficult to apportion the presence of these contaminants in aquatic sediments to a particular source (e.g., used oil in stormwater runoff). 2.4 Adverse effects of used oil in runoff Petroleum constituents in stormwater runoff pose a subtle but continuous threat to aquatic ecosystems. Much of what is known about the impacts of petroleum hydrocarbons in the aquatic environment comes from studies of catastrophic oil spills and chronic seeps (e.g., leaking pipelines) (NRC, 2003). Field and laboratory evidence have demonstrated both acute lethal toxicity and long-term sublethal toxicity of petroleum products to aquatic organisms. The long-term sublethal effects of oil pollution refer to interferences with cellular and physiological processes such as feeding and reproduction which do not lead to immediate death of the organism (U.S. EPA, 1986). A literature review conducted for the U.S. Geological Survey and the U.S. Department of Transportation (Buckler and Granato, 1999) of the biological effects of highway runoff on local ecosystems revealed numerous information gaps. It appears that the use of different methods from one study to another and a lack of adequate documentation preclude making quantitative comparisons among different studies. However, the authors stated that the available data indicate that constituents from highway runoff and from highway runoff sediments deposited in nearby receiving waters are found in the tissues of aquatic biota, which may affect the diversity and productivity of biological communities.
-5-
While the effects of oil and petroleum products have been unambiguously established in laboratory studies and after well-studied spills, determining the more subtle long-term effects on populations, communities and ecosystems at low doses and in the presence of other contaminants pose significant scientific challenges. The effects of a petroleum release are a complex function of the rate of release, the nature of the petroleum, and the local physical and biological character of the exposed ecosystems. Ecotoxicological responses are driven by the dose of petroleum hydrocarbons available to an organism, not the amount of petroleum released into the environment. Because of the complex environmental processes acting on the released petroleum, dose is rarely directly proportional to the amount released (NRC, 2003). Given these considerations, the ecological impacts of used oil in runoff discharges into receiving waters are difficult to establish. Because “oil and grease” is not a definitive chemical category, and includes myriad organic compounds with varying physical, chemical and toxicological properties, U.S. EPA has not set numeric water quality criteria for oil and grease. For aquatic life protection, U.S. EPA specifies a level that is “0.01 of the lowest continuous flow 96-hour LC50 to several important freshwater and marine species, each having a demonstrated susceptibility to oils and petrochemicals.” (The “LC50” is the concentration that is lethal for 50 percent of the test organisms.) U.S. EPA also specifies that surface waters be virtually free from floating oils (U.S. EPA, 1986). The California Toxics Rule (40 CFR 131.38) specifies numeric criteria for aquatic life protection in freshwater and saltwater for some of the constituents of concern found in used oil (i.e., arsenic, cadmium, chromium, nickel, lead and zinc). The potential human health impacts from used oil present in stormwater runoff are likewise difficult to estimate. Individual chemical constituents in petroleum products are known to be toxic to humans under certain exposure conditions: some of the PAHs and metals present in lubricating oil have been shown to be carcinogenic in animal studies and the adverse noncancer health effects of these and other constituents are well characterized. A major concern is that these petroleum constituents can deposit in aquatic sediments and enter tissues of invertebrates and fish. While fish are able to metabolize and eliminate PAHs, human ingestion of mollusks and other aquatic invertebrates that are unable to metabolize PAHs efficiently can represent a potential exposure route (ATSDR, 1995). Studies linking adverse health effects in humans following exposure to used oil contaminants in the aquatic environment have not been found. 3.0 Measuring Oil and Grease in Stormwater Runoff 3.1 Stormwater discharges: Regulatory background Much of the published stormwater data have been generated to comply with water quality regulations. Among the regulated pollutants is “oil and grease” (40 CFR 401.16).
-6-

-7-
Since 1990, most stormwater discharges have been considered point sources that are subject to permit requirements pursuant to the National Pollutant Discharge Elimination System (NPDES) program (U.S. EPA, 1990). NPDES regulations are promulgated by the U.S. Environmental Protection Agency (U.S. EPA). In California, the NPDES Program is administered by the State Water Resources Control Board and the nine Regional Water Quality Control Boards (SWRCB, 2005a, b). The NPDES stormwater permit regulations cover stormwater discharges from:
municipal separate storm sewer systems (MS4s) in urbanized areas (An MS4 consists of a conveyance or system of conveyances -- including roads with drainage systems, municipal streets, catch basins, curbs, gutters, ditches, man-made channels, or storm drains -- designed for collecting and conveying stormwater, which is not a combined sewer nor part of a publicly owned treatment works, and which is owned or operated by a state or local government entity (see Figure 1) (40 CFR 122.26(b)(8)).);
industrial facilities in any of the 11 categories that discharge to an MS4 or to waters of the United States; and,
construction activity that disturbs land areas of one or more acres. (U.S. EPA, 2003)
Details on the NPDES stormwater program can be found in Appendix A. 3.2 Factors affecting pollutant levels in stormwater runoff Many factors influence the quality of stormwater runoff. Complex interactions between these variables obscure simple correlations between individual variables and water quality (Barrett et al, 1995). Pollutant concentrations in stormwater exhibit a high degree of variability, not only between storms, but also within a storm. Among the major factors affecting stormwater quality is precipitation. Variations in rainfall intensity (the depth of precipitation per unit time) influence runoff rate, pollutant washoff rate and transport, sediment deposition and re-suspension, and other physical factors that collectively determine pollutant concentrations and stormwater flow rate at a given monitoring location at a given point in time. In addition, the time interval between storm events (often measured in terms of the antecedent dry period) has been shown to greatly influence levels of pollutants in runoff. (U.S. EPA, 2002)

-8-
Figure 1. Combined vs. separate storm sewer systems draining an urban watershed
(Source: GAO, 2001)

Typically, the major load of total pollutants occurs shortly after the onset of a rain event. When a disproportionately higher pollutant load is associated with discharge from the first portion of a storm event, a “first flush” is said to occur; a seasonal first flush occurs when the higher load is associated with the first storm of a season. Pollutants that accumulated on streets, gutters, and land between rain events are washed off and essentially “pulsed” into receiving waters via storm drains. A seasonal first flush phenomenon may be especially pronounced in areas of California, where there is little or no rainfall from May through September. This rainfall pattern creates a long period for pollutant build-up such that the initial storm of the rainy season may have higher pollutant concentrations than in later events (Lee et al., 2005). The size of the drainage area appears to influence the occurrence of a first flush. In a large watershed, where stormwater is transported over large distances and pollutants diluted, first flushes are much less likely to occur. In contrast, smaller, discrete areas, particularly those with a high degree of imperviousness, are more likely to exhibit first flush. For example, first flush has been demonstrated for highway catchments (Stenstrom and Kayhanian, 2005) and parking lots (Tiefenthaler, et al., 2001). Tiefenthaler, et al. conducted a study of parking lot runoff generated by simulated rainfall in Long Beach, California. Runoff samples collected during the first 10 minutes of a rain event contained the highest constituent concentrations. Longer simulated storms appeared to dilute parking lot runoff and significantly lowered the average concentrations of most constituents. The geographic and physical characteristics of the watershed – including the type and intensity of land use, degree of imperviousness, tree cover, soil type, slope and drainage density -- are all important determining factors in the generation of nonpoint pollution (Brezonik and Stadelmann, 2002). With urban development, natural vegetated pervious ground cover is converted to impervious surfaces, which can neither absorb water nor remove pollutants. The increased volume, velocity and discharge duration of stormwater runoff from urbanized areas will transport greater amounts of pollutants into receiving waters. The type of stormwater conveyance system will also affect stormwater quality. For example, conventional curb and gutter systems provide a direct conduit to natural water bodies and may act to collect and concentrate pollutants. Alternatively, curb and gutter systems that empty into drainage swales will act to collect and filter runoff before it can enter underground drainage systems (BASMAA, 1999). Potential sources and activities releasing pollutants into stormwater runoff are closely related to land use in the watershed. For example, pollutant concentrations have been shown to increase with higher traffic levels (Caltrans, 2004b). The often transitory and unpredictable nature of many pollutant sources and release mechanisms (e.g., spills, vehicle-washing runoff, dumping) further contribute to variability in contaminant concentrations (U.S. EPA, 2002).
-9-

3.3 Stormwater runoff sampling Although stormwater runoff can result from pavement washing, irrigation and other activities (dry weather flows), this report evaluates oil and grease in stormwater resulting from wet weather events. Wet-weather sampling is critical in urban runoff pollution prevention and mitigation planning because most of the source loadings occur in wet weather (U.S. EPA, 1993). Wet-weather generated runoff can contribute large pulses of pollutant load and can make up a significant percentage of long-term pollutant loads from urban/suburban areas (Silverman et al., 1985). Stormwater regulations establish specific requirements for sampling, including when and where samples are to be collected, and the sample type and technique (i.e., manually or by automatic sampler) for collecting certain pollutants (U.S. EPA, 1992). “Sample type” refers to either “grab” or composite samples. A grab sample is a discrete, individual sample taken within a short period of time (usually less than 15 minutes). Analysis of grab samples characterizes the stormwater quality at a given time of the discharge. A composite sample is a mixed or combined sample that combines a series of individual and discrete samples of specific volumes at specific intervals. Composite samples characterize the quality of a stormwater discharge over a longer period of time, such as the duration of a storm event. When monitoring stormwater for oil and grease, a grab sample is generally collected, as required by U.S. EPA guidance. An automated composite sample is not appropriate because the oil and grease in combined samples tends to accumulate inside the tubing and other components of the sampling equipment. 3.4 Analytical methods Hydrocarbon compounds in stormwater are typically measured as “oil and grease,” with no differentiation between fractions (i.e., specific hydrocarbon components) (Strenstrom et al., 1985). The term generally refers to biological lipids and petroleum-based hydrocarbons, which have similar physical properties and solubility in organic solvents. Hence, oil and grease may include animal fats, soaps, vegetable oils, waxes, esters, and fatty acids in addition to petroleum constituents. The most common analytical method currently used for analyzing runoff for oil and grease is U.S. EPA Method 1664. This method is a liquid/liquid extraction (using normal-hexane), followed by mass determination by weight (gravimetry) for the quantitation of oil and grease in water (U.S. EPA, 1999; U.S. EPA, 2002). The method detection limit is 1.4 mg/l and the minimum level of quantitation is 5.0 mg/l. Most of the stormwater runoff monitoring studies evaluated for purposes of this effort reported detection limits of 5.0 mg/l; a few studies reported a detection limit of 1.0 mg/l. Another method used is U.S. EPA Method 413.1, which uses 1,1,2-trichloro-1,2,2-trifluoroethane (Freon-113) as the extraction solvent, and gravimetry (40 CFR 136.3).
-10-

In general, gravimetric methods are not as sensitive as more sophisticated instrumentation techniques because the more volatile constituents of oil and grease can be lost during the solvent evaporation stage of sample preparation. In an effort to better estimate the amounts of motor oil in stormwater runoff, some entities measure “total petroleum hydrocarbons (TPH) as motor oil” instead of oil and grease. For example, the Sacramento County Stormwater Quality Program recently began to monitor for various petroleum hydrocarbon fractions (Sacramento County, 2004). TPH concentrations may provide a more representative measure of the amount of petroleum-based compounds in stormwater than oil and grease concentrations. 3.5 Sources of uncertainty in stormwater monitoring data The primary sources of uncertainty associated with stormwater monitoring data lie in the methods used for sampling and analysis. The use of grab samples to determine concentrations of oil and grease in runoff (described in section 3.3) may not be representative of the runoff generated by that storm event. For example, if first flush effects are present, grab samples collected subsequent to the first flush flows will likely yield lower contaminant concentrations. Alternatively, a grab sample that captures peak concentrations represents an overestimation of the average concentration for the storm event. In a study by Tiefenthaler et al. (1999), the magnitude of within- and among-storm variability observed in frequent sampling of stormwater runoff demonstrated that representative oil and grease concentrations cannot be characterized by a limited number of samples. Storms that are monitored using a single grab sample, or wet seasons that are monitored by a single storm event, may not adequately characterize pollutant concentrations. The physical properties of oil and grease can influence its measurement in stormwater. Oil and grease tends to adhere to particles, litter and other materials, may accumulate and subsequently be released. A stormwater sample that captures this accumulated oil and grease will yield a concentration much larger than would otherwise be found. Given the limitations associated with grab samples, Stenstrom and Kayhanian (2005) have suggested the use of chemical oxygen demand (COD) and dissolved organic carbon (DOC) as more accurate surrogates for characterizing levels of oil and grease from highway stormwater runoff. The investigators found levels of COD and DOC to be highly correlated to oil and grease concentrations in highway runoff. Since COD and DOC samples are collected as automatic, composite samples, analytical results for these parameters more closely represent the entire storm event than a single or even multiple grab samples tested for oil and grease. As discussed in section 3.4, the analytical methods commonly used for oil and grease do not distinguish among various petroleum-based or biological oils and therefore do not specifically measure used oil. Hence, the concentrations of “oil and grease” reported may overestimate the amounts of petroleum-based oil. Researchers are seeking more reliable methods to quantify petroleum hydrocarbons in runoff and atmospheric particulates as a result from lubricating oil blowby from combustion sources. This
-11-
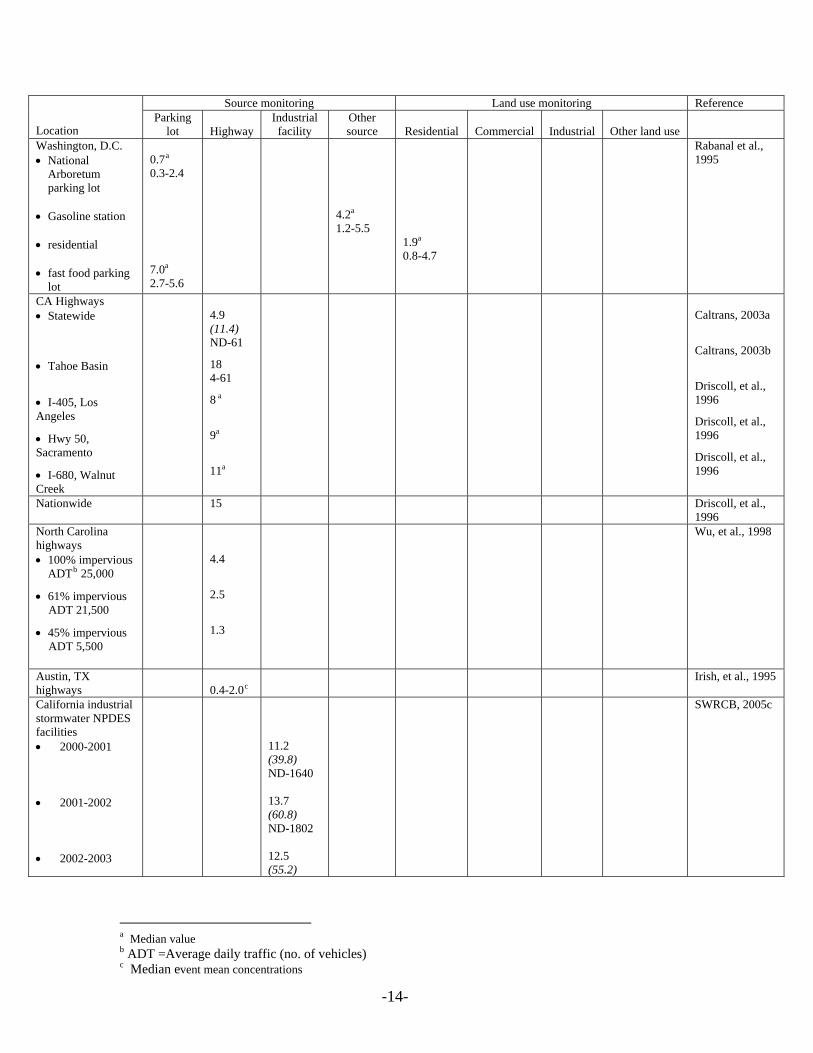
includes the use of “biomarker signature” chemicals, such as hopanes and steranes found in petroleum products derived from crude oil (Young, et al., 2004; Graham, et al. 2004). 4.0 A review of oil and grease data reported This section summarizes data on oil and grease levels reported in stormwater runoff from monitoring conducted pursuant to NPDES requirements, as well as from other studies. Table 2 is a compilation of the data reviewed in this section. Data are presented for: (1) monitoring of highways, parking lots and industrial facilities to characterize discrete sources of stormwater discharges; (2) monitoring of runoff from specific land uses in urban areas; and (3) monitoring of discharges into receiving waters. Figure 2 depicts the various types of monitoring that yielded these data. 4.1 Oil and grease in runoff from discrete sources Motor vehicles are important sources of oil and grease releases into the environment. Hence, areas or facilities where a large number of vehicles are regularly present, particularly over extended periods of time, are likely to be major contributors to oil and grease pollution in stormwater runoff. Parking lots and highways are examples of such areas. These areas are generally considered as continuous sources of oil and grease in runoff. Industrial facilities represent another discrete source of oil and grease, with certain types of industries more frequently associated with higher concentrations than others. The data indicate that industrial facilities can be associated with elevated but sporadic releases of oil and grease. 4.1.1 Parking lots Concentrations of oil and grease in stormwater runoff from parking lots can range from below detection to high “spiked” values. Parking lot data were found for commercial and retail establishments. An early study of oil and grease concentrations in runoff in Richmond, California (Strenstrom et al., 1984) found the highest concentrations to be associated with the parking lot of a large-scale commercial property with a department store (range 7.9 to 31.3 mg/l, mean = 16.1 mg/l). The concentration was four times higher than the sampling station in a residential area, which had the lowest concentration (see Table 2).
-12-

Table 2. Reported oil and grease concentrations (mg/l) from selected studies. The table lists mean concentrations (unless otherwise noted) and, when available, the standard deviation (italicized text in parentheses) and the range.
Source monitoring Land use monitoring Reference Location
Parking lot
Highway
Industrial facility
Other source
Residential
Commercial
Industrial
Other land use
Richmond, CA • Mouth of
watershed
• Trucking distribution center
• Large commercial parking
• Mixed residential/
commercial street and three service stations
• Residential
16.1 (7.6) 7.9-31.3
7.3 (2.4) 3.0-9.5
3.9 (4.5) 0.8-13.5
7.9 (4.7) 3.5-15.7 10.9 (2.4) 8.3-14.1
Strenstrom, et al., 1984
Los Angeles, CA • Office building
parking lot • Public park
parking lot • Metal recycler • Paper, glass
plastic and metal recycling facility
• School yard • Residence
driveway
1 (0.3) ND-2.0 5 (0.1) 1.5-5.1 26.8 (35.6) 1.6-52
210 (260) 29-390 6 (5) 2.2-48
2 (0.9) ND-3.6
LASGRWC, 2005
Alabama • Agriculture
• Light industrial
• Residential
• Low-traffic
commercial parking lot
• Moderate to high traffic parking lot
1.5 <1-3.8 0.3 <1-1.6
1.5 <1-4.8
9.5 <1-50.4
0 all <1
CERS, 2000
-13-
Source monitoring Land use monitoring Reference Location
Parking lot
Highway
Industrial facility
Other source
Residential
Commercial
Industrial
Other land use
Washington, D.C. • National
Arboretum parking lot
• Gasoline station • residential • fast food parking
lot
0.7a
0.3-2.4 7.0a
2.7-5.6
4.2a
1.2-5.5
1.9a
0.8-4.7
Rabanal et al., 1995
CA Highways • Statewide
• Tahoe Basin
• I-405, Los Angeles
• Hwy 50, Sacramento
• I-680, Walnut Creek
4.9 (11.4) ND-61
18 4-61
8 a
9a
11a
Caltrans, 2003a
Caltrans, 2003b
Driscoll, et al., 1996
Driscoll, et al., 1996
Driscoll, et al., 1996
Nationwide 15 Driscoll, et al., 1996
North Carolina highways • 100% impervious
ADTb 25,000
• 61% impervious ADT 21,500
• 45% impervious ADT 5,500
4.4
2.5
1.3
Wu, et al., 1998
Austin, TX highways
0.4-2.0c
Irish, et al., 1995
California industrial stormwater NPDES facilities • 2000-2001 • 2001-2002 • 2002-2003
11.2 (39.8) ND-1640 13.7 (60.8) ND-1802 12.5 (55.2)
SWRCB, 2005c
a Median value b ADT =Average daily traffic (no. of vehicles) c Median event mean concentrations
-14-

Source monitoring Land use monitoring Reference Location
Parking lot
Highway
Industrial facility
Other source
Residential
Commercial
Industrial
Other land use
ND-1664 Nationwide (U.S.)
8.01, 4.0a
3.9 a, 4.4a 4.7a, 5.0a 5.0, 4.5a
Open space, 1.3a Mixed open space, 6.0a
All land uses, 4.3a
ND–1,100
Pitt, et al., 2004
Fresno, CA Single dwelling: 3 (2.5) 1-8 Multiple-dwelling: 1.8 (1.2) <1-5
4.9 (6.5) ND-26
10.6 (19.9) ND-80
Oltmann, et al., 1987
Los Angeles County, CA
High-density single family residential 1.3
3.3
Light Industrial 1.7
Transportation3.1
LADPW, 2000 (Table 4-12)
Ventura County, CA 3.2, 4.7 5.7 2.5, 3.4 Agricultural 0.9
Ventura County, 2001
La Mirada, CA (2005)
ND-3.0 ND-2.9 ND-2.8 La Mirada, 2005
Texas (1993-1994) • Galveston Bay
National Estuary • Dallas- Fort
Worth • Corpus Christi
4.0 1.0 1.7
13.0 2.0 9.0
<1.0 3.0
Transportation0.4
Baird, et al., 1996
Long Beach • Mass emissions
22-27 Long Beach, 2002
Los Angeles • Mass emission
1.9-3.7 LADPW, 2005
San Diego, CA • Mass emission
1.4-4.3 San Diego, 2005
Ventura, CA 2.4-2.5 Ventura County, 2001 • Mass emission
1 Median value
-15-
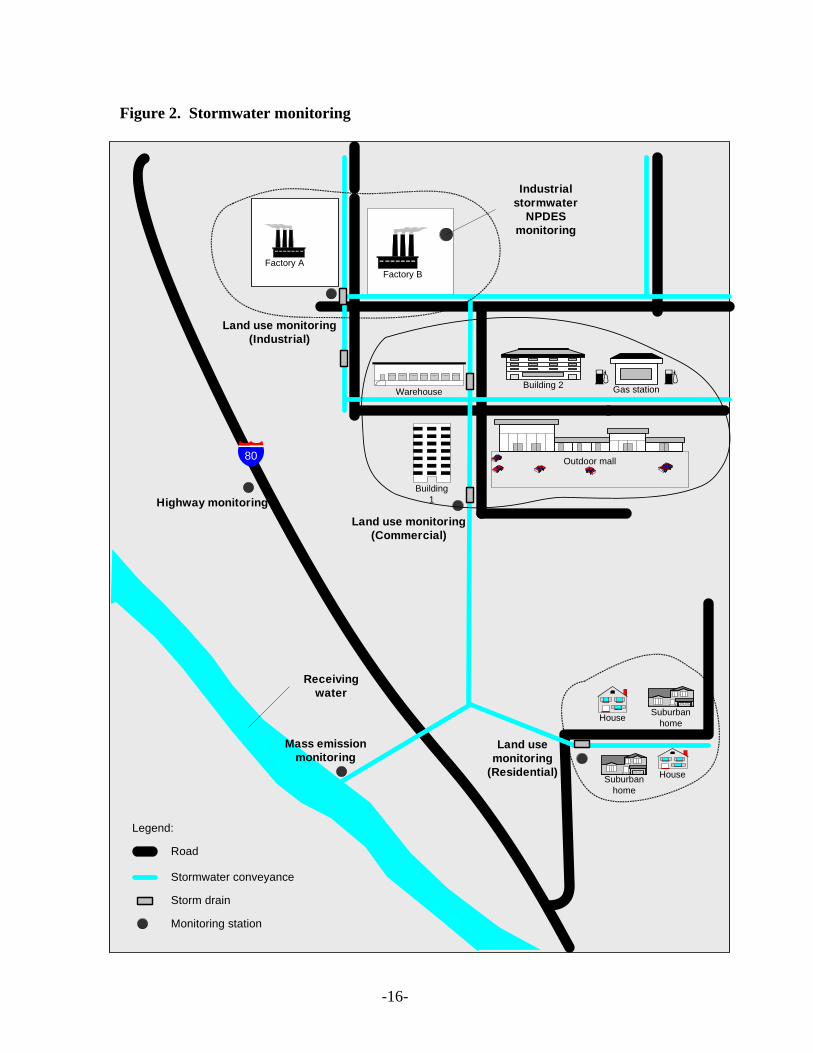
Figure 2. Stormwater monitoring
Factory B
Building1
Building 2Warehouse
Land use monitoring(Commercial)
Highway monitoring
Mass emissionmonitoring
Factory A
Outdoor mall80
Suburbanhome
Suburbanhome
Industrialstormwater
NPDESmonitoring
Land use monitoring(Industrial)
House
Gas station
House
Land usemonitoring
(Residential)
Receivingwater
Legend:
Road
Stormwater conveyance
Monitoring station
Storm drain
-16-

Stormwater runoff samples were collected over a four-year period at a schoolyard, commercial office building parking lot, public park parking lot, private residence driveway and two industrial sites at the detention basin inlets as part of the Los Angeles Basin Water Augmentation Study (LASGRWC, 2005). As shown in Table 2, the mean oil and grease concentration was lowest at the office building parking lot (1 mg/l), and highest at one of the industrial sites (210 mg/l at the metal recycler). The mean concentration at the public park parking lot was 5 mg/l, and at the driveway to the residence, an unusually high level (as can be seen from Table 2, concentrations reported for residential neighborhoods are typically below 5 mg/l) of 26.8 mg/l. In an Alabama study characterizing runoff from different types of urban and suburban catchments, oil and grease concentrations reported from parking lot runoff were below 5 mg/l (CERS, 2000). Samples were collected from 1997 to 1999 from an agricultural field, light industrial site storm drain, a residential subdivision and two commercial parking lots. The highest concentrations (over 50 mg/l) were detected at a location draining runoff from an area that included a rubber tire manufacturer. The relatively higher oil and grease levels found at this location may be related to the use of petroleum products at the tire facility. A study of urban stormwater runoff at four small catchments in the Washington, D.C. area was carried out in 1992-1993 (Rabanal, et al., 1995). The sampling locations included an office parking lot, a commercial fueling station, a fast food restaurant parking lot and a residential street (see Table 2). Median oil and grease concentrations were below 5 mg/l, except for the fast food parking lot (median = 7.0 mg/l). The authors noted that the higher concentrations at the fast food parking lot were likely due to the oil and grease used during food preparation from the solid waste handling area. 4.1.2 Highways Monitoring conducted by the California Department of Transportation (Caltrans) provides a major source of highway runoff data for the State. As part of its NPDES permit requirements, Caltrans conducts monitoring and research studies on the constituents of stormwater runoff from its facilities, their impacts on receiving water bodies and the effectiveness of best management practices. Caltrans facilities include highways, maintenance yards, park and ride lots, and construction sites. In addition to characterizing stormwater discharges statewide, Caltrans also conducts specialized studies that investigate specific aspects of stormwater quality, such as the effects of traffic congestion, differences in pollutant concentrations attributable to the first flush phenomenon, and stormwater toxicity (Caltrans, 2004b). In November 2003, Caltrans published the results of a comprehensive set of studies to characterize stormwater runoff from transportation facilities throughout the State. These discharge characterization studies included monitoring for oil and grease at certain sites. Oil and grease was detected in 29 percent of the 49 samples collected during the 2000/2001 to 2002/03 monitoring years. Among the samples in which oil and grease was detected, concentrations ranged from 5 to 61 mg/l; a mean of 4.95 mg/l was estimated for
-17-

all samples, including non-detects (i.e., samples for which laboratory analysis indicates that the constituent is not present) (Caltrans, 2003a). As shown in Figure 3, concentrations for about 90 percent of the samples were at or below 10 mg/l. Caltrans notes that transportation facilities with higher traffic levels produce higher pollutant concentrations in runoff than others with lower traffic levels. It was determined that annual average daily traffic (AADT) is one of the most significant factors affecting pollutant concentrations in runoff from transportation facilities, particularly highways and toll plazas. An analysis of Caltrans highway runoff data for 1997 to 2001 showed that the average concentration of oil and grease was strongly correlated with AADT (Kayhanian, et al., 2003). Oil and grease concentrations in highway runoff appear to show regional differences. Among the special studies conducted by Caltrans is a three-year study characterizing highway runoff in the Tahoe basin and assessing the effectiveness of sand traps in reducing pollutant concentrations. For the 27 samples collected, oil and grease concentrations ranged from 4 to 61 mg/l in untreated highway runoff, with a mean of 18 mg/l and a median of 12 mg/l (Caltrans, 2003b). As with over half of the monitored constituents, oil and grease levels in this study were typically higher than statewide levels. The study also found that concentrations from the low elevation sites (mean = 23 mg/l) were generally higher than from sites at high elevation -- i.e., over 200 vertical feet over Lake Tahoe (mean = 13 mg/l). Likewise, concentrations at urban sites (mean = 26 mg/l) were generally higher than at rural sites (mean = 14 mg/l). As part of the National Highway Runoff Data and Methodology Synthesis, the U.S. Geological Survey conducted a review of existing data (published in the 1970s to the mid-1990s) on semivolatile organic compounds (SVOCs) in highway runoff and urban stormwater, with particular emphasis on highway studies (Lopes and Dionne, 1998). Petroleum hydrocarbons, oil and grease, and polycyclic aromatic hydrocarbons in crankcase oil and vehicle emissions are the major SVOCs detected in highway runoff and urban stormwater. Four studies reported oil and grease concentrations in highway runoff ranging from 1 to 480 mg/l; two of the four studies reported mean values (3.65 and 16.05 mg/l).
-18-

Figure 3. Oil and grease concentrations in highway runoff, frequency distribution
Source: Caltrans, 2003 An earlier study by the Federal Highway Administration (FHWA) assembled monitoring data from 993 separate storm events at 31 highway runoff sites in 11 states (Driscoll, et al., 1990). The data were collected from various studies that were either sponsored by FHWA or conducted by state transportation departments with support provided by FHWA. Oil and grease was monitored at only six sites, and at these for relatively few total events. Typical concentrations were 5 to 10 mg/l, although a median concentration as high as 53 mg/l was reported for one of the sites. The mean concentration for all sites was 15 mg/l. Three of the study sites were located in California: Interstate 405 in Los Angeles, Highway 50 in Sacramento and Interstate 680 in Walnut Creek. The median concentrations of oil and grease reported for these sites were 8, 9 and 11 mg/l, respectively. A study conducted in Charlotte, North Carolina monitored oil and grease concentrations at three highway segments typical of urban, semi-urban and rural settings (Wu, et al., 1998). Monitoring was conducted from August 1995 to July 1996. The highest mean oil and grease concentration, 4.4 mg/l, was reported for the site with 100 percent imperviousness and the highest average daily traffic volume (25,000 vehicles per day). The site with 61 percent imperviousness and similar traffic volume (21,500 vehicles per day) reported a mean concentration of 2.5 mg/l. The lowest mean concentration, 1.3 mg/l, was reported for the least impervious site (45 percent) with the lowest traffic count (5,500 vehicles per day).
-19-

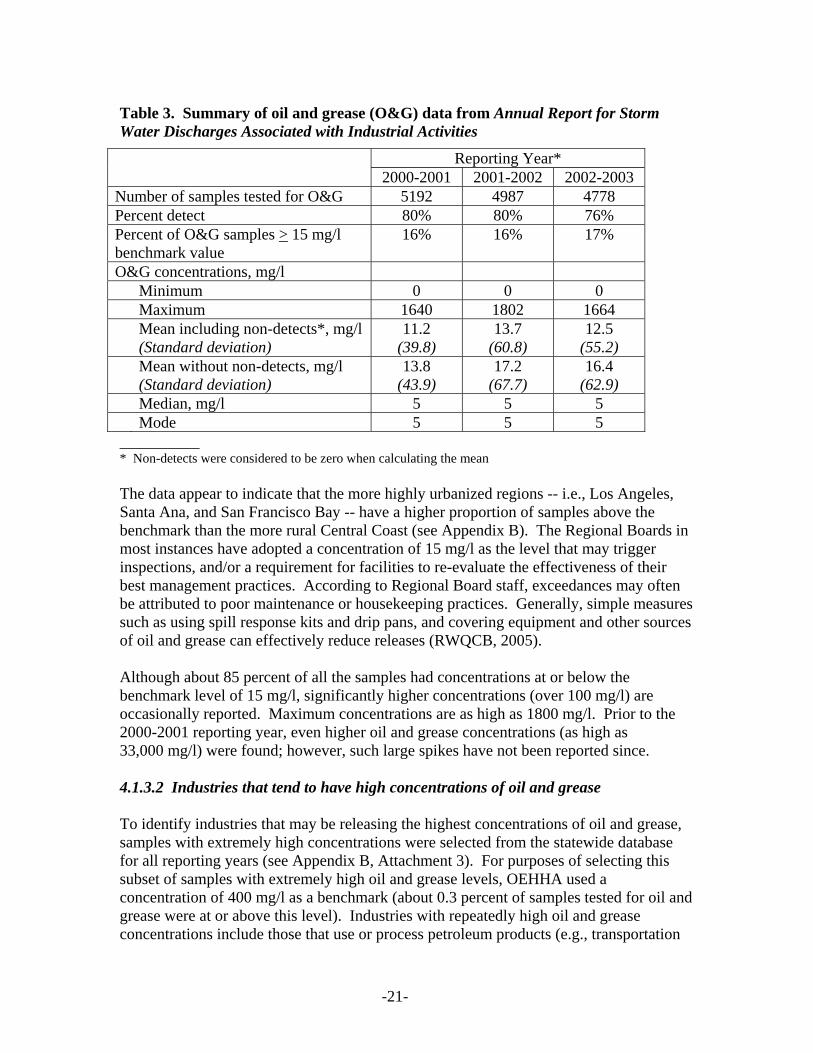
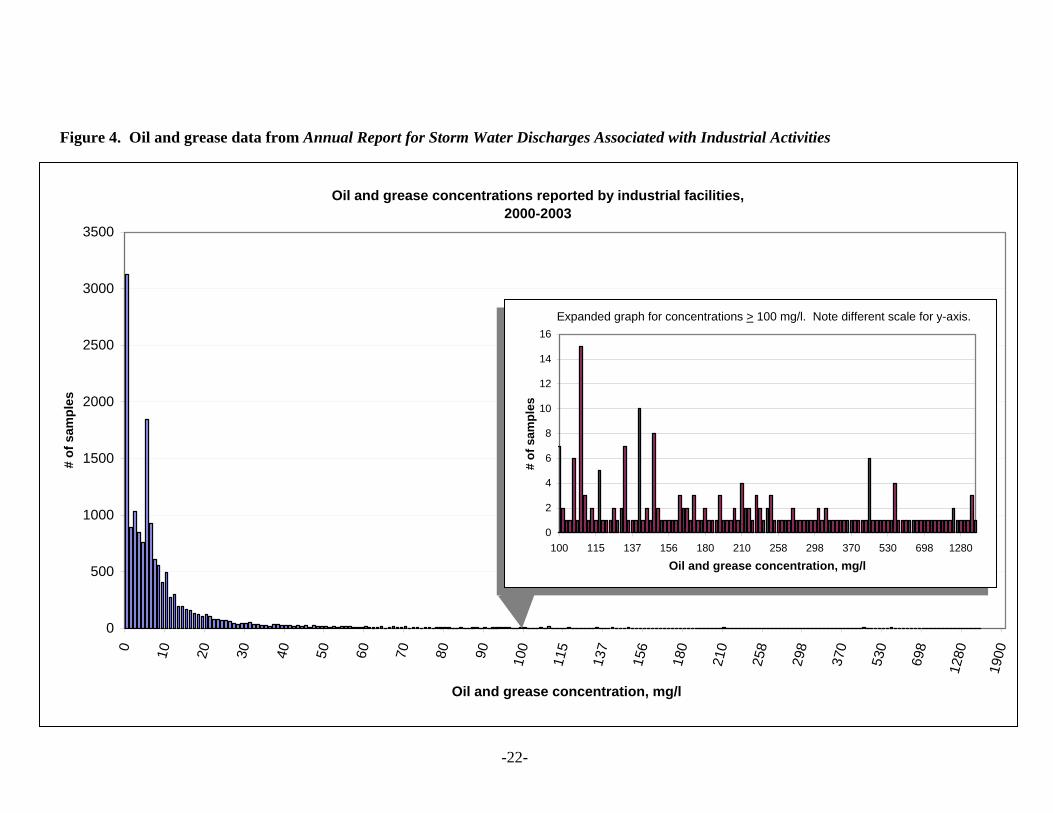
A four-year study investigated stormwater runoff quality from highway pavements in and near the recharge zone of the Barton Springs segment of the Edwards Aquifer in Austin, Texas (Irish, et al., 1995). A total of 35 simulated rainfall events and 23 natural storm events were sampled over the course of the study. Median event mean concentrations (EMCs) of oil and grease in runoff ranged from 0.4 to 2.0 mg/l. EMCs for natural storm events were found to be higher than simulated storm events, likely due to the fact that, unlike simulated events, samples are not collected over the entire duration of most natural storm events. Concentrations of constituents were observed to be higher in the earlier stages of the runoff event, and it is likely that the EMCs for natural storm events would have been lower had the entire storm been sampled. 4.1.3 Industrial facilities Stormwater discharges from certain industrial facilities are subject to the requirements of a permit under the NPDES Program. California’s nine Regional Water Quality Control Boards administer the industrial stormwater NPDES Program, which covers over 7,000 facility permits statewide (SWRCB, 2005d). A more detailed discussion of regulatory requirements and oil and grease data reported by industrial facilities are presented in Appendix B. 4.1.3.1 Statewide summary Permitees are required to conduct visual inspections of stormwater discharges and to collect stormwater samples from pre-selected locations on the property. These samples are to be collected during the first hour of discharge from the first storm of the wet season and at least one other storm. Analytical data in the Annual Reports submitted by each permittee to their Regional Board are incorporated into a statewide database (SWRCB, 2005c). A summary of the data reported statewide for oil and grease from the 2000-2001 to 2002-2003 reporting years is presented in Table 3. For these years, the data are predominantly from the San Francisco Bay, Central Coast, Los Angeles, and Santa Ana Regions. These years are presented due to the limited number of reports in the database prior to 2000 and for 2003-2004. As shown in the table, oil and grease was detected in 76 to 80 percent of the samples. Mean values ranged from 11.2 to 13.7 mg/l (without non-detects, the mean values range from 13.8 to 17.2 mg/l), and the median for all the years is 5 mg/l. Figure 4 shows that the most frequently reported concentrations were 0 and 5 mg/l. The database does not provide information about the analytical detection limits for the samples; however, 5 mg/l is generally the limit of detection for the method used for oil and grease analysis (U.S. EPA Method 1664). Thus, it is likely that the high frequency of 5 mg/l may be a reporting artifact.
-20-
-21-
Table 3. Summary of oil and grease (O&G) data from Annual Report for Storm Water Discharges Associated with Industrial Activities
Reporting Year* 2000-2001 2001-2002 2002-2003
Number of samples tested for O&G 5192 4987 4778 Percent detect 80% 80% 76% Percent of O&G samples > 15 mg/l benchmark value
16% 16% 17%
O&G concentrations, mg/l Minimum 0 0 0 Maximum 1640 1802 1664 Mean including non-detects*, mg/l
(Standard deviation) 11.2
(39.8) 13.7
(60.8) 12.5
(55.2) Mean without non-detects, mg/l
(Standard deviation) 13.8
(43.9) 17.2
(67.7) 16.4
(62.9) Median, mg/l 5 5 5 Mode 5 5 5 __________ * Non-detects were considered to be zero when calculating the mean The data appear to indicate that the more highly urbanized regions -- i.e., Los Angeles, Santa Ana, and San Francisco Bay -- have a higher proportion of samples above the benchmark than the more rural Central Coast (see Appendix B). The Regional Boards in most instances have adopted a concentration of 15 mg/l as the level that may trigger inspections, and/or a requirement for facilities to re-evaluate the effectiveness of their best management practices. According to Regional Board staff, exceedances may often be attributed to poor maintenance or housekeeping practices. Generally, simple measures such as using spill response kits and drip pans, and covering equipment and other sources of oil and grease can effectively reduce releases (RWQCB, 2005). Although about 85 percent of all the samples had concentrations at or below the benchmark level of 15 mg/l, significantly higher concentrations (over 100 mg/l) are occasionally reported. Maximum concentrations are as high as 1800 mg/l. Prior to the 2000-2001 reporting year, even higher oil and grease concentrations (as high as 33,000 mg/l) were found; however, such large spikes have not been reported since. 4.1.3.2 Industries that tend to have high concentrations of oil and grease To identify industries that may be releasing the highest concentrations of oil and grease, samples with extremely high concentrations were selected from the statewide database for all reporting years (see Appendix B, Attachment 3). For purposes of selecting this subset of samples with extremely high oil and grease levels, OEHHA used a concentration of 400 mg/l as a benchmark (about 0.3 percent of samples tested for oil and grease were at or above this level). Industries with repeatedly high oil and grease concentrations include those that use or process petroleum products (e.g., transportation
-22-
Figure 4. Oil and grease data from Annual Report for Storm Water Discharges Associated with Industrial Activities
Oil and grease concentrations reported by industrial facilities,2000-2003
0
0 10 20 30 40 50 60 70 80 90 100
115
137
156
180
210
258
298
370
530
698
Oil and grease concentration, mg/l
500
1000
1500
2000
2500
3000
3500
1280
1900
# of
sam
ples
0
2
4
6
8
10
12
14
16
100 115 137 156 180 210 258 298 370 530 698 1280
Oil and grease concentration, mg/l
# of
sam
ples
Expanded graph for concentrations > 100 mg/l. Note different scale for y-axis.
facilities, petroleum bulk stations, and lubricating oil blenders and re-refiners), refuse industries, and automobile dismantlers (see Appendix B, Attachment 4). While one would expect these industries to be likely sources of oil and grease due to the nature of their operations, they did not consistently report elevated levels. The occasional spikes may be the result of non-compliance with or the ineffectiveness of best management practices. It should be noted that certain food-related industries (e.g., pet foods, fruits and vegetables, and animal and marine fats and oils) reported some of the highest concentrations of oil and grease. This probably reflects the fact that the analytical method for oil and grease does not distinguish between biological fats and petroleum-based oils, as discussed earlier. 4.1.3.3 Data considerations It is important to keep certain considerations in mind in interpreting the industrial NPDES data. The analytical data for oil and grease (and other parameters) are facility-reported concentrations measured from facility-collected discharge samples. In many cases, samples are collected by facility personnel who have variable levels of familiarity with standard methods of sample collection and handling. Additionally, the permit requirements for sample collection allow some degree of flexibility regarding when samples are to be collected. Since pollutant concentrations may be highly variable throughout the course of a storm event as well as from storm-to-storm, the representativeness of a given sample is difficult to ascertain. There may also be variability among the state-certified laboratories in carrying out sample preparation, analytical and other operational procedures. The statewide oil and grease data are compiled using data submitted by the Regional Boards. While most permitted facilities have been conducting the required monitoring, and complying with the reporting requirement to the Regional Boards, there have been delays in entering the data into databases at the regional level, and in turn, the statewide database. Thus, the database does not include data from all Regional Boards, or for all compliance years. Furthermore, data are entered into both the statewide and the regional databases without a mechanism for quality assurance (SWRCB, 2005a). 4.2 Oil and grease in runoff from urban catchments One of the factors that influence stormwater quality is land use. Land use monitoring is conducted to characterize stormwater runoff in a drainage area comprised predominantly of a single, relatively homogeneous land use. This generates data that can help evaluate the relative importance of specific land uses as pollution sources (LADPW, 2000). As mentioned in Section 4.1.1, a study of oil and grease in urban stormwater was conducted during the 1980-81 storm season in a small watershed in Richmond, California (Stenstrom et al., 1984). The purpose of this study was to determine the relationship between land use and oil and grease pollution in urban stormwater. Five sampling
-23-

stations representing various land uses were monitored over a seven-storm sequence. Samples were analyzed for oil and grease using infrared analysis, a method that has been largely replaced by a gravimetric procedure (Method 1664). The lowest mean concentration of oil and grease, 3.9 mg/l, was measured at the sampling station draining a primarily residential (95 percent) area; the highest, 16.1 mg/l, at the station located in a commercial department store parking lot. The mean concentration for runoff from a gasoline station, several commercial retail stores and a small residential area had a mean concentration of 10.9 mg/l, while that for runoff collected outside the property limit of a large trucking distribution center (77 percent industrial, 23 percent impervious) was 7.3 mg/l. Runoff at the mouth of the watershed, which represents a composite of all land uses, had a mean concentration of 7.9 mg/l. As will be discussed below, more recent monitoring studies show lower oil and grease concentrations. One explanation may be that automotive engines tended to leak more lubricating oil in the early 1980’s compared to automobiles in more recent years. Another reason may be that the infrared absorption method used in this study has been reported to generally result in higher oil and grease readings when compared to gravimetric analysis. One study reported that infrared analysis yielded at least 20 percent more oil than gravimetric methods from a review of 19 laboratories using both methods (Silverman et al., 1985). Under a grant from U.S. EPA, a national database of stormwater data from a representative number of NPDES Phase I municipal separate storm sewer system (MS4) permit holders is being developed (Pitt et al., 2004). This database, called the National Stormwater Quality Database (NSQD), includes monitoring data collected from 1990 to 2002 from more than 200 municipalities throughout the country, including two in California (i.e., Alameda County and Caltrans). As of mid-summer 2003, 3,770 separate events from 66 agencies and municipalities in 17 states have been collected and data entered into the NSQD. The database includes over 1,800 samples tested for oil and grease. Of these, oil and grease were detected in 1,212 samples (66 percent), with concentrations ranging from below detection to 1,100 mg/l, and a median of 4.3 mg/l. The database also reports a mean concentration of 34.5 mg/l, based on detected values only. The oil and grease data are presented graphically in Figure 5. Table 4 summarizes the data by land use categories.
-24-

Figure 5. Oil and grease data from the National Stormwater Quality Database
Table 4. Oil and grease concentrations by land use category (as of mid-2003) from the National Stormwater Quality Database
Land use category*
0
200
400
600
800
1000
1200
1400
<111
-1526
-3041
-4556
-6071
-7586
-90
101-1
05
116-1
20
131-1
35
146-1
50
161-1
65
175-1
80
191-1
95
206-2
10
221-2
25
236-2
40
251-2
55
266-2
70
281-2
85
296-3
00
500-1
000
O&G Concentration, mg/l
No.
of s
ampl
esTo
tal N
= 1
834
No. of samples
Percent of samples above detection
Median concentration, (mg/l)
Residential 533 58% 3.9 Mixed residential 258 68% 4.4 Commercial 308 71% 4.7 Mixed commercial 122 82% 5.0 Industrial 327 65% 5.0 Mixed industrial 80 78% 4.5 Freeways 60 72% 8.0 Mixed freeways 15 100% 4.0 Open space 19 37% 1.3 Mixed open space 96 63% 6.0
Overall 1,834 66 % 4.3 _______________ * Categories that describe “mixed” land uses are designated using the most prominent land use type. Monitoring of urban catchments in Fresno from 1981 to 1983 (Oltmann, et al., 1987) yielded the highest oil and grease concentrations from runoff draining an industrial area (mean = 10.6 mg/l); concentrations were lowest in runoff from a multiple-dwelling residential area (mean = 1.5 mg/l). Land use monitoring data from Los Angeles (LADPW, 2000) and Ventura (Ventura County, 2001) Counties yielded mean
-25-
concentrations ranging from 0.9 to 5.7 mg/l. In both counties, commercial land use areas had the highest mean concentrations (see Table 2). Similar values were reported in a study conducted in the City of La Mirada during the 2004/2005 rainy season (La Mirada, 2005), although the highest levels were associated with residential land use. Oil and grease concentrations were measured at 12 street locations with the following results: commercial areas, non-detect (ND) to 2.5 mg/l; residential areas, ND to 3.0 mg/l; and industrial areas, ND to 2.8 mg/l. Commercial areas likewise showed the highest median concentrations of oil and grease in monitoring conducted in Texas (Baird et al., 1996), while levels in areas with other land uses showed more typical median concentrations (between 0.4 to 4.0 mg/l). Runoff draining industrial areas may also contain relatively higher levels of oil and grease compared to other uses. The Dothan Alabama Stormwater Project (CERS, 2000) characterized runoff from different types of urban and suburban catchments (see Table 2). Samples were collected from 1997 to 1999 from an agricultural field, light industrial site storm drain, a residential subdivision and two commercial parking lots. Mean concentrations of oil and grease were at or below 1.5 mg/l at all the sampling locations, except for the location draining runoff from an area that included a rubber tire manufacturer. Concentrations as high as 50 mg/l were measured at this location. The relatively higher oil and grease levels found at this location may be related to the use of petroleum products at the tire facility. 4.3 Oil and grease in discharges into receiving waters Mass emissions monitoring is designed to provide data to characterize discharges into receiving waters. More specifically, this type of monitoring enables the derivation of estimated pollutant loads to a receiving waterbody. Mass emissions monitoring stations are located at the lowest point possible in the drainage area where a conveyance discharges storm water to a waterbody, without being affected by tidal influences. Unlike land use monitoring stations, these stations generally monitor runoff from a heterogeneous land use area (LADPW, 2000). Mass emissions data for monitoring stations in San Diego, Ventura and Los Angeles Counties and the City of Long Beach show that oil and grease concentrations are generally lower than 5 mg/l (San Diego, 2005; Ventura County, 2001; LADPW, 2005; Long Beach, 2005). Further, the levels tend to be lower than those measured at land use monitoring stations and at discrete sources. This is not surprising because mass emission stations capture runoff from a large drainage area; much of the hydrocarbon load may attach to particulates and other matter, and settle out prior to reaching the sampling site. Relatively high levels, however, were reported for the monitoring sites in Long Beach. The City notes that record low rainfall occurred during the 2001-2002 storm season, with total precipitation at 84 percent below normal. The monitored events likely represented seasonal first flush at the monitoring sites, possibly accounting for the high oil and grease concentrations (Long Beach, 2005).
-26-

Annual mean concentrations for seven watersheds in Los Angeles County show significant year-to-year variability within watersheds, with one of the watersheds (San Gabriel River) showing over a six-fold difference between its lowest and highest annual mean oil and grease concentrations (see Table 5). For any given year, the difference in annual mean concentrations between individual watersheds can be as high as nine-fold at one extreme, to being almost the same value at the other extreme (i.e., from 2.1 mg/l to 2.5 mg/l for the 2004-05 season). However, when averaged over multiple years for which data were available (as many as ten years for certain watersheds), the resulting values were similar across all the watersheds, regardless of degree of urbanization, the lowest being 1.9 mg/l for San Gabriel River (46 percent undeveloped), the highest, 3.7 mg/l for Ballona Creek (21 percent undeveloped). The reason for this is unclear. 4.4 Ecological and human health considerations OEHHA performed a screening level analysis to provide a context for interpreting the possible ecological effects associated with the oil and grease concentrations reported in stormwater runoff. The analysis focused on used oil constituents for which numeric aquatic life criteria have been established: arsenic, cadmium, chromium, lead, nickel and zinc (40 CFR 131.38). The highest reported concentrations of these constituents in used oil (OEHHA, 2004) were used to calculate their amounts in runoff containing oil and grease at 5 mg/l (typical concentrations found in the studies reviewed by OEHHA were at or below 5 mg/l). These calculations yielded concentrations of these constituents that were up to five orders of magnitude lower than their respective freshwater and saltwater aquatic life water quality criteria. Nevertheless, these constituents may pose a long-term risk to the aquatic ecosystem because of their tendency to accumulate in sediment over time. The ecological effects of used oil discharges in stormwater runoff entering receiving water bodies, however, are influenced not only by individual constituents, but also by multiple factors, including the presence of other chemicals, the type and size of the receiving body, the frequency and duration of the discharge, the potential for dispersion, and the biological diversity of the receiving water ecosystem. Complex environmental processes acting on the oil, along with the highly variable nature of the used oil discharge, present a challenge in assessing the impacts of the discharge on the aquatic ecosystem. Human health impacts will depend upon whether or not exposures to constituents of concern occur from direct contact, ingestion of contaminated water or via the food chain. Studies linking adverse health effects in humans following exposure to used oil contaminants in the aquatic environment were not found. 5.0 Oil and Grease Loading Estimates Methods and models for estimating the amount of pollutants in runoff range in complexity and data input requirements, from simple algorithms that yield screening-level estimates of storm-specific or seasonal loadings for planning purposes, to highly
-27-

complex, dynamic models that simulate the movement of precipitation and pollutants to predict flows, stages and pollutant concentrations (Burton and Pitt, 2001). Modeling fundamentals call for using the simplest model that will satisfy the modeler’s objectives (Donigian and Huber, 1991). An objective of this report is to develop a rough approximation of the amount of oil in stormwater runoff entering receiving waterbodies.
Table 5. Reported annual mean concentrations for oil and grease in Los Angeles County, 1994-2005
Annual mean concentration for O&G, in mg/l
Mass emission site 1994
-95
1995
-96
1996
-97
1997
-98
1998
-99
1999
-00
2000
-01
2001
-02
2002
-03
2003
-04
2004
-05
Mean O&G concn,
all years,in mg/l
(std dev) San Gabriel River 0.68 0.98 0.64 0.81 1.66 2.40 2.83 4.23 2.66 2.50 1.9 (1.2)Coyote Creek* 2.61 3 2.27 2.5 2.5 3 (0.3)Los Angeles River 4.94 2.45 1.38 1.90 2.44 2.86 5.55 4.05 3.10 2.10 3.08 (1.36)Dominguez Channel 3.80 2.30 2.18 2.32 2.65 (0.77)Ballona Creek 2.2 3.0 2.5 7.1 3.5 4.0 5.7 3.8 2.5 2.1 3.6 (1.6)Malibu Creek 2.82 0.95 2.50 2.5 (0.86)2.73 3.83 2.50 2.20
2.40 (0.15)Santa Clara River 2.47 2.22 2.50_______________ *Coyote Creek is the major tributary in the lower reach of the San Gabriel River. OEHHA has determined that use of the “simple method” (U.S. EPA, 1992b) is adequate to meet this objective. This is one of the methods used in calculating annual pollutant loads for municipal NPDES applications. The same approach is used by Los Angeles County in its annual stormwater monitoring reports (LADPW, 2004a). The simple method has minimal data requirements, does not require specialized computer programs, and is generally deemed adequate for purposes of deriving gross loading estimates for planning purposes. 5.1 Methodology In the simple method, an estimate of the oil and grease loadings in stormwater runoff entering waterbodies is derived as the product of the concentration of the pollutant [C] and the volume of runoff [R]:
L = C x R When data on runoff volume [R] are not available, R can be calculated using precipitation, the appropriate runoff coefficient, and a correction factor (that adjusts for storms where no runoff occurs). The runoff coefficient represents the percentage of rainfall that becomes surface runoff, and is a function of the imperviousness of the watershed. The runoff coefficient can be based on actual field measurements, relevant hydrologic studies, or default values; alternatively, it can be estimated based on the percent imperviousness of the watershed (U.S. EPA, 1992b).
-28-

OEHHA calculated statewide oil and grease loading estimates by first deriving estimated annual loadings for a selected area of the State. The estimated loadings were then used to calculate estimated “unit load” (the estimated mass of pollutant per unit area of a watershed) by dividing the mass loading estimate by the total area in the watershed that is designated as urban. Only urban land areas were used to generate a unit load estimate because oil and grease in runoff is largely associated with urban land uses. Finally, the unit load was multiplied by California’s total urban area to yield a statewide loading estimate. An estimate of the volume of used oil corresponding to the oil and grease mass loading estimates was calculated by dividing the latter by the density of used oil. 5.2 Annual oil and grease mass loading estimates: Los Angeles County Los Angeles County was selected as the area to be used for deriving mass loading estimates and, subsequently unit load estimates, for a number of reasons: Los Angeles County likely represents a worst-case scenario for oil and grease runoff
contamination in the State. Its “ultra-urban” watersheds are characterized by high densities of paved surfaces or buildings that result in a high degree of imperviousness. Imperviousness of the watershed is an important determinant of stormwater quality and volume. Three of the watersheds in the county -- Dominguez Channel, Ballona Creek, and Los Angeles River – are about 59 percent, 40 percent and 32 percent impervious, respectively (LADPW, 2005). (See Figure 6 for descriptions of the watersheds.)
At the other extreme, the county also includes predominantly undeveloped
watersheds: Santa Clara River and Malibu Creek are 7% and 8% impervious, respectively. This enables comparisons to be made between examples representing highly urbanized watersheds and undeveloped watersheds within the same geographic region.
Los Angeles has the largest population among California’s counties, with 10 million
of the State’s approximately 37 million residents; it has the third highest population density, after San Francisco and San Diego Counties.
In terms of vehicular sources of oil in runoff, Los Angeles County has the most
number of registered vehicles (more than 7 million as of December 2003). More than 20% of the State’s 31 million registered vehicles are in Los Angeles County (DOF, 2004b). Additionally, over at least the past five years, the county has had the highest number of vehicle miles traveled over State highways: about 40 billion miles, compared to the Statewide total of 176 billion miles (Caltrans, 2004a).
Easily accessible data for estimating oil and grease loading are available for the
County. At least a decade’s stormwater monitoring data have been reported by the County pursuant to the requirements of its NPDES permit. In addition, several decades of hydrologic data are available.
-29-

Figure 6. Los Angeles County’s watersheds.
Adapted from: LADPW, 2005; LARWQCB, 2004
Most of the river lined with concrete; headwaters originate in the mountains; hydraulically connected to the San Gabriel River Watershed by Rio Hondo; eventually discharges into Long Beach Harbor.
Extensive areas of undisturbed riparian and woodland habitats in upper reaches; lower part flows through a concrete-lined channel in heavily urbanized area. Major tributary in the lower reach is Coyote Creek; ultimately flows into Long Beach Harbor.
Least developed/urbanized watershed management area, lowest ratio of impervious land area; traverses Ventura County, and flows into the Pacific Ocean halfway between Santa Buenaventura and Oxnard.
Drains the southwestern portion of LA County and southern part of Ventura County; except for residential and commercial areas along the coast, drain primarily open space.
Most of the drainage network has been modified into storm drains, under-ground culverts and open concrete channels; is an open channel between Venice Blvd and Pickford St. and its confluence within Santa Monica Bay.
Drains primarily via an extensive network of underground storm drains; northern subunit drains into Dominguez Channel; southern subunit drains directly into LA and Long Beach Harbor.
-30-
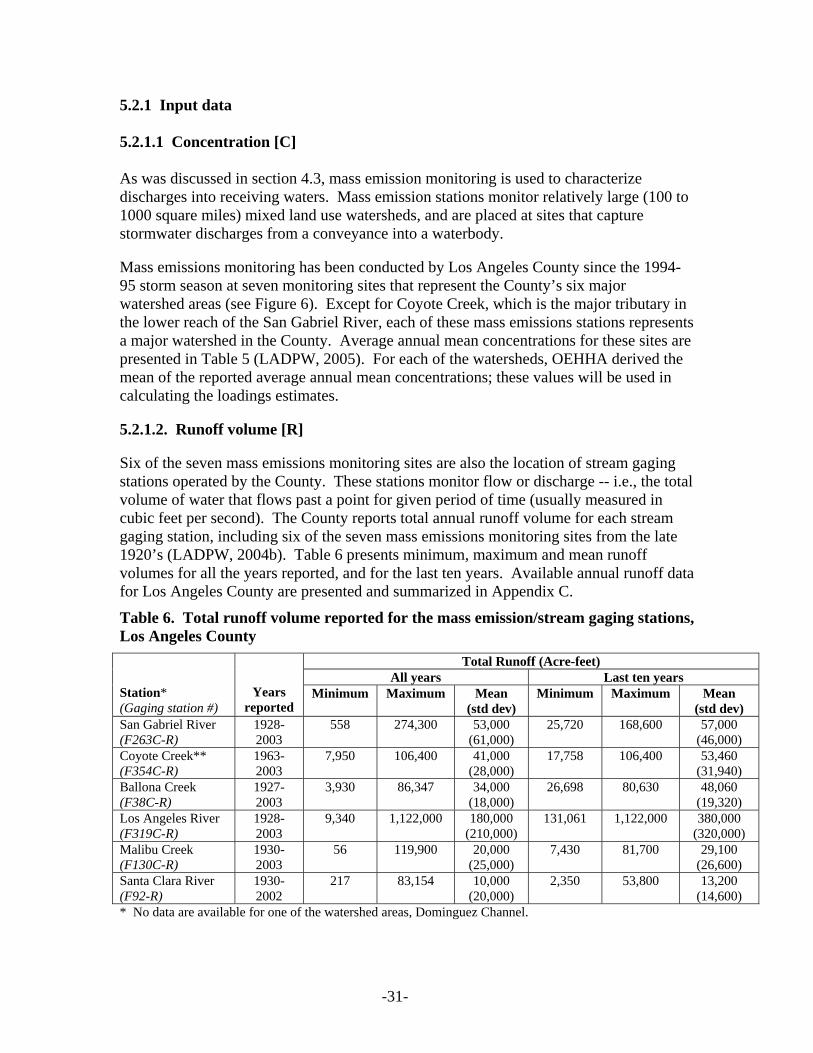
5.2.1 Input data 5.2.1.1 Concentration [C] As was discussed in section 4.3, mass emission monitoring is used to characterize discharges into receiving waters. Mass emission stations monitor relatively large (100 to 1000 square miles) mixed land use watersheds, and are placed at sites that capture stormwater discharges from a conveyance into a waterbody. Mass emissions monitoring has been conducted by Los Angeles County since the 1994-95 storm season at seven monitoring sites that represent the County’s six major watershed areas (see Figure 6). Except for Coyote Creek, which is the major tributary in the lower reach of the San Gabriel River, each of these mass emissions stations represents a major watershed in the County. Average annual mean concentrations for these sites are presented in Table 5 (LADPW, 2005). For each of the watersheds, OEHHA derived the mean of the reported average annual mean concentrations; these values will be used in calculating the loadings estimates. 5.2.1.2. Runoff volume [R] Six of the seven mass emissions monitoring sites are also the location of stream gaging stations operated by the County. These stations monitor flow or discharge -- i.e., the total volume of water that flows past a point for given period of time (usually measured in cubic feet per second). The County reports total annual runoff volume for each stream gaging station, including six of the seven mass emissions monitoring sites from the late 1920’s (LADPW, 2004b). Table 6 presents minimum, maximum and mean runoff volumes for all the years reported, and for the last ten years. Available annual runoff data for Los Angeles County are presented and summarized in Appendix C.
Table 6. Total runoff volume reported for the mass emission/stream gaging stations, Los Angeles County
Total Runoff (Acre-feet) All years Last ten years
Years reported
Minimum Maximum Mean (std dev)
Minimum Maximum Station* (Gaging station #)
Mean (std dev)
San Gabriel River (F263C-R)
1928-2003
558 274,300 53,000 (61,000)
25,720 168,600 57,000 (46,000)
Coyote Creek** (F354C-R)
1963-2003
7,950 106,400 41,000 (28,000)
17,758 106,400 53,460 (31,940)
Ballona Creek (F38C-R)
1927-2003
3,930 86,347 34,000 (18,000)
26,698 80,630 48,060 (19,320)
Los Angeles River (F319C-R)
1928-2003
9,340 1,122,000 180,000 (210,000)
131,061 1,122,000 380,000 (320,000)
Malibu Creek (F130C-R)
1930-2003
56 119,900 20,000 (25,000)
7,430 81,700 29,100 (26,600)
Santa Clara River (F92-R)
1930-2002
217 83,154 10,000 (20,000)
2,350 53,800 13,200 (14,600)
* No data are available for one of the watershed areas, Dominguez Channel.
-31-

It is evident from the table that runoff volumes are highly variable. Given the significant degree of development and urbanization that occurred in the past decade, runoff volumes for the last ten years are likely more representative of current conditions than data for all reporting years; hence, OEHHA used data from the last ten years for its calculations. In order to capture the data variability and provide a reasonable range, OEHHA calculated loading estimates using: (1) the minimum, (2) the maximum, and (3) the average annual runoff volume reported for the last ten years for each monitoring station. 5.2.2 Mass loading calculations Annual oil and grease loadings were estimated for each watershed using the following formula:
L = C x R Where:
L = Annual estimated oil and grease loading for the watershed; C = The mean of the reported annual mean concentrations for the watershed (the last
column of Table 5); and, R = Annual runoff volume (minimum, maximum and mean values for the last ten
years on Table 6)
Calculations are provided in Appendix D. Table 7 and Figure 7 present the results of these calculations.
Table 7. Estimated annual oil and grease loadings, Los Angeles County watersheds
Estimated Annual Oil and Grease Loading (1,000 lbs)
Watershed*
Percent impervious
area
Average Annual
Oil & Grease Concentration
(mg/l)
Based on Minimum
Annual RunoffVolume**
Based on Average
Annual Runoff Volume**
Based on Maximum
Annual RunoffVolume**
San Gabriel River 29% 1.9 130 290 880 Coyote Creek*** 29% 3 100 400 900 Ballona Creek 40% 3.6 260 470 790 Los Angeles River 32% 3.08 1,100 3,200 9,500 Malibu Creek 8% 2.5 50 200 560
7% Santa Clara River 2.40 15 86 351 Total**** 1,655 4,646 12,981
_______________ * No estimates were derived for one of the watershed areas, Dominguez Channel. ** From the last ten years of runoff data on Table 6. *** Coyote Creek is the major tributary in the lower reach of the San Gabriel River.
-32-

Figure 7. Estimated annual oil and grease loadings, Los Angeles County watersheds
5.2.3 Estimated volume of used oil in runoff
LA County W atersheds: Estimated annual oil & grease loading
130 290 88
0
100 40
0 900
260 47
0 7901 ,100
3,200
9,500
50 200 56
0
15 86
351
0
1,000
2,000
3,000
4,000
5,000
6,000
7,000
8,000
9,000
10,000
Based on Minimum RunoffVolume
Based on Average Runoff Volume Based on Maximum RunoffVolume
Load
ing,
in th
ousa
nd lb
s.
San Gabriel River Coyote Creek Ballona Creek Los Angeles River Malibu Creek Santa Clara River
The approximate volume [V] of used oil corresponding to the mass loading estimate was calculated as follows:
V =L/D Where: L = Estimated oil and grease mass loading; D = Density of used oil, 0.885 g/ml (Environment Canada, 2005) The results of the calculations are presented in Table 8; detailed calculations are found in Appendix D. This calculation assumes that the total mass of oil and grease in the loading estimate is made up entirely of used oil. As was discussed in section 3, however, the analytical methods commonly used for oil and grease do not distinguish among various petroleum-based or biological oils, and therefore do not specifically measure used oil.
-33-

Table 8. Estimated annual volume of used oil in runoff, Los Angeles County watersheds
Estimated Volume of Used Oil (thousand gallons)
Watershed*
Based on Minimum
Annual Runoff Volume
Based on Average
Annual Runoff Volume
Based on Maximum
Annual RunoffVolume
San Gabriel River 18 40 120Coyote Creek** 20 60 100Ballona Creek 35 64 110Los Angeles River 150 430 1,300Malibu Creek 7 27 75Santa Clara River 2 12 48
Total 232 633 1,753_______________ * No estimates are presented for one of the watershed areas, Dominguez Channel. ** Coyote Creek is the major tributary in the lower reach of the San Gabriel River. 5.3 Estimated oil and grease loading statewide To derive a rough approximation of the total amount of oil and grease in runoff statewide, OEHHA used a mathematical approach based on the Los Angeles County mass loading estimates. First, a “unit load” – which is the mass of oil and grease in runoff from a given unit of watershed area -- was calculated by dividing the total estimated mass loading (from Table 7) by the number of urban acres in the County. Since oil and grease in runoff is largely associated with urban areas, only these areas were used in the calculation. The total urban number of acres in Los Angeles County – 503,457 acres -- was determined by adding the acreage for the following land use categories: residential, commercial and public, industrial, transportation and utilities, and mixed use. (The area for the Dominguez Channel watershed was excluded from the calculation since loadings for this watershed are not included in the total estimated loadings for the County.) Three unit load estimates were derived, corresponding to the mass loading estimates based on the minimum, average and maximum runoff volumes for the past ten years. The statewide loading was then estimated by multiplying the unit load by the total number of urban acres in California, 4,909,000 (CDFFP, 2003). Finally, estimates of the volume of used oil corresponding to the statewide mass loading estimates were calculated using the approach discussed in section 5.2.3. These estimates are presented in Table 9.
-34-

Table 9. Estimated annual oil and grease loadings, statewide
Minimum Average Maximum Total estimated oil and grease mass loading, thousand lbs. (from Table 7)
1,655 4,646 12,981
“Unit loading,” lbs. per urban acre (= Total estimated oil and grease mass loading/No. of urban acres in L. A. County)
3.3 9.2 25
Estimated Statewide mass loading, million lbs (= Unit loading x No. of urban acres in CA)
16 45 120
Estimated Statewide loading, million gallons (Estimated Statewide mass loading/Density of used oil)
2.2 6.1 16
5.4 Uncertainty analysis The oil and grease loading estimates represent very rough approximations of the amounts of oil and grease in stormwater. In interpreting the estimates, the following sources of uncertainty should be considered: • Mass loading estimates were calculated as the product of runoff volume and
concentration. Both runoff volume and concentration can exhibit a high degree of year-to-year, inter- and intra-storm variability. To account for the variability in runoff volume, minimum, maximum and average values for ten years’ worth of annual runoff data were used. Similarly, an average of the annual mean concentrations available for each watershed was used. The representativeness of the values used in the calculations cannot be ascertained.
• The annual statewide loading estimates are simply mathematical derivations based
on the “unit load” for Los Angeles County – i.e., the mass of pollutant per unit urban area per year. Using the County-based unit load Statewide does not account for the widely different types of urban watersheds in the State. In fact, within Los Angeles County, there are considerable differences among the unit load values for the different watersheds, with values ranging from about 2 pounds/acre to almost 20 pounds/acre, for an average runoff year (see Appendix D).
• For purposes of the calculations carried out in this report, the “oil and grease”
measured at mass loading stations was assumed to be used oil. Although studies have identified crankcase oil as the predominant hydrocarbon in urban runoff, it cannot be determined what fraction of the mass loading estimate for “oil and grease” can be reasonably assumed to be used oil. Hence, the loading estimate is at best a crude approximation of the amount of used oil in runoff entering receiving waters.
-35-

5.5 Comparison with other loading estimates OEHHA is unable to validate the loading estimates derived in this section. However, it may be useful to consider the estimates within the context of loadings estimates derived by other investigators. 5.5.1 Storm-specific loadings Los Angeles County’s monitoring reports for the 2001-02, 2002-03 and 2003-04 storm seasons include storm-specific loading estimates for certain pollutants, including oil and grease. OEHHA’s estimated annual oil and grease loadings for an average annual runoff year (middle column, Table 7) were compared to the County’s estimated loadings for the monitored events during the 2002-03 season (see Table 10). The 2002-03 season was chosen for this comparison, as the 2001-02 and 2003-04 seasons were low rainfall years: total seasonal precipitation was 4.2 and 8.4 inches, respectively -- at most about half of the annual average rainfall for the County. By contrast, rainfall for the 2002-03 season was the same as average, 15.5 inches.
Table 10. Oil and grease loadings for monitored events, compared to estimated loadings for average runoff year.
Watershed*
Estimated Average Annual
Loading (thousand lbs),(from Table 7)
Total Estimated Loading from
LA County monitored
events (lbs), 2002-03 Season
Total Estimated Loading from
monitored events as % of OEHHA
Estimated Average Annual
Loading
% of Annual Average Rainfall
Monitored
San Gabriel River 290 29,771 10% 40%Coyote Creek* 400 43,905 10% 57%Ballona Creek 470 175,984 37% 37%Los Angeles River 3,200 1,069,043 33% 43%Malibu Creek 200 12,422 6% 98%Santa Clara River 86 3,581 4% 10% As expected, the total loading estimates for all monitored events were below the estimates derived by OEHHA for each watershed, making up from 4 to 37 percent of the latter loadings. The rainfall for the monitored events represented from 10 to 40 percent of the County’s annual average rainfall. For two of the watersheds (Ballona Creek and Los Angeles River) pollutant loadings from monitored events were similar to OEHHA’s estimated average values.
-36-

5.5.2 Oil and grease loading estimates from other studies Santa Monica Bay In 1993, a study of pollutant loadings to Santa Monica Bay from stormwater runoff was conducted, primarily for the purpose of identifying catchments with the largest expected contribution of each pollutant (Stenstrom and Strecker, 1993). Oil and grease are among the water quality parameters included in the study. Pollutant loads to the Bay were estimated as the summation of land use-specific loadings. Runoff volumes were calculated based on historical storm data and land use-specific runoff coefficients. Instead of local monitoring data, oil and grease concentrations from an earlier stormwater runoff study conducted in the San Francisco Bay area were used: 0 for open areas; 3 mg/l for single-family land use; and 22 mg/l for all other land uses (multi-family, commercial, public, light industrial, other urban, and unknown). The study estimated the annual total oil and grease loading into Santa Monica Bay to be 2,110,241 pounds. Of the Los Angeles County watersheds, two drain into Santa Monica Bay: Ballona Creek and Malibu Creek. The sums of OEHHA’s loading estimates for these two watersheds range from 310,000 to 1,350,000 pounds, with an average estimate of 670,000 pounds. These estimates are 15 to 64 percent of the estimated loading into Santa Monica Bay from the earlier study. The runoff volumes used in the Santa Monica Bay study (approximately 80,000 acre-feet) were comparable to the values used by OEHHA (approximately 34,000 acre-feet to 160,000 acre-feet, with an average of about 77,000 acre-feet); however, the oil and grease concentrations in the earlier study were six- to eight-fold higher than the values used by OEHHA. It should also be noted that there are other watersheds (in Ventura County) that drain into Santa Monica Bay. Los Angeles River Based on monitoring conducted in 1985-86, oil and grease loading to the Los Angeles River was estimated to be 2,900 metric tons or 6,400,000 pounds (SCCWRP, 1986). This falls within the range of OEHHA’s estimates for the Los Angeles River of approximately 1,100,000 to 9,500,000 pounds, with an average of 3,200,000 pounds. 6.0 Findings In this report, OEHHA reviews stormwater monitoring data for the purpose of characterizing used oil pollution in stormwater runoff. Monitoring conducted by municipalities and industrial facilities pursuant to stormwater regulatory programs (more specifically, the National Pollutant Discharge Elimination System or NPDES stormwater program) provided a major source of data relevant to this evaluation. The monitoring conducted under the NPDES program quantifies amounts of “oil and grease,” which is collectively regulated as a conventional water pollutant.
-37-

Studies have shown that petroleum hydrocarbons in urban runoff from different land use sites were found to be primarily associated with used crankcase oil. Likewise, the type of petroleum hydrocarbons found in sediment in receiving water bodies in urban areas very closely resembles that found in stormwater runoff. Lubricating oils used in industrial processes and in heavy construction equipment are also discharged into stormwater. However, unlike crankcase oil from motor vehicles that generally appears to be discharged continually in small amounts, discharges from industrial facilities tend to occur as localized, sporadic events occasionally involving unusually high levels. While characterizing pollutant levels in stormwater runoff is an important step in formulating and evaluating mitigation measures, quantifying such levels presents numerous challenges. Concentrations of oil and grease in stormwater runoff are affected by a number of factors, including precipitation, land use, physical characteristics of the watershed, pollutant sources and release mechanisms, and the physical and chemical characteristics of the pollutant. Complex interactions between these factors obscure simple correlations between individual factors and stormwater quality. However, there is evidence that oil and grease concentrations in highway runoff are higher in segments with higher traffic volumes. Further, higher concentrations of oil and grease in highway runoff are generally found to occur during the first storm of the rainy season than subsequent storms, and during the beginning of a rainfall event. Stormwater runoff in urban watersheds transports pollutants from discrete sources (e.g., highways, parking lots, industrial facilities) and diffuse catchment areas, through conveyances that ultimately discharge into receiving water bodies. Direct comparisons among the oil and grease concentrations reported by the studies reviewed in this report (see Table 2) are problematic due to differences in sampling protocols, analytical methods (including different detection limits for the same method, depending on the laboratory), quality assurance/quality control processes, and data analysis and reporting procedures employed. Nevertheless, qualitative conclusions can be drawn about relative patterns that are evident from the data. In general, oil and grease concentrations tend to be higher in runoff sampled from discrete sources before dilution, partitioning, adherence to particulates, settling, and other fate processes occur. Relatively lower concentrations are typically found in samples collected to represent runoff in catchment areas with a predominant land use, and even lower levels in samples from discharges into a receiving water body. While stormwater quality can show considerable variability, typical concentrations of oil and grease in runoff samples are generally less than 5 mg/l, and seldom exceed 10 mg/l. Although petroleum product concentrations as low as 1 microgram per liter have been associated with long-term sublethal effects in aquatic organisms, no human or ecological health-based numeric regulatory standard has been adopted for oil and grease in stormwater discharges. Rather, water quality regulations specify that the pollutant should not be present at levels that produce a visible oily sheen. Establishing numeric water quality criteria for oil and grease is made difficult by the myriad of organic compounds with varying physical, chemical and toxicological properties that make up their constituents. For stormwater discharges from industrial facilities, a concentration of
-38-

15 mg/l is generally used as a benchmark that may trigger further actions, such as inspections by the Regional Water Quality Control Board, or changes to best management practices. Areas that experience a high volume of vehicular traffic, such as highways, parking lots and gasoline stations are commonly thought of as discrete sources of oil and grease in runoff, as are certain industrial facilities with operations that involve petroleum products. However, runoff from these sources follow the same pattern seen with the overall data, i.e., oil and grease concentrations generally at or below 5 mg/l. Although the median concentration reported by industrial facilities statewide is 5 mg/l, the mean concentrations ranged from 11.2 to 12.5 mg/l. Occasionally, unusually high levels have been reported: for highways and parking lots, levels above 10 mg/l are considered high; for industrial facilities, levels as high as 33,000 mg/l have been reported (in more recent years, maximum values have been up to 1,800 mg/l). An oil and grease concentration as high as 1,800 mg/l would likely contain metals at levels below current aquatic life water quality criteria; however, the criteria for cadmium, lead and zinc will likely be exceeded at oil and grease concentrations of 33,000 mg/l. It should be noted, however, that these elevated concentrations were measured close to, or at the source; concentrations in the runoff entering the closest receiving water body are likely to contain oil and grease at lower concentrations. Industries whose operations involve vehicles, heavy equipment and engines, and petroleum product processing or use tend to report high concentrations of oil and grease in stormwater runoff. These include transportation facilities, petroleum bulk stations, and lubricating oil blenders and re-refiners, refuse industries, metal fabricators, and automobile dismantlers. Even with these industries, however, oil and grease concentrations show sporadic spikes, rather than consistently high levels. The occasional spikes may be the result of non-compliance with, or the ineffectiveness of best management practices. Generally, simple measures such as using spill response kits and drip pans, and covering equipment and other sources of oil and grease can effectively reduce releases. Hence, industrial facilities may present key opportunities for major reductions of oil and grease discharges in stormwater runoff. Monitoring conducted to characterize runoff from catchment areas having a predominant land use indicates that oil and grease concentrations tend to be higher at sites associated with commercial land use (i.e. retail and office buildings) than with other land uses. Mean concentrations as high as 13 mg/l have been reported for commercial areas. The lowest concentrations were associated with agricultural land use (0 to 0.9 mg/l). Mean concentrations associated with residential land use ranged from 1.0 to 4.7 mg/l. Mass emissions monitoring, typically at outfalls to a receiving water body, is designed to characterize concentrations from a relatively large drainage area. It also provides data for estimating pollutant loadings. Monitoring by municipalities in Southern California generally yielded mass emissions concentrations below 5 mg/l. Annual mean oil and grease concentrations reported for the seven watersheds in Los Angeles County showed significant year-to-year variability within each watershed. The annual mean
-39-

concentrations among the watersheds, which included ultra-urban as well as relatively undeveloped ones, showed almost a nine-fold difference during one year (1998-99), to being practically the same value another year. Interestingly, however, when averaged over multiple years (as many as ten years for certain watersheds), the resulting values were similar across all the watersheds, regardless of degree of urbanization. Finally, oil and grease concentrations reported in earlier studies (from around the 1980s to early 1990s) tended to be higher than in more recent studies. A possible explanation for this may be that less crankcase oil has been leaking from more recent years’ vehicle fleets. Los Angeles County was used as a case study for deriving crude estimates of annual oil and grease loadings, or the amount of oil and grease discharged into receiving water bodies each year. The County likely represents a worst-case scenario because of its “ultra-urban” watersheds, its large population (the largest among California’s counties), and its number of vehicles and vehicle miles traveled, also the highest among all counties. At the same time, the presence of predominantly undeveloped watersheds in the same county alongside the highly urbanized ones enables comparisons to be made. Runoff and mass emissions data required to calculate oil and grease loadings were easily accessible for the County. A simple, screening level calculation was used to derive the annual loadings estimates as the product of pollutant concentration and runoff volume. Oil and grease loadings were estimated to range from approximately 1.7 million pounds to 13 million pounds annually for Los Angeles County. These values correspond to approximately 0.23 million to 1.8 million gallons of used oil. Using these estimated values, total loadings statewide were derived mathematically to range from 16 million to 120 million pounds, an amount roughly corresponding to 2.2 million to 16 million gallons of used oil, respectively, with 6.1 million gallons as the estimated volume for an average runoff year. These volumes are about 3 to 25 percent of the 64 million gallons of lubricating oil sold but not recycled, and about 1 to 9 percent of the 176 million gallons of lubricating and industrial oil sold but not recycled. It is difficult to establish the ecological and human health implications of the typical concentrations reported in runoff and the loading estimates for oil and grease. A screening level analysis performed by OEHHA showed that, at an oil and grease concentration of 5 mg/l (typical concentrations found in the studies reviewed by OEHHA were at or below 5 mg/l), used oil constituents for which water quality aquatic life criteria have been established --- arsenic, cadmium, chromium, lead and zinc (40 CFR 131.38) – are likely to occur at concentrations up to five orders of magnitude lower than freshwater and saltwater aquatic life water quality criteria. Nevertheless, these constituents may pose a long-term risk to the aquatic ecosystem because of their tendency to accumulate in sediment over time. The ecological effects of used oil discharges in stormwater runoff entering receiving water bodies are influenced not only by individual constituents, but also by multiple
-40-

factors, including the presence of other chemicals, the type and size of the receiving body, the frequency and duration of the discharge, the potential for dispersion, and the biological diversity of the receiving water ecosystem. Complex environmental processes acting on the oil, along with the highly variable nature of the used oil discharge, present a challenge in assessing the impacts of the discharge on the aquatic ecosystem. Human health impacts will depend upon whether or not exposures to constituents of concern occur from direct contact, ingestion of contaminated water or via the food chain. Studies linking adverse health effects in humans following exposure to used oil contaminants in the aquatic environment were not found. The relationship between the estimated loadings and the amount of used oil that is illegally disposed of cannot be established. Used oil in stormwater runoff can primarily be attributed to leaks and spills from vehicle engines or from industrial activities. It is unlikely that that this amount reflects how much used oil is illegally disposed, given the episodic nature of illegal disposal incidents. OEHHA is unable to ascertain how close these estimates are to actual amounts of used oil in runoff being discharged into receiving water bodies. There is considerable uncertainty in the estimate, given limitations relating to how close the concentrations in the samples represent actual concentrations of the pollutant, the inability of the commonly used analytical method to distinguish between petroleum-based hydrocarbons and biological lipids, and the appropriateness of extrapolating statewide loadings from estimates derived for a single county. In the absence of a more refined analysis, however, these estimates can be used as a baseline for planning and mitigation purposes.
-41-

REFERENCES ATSDR (1997). Toxicological Profile for Used Mineral-based Crankcase Oil. Agency for Toxic Substances and Disease Registry. Atlanta, Georgia. Posted at: http://www.atsdr.cdc.gov/toxprofiles/tp102.html ATSDR (1995). Toxicological Profile for Polycyclic Aromatic Hydrocarbons. Agency for Toxic Substances and Disease Registry. Atlanta, Georgia. Posted at: http://www.atsdr.cdc.gov/toxprofiles/tp69.html# BASMAA (1999). Design Guidance Manual for Stormwater Quality Protection. Bay Area Stormwater Management Agencies Association. 1999. Posted at: http://www.basmaa.org/resources/files/Start%20at%20the%20Source%20-%20Design%20Guidance%20Manual%20for%20Stormwater%20Quality%20Protection.pdf Baird, C., Ockerman, D., and Dybala, T. (1996). Characterization of Nonpoint Sources and Loadings to Corpus Christi Bay National Estuary Program Study Area. Natural Resources Conservation Service and U.S. Geological Survey. January 1996. Posted at http://www.cbbep.org/publications/virtuallibrary/ccbnep05.pdf Barrett, M., Zuber, R., Collins, E.R., Malina, J., Charbeneau, R., and Ward, G. (1995). A Review and Evaluation of Literature Pertaining to the Quantity and Control of Pollution from Highway Runoff and Construction. Center for Research in Water Resources, Bureau of Engineering Research, University of Texas at Austin. April 1995. Posted at http://www.ce.utexas.edu/centers/crwr/reports/online.html Bernstein, B.B., and Drennan, M. (1998). Improving Indicator Selection for Regional Stormwater Monitoring. MDA, Inc., 17712 Miranda St., Encino, CA 91316. Posted at http://www.nwqmc.org/98proceedings/Papers/12-Bern.html. Brezonik, P.L. and Stadelmann, T.H. (2002). Analysis and predictive models of stormwater runoff volumes, loads, and pollutant concentrations from watersheds in the Twin Cities metropolitan area, Minnesota, USA. Water Res 36(7):1743-57. April 2002. Brown, R.C., Pierce, R.H., and Rice, S.A. (1985). Hydrocarbon Contamination in Sediments from Urban Stormwater Runoff. Marine Pollution Bulletin, 16(6):236-240. Buckler, D. and Granato, G. (1999). Assessing Biological Effects from Highway-Runoff Constituents. Prepared for the U.S. Geological Survey and the U.S. Department of Transportation, National Highway Runoff Data and Methodology Synthesis. USGS Open-File Report 99-240. Burton, A., and Pitt, R. (2001). Stormwater Effects Handbook: A Toolbox for Watershed Managers, Scientists, and Engineers. CRC Press. Posted at
-42-

http://unix.eng.ua.edu/~rpitt/Publications/BooksandReports/Stormwater%20Effects%20Handbook%20by%20%20Burton%20and%20Pitt%20book/StormwaterEffectsHandbook.htm California Polytechnic State University (2005). Comprehensive Assessment of California’s Used Oil Program. Contractors Report to the California Integrated Waste Management Board. San Luis Obispo, CA. February 2005. Caltrans (2003a). Discharge Characterization Study Report. California Department of Transportation. Sacramento, CA. November 2005. Posted at: http://www.dot.ca.gov/hq/env/stormwater/special/newsetup/_pdfs/monitoring/CTSW-RT-03-065.pdf Caltrans (2003b). Caltrans Tahoe Highway Characterization and Sand Trap Effectiveness Studies: 2000-2003 Monitoring Report. California Department of Transportation. June 2003. Posted at: http://www.dot.ca.gov/hq/env/stormwater/special/newsetup/-pdfs/tahoe/CTSW-RT-03-054.pdf Caltrans (2004a). County Vehicle Miles of Travel: Vehicle Miles of Travel on State Highway System (millions). California Department of Transportation. Posted at: http://www.dot.ca.gov/hq/traffops/saferesr/trafdata/monthly/histdatacounty.pdf Caltrans (2004). Storm Water Monitoring. California Department of Transportation, Division of Environmental Analysis. Sacramento, CA. Updated June 2, 2004. Posted at: http://www.dot.ca.gov/hq/env/stormwater/ongoing/monitoring/index.htm CDFFP (2003). The Changing California: Forest and Range Assessment. California Department of Forestry and Fire Protection, Fire and Resources Assessment Program. On-line Technical Reports. Sacramento, CA. Posted at: http://frap.cdf.ca.gov/assessment2003/Introductory_Materials/introduction.html CDS Technologies (2005). Oil and Grease in Stormwater Runoff. June 2005. Posted at: www.cdstech.com CERS (2000). Characteristics of Pollutants in Storm Water Runoff from Dothan, Alabama Catchments: Implications for Phase II Storm Water Management. Center for Environmental Research and Service. Prepared for the Alabama Department of Environmental Management. Troy State University, Troy, AL 36082. May 26, 2000. CIWMB (2003). Used Oil Recycling Program: General Information. California Integrated Waste Management Board. Sacramento, CA. Last updated December 3, 2003. Posted at: http://www.ciwmb.ca.gov/Used Oil/GeneralInfo.htm
-43-

CIWMB (2006). Used Oil Recycling Rate Annual Report: 2004. California Integrated Waste Management Board. Sacramento, CA. January 2006. Posted at: http://www.ciwmb.ca.gov/Publications/UsedOil/61106002.pdf. Devinny, J.S., Kamieniecki, S., and Stenstrom, M.K. (2004). Alternative Approaches to Stormwater Quality Control. Appendix H, Task B. University of Southern California. USC Center for Sustainable Cities. Prepared for the Los Angeles Regional Water Quality Control Board. 2004. Posted at: www.owp.csus.edu/research/npdes/costsurvey.pdf DOF (2004). California Statistical Abstract, Table J-4. California Department of Finance. Sacramento, CA. Posted at http://www.dof.ca.gov/html/fs%5Fdata/stat%2Dabs/Toc_xls.htm DOF (2004a). California Statistical Abstract, Table J-3. California Department of Finance. Sacramento, CA. Posted at http://www.dof.ca.gov/HTML/FS_DATA/documents/StatAbstrct04www.pdf DOF (2004b). California Statistical Abstract, Table J-4. California Department of Finance. Sacramento, CA. Posted at http://www.dof.ca.gov/HTML/FS_DATA/documents/StatAbstrct04www.pdf Donigian, A.S., and Huber, W.C. (1991). Modeling of Nonpoint Source Water Quality in Urban and Non-urban Areas. Prepared for the Environmental Research Laboratory, Office of Research and Development, U.S. Environmental Protection Agency. U.S. EPA. EPA/600/3-91/039. Driscoll, E.D., Shelley, P.E., Strecker, E.W. (1990). Pollutant Loadings and Impacts from Highway Stormwater Runoff, Volume III: Analytical Investigation and Research Report. Prepared for the United States Department of Transportation, Federal Highway Administration. Publication No. FHWA-RD-88-008. April, 1990. Posted at: http://ma.water.usgs.gov/fhwa/90Model/FHWA-RD-88-006.pdf Environment Canada (1994). Polycyclic Aromatic Hydrocarbons: Priority Substances List Assessment Report. Posted at: http://www.hc-sc.gc.ca/ewh-semt/alt_formats/hecs-sesc/pdf/pubs/contaminants/psl1-lsp1/hydrocarb_aromat_polycycl/hydrocarbons-hydrocarbures_e.pdf Environment Canada (2005). ETC Spills Technology Databases, Oil Properties Database: Lubricating oil (Engine, Gasoline). Posted at: www.etc-cte.ec.gc.ca/databases/OilProperties/Default.aspx GAO (2001). Water Quality: Better Data and Evaluation of Urban Runoff Programs Needed to Assess Effectiveness. U.S. General Accounting Office. Washington, D.C. June 2001. Posted at: http://www.gao.gov/new.items/d01679.pdf
-44-
Graham, L.A., Chiu, C., Poole, G., Charland, J.P., McPhee, T., and MacDonald, P. (2004). Semivolatile Organic Compound Emission Profiles for Canadian Motor Vehicles. Environment Canada and Natural Resources Canada. Presented at An International State of the Science Workshop on Organic Speciation in Atmospheric Aerosols Research. Desert Research Institute. Las Vegas, NV. April 2004. IARC (2004). Overall Evaluations of Carcinogenicity to Humans: List of all agents, mixtures and exposures evaluated to date (as evaluated in IARC Monographs Volumes 1-88). Posted at: http://monographs.iarc.fr/ENG/Classification/crthall.php Irish, L.B., Lesso, W.G., Barrett, M.E., Malina, J.F., Charbeneau, R.J. and Ward, G. (1995). An Evaluation of the Factors Affecting the Quality of Highway Runoff in the Austin, Texas Area. Technical Report CRWR 264, Center for Research in Water Resources. Bureau of Engineering Research. University of Texas at Austin. September 1995. Posted at: http://www.crwr.utexas.edu/reports/pdf/1995/rpt95-9.pdf Kayhanian, M. and Borroum, S. (2000). Regional Highway Stormwater Runoff Characteristics in California. Presented at: California Water Environment Association, 72nd Annual Conference, April 16-19, 2000. Sacramento, CA. Posted at http://www.owp.csus.edu/research/papers/papers/PP010.pdf Kayhanian, M., Singh, A., Suverkropp, C., and Borroum, S. (2003). Impact of Annual Average Daily Traffic on Highway Runoff Pollutant Concentrations. J. Environmental Engineering 129(11): 975-990. November 2003. La Mirada (2005). Sampling and Analysis Report for Storm Water Sampling at Drain Inlets with Inserts. Prepared for the City of La Mirada by AEI-CASC Engineering. April 2005. LADPW (2000). Los Angeles County 1994-2000 Integrated Receiving Water Impacts Report. Los Angeles County Department of Public Works. July 31, 2000. Posted at: http://ladpw.org/wmd/NPDES/IntTC.cfm LADPW (2004a). Los Angeles County 2003-2004 Stormwater Monitoring Report. Los Angeles County Department of Public Works. August 15, 2004. Posted at: http://ladpw.org/wmd/NPDES/report_directory.cfm LADPW (2004b). Los Angeles County 2002-2003 Hydrologic Report, Stream Gaging Station Peak Flow. Los Angeles County Department of Public Works. Posted at: http://ladpw.org/wrd/report/0203/runoff/peak.cfm LADPW (2005). Los Angeles County 1994-2005 Integrated Receiving Water Impacts. Final Report. Los Angeles County Department of Public Works. August 2005. Posted at: http://ladpw.org/wmd/NPDES/report_directory.cfm
-45-

LARWQCB (2001). Order No. 01-182, NPDES Permit No. CAS004001, Waste Discharge Requirements for Municipal Storm Water and Urban Runoff Discharges within the County of Los Angeles, and the Incorporated Cities Therein, except the City of Long Beach. Los Angeles Regional Water Quality Control Board. December 13, 2001. Posted at: http://www.waterboards.ca.gov/losangeles/html/programs/stormwater/la_ms4_final/FinalPermit.pdf LARWQC (2004). Watershed Management Initiative Chapter. Los Angeles Regional Water Quality Control Board. October, 2004. Posted at: http://www.waterboards.ca.gov/losangeles/docs/wmi2004/webchapter04.pdf LASGRWC (2005). Los Angeles Basin Water Augmentation Study: Phase II Final Report, Appendix C. Los Angeles and San Gabriel Rivers Watershed Council, with assistance from Geomatrix Consultants. August 2005. Posted at: http://www.lasgrwc.org/WAS.htm Latimer, J.S., Hoffman, E.J., Hoffman, G., Fasching, J.L. and Quinn, J.G. (1990). Sources of Petroleum Hydrocarbons in Urban Runoff. Water, Air, and Soil Pollution 52:1-21. Lee, K., Kim, S. and Stenstrom, M.K. (2005). Design of Storm Water in Monitoring Programs. (Appendix in: Industrial Stormwater Program: Existing Statewide Permit Utility and Proposed Modifications.) January 2005. Posted at: http://www.waterboards.ca.gov/stormwtr/docs/indcomments/BACKUP_NOTUSED/lfcw_exe_ucla_monitoringe_final2005.pdf Long Beach (2005). City of Long Beach Storm Water Monitoring Report 2001-2002. Prepared for the City of Long Beach by Kinnetic Laboraties, Inc. and Southern California Water Research Project. July 2002. Posted at: http://www.lbstormwater.org/annualreport/Report/LongBeach2002FinalReport.pdf Lopes T.J., and Dionne, S.G. (1998). A Review of Semivolatile and Volatile Organic Compounds in Highway Runoff and Urban Stormwater. U.S. Geological Survey. Open-File Report 98-409. Posted at: http://ma.water.usgs.gov/FHWA/products/ofr98-409.pdf Makepeace, D.K., Smith, D.W., and Stanley, S.J. (1995). Urban Stormwater Quality: Summary of Contaminant Data. Critical Reviews in Environmental Science and Technology, 25(2):93-139. Marsalek, J. (1990). Evaluation of Pollutant Loads from Urban Nonpoint Sources. Water Science. Tech. 22(10/11):23-30. Ministry of Transport (2002). Emission Factors for Contaminants Released by Motor Vehicles in New Zealand. Prepared for the Ministry of Transport and Infrastructure Auckland by Paul Kennedy and Jennifer Gadd, Kinget Mitchell Ltd. December 2002.
-46-
Ministry of Transport (2004). The New Zealand Vehicle Emissions Screening Programme: Resource Document. New Zealand. November 2004. Posted at: http://www.transport.govt.nz/assets/PDFs/nzvesp-resource-doc22nov04.pdf NOAA (1996). Aerial Observations of Oil at Sea. HAZMAT Report 96-7. Modeling and Simulation Studies Branch. Hazardous Materials Response and Assessment Division. Office of Ocean Resources Conservation and Assessment, National Oceanic and Atmospheric Administration. Seattle, Washington. NRC (2003). Oil in the Sea III: Inputs, Fates and Effects. National Research Council, Ocean Studies Board and Marine Board. National Academy Press, Washington, D.C. OEHHA (2004). Used Oil in Bunker Fuel: A Review of Potential Human Health Implications. Office of Environmental Health Hazard Assessment. Sacramento, California. Posted at: http://www.oehha.ca.gov/risk/exposure_assess/bunker.html. Oltmann, R.N., Guay, J.R., and Shay, J.M. (1987). Rainfall and runoff quantity and quality data collected at four urban land-use catchments in Fresno, California, October 1981-April 1983. U.S. Geological Survey, Open-File Report 84-718. 1987 Posted at: http://pubs.er.usgs.gov/pubs/ofr/ofr84718. Pitt, R. (2002). Receiving Water Impacts Associated with Urban Runoff. In Hoffman, D., Rattner, B., Burton, G.A., Jr., and Cairns, J., Jr. Handbook of Ecotoxicology, 2nd Edition, CRC-Lewis. Boca Raton, FL. Pitt, R. Maestre, A., Morquecho, R. (2004). The National Stormwater Quality Database (NSQD), version 1.1. Department of Civil and Environmental Engineering University of Alabama. February 16, 2004. Posted at: http://unix.eng.ua.edu/~rpitt/Research/ms4/Paper/Mainms4paper.html Potter T.L., Simmons K.E., editors (1998). Total Petroleum Hydrocarbon Criteria Working Group Series, Volume 2: Composition of Petroleum Mixtures. Amherst, Massachusetts: Amherst Scientific Publishers. Pruell, R.J. and Quinn, J.G. (1988). Accumulation of Polycyclic Aromatic Hydrocarbons in Crankcase Oil. Environmental Pollution 49(2):87-97. Rabanal F.I. and Grizzard, T.J. (1995). Concentrations of Selected Constituents in Runoff from Impervious Surfaces in Four Urban Catchments of Different Land Use. Fourth Biennial Stormwater Research Conference, Florida. RWQCB (2005). Personal communication, Regional Water Quality Control Board staff. July 2005.
-47-

Sacramento County (2004). Discharge Monitoring Report 2003/204. Prepared for the Sacramento Stormwater Management Program by: Larry Walker Associates. September 2004. Posted at: http://www.msa.saccounty.net/sactostormwater/documents/reports/0304-Joint-AR/Apx-E_DischargeMonRpt.pdf San Diego (2005). San Diego County Municipal Copermittees 2003-2004 Urban Runoff Monitoring: Final Report. Prepared for the County of San Diego by MEC Analytical Systems, in association with EnviroMatrix Analytical Services, Inc. January 2005. Posted at: http://www.projectcleanwater.org/html/wg_monitoring_03-04report.html SCCWRP (1986). Contaminants in Los Angeles River Storm Water Runoff. Southern California Coastal Water Research Project. Posted at: http://www.sccwrp.org/pubs/annrpt/1986/ar-03.htm Schueler, T.R. (1994). Hydrocarbon Hotspots in the Urban Landscape. Feature article from Watershed Protection Techniques. 1 (1): 3-5. SFBRWQCB (2004). Watershed Management Initiative, Integrated Plan Chapter. San Francisco Bay Regional Water Quality Control Board. October 2004. Posted at: http://www.waterboards.ca.gov/rwqcb2/watershedmanagement.htm Silverman, G., Stenstrom, M.K. and Fam, S. (1985). Evaluation of Hydrocarbons in Runoff to San Francisco Bay. Association of Bay Area Governments. September 1985. Stenstrom, M.K., Silverman, G.S., and Bursztynsky, T.A. (1984). Oil and Grease in Urban Stormwaters. Journal of the Environmental Engineering Division. Journal of Environmental Engineering. 110(1):58-72. February 1984. Stenstrom, M.K., and Strecker, E. (1993). Assessment of Storm Drain Sources of Contaminants to Santa Monica Bay. Volume I: Annual Pollutants Loadings to Santa Monica Bay from Stormwater Runoff. May, 1993 Stenstrom, M.K., and Kayhanian, M. (2005). First Flush Phenomenon Characterization. Prepared for the California Department of Transportation, Division of Environmental Analysis. August 2005. Posted at: http://www.dot.ca.gov/hq/env/stormwater/special/newsetup/_pdfs/monitoring/CTSW-RT-05-073-02-6_First_Flush_Final_9-30-05.pdf SWRCB (1997). Fact Sheet for State Water Resources Control Board Water Quality Order No. 97-03-DWQ. National Pollutant Discharge Elimination System. General Permit No. CAS000001. State Water Resources Control Board. Posted at: http://www.waterboards.ca.gov/stormwtr/docs/induspmt.pdf SWRCB (2005a). Industrial Storm Water Program. Storm Water Program. State Water Resources Control Board. Posted at:
-48-

http://www.waterboards.ca.gov/stormwtr/industrial.html SWRCB (2005b). Municipal Program. Storm Water Program. State Water Resources Control Board. November 29, 2005. Posted at: http://www.waterboards.ca.gov/stormwtr/municipal.html SWRCB (2005c). Annual Report Stormwater Data. State Water Resources Control Board. February 2005. Posted at: http://www.waterboards.ca.gov/stormwtr/industrial.html SWRCB (2005d). General Stormwater Permittees Regional Databases. Storm Water Program. State Water Resources Control Board. Posted at: http://www.swrcb.ca.gov/stormwtr/indpmt.html Tiefenthaler, L.L., Schiff, K.C., and Bay, S.M. (2001). Characteristics of Parking Lot Runoff Produced by Simulated Rainfall. Technical Report 343. Southern California Coastal Water Research Project. July 2001. U.S. EPA (1984). Composition and Management of Used Oil Generated in the United States. United States Environmental Protection Agency, Office of Solid Waste and Emergency Response. Washington, D.C. U.S. EPA (1986). Quality Criteria for Water. EPA440/5-86-001. United States Environmental Protection Agency, Office of Water Regulations and Standards. Washington, D.C. May 1, 1986. U.S. EPA (1990). Federal Register 55(222): 47990-48091. United States Environmental Protection Agency, November 16, 1990 U.S. EPA (1992a). National Pollutant Discharge Elimination System Storm Water Sampling Guidance Document. EPA-833-B-92-001. United States Environmental Protection Agency, National Exposure Research Laboratory; Microbiological and Chemical Exposure Assessment Research Division, Office of Water. July 1992. U.S. EPA (1992b). Guidance Manual for the Preparation of Part 2 of the NPDES Permit Applications for Discharges from Municipal Separate Storm Sewer Systems. United States Environmental Protection Agency, Office of Water. November 1992. Posted at www.epa.gov/npdes/pubs/owm0246.pdf U.S. EPA (1993). Handbook: Urban Runoff Pollution Prevention and Control Planning. EPA/625/R-93/004. United States Environmental Protection Agency, Office of Research and Development. Washington, D.C. September 1993. U.S. EPA (1998). Test Methods for Evaluating Solid Waste, Physical/Chemical Methods. Method 9071B. N-Hexane Extractable Material (HEM) for Sludge, Sediment, and Solid Samples. United States Environmental Protection Agency, Office of Solid Waste;
-49-

Economic, Methods and Risk Analysis Division. Posted at: http://www.epa.gov/epaoswer/hazwaste/test/pdfs/9071b.pdf U.S. EPA (1999). Method 1664, Revision A: N-Hexane Extractable Material (HEM: Oil and Grease) and Silica Gel Treated N-Hexane Extractable Material (SGT-HEM; Non-polar Material) by Extraction and Gravimetry. EPA-821-R-98-002. United States Environmental Protection Agency, Office of Water. Posted at: http://www.epa.gov/waterscience/methods/16640514.pdf U. S. EPA (2000a). Water Quality Standards; Establishment of Numeric Criteria for Priority Toxic Pollutants for the State of California; Rule. Federal Register 65(97): 31682-31719. May 18, 2000. U.S. EPA (2000b). Analytical Method Guidance for EPA Method 1664A Implementation and Use (40 CFR part 136). EPA/821-R-00-003. United States Environmental Protection Agency, Office of Water. Posted at: http://www.epa.gov/waterscience/methods/1664guide.pdf U.S. EPA (2002). Urban Stormwater BMP Performance Monitoring: A Guidance Manual for Meeting the National Stormwater BMP Database Requirements. United States Environmental Protection Agency, Office of Water. Prepared by GeoSyntec Consultants and the American Society of Civil Engineers. U.S. EPA (2003). Stormwater Frequently Asked Questions. United States Environmental Protection Agency, Office of Water. Posted at: http://cfpub.epa.gov/npdes/faqs.cfm?program_id=6#1 U.S. EPA (2004). National Recommended Water Quality Criteria. Office of Water. Office of Science and Technology. United States Environmental Protection Agency. Posted at: http://www.epa.gov/waterscience/criteria/nrwqc-2004.pdf U.S. EPA (2005a). National Management Measures to Control Nonpoint Source Pollution from Urban Areas. United States Environmental Protection Agency. EPA-841-B-05-004. November, 2005. Posted at: http://www.epa.gov/nps/urbanmm/pdf/urban_intro.pdf U.S. EPA (2005b). Stormwater Discharge from Industrial Facilities: Overview. United States Environmental Protection Agency. Posted at: http://cfpub.epa.gov/npdes/stormwater/indust.cfm U.S. EPA (2006). What is Nonpoint Source (NPS) Pollution? Questions and Answers. United States Environmental Protection Agency. Last updated February 22, 2006. Posted at http://www.epa.gov/owow/nps/qa.html
-50-

Ventura County (2001). Ventura Countywide Stormwater Quality Management Program, Annual Report, Appendix B. Ventura County Flood Control District. Posted at: http://www.vcstormwater.org/ar-appendices01.pdf Ventura County (2002). Ventura Countywide Stormwater Quality Management Program,. Annual Report for Permit Year 2, Reporting Year 8. Ventura County Flood Control District. October 1, 2002. Posted at: http://www.vcstormwater.org/ar2002.pdf Ventura County (2003). Ventura Countywide Stormwater Quality Management Program, Annual Report for Permit Year 3, Reporting Year 9. Ventura County Flood Control District. October 2003. Posted at: http://www.vcstormwater.org/final2002-03.pdf Ventura County (2004). Ventura Countywide Stormwater Quality Management Program, Annual Report for Permit Year 4, Reporting Year 10. Ventura County Flood Control District. October 2004. Posted at: http://www.vcstormwater.org/publications.htm Ventura County (2005). Ventura Countywide Stormwater Quality Monitoring Report. Ventura County Flood Control District. July 2005. Posted at: http://www.vcstormwater.org/2005AR.pdf Wu, J.S., et al. (1998). Characterization and Pollutant Loading Estimation for Highway Runoff. Journal of Environmental Engineering. July 1998. Young, T., Green, P., Hwang, H., and Kayhanian, M. (2004). Contaminants on Fine Particles in Highway Storm Water Runoff. University of California, Davis. Presented at the Society of Environmental Toxicology and Chemistry 25th Annual Meeting in North America.
-51-

APPENDIX A Stormwater Runoff: Regulatory Background
Under the Clean Water Act, all facilities discharging pollutants from any point source into waters of the United States are regulated under the National Pollutant Discharge Elimination System (NPDES). At the onset of the NPDES Program in the early 1970s, the focus was primarily on reducing pollutants in discharges of industrial process wastewater and municipal sewage. However, as pollution controls were implemented for these sources, it became evident that more diffuse sources, including urban runoff, were also major causes of water quality problems. As a result, the 1987 amendments to the Clean Water Act specified that certain stormwater discharges – which are generally discharged through conveyances such as separate stormwater sewage systems -- are point sources that are subject to NPDES permit requirements (U.S. EPA, 1990). NPDES regulations are promulgated by the U.S. Environmental Protection Agency. In California, the NPDES Program is administered by the State Water Resources Control Board and the nine Regional Water Quality Control Boards (SWRCB, 2005a, b). The NPDES stormwater permit regulations cover stormwater discharges from:
municipal separate storm sewer systems (MS4s) in urbanized areas; industrial facilities in any of the eleven categories that discharge to an MS4 or to
waters of the United States; and, construction activity that disturbs land areas of one or more acres.
(U.S. EPA, 2003) Municipal separate storm sewer system (MS4) permits A municipal separate storm sewer (MS4) is a conveyance or system of conveyances, (including roads with drainage systems, municipal streets, catch basins, curbs, gutters, ditches, man-made channels, or storm drains) designed for collecting and conveying stormwater, which is not a combined sewer nor part of a publicly owned treatment works, and which is owned or operated by a state or local government entity (40 Code of Federal Regulations, Section 122.26(b)(8)). The MS4 permits require the discharger to develop and implement a Storm Water Management Plan with the goal of reducing the discharge of pollutants to the maximum extent practicable. The management programs specify what best management practices (BMPs) will be used to address certain program areas. The program areas include public education and outreach; illicit discharge detection and elimination; construction and post-construction; and good housekeeping for municipal operations. In general, medium and large municipalities are required to conduct chemical monitoring, though small municipalities are not (SWRCB, 2005a). Storm Water Management Plans generally include provisions for reducing the amounts of oil in stormwater. For example, municipalities promote used oil recycling, proper management of used oil at municipal facilities and minimization of oil buildup on streets and parking areas within the control
APPENDIX A Page A-1

of the jurisdiction (City of Santa Rosa/County of Sonoma/Sonoma County Water Agency, 2004). Caltrans MS4 permit Caltrans is subject to an NPDES permit in those areas of the State requiring an MS4 storm water permit. A statewide permit has been issued to enable Caltrans to implement a uniform stormwater program. This permit covers stormwater discharges from all Caltrans highways, properties, activities and facilities throughout the State, and stormwater discharges associated with construction activity including clearing, grading, and excavation (SWRCB, 1999). As with other MS4 permittees, Caltrans must implement a Stormwater Management Plan to reduce or prevent pollutants in stormwater discharges and authorized non-stormwater discharges. The permit also addresses requirements for training and public education, and program evaluation and monitoring. Industrial permits In order to minimize the impact of stormwater discharges from industrial facilities, the NPDES program includes an industrial stormwater permitting component. Operators of industrial facilities included in one of the 11 categories of stormwater discharges associated with industrial activity that discharge or have the potential to discharge stormwater to an MS4 or directly to receiving waters require an NPDES industrial stormwater permit. (Construction activity is one of these 11 categories, but is covered under a separate type of permit because of the significantly different nature of its operations.) (U.S. EPA, 2005b) Industrial stormwater permits require the implementation of management measures that will achieve the performance standard of best available technology economically achievable and best conventional pollutant control technology. Permittees are also required to develop a stormwater pollution prevention plan designed to identify sources of pollutants and ways to reduce storm water pollution from these sources, and a monitoring plan (SWRCB, 2005b). Industrial facilities in municipalities with an MS4 NPDES permit may be subject not only to the requirements of their stormwater permit, but also to local ordinances that address the discharge of pollutants into the MS4. Further, certain industries that are not required to obtain a NPDES stormwater permit, such as retail gasoline outlets, may be covered by stormwater-related provisions of a local ordinance pursuant to the latter’s stormwater management pollution prevention plan. Construction permits Dischargers whose projects disturb one or more acres of soil or whose projects disturb less than one acre but are part of a common plan of development involving one or more
APPENDIX A Page A-2

acres, are required to obtain coverage under the General Permit for Discharges of Storm Water Associated with Construction Activity. Construction activities subject to this permit include clearing, grading and disturbances to the ground such as stockpiling, or excavation. Regular maintenance activities performed to restore the original line, grade, or capacity of a facility are not covered. The Construction General Permit requires the development and implementation of a Storm Water Pollution Prevention Plan (SWPPP), which describes, among other things, BMPs the discharger will use to protect storm water runoff and visual, chemical and sediment monitoring programs (U.S. EPA, 2005). References: City of Santa Rosa/County of Sonoma/Sonoma County Water Agency, MS4 NPDES Term 2, Annual Report 1, July 1, 2003-June 30, 2004. October 1, 2004. Posted at: http://ci.santa-rosa.ca.us/pworks/other/SW/AnnRepSep30.pdf SWRCB (1999). Fact Sheet for National Pollutant Discharge Elimination System (NPDES) Permit for Storm Water Discharges from the State of California, Department of Transportation (Caltrans) Properties, Facilities, and Activities (Order No. 99-06 DWQ). State Water Resources Control Board. July 15,1999. Posted at: http://www.waterboards.ca.gov/stormwtr/docs/caltranspmt.pdf SWRCB (2005a). Municipal Program. Storm Water Program. State Water Resources Control Board. November 29, 2005. Posted at: http://www.waterboards.ca.gov/stormwtr/municipal.html SWRCB (2005b). Industrial Storm Water Program. Storm Water Program. State Water Resources Control Board. Posted at: http://www.waterboards.ca.gov/stormwtr/industrial.html U.S. EPA (1990). Federal Register 55(222): 47990-48091. United States Environmental Protection Agency, November 16, 1990 U.S. EPA (2005). Stormwater Discharge from Industrial Facilities: Overview. United States Environmental Protection Agency. Posted at: http://cfpub.epa.gov/npdes/stormwater/indust.cfm
APPENDIX A Page A-3

APPENDIX B California Industrial Stormwater Discharges
Background Stormwater discharges from certain industrial facilities are subject to the requirements of a permit under the NPDES Program. Eleven categories of facilities are subject to this requirement, including: mining/oil and gas facilities; hazardous waste treatment, storage or disposal facilities; recycling facilities (such as metal scrap yards, battery reclaimers, salvage yards, and automobile dismantlers); transportation facilities that conduct any type of vehicle maintenance (such as fueling, cleaning, and repairing); and certain “light industries” where industrial materials, equipment or activities are exposed to stormwater (SWRCB, 1997). For the most part, these regulated facilities are identified in federal regulations by Standard Industrial Classification (SIC) Codes. SIC codes represent a category within the Standard Industrial Classification System administered by the U.S. government. The system uses a two-digit code designating major industry groups, which is coupled with a second two-digit code representing subcategories. Definitions of SIC codes found to have high oil and grease releases can be found in Attachment 1 of this appendix. California’s nine Regional Water Quality Control Boards administer the industrial stormwater NPDES Program. There are over 7,000 industrial facility permittees in the state. The following table shows the number of active permits by region (SWRCB, 2005a).
Approximate number of active permitted industrial NPDES stormwater facilities in 2005
Region Region name Approximate number of active sites
1 Northwest Coast 356 2 San Francisco Bay 1393 3 Central Coast 396 4 Los Angeles 2812 5 Central Valley
5R Redding 174 5S Sacramento 1134 5F Fresno 593
6 Lahontan 6A South Lake Tahoe 34 6B Victorville 165
7 Colorado River Basin 166 8 Santa Ana 1486 9 San Diego 699
APPENDIX B Page B-1

Regulatory requirements Major requirements of industrial NPDES permits include the following: Discharge limitations. Stormwater discharges are required to meet all applicable effluent limitations. Where numeric effluent limitations have not been established, facilities must implement best management practices (BMPs) to control pollutant discharges in stormwater. The Regional Boards in most instances have adopted the U.S. EPA’s oil and grease benchmark number of 15 mg/l, although benchmarks of 10, 20 and 40 mg/l have been used. These benchmarks are not necessarily protective of any specific receiving water, and exceedances of these benchmarks are not automatically considered permit violations. When benchmarks are exceeded, inspections by Regional Board staff may be triggered, and/or facilities may be required to re-evaluate the effectiveness of their BMPs and develop, when appropriate, additional BMPs (SWRCB, 1997; RWQCB). Stormwater Pollution Prevention Plan (SWPPP). Permittees must develop and implement a SWPPP. The objectives of the SWPPP are two-fold: (1) to identify and evaluate sources of pollutants associated with industrial activities that may affect the quality of stormwater discharges and authorized non-storm water discharges from the facility; and (2) to identify and implement site-specific BMPs to reduce or present pollutants associated with industrial activities in storm water discharges and authorized non-storm water discharges. BMPs are generally categorized as non-structural (e.g., good housekeeping, preventive maintenance, spill response, material handling and storage, employee training, and waste handling or recycling) and structural (e.g., treatment measures, runoff control devices, secondary containment structures, and overhead coverage). Non-stormwater discharges include waters from the rinsing or washing of vehicles, equipment, buildings, or pavement; materials that have been improperly disposed, or spilled or leaked materials. Monitoring program. Among other things, monitoring is used to assist in the implementation of the SWPPP and to measure the effectiveness of BMPs. Annual report. Each regulated facility must submit an Annual Report to their Regional Board by July 1 of each year. The report includes a summary and an analysis of visual observations and sampling results, and an explanation of why a facility did not implement any activities required by the permit. Laboratory analytical reports are submitted as part of the annual report. The annual reports are the sources of the data presented in this report. Data considerations Sample collection and analysis. Stormwater samples are generally collected by facility personnel from locations on the property as identified in the SWPPP. The NPDES permit requires that samples be collected during the first hour of discharge from the first storm of the wet season and at least one other storm; both storms should have been preceded by
APPENDIX B Page B-2

three working days without stormwater discharge. Sampling is conducted only during scheduled facility operating hours, and need not occur during adverse climatic conditions. Thus, required sampling conditions may not be met, as specified by the permit. Samples must be analyzed by state certified laboratories for pH, specific conductance, total suspended solids and total organic carbon. Oil and grease may be substituted for the total organic carbon. Database characteristics. The database was created by the State Water Resources Control Board by collecting and merging all available Regional Board electronic annual report data into one table (in Microsoft Access) (SWRCB, 2005b). The database includes the facility identification number, SIC code, the Regional Board with jurisdiction over the facility, fiscal year for which the report is submitted, and reported analytical results. The database used for this report included almost 30,000 entries, covering data from the 1993-94 through 2003-04 reporting years. Data Limitations. It is important to keep certain considerations in mind in interpreting the industrial NPDES data. The analytical data for oil and grease (and other parameters) are facility-reported concentrations measured from facility-collected discharge samples. In most cases, samples are collected by facility personnel with variable levels of training and familiarity with sample collection and storage requirements and protocol. Permit requirements allow some degree of flexibility in when samples are to be collected. Since pollutant concentrations may be highly variable throughout the course of a storm event as well as from storm-to-storm, the representativeness of a given sample is difficult, if not impossible, to ascertain. There may also be variability among the state-certified laboratories in carrying out sample analysis. With regard to the database, the statewide oil and grease (and other parameter) data are compiled using data submitted by the Regional Boards, with little quality assurance. The database does not include data from all Regional Boards, or for all compliance years. While most permitted facilities have been conducting the required sampling and monitoring, as well as complying with the annual reporting requirement to the Regional Boards, there have been delays in entering the data into an electronic database at the regional level, and in turn, the statewide database. Statewide summary A summary of the data reported statewide for oil and grease for the 2000-2001 to 2002-2003 reporting years can be found in the following table. For these years, the data are predominantly from the San Francisco Bay, Central Coast, Los Angeles, and Santa Ana Regions.
APPENDIX B Page B-3

APPENDIX B Page B-4
Summary of oil and grease data from Annual Report for Storm Water Discharges Associated with Industrial Activities
Reporting Year* 2000-2001 2001-2002 2002-2003
Number of oil and grease (O&G) samples
5192 4987 4778
Percent detect 80% 80% 76% Percent of O&G samples > 15 mg/l benchmark value
16% 16% 17%
O&G concentrations, mg/l Minimum 0 0 0 Maximum 1640 1802 1664 Mean including non-detects, mg/l
(Standard deviation) 11.2
(39.8) 13.7
(60.8) 12.5
(55.2) Mean without non-detects, mg/l
(Standard deviation) 13.8
(43.9) 17.2
(67.7) 16.4
(62.9) Median, mg/l 5 5 5 Mode 5 5 5 _______________ * The number of reports in the database for the years prior to 2000-01 and for 2003-2004, was significantly less than the years included in the table. As shown in the above table, oil and grease was detected in 76 to 80 percent of the samples; of these, about 16 percent exceeded the benchmark concentration of 15 mg/l. The most frequently reported concentrations were 0 and 5 mg/l. While the database does not provide information about the analytical detection limits for the samples, it is likely that the high frequency of 5 mg/l may be a reporting artifact because this concentration is generally the limit of detection for the method used for oil and grease analysis (U.S. EPA, 2000b). Attachment 2 presents summaries of oil and grease data for selected Regional Boards. The data appear to indicate that the more highly urbanized regions -- i.e., Los Angeles, Santa Ana, and San Francisco Bay -- have a higher proportion of samples above the benchmark than the more rural Central Coast. Although about 85 percent of all the samples had concentrations at or below 10 mg/l, significantly higher concentrations (over 100 mg/l) are occasionally reported. As shown on the above table and the graph below, maximum concentrations can exceed 1,000 mg/l. Prior to the 2000-2001 reporting year, even higher oil and grease concentrations (e.g., 33,200 mg/l) were found; however, such large spikes have not been reported since.
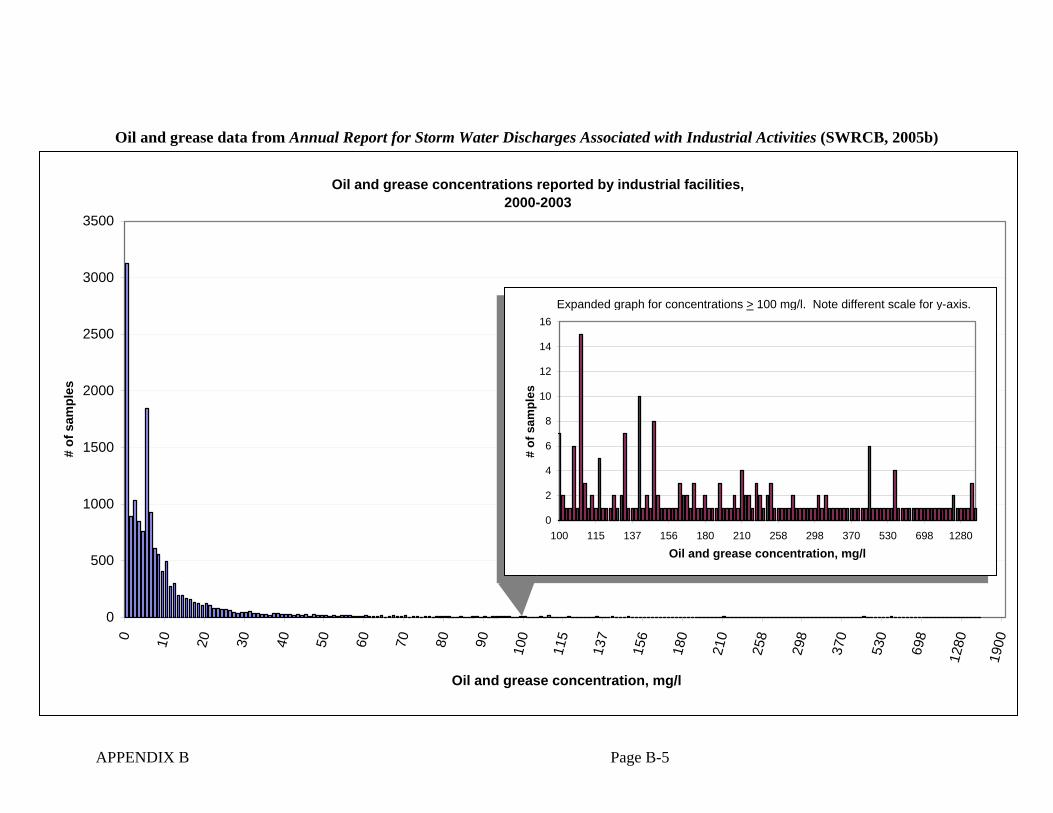
APPENDIX B Page B-5
Oil and grease data from Annual Report for Storm Water Discharges Associated with Industrial Activities (SWRCB, 2005b)
Oil and grease concentrations reported by industrial facilities,2000-2003
0
0 10 20 30 40 50 60 70 80 90 100
115
137
156
180
210
258
298
370
530
698
Oil and grease concentration, mg/l
500
1000
1500
2000
2500
3000
3500
1280
1900
# of
sam
ples
0
2
4
6
8
10
12
14
16
100 115 137 156 180 210 258 298 370 530 698 1280
Oil and grease concentration, mg/l
# of
sam
ples
Expanded graph for concentrations > 100 mg/l. Note different scale for y-axis.
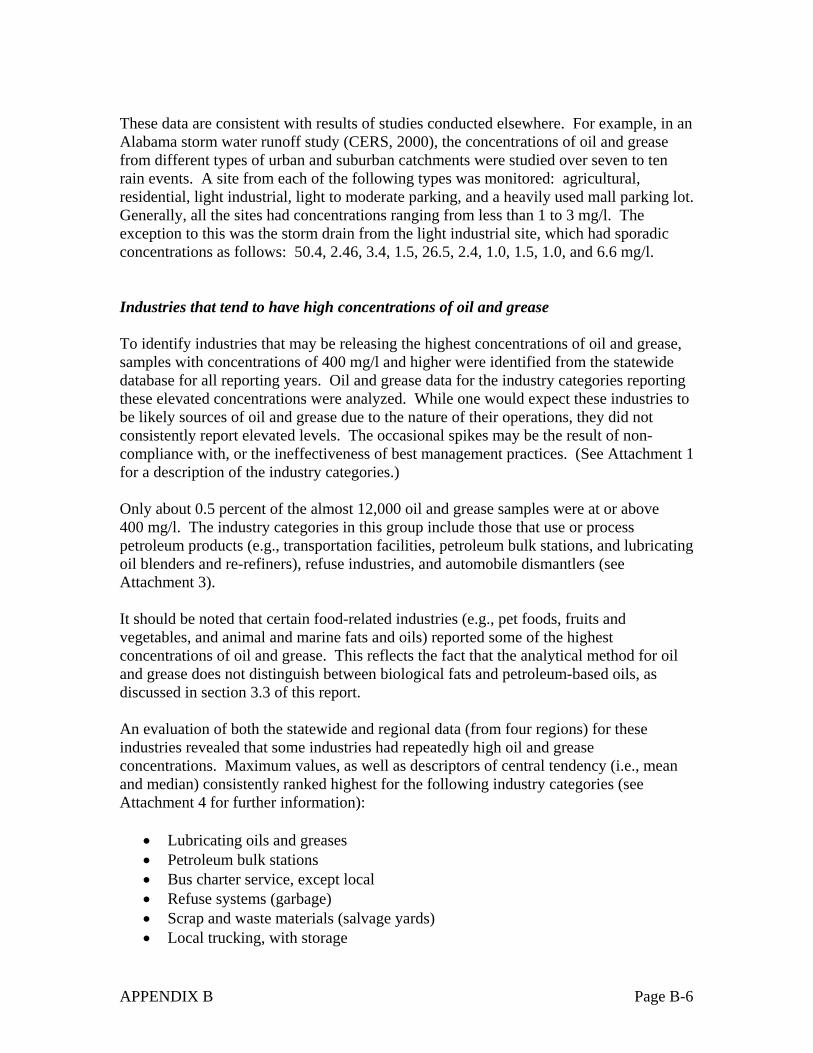
These data are consistent with results of studies conducted elsewhere. For example, in an Alabama storm water runoff study (CERS, 2000), the concentrations of oil and grease from different types of urban and suburban catchments were studied over seven to ten rain events. A site from each of the following types was monitored: agricultural, residential, light industrial, light to moderate parking, and a heavily used mall parking lot. Generally, all the sites had concentrations ranging from less than 1 to 3 mg/l. The exception to this was the storm drain from the light industrial site, which had sporadic concentrations as follows: 50.4, 2.46, 3.4, 1.5, 26.5, 2.4, 1.0, 1.5, 1.0, and 6.6 mg/l. Industries that tend to have high concentrations of oil and grease To identify industries that may be releasing the highest concentrations of oil and grease, samples with concentrations of 400 mg/l and higher were identified from the statewide database for all reporting years. Oil and grease data for the industry categories reporting these elevated concentrations were analyzed. While one would expect these industries to be likely sources of oil and grease due to the nature of their operations, they did not consistently report elevated levels. The occasional spikes may be the result of non-compliance with, or the ineffectiveness of best management practices. (See Attachment 1 for a description of the industry categories.) Only about 0.5 percent of the almost 12,000 oil and grease samples were at or above 400 mg/l. The industry categories in this group include those that use or process petroleum products (e.g., transportation facilities, petroleum bulk stations, and lubricating oil blenders and re-refiners), refuse industries, and automobile dismantlers (see Attachment 3). It should be noted that certain food-related industries (e.g., pet foods, fruits and vegetables, and animal and marine fats and oils) reported some of the highest concentrations of oil and grease. This reflects the fact that the analytical method for oil and grease does not distinguish between biological fats and petroleum-based oils, as discussed in section 3.3 of this report. An evaluation of both the statewide and regional data (from four regions) for these industries revealed that some industries had repeatedly high oil and grease concentrations. Maximum values, as well as descriptors of central tendency (i.e., mean and median) consistently ranked highest for the following industry categories (see Attachment 4 for further information):
• Lubricating oils and greases • Petroleum bulk stations • Bus charter service, except local • Refuse systems (garbage) • Scrap and waste materials (salvage yards) • Local trucking, with storage
APPENDIX B Page B-6

• Railroads, line-haul operating • Concrete products, except block & brick • Terminal/service facilities for motor vehicle passenger transportation • Metal stampings • Adhesives and sealants • Pumps and pumping equipment • Fabricated metal products • Motor vehicle parts, used
References CERS (2000). Characteristics of Pollutants in Storm Water Runoff from Dothan, Alabama Catchments: Implications for Phase II Storm Water Management. Center for Environmental Research and Service. Prepared for the Alabama Department of Environmental Management. Troy State University, Troy, AL 36082. May 26, 2000. SWRCB (1997). Fact Sheet for State Water Resources Control Board Water Quality Order No. 97-03-DWQ. National Pollutant Discharge Elimination System. General Permit No. CAS000001. State Water Resources Control Board. Posted at: http://www.waterboards.ca.gov/stormwtr/docs/induspmt.pdf RWQCB (2005). Personal communication, Regional Water Quality Control Board staff. July 2005. SWRCB (2005a). General Stormwater Permittees Regional Databases. Storm Water Program. State Water Resources Control Board. Posted at: http://www.swrcb.ca.gov/stormwtr/indpmt.html SWRCB (2005b). Annual Report Stormwater Data. State Water Resources Control Board. February 2005. Posted at: http://www.waterboards.ca.gov/stormwtr/industrial.html U.S. EPA (2000). Analytical Method Guidance for EPA Method 1664A Implementation and Use (40 CFR part 136). EPA/821-R-00-003. United States Environmental Protection Agency, Office of Water. Posted at: http://www.epa.gov/waterscience/methods/1664guide.pdf
APPENDIX B Page B-7

APPENDIX B: ATTACHMENT 1
Standard Industrial Codes (SIC) Definitions for Industries Reporting High Concentrations of Oil and Grease in Stormwater
2891 Adhesives Establishments primarily engaged in manufacturing industrial and household adhesives, glues, caulking compounds, sealants, and linoleum, tile, and rubber cements from vegetable, animal, or synthetic plastics materials, purchased or produced in the same establishment. Does not include the manufacture of gelatin or agar-agar.
2992 Lubricating Oils and Greases Establishments primarily engaged in blending, compounding, and re-refining lubricating oils and greases from purchased mineral, animal, and vegetable materials. Examples of lubricating oils and greases are lubricating and cutting oils, greases, brake, hydraulic, and transmission fluids, and rust arresting compounds, and animal and vegetable oil base. Petroleum refineries engaged in the production of lubricating oils and greases are classified in Industry 2911. 3272 Concrete Products, except Block and Brick Establishments primarily engaged in manufacturing concrete products, except brick, from a combination of cement and aggregate. Contractors engaged in concrete construction work are classified in Division C, Construction, and establishments primarily engaged in mixing and delivering ready-mixed concrete are classified in Industry 3273. Some examples of concrete products from this SIC are: art marble, cast stone, concrete bathtubs, burial vaults, ceiling squares, culvert pipes, drain tiles, concrete fireplaces, and floor tiles. 3469 Metal Stampings Establishments primarily engaged in manufacturing metal stampings and spun products, including porcelain enameled products. Products of this industry include household appliance housings and parts; cooking and kitchen utensils; and other non-automotive job stampings. Some products examples of this category are: appliance parts, ashcans, license tags, bottle openers, garbage cans, furniture, lunch boxes, machine parts, mail boxes, pails, pans, and patterns on metal. 3499 Fabricated Metal Products Establishments primarily engaged in manufacturing fabricated metal products such as fire or burglary resistive steel safes and vaults; collapsible tubes of thin flexible metal. Also included are metal boxes, ladders, household articles, ice cream freezers, ironing boards, automobile seat frames, ammunition boxes, aerosol values, furniture parts, and locks. . 3561 Pumps and Pumping Equipment Establishments primarily engaged in manufacturing pumps and pumping equipment for general industrial, commercial, or household use, except fluid power pumps and motors.
APPENDIX B, Attachment 1 Page B-1-1
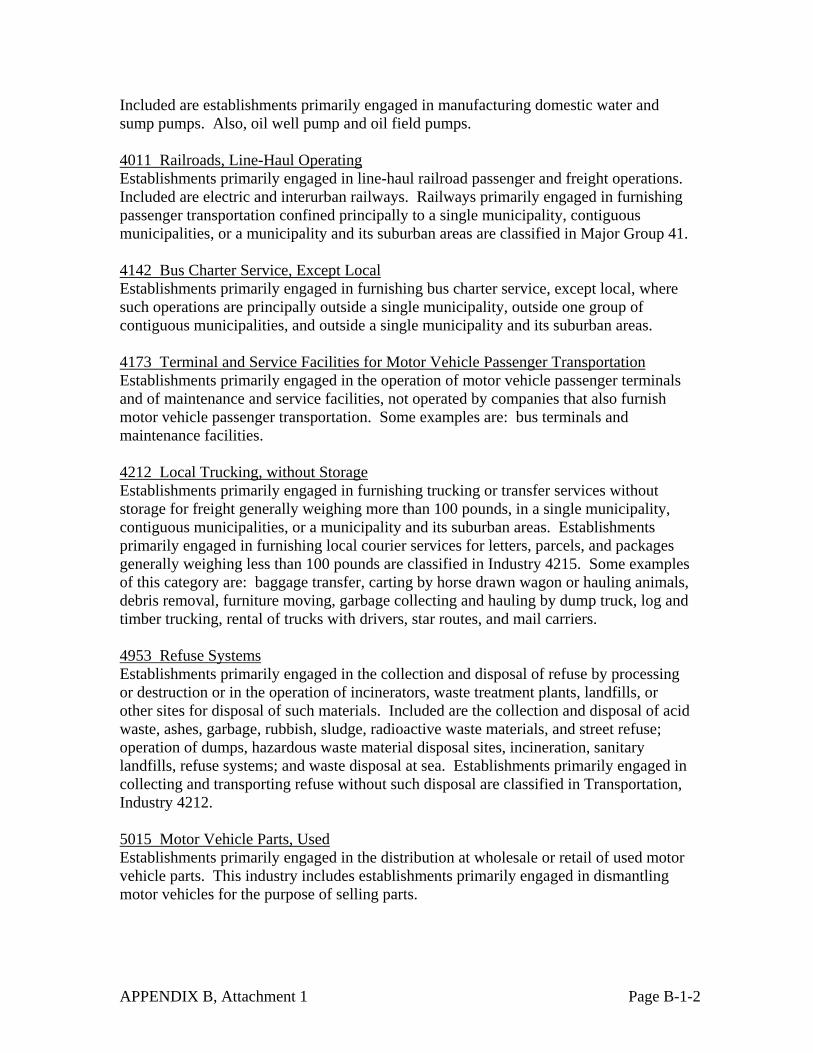
Included are establishments primarily engaged in manufacturing domestic water and sump pumps. Also, oil well pump and oil field pumps. 4011 Railroads, Line-Haul Operating Establishments primarily engaged in line-haul railroad passenger and freight operations. Included are electric and interurban railways. Railways primarily engaged in furnishing passenger transportation confined principally to a single municipality, contiguous municipalities, or a municipality and its suburban areas are classified in Major Group 41. 4142 Bus Charter Service, Except Local Establishments primarily engaged in furnishing bus charter service, except local, where such operations are principally outside a single municipality, outside one group of contiguous municipalities, and outside a single municipality and its suburban areas. 4173 Terminal and Service Facilities for Motor Vehicle Passenger Transportation Establishments primarily engaged in the operation of motor vehicle passenger terminals and of maintenance and service facilities, not operated by companies that also furnish motor vehicle passenger transportation. Some examples are: bus terminals and maintenance facilities. 4212 Local Trucking, without Storage Establishments primarily engaged in furnishing trucking or transfer services without storage for freight generally weighing more than 100 pounds, in a single municipality, contiguous municipalities, or a municipality and its suburban areas. Establishments primarily engaged in furnishing local courier services for letters, parcels, and packages generally weighing less than 100 pounds are classified in Industry 4215. Some examples of this category are: baggage transfer, carting by horse drawn wagon or hauling animals, debris removal, furniture moving, garbage collecting and hauling by dump truck, log and timber trucking, rental of trucks with drivers, star routes, and mail carriers. 4953 Refuse Systems Establishments primarily engaged in the collection and disposal of refuse by processing or destruction or in the operation of incinerators, waste treatment plants, landfills, or other sites for disposal of such materials. Included are the collection and disposal of acid waste, ashes, garbage, rubbish, sludge, radioactive waste materials, and street refuse; operation of dumps, hazardous waste material disposal sites, incineration, sanitary landfills, refuse systems; and waste disposal at sea. Establishments primarily engaged in collecting and transporting refuse without such disposal are classified in Transportation, Industry 4212. 5015 Motor Vehicle Parts, Used Establishments primarily engaged in the distribution at wholesale or retail of used motor vehicle parts. This industry includes establishments primarily engaged in dismantling motor vehicles for the purpose of selling parts.
APPENDIX B, Attachment 1 Page B-1-2

5093 Scrap and Waste Materials Establishments primarily engaged in assembling, breaking up, sorting, and wholesale distribution of scrap and waste materials. This industry includes auto wreckers engaged in dismantling automobiles for scrap. Also are automotive wrecking, bottles, fur cuttings, metal, iron and steel, junk and scrap, oil, plastics, rags, textiles, rubber, and wastepaper waste wholesale. Establishments engaged in dismantling cars for the purpose of selling secondhand parts are classified in Industry 5015. 5171 Petroleum Bulk Stations Establishments primarily engaged in the wholesale distribution of crude petroleum and petroleum products, including liquefied petroleum gas, from bulk liquid storage facilities. Reference: U.S. Department of Labor, Occupational Safety & Health Administration, SIC Division Structure. Posted at: http://www.osha.gov/pls/imis/sic_manual.html
APPENDIX B, Attachment 1 Page B-1-3

APPENDIX B: ATTACHMENT 2
Summary of Oil and Grease (O&G) Data from Annual Reports for Storm Water Discharges Associated with Industrial Activities for Selected Regional Boards
Region 2, San Francisco Bay Regional Water Quality Control Board
(Reporting years 2001 to 2003) 2001-2002 2002-2003 2003-2004
No. of oil and grease samples 1,718 1,696 1,548 Oil and grease concentration, mg/l
Minimum 0 0 0 Maximum 1100 1490 880 Mean
(Standard deviation) 17.5
(69.7) 22.8
(107.1) 18.4
(61.3) Median without zeros 5.6 6.2 7.0 Median counting zeros 2.6 1.0 1.0
Number of O&G samples with concentrations > 15 mg/l
118 118 111
Percent of samples > 15 mg/l 11 % 11 % 12 %
Region 3, Central Coast Regional Water Quality Control Board (Reporting years 1999 to 2004)
1999
- 20
00
2000
- 20
01
2001
- 20
02
2002
- 20
03
2003
-20
04
2004
-20
05
No. of oil and grease samples 350 538 378 352 512 684 Oil and grease concentration, mg/l
Minimum 0 0 0 0.14 0 0 Maximum 1640 835 360 920 * 220 180 Mean
(Standard deviation) 27.7
(157.9) 12.2
(53.7)9.0
(24.1) 20.0
(84.4) 14.5
(27.3) 2.5
(8.1) Median without zeros 7 5.0 5.0 NA 0 5.8 Median counting zeros 1.2 5 5 6.6 7 0
Number of O&G samples with concentrations > 15 mg/l
18 38 28 30 39 20
Percent of samples > 15 mg/l 5 % 4 % 5 % 9 % 8 % 3% __________ * One facility was responsible for this elevated concentration, which skewed the statistics for this year.
APPENDIX B, Attachment 2 Page B-2-1

Region 4, Los Angeles Regional Water Quality Control Board (Reporting years 2000 to 2002)
2000 – 2001 2001 - 2002 2002 – 2003
No. of oil and grease samples 3,502 2,707 2,975 Oil and grease concentration, mg/l
Minimum 0 0 0 Maximum 1000 1664 1664
Mean (Standard deviation)
13.6 (38.4)
16.8 (66.1)
16.0 (53.2)
Median without zeros 5.8 6.1 6.4 Median counting zeros 5.8 5.4 5.1
Number of O&G samples with concentrations > 15 mg/l
505 484 492
Percent of samples > 15 mg/l 19 % 21 % 19 %
Region 8, Santa Ana Regional Water Quality Control Board (Reporting years 1997 to 2002)
1997
-19
98
1998
-19
99
1999
-20
00
2000
-20
01
2001
-20
02
2002
-20
03
No. of oil and grease samples 1,625 1,418 1,450 1,556 1,494 1,427 Oil and grease concentration, mg/l
Minimum 0 0 0 0 0 0 Maximum 33200 9200 2770 310 1802 923 Mean
(Standard deviation) 55*
(1048.5) 29
(308.8) 21
(107.5) 13
(23.9) 14
(62.7) 15
(51.5) Median without zeros 6.5 7 7 6.4 6.0 7 Median counting zeros 5 5 5 5 5 4
246 233 229 205 176 159 Number of O&G samples with concentrations > 15 mg/l Percent of samples > 15 mg/l 20 % 20 % 21 % 17 % 15 % 17 %
__________ *NOTE: Mean for 1997-1998 = 23.16 if maximum value is excluded. Reference: SWRCB (2005). Annual Report Stormwater Data. State Water Resources Control Board. February 2005. Posted at: http://www.waterboards.ca.gov/stormwtr/industrial.html
APPENDIX B, Attachment 2 Page B-2-2

APPENDIX B, Attachment 3 Page B-3-1
APPENDIX B: ATTACHMENT 3 Industry categories reporting oil and grease concentrations over 400 mg/l*
(Reporting years 1990 to 2004) Oil and grease
concentration, mg/l
Industry
SIC code
Number of
samples
Number of
facilities
Number of facilities reporting
concentrations > 15mg/l
Highest value
Second highest value
Lubricating oil 2992 144 29 10 33,200 1300 Fabricated metal products 3499 409 70 19 980 980 Guided missiles and space vehicles 3761 36 5 4 713 573 Flat glass 3211 2 1 1 1640 - Petroleum bulk stations and terminals 5171 134 42 6 1280 140 Wood office furniture 2521 23 5 1 835 190 Crude petroleum pipelines 4612 20 4 1 580 360 Railroads 4011 84 21 5 9200 1100 Laminated plastics plate, sheet and profile shapes
3083 55 8 1 920 600
Refuse systems 4953 818 172 60 1900 810 Motor vehicle parts, used 5015 771 351 114 1664 823 Scrap and waste materials 5093 740 220 109 643 560 Ship building and repairing 3731 38 8 2 880 28 Search detection navigation, guidance, 3812 36 11 3 928 560 Terminal service facilities for motor vehicle passenger transportation
4173 134 31 11 2770 110
Local trucking 4212 684 161 62 706 698 Trucking, except local 4213 562 171 36 640 413 Concrete products 3272 353 61 21 1802 1000 Miscellaneous non metallic minerals 1499 18 5 1 5440 5 Cement, hydraulic 3241 19 3 1 810 8 Pressed and blown glass 3229 23 5 3 1490 380 Adhesives and sealants 2891 43 26 7 1000 110 Aluminum die and castings 3363 131 34 11 1664 85 Switchgear and switch board apparatus 3613 14 5 1 923 8 Magnetic and recording optical media 3695 23 5 2 530 23 General warehousing and storage 4225 188 59 9 426 375 Metal stampings 3469 104 20 9 676 232 Misc. fabricated wire products 3496 40 9 3 650 140 Electric services 4911 313 52 12 1664 79 Special warehousing and storage 4226 31 9 2 938 38 Local and suburban transit 4111 154 44 18 476 230 Paints, varnishes, lacquers, enamels, and others
2851 224 58 9 400 150
Asphalt felts and coatings 2952 82 22 7 421 88 Bus charter service, except local 4142 36 9 6 413 200 Terminal maintenance for motor freight 4231 230 59 22 413 158 School buses 4151 305 99 24 413 310 Commercial printing, lithographic 2752 72 14 6 470 54 Industrial organic chemicals 2869 60 11 1 420 38 Pottery products 3269 20 5 2 413 20 Copper foundries 3366 10 1 1 450 230 General warehousing and storage 4225 202 61 426 375 Reference: SWRCB (2005). Annual Report Stormwater Data. State Water Resources Control Board. February 2005. Posted at: http://www.waterboards.ca.gov/stormwtr/industrial.html
* Industry categories associated with food or animal fats and oils have not been included

APPENDIX B, Attachment 4 PageB-4-1
APPENDIX B: ATTACHMENT 4
Highest Ranking Industry Categories based on Maximum, Median and Mean Oil and Grease Concentrations from Statewide and Selected Regional Databases
Source of data and value in the highest ranks*
Industry
SIC Code
Number of facilities Statewide reporting oil and
grease data
Number of facilities Statewide
reporting oil and grease
concentrations > 15 mg/l
StatewideDatabase
Central Coast
San
Francisco
Santa Ana
Los
Angeles
Lubricating oils and greases 2992 29 10 1, 2, 3 1, 2, 3 1, 2, 3 Petroleum bulk stations 5171 42 6 1, 2, 3 1, 2, 3 1 2, 3 Bus charter service, except local 4142 9 6 2, 3 1 1, 3 Refuse systems (garbage) 4953 172 60 1 1, 2, 3 1, 2, 3 1, 3 1, 2,3 Scrap and waste materials (salvage yards) 5093 220 109 1, 2, 3 1, 2, 3 1 Local trucking, with storage 4212 161 62 1, 2, 3 1, 2, 3 1 Railroads, line-haul operating 4011 21 5 1, 3 1, 2, 3 1, 2, 3 3 Concrete products, except block & brick 3272 61 21 1, 3 1, 2, 3 1, 2, 3 Terminal & service facilities for motor vehicle passenger transportation
4173 31 11 1, 3 1 1, 2, 3 1, 3 2
Metal stampings 3469 20 9 3 3 1, 2, 3 Adhesives and sealants 2891 26 7 1, 3 2, 3 1, 3 Pumps and pumping equipment 3561 13 4 2 2, 3 2 Fabricated metal products 3499 70 19 1 1, 3 3 Motor vehicle parts, used 5015 351 114 1 1, 2, 3 1 1
* Industry category was in the highest ranks based on 1 = maximum, 2 = median, 3 = mean oil and grease values Reference: SWRCB (2005). Annual Report Stormwater Data. State Water Resources Control Board. February 2005. Posted at: http://www.waterboards.ca.gov/stormwtr/industrial.html

APPENDIX C Annual Runoff Volume, Los Angeles County Watersheds
San Gabriel River (Stream Gaging Station No. F263C-R)
Season
Total Runoff (acre-ft) Season
Total Runoff (acre-ft) Season
Total Runoff (acre-ft) Season
Total Runoff (acre-ft)
1928-29 2,850 1947-48 8,590 1966-67 62,800 1985-86 31,244 1929-30 3,490 1948-49 6,470 1967-68 26,240 1986-87 21,994 1930-31 2,490 1949-50 4,130 1968-69 274,300 1987-88 23,684 1931-32 13,060 1950-51 558 1969-70 79,110 1988-89 20,899 1932-33 3,040 1951-52 50,900 1970-71 54,590 1989-90 28,677 1933-34 16,950 1952-53 13,880 1971-72 32,740 1990-91 24,904 1934-35 12,190 1953-54 10,990 1972-73 67,020 1991-92 30,460 1935-36 4,590 1954-55 9,250 1973-74 60,500 1992-93 273,200 1936-37∗ 32,240 1955-56 24,050 1974-75 38,190 1993-94 26,000 1937-38 94,810 1956-57 18,000 1975-76 32,000 1994-95 105,900 1938-39 24,620 1957-58 82,190 1976-77 16,670 1995-96 34,720 1939-40 20,180 1958-59 33,960 1977-78 256,222 1996-97 53,530 1940-41 100,900 1959-60 36,100 1978-79 36,943 1997-98 168,600 1941-42 28,630 1960-61 47,700 1979-80 201,315 1998-99 25,720 1942-43 209,600 1961-62 103,100 1980-81 23,902 1999-00 42,560 1943-44 104,200 1962-63 42,430 1981-82 23,162 2000-01 49,420 1944-45 42,520 1963-64 45,700 1982-83 118,084 2001-02 34,260 1945-46 34,370 1964-65 77,270 1983-84 22,254 2002-03 32,731 1946-47 45,420 1965-66 55,320 1984-85 22,522
All years Last ten years Minimum 558 25,720 Maximum 274,300 168,600 Mean 53,000 57,000 Standard deviation 61,000 46,000
∗ Record incomplete
Appendix C Page C-1
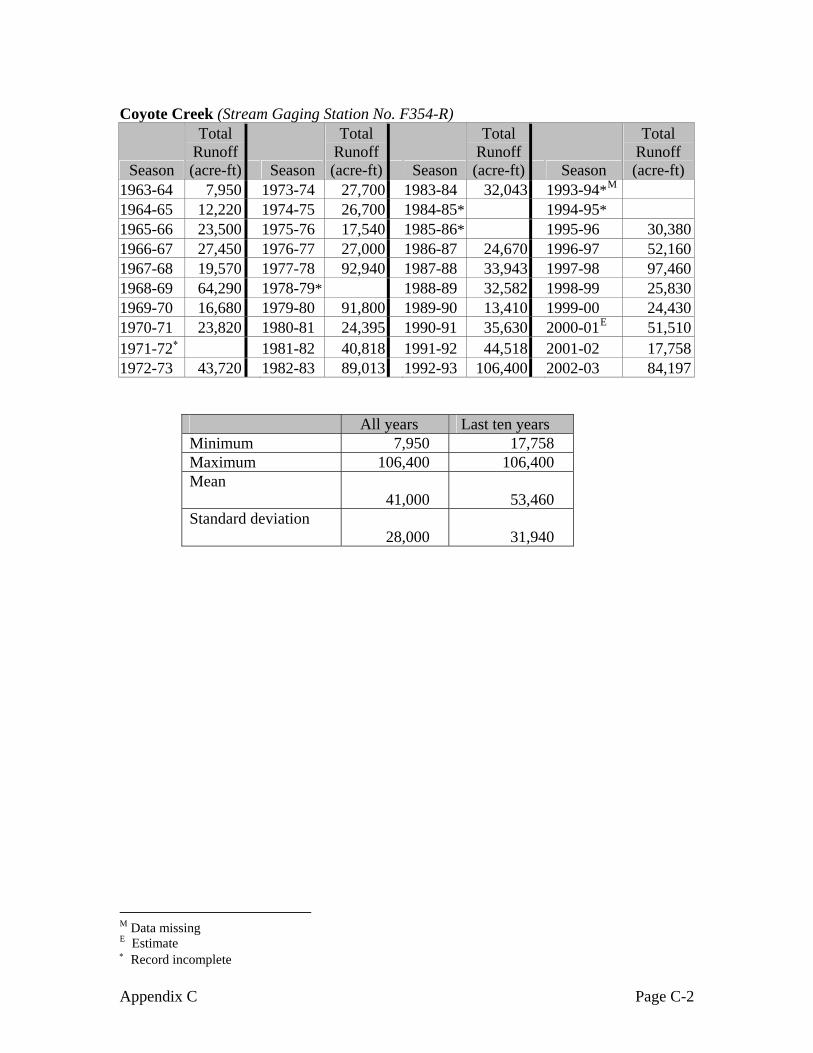
Coyote Creek (Stream Gaging Station No. F354-R)
Season
Total Runoff (acre-ft) Season
Total Runoff (acre-ft) Season
Total Runoff (acre-ft) Season
Total Runoff (acre-ft)
1963-64 7,950 1973-74 27,700 1983-84 32,043 1993-94*M 1964-65 12,220 1974-75 26,700 1984-85* 1994-95* 1965-66 23,500 1975-76 17,540 1985-86* 1995-96 30,380 1966-67 27,450 1976-77 27,000 1986-87 24,670 1996-97 52,160 1967-68 19,570 1977-78 92,940 1987-88 33,943 1997-98 97,460 1968-69 64,290 1978-79* 1988-89 32,582 1998-99 25,830 1969-70 16,680 1979-80 91,800 1989-90 13,410 1999-00 24,430 1970-71 23,820 1980-81 24,395 1990-91 35,630 2000-01E 51,510 1971-72∗ 1981-82 40,818 1991-92 44,518 2001-02 17,758 1972-73 43,720 1982-83 89,013 1992-93 106,400 2002-03 84,197
All years Last ten years Minimum 7,950 17,758 Maximum 106,400 106,400 Mean
41,000
53,460 Standard deviation
28,000
31,940
M Data missing E Estimate ∗ Record incomplete
Appendix C Page C-2

Ballona Creek (Stream Gaging Station No. F38C-R)
Season
Total Runoff (acre-ft) Season
Total Runoff (acre-ft) Season
Total Runoff (acre-ft) Season
Total Runoff (acre-ft)
1927-28 3,930 1946-47 26,300 1965-66 44,540 1984-85 27,714 1928-29 14,900 1947-48 13,630 1966-67 45,300 1985-86 49,043 1929-30 13,480 1948-49 16,090 1967-68 40,570 1986-87 13,986 1930-31 18,520 1949-50 23,250 1968-69 73,060 1987-88 41,772 1931-32 21,790 1950-51 18,860 1969-70 22,230 1988-89 27,763 1932-33 15,810 1951-52 53,350 1970-71 35,620 1989-90 23,364 1933-34 20,630 1952-53 19,910 1971-72 22,700 1990-91 27,133 1934-35 24,870 1953-54 28,480 1972-73 47,730 1991-92 45,191 1935-36 13,500 1954-55 21,600 1973-74 41,060 1992-93∗ 1936-37 40,680 1955-56 34,590 1974-75 34,590 1993-94 28,150 1937-38 52,500 1956-57 22,240 1975-76 22,230 1994-95 74,450 1938-39 28,490 1957-58 43,040 1976-77 27,930 1995-96 38,740 1939-40 21,110 1958-59 13,730 1977-78 81,659 1996-97 39,670 1940-41 67,360 1959-60 17,190 1978-79 43,680 1997-98 80,630 1941-42 17,250 1960-61 12,560 1979-80 70,454 1998-99 30,160 1942-43 34,240 1961-62 50,090 1980-81 20,111 1999-00 44,450
1943-44 33,000 1962-63 21,450 1981-82 29,922 2000-01 62,520
1944-45 24,450 1963-64 18,000 1982-83 86,347 2001-02 26,698 1945-46 18,380 1964-65 27,540 1983-84 26,672 2002-03 55,088
All years Last ten years Minimum 3,930
26,698 Maximum 86,347 80,630 Mean
34,000
48,060 Standard deviation
18,000
19,320
∗ Record incomplete
Appendix C Page C-3

Los Angeles River (Stream Gaging Station No. F319-R)
Season
Total Runoff (acre-ft) Season
Total Runoff (acre-ft) Season
Total Runoff (acre-ft) Season
Total Runoff (acre-ft)
1928-29E 9,340 1947-48 52,820 1966-67 171,900 1985-86 244,741 1929-30 12,310 1948-49 44,350 1967-68 125,800 1986-87 118,510 1930-31 14,400 1949-50 42,180 1968-69 832,000 1987-88 176,277 1931-32 50,960 1950-51 36,600 1969-70 92,070 1988-89 141,249 1932-33 22,890 1951-52 212,200 1970-71* 145,300 1989-90 141,594 1933-34 67,860 1952-53 44,490 1971-72 77,560 1990-91 224,410 1934-35 40,470 1953-54 70,790 1972-73 183,300 1991-92 484,849 1935-36 20,470 1954-55 60,120 1973-74 137,800 1992-93 1,122,000 1936-37 91,110 1955-56 96,810 1974-75 115,000 1993-94 187,400 1937-38 408,000 1956-57 48,710 1975-76 72,670 1994-95 740,000 1938-39 82,750 1957-58 191,200 1976-77 101,700 1995-96 189,200 1939-40 65,930 1958-59 49,390 1977-78 668,337 1996-97 216,300 1940-41 369,500 1959-60 49,100 1978-79 274,500 1997-98∗ 1941-42 93,390 1960-61 32,000 1979-80 544,632 1998-99* 1942-43 264,900 1961-62 177,400 1980-81 125,893 1999-00* 24,5601943-44 217,400 1962-63 54,700 1981-82 178,227 2000-01 293,500 1944-45 100,200 1963-64 47,020 1982-83 758,465 2001-02 131,061 1945-46 91,790 1964-65 76,680 1983-84 120,740 2002-03 229,041 1946-47 106,000 1965-66 247,900 1984-85 118,440
All years Last ten years Minimum 9,340 131,061 Maximum 1,122,000 1,122,000 Mean
180,000
380,000 Standard deviation
210,000
320,000
E Estimate ∗ Record incomplete
Appendix C Page C-4

Malibu Creek (Stream Gaging Station No. F130-R)
Season
Total Runoff (acre-ft) Season
Total Runoff (acre-ft) Season
Total Runoff (acre-ft) Season
Total Runoff (acre-ft)
1930-31* 1,920 1949-50 477 1968-69 119,900 1987-88 17,337 1931-32 14,670 1950-51 56 1969-70 7,200 1988-89 8,876 1932-33 9,190 1951-52 58,200 1970-71 17,300 1989-90* 1933-34 12,370 1952-53 2,940 1971-72 4,340 1990-91 14,872 1934-35 6,220 1953-54 4,990 1972-73 25,400 1991-92 67,330 1935-36 2,310 1954-55 758 1973-74 15,910 1992-93* 1936-37 23,940 1955-56 4,680 1974-75 11,020 1993-94 11,090 1937-38 34,100 1956-57 444 1975-76 3,910 1994-95 68,700 1938-39 4,630 1957-58 31,660 1976-77 4,980 1995-96 9,395 1939-40 6,100 1958-59 1,510 1977-78 80,990 1996-97 31,180 1940-41 73,220 1959-60 504 1978-79 33,408 1997-98 81,700 1941-42 1,820 1960-61 99 1979-80∗ 1998-99 7,430 1942-43 47,600 1961-62 26,150 1980-81 9,832 1999-00 16,440 1943-44 30,170 1962-63 701 1981-82 10,031 2000-01 38,920 1944-45 4,240 1963-64 384 1982-83 88,148 2001-02 7,670 1945-46 3,800 1964-65 1,560 1983-84 17,411 2002-03 18,761 1946-47 3,820 1965-66 37,520 1984-85 12,002 1947-48 177 1966-67 25,700 1985-86 27,881 1948-49 90 1967-68 13,430 1986-87 6,236
All years Last ten years Minimum 56 7,430 Maximum 119,900 81,700 Mean 20,000 29,100 Standard deviation 25,000 26,600
∗ Record incomplete
Appendix C Page C-5

Appendix C Page C-6
Santa Clara River (Stream Gaging Station No. F92-R)
Season
Total Runoff (acre-ft) Season
Total Runoff (acre-ft) Season
Total Runoff (acre-ft) Season
Total Runoff (acre-ft)
1930-31 1,890 1948-49 1,300 1966-67 7,100 1984-85 13,558 1931-32 4,280 1949-50 888 1967-68 3,070 1985-86 17,896 1932-33 488 1950-51 217 1968-69E 30,170 1986-87 10,197 1933-34 1,600 1951-52 16,760 1969-70 9,610 1987-88 11,981 1934-35 1,090 1952-53 592 1970-71 10,930 1988-89 8,535 1935-36 1,590 1953-54 1,160 1971-72 6,640 1989-90 8,864 1936-37 4,850 1954-55 612 1972-73 9,450 1990-91 10,058 1937-38 26,900 1955-56 1,000 1973-74 6,600 1991-92∗ 1938-39 10,410 1956-57 1,020 1974-75 3,910 1992-93* 1939-40 1,570 1957-58 10,620 1975-76 2,710 1993-94*
1940-41 41,320 1958-59 940 1976-77 2,750 1994-95*
1941-42 23,400 1959-60 288 1977-78* 1995-96* 1942-43 47,170 1960-61 533 1978-79 11,617 1996-97 6,190 1943-44 49,770 1961-62 10,470 1979-80* 1997-98 53,800 1944-45 11,050 1962-63 965 1980-81NR 1998-99 11,330 1945-46 6,440 1963-64 780 1981-82NR 1999-00 13,600 1946-47 11,150 1964-65 1,550 1982-83 83,154 2000-01 5,620 1947-48 2,270 1965-66 15,990 1983-84* 2001-02 2,350
All years Last ten years Minimum 217 2,350 Maximum 83,154 53,800 Mean 10,000 13,200 Standard deviation 20,000 14,600
Reference: LADPW (2004). Los Angeles County 2002-2003 Hydrologic Report, Stream Gaging Station Peak Flow. Los Angeles County Department of Public Works. Posted at: http://ladpw.org/wrd/report/0203/runoff/peak.cfm.
E Estimate ∗ Record incomplete. NR No record.
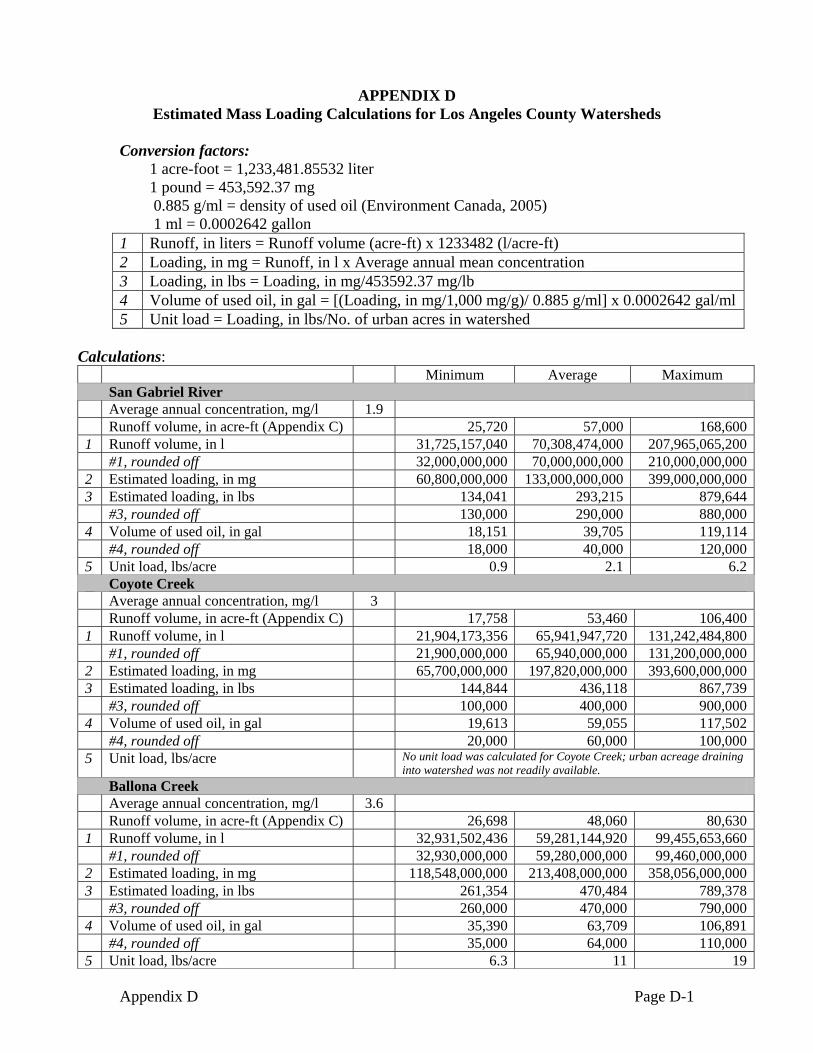
APPENDIX D Estimated Mass Loading Calculations for Los Angeles County Watersheds
Conversion factors:
1 acre-foot = 1,233,481.85532 liter 1 pound = 453,592.37 mg 0.885 g/ml = density of used oil (Environment Canada, 2005) 1 ml = 0.0002642 gallon
Calculations:
1 Runoff, in liters = Runoff volume (acre-ft) x 1233482 (l/acre-ft) 2 Loading, in mg = Runoff, in l x Average annual mean concentration 3 Loading, in lbs = Loading, in mg/453592.37 mg/lb 4 Volume of used oil, in gal = [(Loading, in mg/1,000 mg/g)/ 0.885 g/ml] x 0.0002642 gal/ml 5 Unit load = Loading, in lbs/No. of urban acres in watershed
Minimum Average Maximum San Gabriel River Average annual concentration, mg/l 1.9 Runoff volume, in acre-ft (Appendix C) 25,720 57,000 168,6001 Runoff volume, in l 31,725,157,040 70,308,474,000 207,965,065,200 #1, rounded off 32,000,000,000 70,000,000,000 210,000,000,0002 Estimated loading, in mg 60,800,000,000 133,000,000,000 399,000,000,0003 Estimated loading, in lbs 134,041 293,215 879,644 #3, rounded off 130,000 290,000 880,0004 Volume of used oil, in gal 18,151 39,705 119,114 #4, rounded off 18,000 40,000 120,0005 Unit load, lbs/acre 0.9 2.1 6.2 Coyote Creek Average annual concentration, mg/l 3 Runoff volume, in acre-ft (Appendix C) 17,758 53,460 106,4001 Runoff volume, in l 21,904,173,356 65,941,947,720 131,242,484,800 #1, rounded off 21,900,000,000 65,940,000,000 131,200,000,0002 Estimated loading, in mg 65,700,000,000 197,820,000,000 393,600,000,0003 Estimated loading, in lbs 144,844 436,118 867,739 #3, rounded off 100,000 400,000 900,0004 Volume of used oil, in gal 19,613 59,055 117,502 #4, rounded off 20,000 60,000 100,0005 Unit load, lbs/acre No unit load was calculated for Coyote Creek; urban acreage draining
into watershed was not readily available. Ballona Creek Average annual concentration, mg/l 3.6 Runoff volume, in acre-ft (Appendix C) 26,698 48,060 80,6301 Runoff volume, in l 32,931,502,436 59,281,144,920 99,455,653,660 #1, rounded off 32,930,000,000 59,280,000,000 99,460,000,0002 Estimated loading, in mg 118,548,000,000 213,408,000,000 358,056,000,0003 Estimated loading, in lbs 261,354 470,484 789,378 #3, rounded off 260,000 470,000 790,0004 Volume of used oil, in gal 35,390 63,709 106,891 #4, rounded off 35,000 64,000 110,0005 Unit load, lbs/acre 6.3 11 19
Appendix D Page D-1

Appendix D Page D-2
Los Angeles River Average annual concentration, mg/l 3.08 Runoff volume, in acre-ft (Appendix C) 131,061 380,000 1,122,0001 Runoff volume, in l 161,661,384,402 468,723,160,000 1,383,966,804,000 #1, rounded off 160,000,000,000 470,000,000,000 1,400,000,000,0002 Estimated loading, in mg 492,800,000,000 1,447,600,000,000 4,312,000,000,0003 Estimated loading, in lbs 1,086,438 3,191,412 9,506,333 #3, rounded off 1,100,000 3,200,000 9,500,0004 Volume of used oil, in gal 147,116 432,154 1,287,266 #4, rounded off 150,000 430,000 1,300,0005 Unit load, lbs/acre 3.73 10.9 32.2 Malibu Creek Average annual concentration, mg/l 2.5 Runoff volume, in acre-ft (Appendix C) 7,430 29,100 81,7001 Runoff volume, in l 9,164,771,260 35,894,326,200 100,775,479,400 #1, rounded off 9,160,000,000 35,900,000,000 101,000,000,0002 Estimated loading, in mg 22,900,000,000 89,750,000,000 252,500,000,0003 Estimated loading, in lbs 50,486 197,865 556,667 #3, rounded off 50,000 200,000 560,0004 Volume of used oil, in gal 6,836 26,793 75,379 #4, rounded off 6,800 27,000 75,0005 Unit load, lbs/acre 5.0 20 56 Santa Clara River Average annual concentration, mg/l 2.40 Runoff volume, in acre-ft (Appendix C) 2,350 13,200 53,8001 Runoff volume, in l 2,898,682,700 16,281,962,400 66,361,331,600 #1, rounded off 2,900,000,000 16,300,000,000 66,400,000,0002 Estimated loading, in mg 6,960,000,000 39,120,000,000 159,360,000,0003 Estimated loading, in lbs 15,344 86,245 351,329 #3, rounded off 15,300 86,200 351,0004 Volume of used oil, in gal 2,078 11,679 47,574 #4, rounded off 2,080 11,700 47,6005 Unit load, lbs/acre 0.97 5.46 22.2
References: Environment Canada (2005). ETC Spills Technology Databases, Oil Properties Database: Lubricating oil (Engine, Gasoline). Posted at: www.etc-cte.ec.gc.ca/databases/OilProperties/Default.aspx. LADPW (2005). Los Angeles County 1994-2005 Integrated Receiving Water Impacts. Final Report. Los Angeles County Department of Public Works. August 2005. Posted at: http://ladpw.org/wmd/NPDES/report_directory.cfm.