characterization of thermally activated solid …
TRANSCRIPT

CHARACTERIZATION OF THERMALLY ACTIVATED SOLID ELECTROLYTE
LITHIUM ANODE PRIMARY RESERVE BATTERIES
A Thesis
presented to
the Faculty of the Graduate School
at the University of Missouri – Columbia
In Partial Fulfillment
of the Requirement for the Degree
Master of Science
by
KEVIN ZIMMERSCHIED
Dr. John Gahl, Thesis Supervisor
DECEMBER 2010
Distribution Statement A: Approved for public release; distribution is unlimited.
The undersigned, appointed by the Dean of the Graduate School, have
examined the thesis entitled
CHARACTERIZATION OF THERMALLY ACTIVATED SOLID ELECTROLYTE
LITHIUM ANODE PRIMARY RESERVE BATTERIES
Presented by Kevin Zimmerschied
A candidate for the degree of Master of Science
And hereby certify that in their opinion it is worthy of acceptance.
Professor John M. Gahl
Professor Robert M. O’Connell
Professor Scott Kovaleski

Dedicated to my Mother & Father, without whom I would not be who I am today.

ii
ACKNOWLEDGEMENTS
I would like to thank Dr. John Gahl for his guidance and support during the
course of research.
I would also thank Dr. Robert O’Connell for bringing this opportunity to my
attention and for the use of facilities in conducting the research.

iii
TABLE OF CONTENTS
ACKNOWLEDGEMENTS ............................................................................................................................ ii
LIST OF FIGURES ....................................................................................................................................... v
LIST OF TABLES ...................................................................................................................................... viii
LIST OF EQUATIONS ................................................................................................................................ ix
CHAPTER 1 - INTRODUCTION.................................................................................................................... 1
Overview of Thermal Batteries ................................................................................................................... 1
Overview of Purpose .................................................................................................................................. 3
Overview of Components ........................................................................................................................... 4
Overview of Project Goals .......................................................................................................................... 5
Overview of Parameter Space .................................................................................................................... 7
Overview of Test Batteries ......................................................................................................................... 8
Overview of System Design ........................................................................................................................ 8
Overview of Data Acquisition & Analysis .................................................................................................... 9
Overview of System Testing ..................................................................................................................... 11
Overview of Experiments ......................................................................................................................... 12
Overview of results ................................................................................................................................... 17
CHAPTER 2 - THEORY .............................................................................................................................. 19
Theory Behind Thermal Batteries ............................................................................................................. 19
Theory Behind the Test Stand .................................................................................................................. 23
CHAPTER 3 - DESIGN .............................................................................................................................. 29
Design of Load Bank ................................................................................................................................. 29
Design of Diagnostics ................................................................................................................................ 33

iv
Design of Switching .................................................................................................................................. 36
Design of DAQ ........................................................................................................................................... 37
Design of Control ...................................................................................................................................... 39
Design of Activation .................................................................................................................................. 43
CHAPTER 4 – TESTING (VERIFICATION) ................................................................................................... 46
Testing of Control ..................................................................................................................................... 46
Testing of Diagnostics ............................................................................................................................... 47
Testing of Load ......................................................................................................................................... 48
Testing of Switching .................................................................................................................................. 53
Testing of Activation ................................................................................................................................. 56
CHAPTER 5 - RESULTS ............................................................................................................................. 58
Results of Setup ........................................................................................................................................ 58
Results of Thermal Battery I – Baseline Energy Test ................................................................................ 61
Results of Thermal Battery II – Progressive Stress Test 1 ......................................................................... 62
Results of Thermal Battery III – Progressive Stress Test 2 ........................................................................ 62
Results of Thermal Battery IV – Progressive Stress Test 3 ........................................................................ 63
Results of Thermal Battery V – Final Stress Test ...................................................................................... 68
Results of Thermal Battery VI – Repeatability Test .................................................................................. 69
Results of Thermal Battery VII – Unloaded Voltage Stability Test ............................................................ 69
Results of Thermal Battery VIII – Long Pulse Test .................................................................................... 70
Results of Thermal Battery IX – Loaded Voltage Stability Test ................................................................. 70
CHAPTER 6 – ANALYSIS OF THERMAL BATTERY PERFORMANCE ............................................................. 76
CHAPTER 7 – FUTURE WORK .................................................................................................................. 95
CHAPTER 8 - CONCLUSIONS .................................................................................................................... 96
References ............................................................................................................................................. 99

v
LIST OF FIGURES
Figure Page Figure 1: Sample Graphs from the MATLAB data-script ...................................... 6
Figure 2: Photograph of final Test Stand Setup .................................................. 14
Figure 3: Sample MATLAB output from Thermal Battery 1 ................................ 16
Figure 4: Photo of Progressively Charred & Melted Activation Tabs on Thermal Batteries ........................................................................................ 18
Figure 5: Sample Thermal Battery Schematic .................................................... 21
Figure 6: Example of Voltage Divider Diagnostic Schematic & Equation ........... 26
Figure 7: Photo of Current Shunt Diagnostic Mounted on Heatsink ................... 27
Figure 8: Photo of first Load Module with Power Resistors Mounted ................. 30
Figure 9: Sample of Possible Power Resistor Topologies .................................. 32
Figure 10: Inductance Simulation Schematic ..................................................... 34
Figure 11: Inductance Simulation Result at 100 Hz ............................................ 34
Figure 12: Inductance Simulation Result at 1000 Hz .......................................... 35
Figure 13: Photo of Relay ................................................................................... 37
Figure 14: Photo of DAQ .................................................................................... 39
Figure 15: Thermal Battery Data with no Apparent Anomalies ........................... 41
Figure 16: Control System Schematic ................................................................ 42
Figure 17: Control System Photo ........................................................................ 43
Figure 18: Activation System Schematic ............................................................ 45
Figure 19: System Resistance from MATLAB data-script ................................... 51

vi
Figure 20: Unfiltered (top) vs. Filtered (Bottom) Voltage Signal.......................... 52
Figure 21: Demonstration of Square Form of Current Pulses ............................. 53
Figure 22: System Open Resistance from MATLAB data-script ......................... 54
Figure 23: Speed Test Stage 8, showing Fastest Viable Speed ......................... 56
Figure 24: Photo of Activation & Control Circuitry ............................................... 57
Figure 25: Photo of Final Test Stand Configuration ............................................ 58
Figure 26: Li-poly Battery Results preceding Thermal Battery 1 Testing ............ 60
Figure 27: Thermal Battery 1 Results Showing Energy Content ........................ 64
Figure 28: Thermal Battery 2 Results Showing Higher Current Draw ................. 65
Figure 29: Thermal Battery 3 Results Showing Higher Current Draw ................. 66
Figure 30: Thermal Battery 4 Results Showing Higher Current Draw ................. 67
Figure 31: Photo of Progressively Charred & Melted Activation Tabs on Thermal Batteries ........................................................................................ 69
Figure 32: Thermal Battery 5 Results – Highest Current Draw & Power Exceeding Goals ........................................................................... 71
Figure 33: Thermal Battery 6 Results – Repeatability of Test V ......................... 72
Figure 34: Thermal Battery 7 Results Showing no Unloaded Voltage Stabilization ...................................................................................................... 73
Figure 35: Thermal Battery 8 Results – Long Pulses Exceeding Project Goals . 74
Figure 36: Thermal Battery 9 Results Showing no Loaded Voltage Stabilization 75
Figure 37: Thermal Battery 1 Stages 1 & 2 ........................................................ 78
Figure 38: Thermal Battery 2 Stages 1 & 2 ........................................................ 79
Figure 39: Thermal Battery 3 Stages 1 & 2 ........................................................ 80
Figure 40: Thermal Battery 4 Stages 1 & 2 ........................................................ 82
Figure 41: Thermal Battery 5 Power & Energy Graphs ...................................... 83
Figure 42: Thermal Battery 5 Stages 0 & 1 Showing Power Exceeding Project Goals ............................................................................................. 84

vii
Figure 43: Thermal Battery 5 Stages 2 & 3 ........................................................ 85
Figure 44: Thermal Battery 5 Stages 4 & 5 ........................................................ 86
Figure 45: Thermal Battery 6 Stages 0 & 1 Showing Repeatability of Test V ..... 88
Figure 46: Thermal Battery 7 Full Results Showing no Unloaded Voltage Stabilization ................................................................................... 89
Figure 47: Thermal Battery 8 Stages 0 & 1 Showing Long Pulses Exceeding Goals ............................................................................................. 90
Figure 48: Thermal Battery 9 Stages 0 & 1 Showing no Loaded Voltage Stabilization ................................................................................... 91

viii
LIST OF TABLES
Table Page Table 1: Schedule of Thermal Battery Tests ...................................................... 15
Table 2: Sampling of Thermal Battery Performance Specifications .................... 22
Table 3: Measured Load Resistor Values ........................................................... 48
Table 4: Speed Test Trial Results ...................................................................... 55
Table 5: Thermal Battery Experiment Results of Peak Specific Powers & Energies ........................................................................................ 92
Table 6: Sample of Lithium-Ion Battery Specific Powers & Energies .................. 92
Table 7: Sample of Lithium-polymer Experiment Results of Peak Specific Powers & Energies .................................................................................... 93

ix
LIST OF EQUATIONS
Equation Page Equation 1: Thermal Resistance ......................................................................... 28
Equation 2: Current Shunt Heatsink Requirement .............................................. 35
Equation 3: RMS Equation for Rectangular Pulse Train ..................................... 59

1
CHAPTER 1 - INTRODUCTION
Overview of Thermal Batteries
A thermal battery is a battery whose electrolytes are solid until melted by
the addition of thermal energy, typically via a bridgewire resistor, at activation.
After this, the energy delivery raises their internal temperature to the 400 °C –
540 °C range [1,95]. The liquefied electrolytes combine in a chemical reaction
that produces electrical potential between the terminals. The reaction cannot be
feasibly reversed and so thermal batteries are non-rechargeable or primary
batteries. Due to heat losses to the environment the electrolytes eventually re-
solidify; this or the exhaustion of reactants ends the chemical reaction and
availability of electric potential.
Little work has been done characterizing the capabilities of thermal
batteries. This is primarily because they are costly and one-time use. Their single
use nature has limited their applications and made them a niche battery for
specialized systems. They also contain hazardous and highly reactive chemicals,
lithium in the batteries investigated herein, that necessitate specialized
manufacturing equipment and facilities. In fact many if not most thermal batteries
are made by hand in extremely limited quantities, resulting in a high per unit cost.
These barriers have kept thermal batteries from being extensively studied
despite a very high theoretical specific energy (1307 Wh/kg) [2,1.12] and the
advantage of negligible self-discharge over 10 – 25 years [2,21.1]. What work

2
has been done mainly involves the development of particularly large thermal
batteries with large energy content and associated long life [3][4][5]. Traditional
thermal batteries often have operational lives of a few minutes or less, so
lifetimes exceeding 20 minutes [6][7,203-4] require special design. Typically,
thermal batteries have been designed by referencing older, proven designs and
over-engineering to guarantee the batteries can meet rigorous customer
specifications. A typical thermal battery might run a base load of a few amps with
sub-second pulses every tens of seconds in the tens of amps range and be
designed to have its rated output voltage last for 150 – 200 % of its operational
life. There is greater emphasis put on guaranteeing successful operation than
optimization of weight or size owing to the one-time use nature and importance of
the systems such costly batteries power. Efforts are only now underway to
attempt to use modern computer analytical modeling and simulation to better
understand the operation and improve the design of these batteries.
Due to the nature of thermal battery design, little is known about their
performance capabilities outside their given operational parameters. For one, the
energy capacity is not tested, but only guaranteed to exceed operational needs.
For another, the power delivery capability is designed to ensure it is not stressed.
Yet new technologies are emerging that require small and lightweight power
sources. One example is compact pulsed power systems. Such a system would
need a prime power source with a large specific power. That thermal batteries
have a large specific energy makes them of interest; that they have a very long
viable shelf-life compared to other batteries make them even more interesting; for

3
the right applications the cost and single use nature would not be a deterrent to
usage. This creates a need to determine the feasibility of using a thermal battery
for unique new loads. The ability of the battery to deliver high power is important
as well as the amount of energy the battery has available and if it can operate
reliably under different load regimes.
Overview of Purpose
The driving force behind the project was assessing the feasibility of using
a thermal battery as the prime power source of a compact pulsed power system.
A given for the project was that power draws in the 10 kilowatt range would be of
interest for further investigation. The initial switching capability was not of interest
since it was unknown if the thermal batteries would be capable of handling the
power output. Initial switching capability at the second time scale was deemed
sufficient. Many decisions for this initial system were made to speed the design
and construction. This allowed faster early testing than would have been possible
if the most design and time intensive scenarios had been pursued. This was
seen as a plus since the investigation was to determine the feasibility of thermal
batteries for such high power discharges and the batteries may have
catastrophically failed, ending testing. Overall, this gave great latitude in system
components and left room for future work should the batteries prove themselves,
as they did.

4
Overview of Components
Initially, a wide range of battery possibilities were on the table as possible
test subjects. They had voltages ranging from 40 – 170 volts. The currents would
then be up to 250 amps for 10 kilowatts output power. At the same time it was
known that the system would require testing and self-characterization. High cost,
one-time use thermal batteries would not be suitable for that purpose and so
Lithium-ion Polymer batteries, commonly used by hobbyists, were chosen as a
suitable substitute from a power and current capability standpoint. The chosen Li-
poly batteries were nominally 25.2 V, and so needed to be accounted for in
system design.
To this end a modular load was designed, comprising high power resistors
connected with copper busbars, which could be put in series and parallel
combinations to create a set of constant resistance discharge scenarios. This,
again, saved time over a semiconductor based load which can be swapped into
the system in the future for constant current or power testing.
The initial switching mechanism was chosen for ease of interface and
speed of design. A simple relay was found that could handle the currents and
voltages envisioned. This was driven by a microcontroller and MOSFET. Using a
microcontroller allowed complete programmability of switching scenarios. Final
tests included alternating constant on and pulsed discharges that allowed
comparison of drawn energy between the two discharge types.
Computer data acquisition was desired and a National Instruments USB
device was procured for that purpose. It was more than capable of handling 5

5
kilosamples per second which is what was used for the majority of testing. This
level was a balance between measuring pulses on the hundreds of milliseconds
scale and avoiding oversampling in tens of minutes of runtime. The data
acquisition device took input from a well-defined voltage divider for battery
voltage and a set of high power precision current shunts for measuring current.
The data were imported to MATLAB for analysis and graphing. A set of sample
graphs can be seen in Figure 1. Highlights include voltage and current with
duration of the battery run, power and energy with battery characteristics, rough
system load for verification, and zoomed in voltage and current to see pulse
behavior.
These are the basic components of the system developed for testing. It is
a straightforward way of characterizing thermal batteries under the kinds of high
power loads encountered in many modern applications.
Overview of Project Goals
In order to complete the initial stage of the project, many goals had to be
achieved. These goals are summarized here first and detailed in the following
paragraphs. The first step was to define the parameter space as discussed
above. Next was selecting a thermal battery for the experiments and a lithium
polymer battery for testing the system while under construction, after which came
designing the system for conducting the tests and the data analysis software for
processing the collected data. Testing the system and the data analysis software
would allow debugging and refining the system using reusable Li-poly batteries.

6
Figure 1: Sample Graphs from the MATLAB data-script

7
After the system was operating as desired an experimental run would be
conducted using a thermal battery. This first data would be analyzed to ensure
proper operation of the experiment and to view the first results. These results
would be used to guide a review of the parameter space to direct future runs of
the expensive, one-time-use thermal batteries, in order to ensure that the
necessary data were captured. Further experimental runs, data analysis, and
parameter space review would be conducted to cap the initial project stage.
Overview of Parameter Space
In order to define the parameter space, an idea of the goal had to be
established. As mentioned above, a power output of 10 kW or greater was an
initial goal. The switching times dictated were not as critical and it was accepted
that switching times on the order of a half-second or longer would allow a quick
start to the project.
After developing a sense of the desired parameter space in terms of
output power and pulse times, a battery was needed for system design.
Consulting with the eventual battery supplier, EaglePicher, a battery was chosen
that would suit the project’s needs, be reasonably available, reasonably
affordable, and easily upgradeable to allow expanded specifications.
Remembering that thermal batteries are a specialized product in a niche market,
it was important to choose a battery that could be ordered, built, and delivered
within a timely manner to move the project forward while not being prohibitively
expensive. This battery also happened to have the option of increasing the
conductor sizes within the battery by six (6) times, allowing greater current
8
handling capability (lower internal resistance). The battery had an output of 100
Volts in a 0.8 Liter package weighing 2.1 kilograms. Normal loading would be
around 500 Watts with some 200 Joule pulses, but this research would strain that
to over 12 kilowatts and 60 kilojoule pulses.
Overview of Test Batteries
Selecting a test battery was then a matter of balancing cost with
capabilities. Since the test batteries were supposed to be reusable, they needed
to survive testing. At the same time, some may be needed to be tested to
destruction and so they should be affordable. Affordability also suited the
purpose of using inexpensive batteries to test and debug the system under
construction. At the same time, the test batteries had to have capabilities on the
order of the thermal batteries to provide a genuine system test and break-in.
Lastly, it was desired that the test batteries be of a type that had been tested
elsewhere to allow for general verification of the system performance through
comparison of captured data with published data.
Overview of System Design
Designing the system meant pulling together a wide variety of needs. One
need was for safety. Since the thermal batteries get quite hot under normal
operation and there could be explosive hazards with extreme testing or failure
modes, there was a need for structural safety. There was also a need to ensure
that the batteries would be activated in a controlled way and not by accident.
Diagnostics would be needed to acquire the data with a data acquisition system
9
that was desired to be computer based. The desired data were the current
through the system and the voltage at the battery terminals. These data were
captured using a National Instruments (NI) USB based data acquisition (DAQ)
device to allow for ease of setup and operation and use of affordable,
standardized DAQ hardware. The DAQ hardware was capable of capturing data
in excess of 5 kS/s, or far greater than anticipated pulse times. The switching
mechanism would need to handle a wide range of currents since the Li-poly test
batteries necessarily had a lower voltage than the thermal batteries. It would also
need to handle significant currents to achieve the 10 kW output power from 100
V thermal batteries. The switching mechanism would need to be controlled, as
would the activation circuitry, and a microcontroller was chosen for this purpose.
These systems would then need power of their own in the form of other Li-poly
batteries. The diagnostics and control circuitry would also need thermal
management; the controls for power regulation and the diagnostics for Joule
heating effects. The load also had to accommodate the differing voltage levels of
the thermal and Li-poly batteries, while retaining enough variability to explore the
parameter space while being a constant resistive load to quicken the design and
construction pace. The load also needed an appropriate flyback diode to
compensate for switching effects at high currents.
Overview of Data Acquisition & Analysis
In order to get anything useful out of the system, data that were captured
had to be analyzed. MATLAB was chosen for this due to its powerful
mathematical subsystem, programmability, and widespread use in academia and

10
industry. The first part of analyzing the data was simply loading the data from the
voltage and current diagnostics, as captured via the NI DAQ computer setup.
Because of the limitations of the NI DAQ input, the diagnostics had to produce a
signal within a certain range. This meant the MATLAB script, hereafter data-
script, needed to translate the raw data into real values. After doing this
numerical techniques were applied to reduce noise in the voltage signal caused
by the switching events. Various parameters were then calculated and plotted. A
first plot showed the current and voltage waveforms over the data collection time
and calculated the discharge duration (start to finish). The next plot showed the
power and extracted energy over the data collection time and calculated the total
extracted energy (based on instantaneous power and the data collection period),
the maximum power seen, and using the size and mass of the batteries, the
specific energy and power, and energy and power densities. Another plot, made
solely for debugging and system verification, displayed the system resistance
from the recorded voltage and current over the data collection time and isolated
the operating system resistance for load verification and the end-of-run open
state resistance to verify open-state performance. This was solely for debugging
due to the uncalibrated nature of the data. After this, several plots of the voltage
and current waveforms over several pulses and at different times during the run
were automatically created to observe the actual waveform behavior. Since the
overall data collection time was so long compared to the pulse widths and pulse
frequencies, the previous plots were only useful in seeing the overall trend of the
batteries’ performance. The targeted plots that showed approximately four (4)

11
pulses each at various times in the life of the test run allowed close-up
examination of the voltage and current waveforms as the switching was
conducted. This data-script was written as a MATLAB script and much time was
spent developing, customizing, and standardizing it so that runs subsequent to
preliminary testing could have their data processed quickly and easily with only
minor, generally notational, changes made to the script for each run.
Overview of System Testing
During the development of the system, sections were tested along the way
to ensure they were operating as expected before proceeding to later sections.
One of the earliest operational parts was the microcontroller for the switching
element. Using a microcontroller for this allowed practically infinite variability in
switching profiles, should the future need arise. This section was easily tested
with an oscilloscope to verify proper output. The safety switching of the
microcontroller was also trivial to test, ensuring that operation would only
commence when the operator switched the system on, and would cease when
the operator switched the system to safe, in order to implement an emergency
stop. The relay and interface circuitry were tested with the microcontroller soon
after and shown to switch properly as evidenced via oscilloscope. The load
resistors were separately measured with an HP LCR meter to record their
individual values. After construction of a load bank module, allowing connection
of a number of load resistors to create various load configurations, it also was
characterized with an LCR to ensure high conductivity. Subsequently, an initial
configuration test of the battery, relay, load, flyback diode, and control hardware

12
was performed and shown to be successful. Diagnostics were then tested for
construction accuracy and characterization and integrated into the system setup
and tied into the data acquisition hardware. All of these were then tested
thoroughly using the Li-poly batteries. The results indicated proper operation of
the system and data analysis software. At this point the characteristics of the test
thermal batteries were known and the activation circuitry, which would deliver the
energy pulse to ignite the pyrotechnics to activate the thermal batteries, was
designed, built, and tested satisfactorily. The system was then proven ready to
test the one-time use thermal batteries.
The data analysis software was also tested on the various Li-poly runs.
This was accomplished through the comparison of the data-script results with
hand calculated versions from the on-screen displayed NI DAQ results. The data-
script results were in line with the expected results. The data-script was also
reworked to better graph the segments of the experimental run and display the
voltage and current pulses more clearly. This resulted in an improved ability to
verify system performance.
Overview of Experiments
In preparation for the first thermal battery test, a Li-poly battery was tested
in the same configuration. The controller was set to produce a one (1) Hertz
rectangular pulse train with a 20% duty cycle. The load was set at three (3)
Ohms. The test was conducted over a 90 minute period to drain the Li-poly and
demonstrate that all system components could run for that duration, ensuring the
thermal battery (whose capacity is not well known, hence the testing) would be

13
fully drained. The data acquisition rate was changed to 500 Hertz to avoid data
overload that was seen in a test run. The new rate would still be more than
sufficient to sample the complete signal. The relay was also changed out as it
had accumulated over 20,000 switching cycles and was in the middle of its life.
The new relay was tested to ensure proper operation.
After this the first experimental run on a thermal battery was performed on
March 30, 2010. The test was run for over 20 minutes, until battery power output
was negligible. The test was performed with safety measures in place, although
after several minutes of successful operation under the light load, the safety
cover was removed to take temperature readings of the thermal battery. This was
not repeated in subsequent tests where the heavy current draws would have
made it far more risky. Temperature readings were taken using a Fluke IR
temperature gun. This was done to ensure proper safety precautions had been
taken and to gauge the operating temperature under load. The three (3) Ohm
load previously mentioned was chosen specifically to mimic the kind of load the
battery might see in normal use. This was done to maximize the safety and
security of the test, since there was a concern that large discharge currents could
cause excessive internal heating that would short some of the cells and/or stacks
and result in explosive rupture of the case with outgassing of superheated
caustic gasses and molten reactive metals such as lithium [8,290-281]. The
temperature gun showed case temperatures over 200 °F with conductor interface
tab temperatures over 300 °F. This was deemed within normal operating
temperatures as previously determined from literature research. An interesting

14
note is that the battery did not cool enough for disconnection (around 90 °F) until
five (5) hours after the test. A photograph of the test setup can be seen in Figure
2.
Figure 2: Photograph of final Test Stand Setup
The next goal was to process the data from the first run. This was then
processed through the MATLAB data-script to determine the experiment results.
The idea was to get a set of parameters, as outlined above, for the battery.
These included run-time, energy content, specific energy and power, energy and
power density, and voltage and current waveforms for the experiment. A sample
of the output can be seen in Figure 3. Interest was given to the energy content of
the battery to determine safety adequacy. Special interest was paid to the
specific energy and power and the energy and power density for comparison to
standards. The characteristics of the power curve were also interesting,
15
suggesting a chemical impedance in the power performance at the “plateaus” in
the waveform. The initial voltage and current were seen to be what was expected
as was the system resistance. The time that the battery could source peak power
was also of note.
Following this, a reassessment of the parameter space was performed
since information about the battery under test had been acquired. Due to the
success of the test and low temperatures of the battery and terminals, it was
deemed appropriate to move along the power extraction scale. It was deemed
that current safety procedures were sufficient to guard against all reasonable
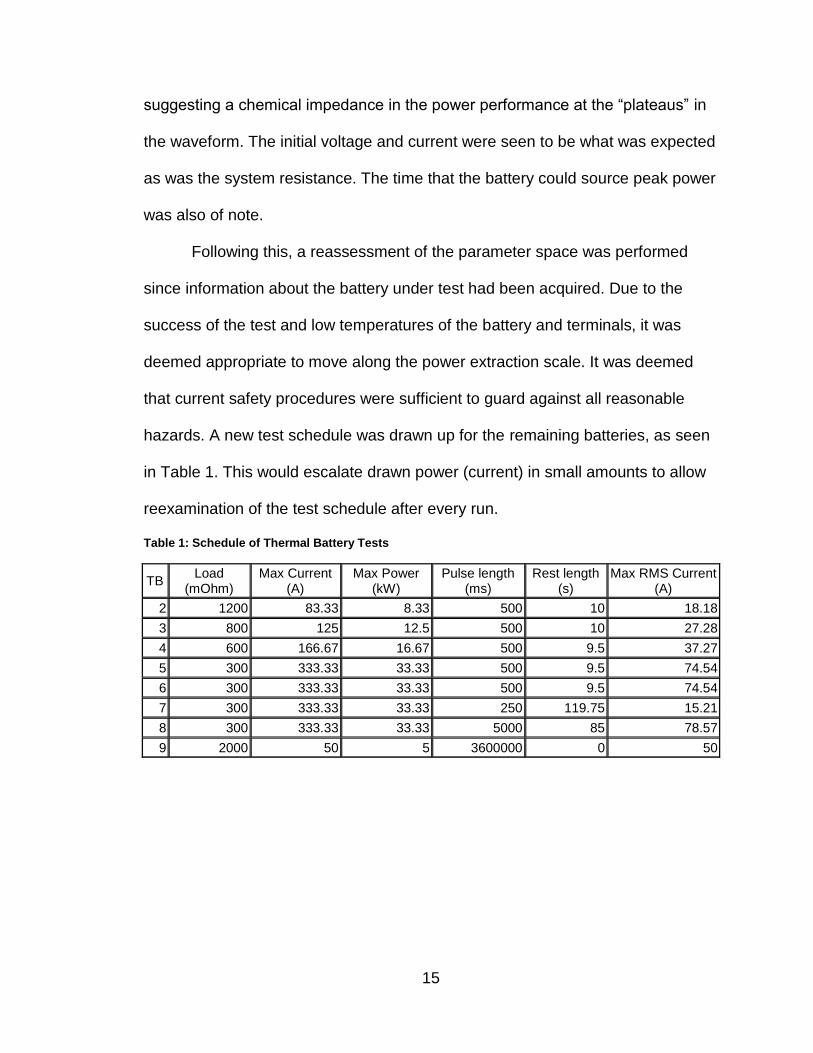
hazards. A new test schedule was drawn up for the remaining batteries, as seen
in Table 1. This would escalate drawn power (current) in small amounts to allow
reexamination of the test schedule after every run.
Table 1: Schedule of Thermal Battery Tests
TB Load
(mOhm) Max Current
(A) Max Power
(kW) Pulse length
(ms) Rest length
(s) Max RMS Current
(A)
2 1200 83.33 8.33 500 10 18.18
3 800 125 12.5 500 10 27.28
4 600 166.67 16.67 500 9.5 37.27
5 300 333.33 33.33 500 9.5 74.54
6 300 333.33 33.33 500 9.5 74.54
7 300 333.33 33.33 250 119.75 15.21
8 300 333.33 33.33 5000 85 78.57
9 2000 50 5 3600000 0 50

16
Figure 3: Sample MATLAB output from Thermal Battery 1

17
Overview of results
The penultimate goal was then to run further battery characterizations,
searching for a failure point if possible. Finding a failure point would indicate
where the limits of the batteries’ performance lay. Each battery was run
according to the revised test schedule, followed by data analysis similar to that
shown in Figure 3. Because these new experiments had the purpose of testing
the thermal battery’s current output performance, another view of the data was
taken: how long the batteries could output a certain power range. As seen in
Figure 3, there are “plateaus” of power output from the battery, most likely due to
an internal chemical reaction mechanism as the battery loses reactants and
cools from the initial heating. For different purposes, a battery might want a more
constant output profile that drops more exponentially near the end of its charge.
However, for pulsed power applications, the power output profile seen for the
thermal batteries could be acceptable if the power needs are met for the time-
frame of the pulsed power device. Since there are a variety of applications that
may only need pulsed power device operation for several minutes, this is not a
roadblock to further testing. The data points of primary power output duration
was then observed for these high current draw tests, even though it was not
important for the initial, low current, general characterization test. While it had
been anticipated that a failure point of the battery would be found, that turned out
not to be the case. Part of the reason is that the power output capability of the
battery began to diminish. Although the maximum power output was not yet
reached, there were noticeably diminishing returns for each reduction of the load,

18
i.e. halving the load did not double the output power. This indicated that the
battery was nearing its maximum power output. It was evident that the
conductive tabs of the batteries were getting progressively hotter, due to damage
of an attached thermal activation tab placed on top of each battery at the factory.
This progressive damage can be seen in Figure 4. Internal damage would have
been expected to be seen on the output waveforms as some disruption, but no
such irregularity was observed. The initial tests thus ended without noticeable
internal damage of the batteries.
Figure 4: Photo of Progressively Charred & Melted Activation Tabs on Thermal Batteries
The final goal of initial testing was then to analyze the data from the
conducted experiments. This was done through the data-script developed during
earlier testing. The data-script allowed same-day processing of the data, some of
which ran into tens of thousands of data points. This speed in processing the
data allowed immediate decision making as to the next test. Should the data
have shown that the limits of thermal battery performance had been reached, a
further test would have been questionable. As it was, each of the tests showed
greater thermal battery power output capability, albeit at levels of diminishing
returns for increased current draw (decreased loading). Completing the final test
and data analysis finished the goals of the initial project work.

19
CHAPTER 2 - THEORY
Theory Behind Thermal Batteries
A thermal battery is a very unique type of battery and as such is very
application specific. For applications that need a power source to be available for
a long period of time (years) without self-discharge issues and yet come online
on the order of a second (or less), thermal batteries provide an excellent solution
with good specific power and specific energy. The reason that a thermal battery
can have no self-discharge loss is that the electrolytes, which also serve as
anode and cathode, are actually solid in their normal state and, hence, no
chemical reaction can occur. It takes an external energy source, such as from a
small chemical explosive charge, to ignite pyrotechnics to raise the temperature
of the electrolytes to the 400 – 540 °C [1,95] required for liquefaction allowing
chemical reaction and current flow. While there are several chemistries of
thermal batteries, a very common and the one used here is a lithium variety. A
lithium alloy anode is paired with an iron-disulfide cathode, which together serve
as the electrolytic pair, to produce the battery cells. The cells are then arranged
to provide the voltage potential and current sourcing desired. These cells are
surrounded in various topologies by the activating pyrotechnics to achieve an
even activation of the chemicals. The cells are also connected to the conductors
which pass through the sealed case. These conductors can tap cells at various
levels to allow multi-voltage batteries. A sample diagram of a thermal battery can

20
be seen in Figure 5. As mentioned earlier, part of the high price of thermal
batteries is their niche applications, resulting in low volumes of production.
Production is also complicated by the hazards of working with elemental and
alloy lithium, which dictate high environmental standards for the production
facilities. Thorough testing is done on a large fraction (20 – 50 %) of batches to
ensure the quality of delivered product. This is necessary because thermal
batteries are often used in “mission critical” capacities and need an extremely
high operational rate. The testing includes conductor testing, case seal vacuum
testing, and even radiographic scans. These factors also contribute to the long
lead times for the batteries, since construction is labor intensive.
The thermal batteries used for testing were a standard model from
EaglePicher Technologies that was able to be modified in production to increase
internal conductor size by six times, allowing greater current discharges. The
batteries had 100 Volt terminals in a 0.8 Liter package weighing 2.1 kilograms.
The battery usually outputs around 500 Watts, with some 200 Joule pulses, but
this research was able to obtain over 12 kilowatts and 60 kilojoule pulses.
The performance of thermal batteries depends on the chemistries
involved, which have some differing properties. The specific energy and power
are also decreased by the necessary addition of activating chemicals and
hardware as well as thermal insulation [9,275]. Again focusing on the lithium iron-
disulfide batteries, typical performance of some thermal batteries can be seen in
Table 2, noting that specific powers are not often measured as they are not
typically important in traditional battery applications.

21
Figure 5: Sample Thermal Battery Schematic

22
Table 2: Sampling of Thermal Battery Performance Specifications
Source Specific Energy (Wh/kg) Specific Power (W/kg)
[2],1.12 40 N/A
[2],21.8 11.4 N/A
[2],21.8 26.2 N/A
[2],21.8 32.2 N/A
[2],21.8 33.1 N/A
[2],21.8 43 N/A
[2],21.8 38.7 N/A
[2],21.8 35.1 N/A
[10] 35.3 N/A
[11],27/8 38.6 N/A
[12] 3 8000
[12] 22 18
Thermal batteries exhibit very large potential from a specific power and specific
energy standpoint, although in practice this has yet to be realized. This is
generally due to the difficulty seen in maximizing the chemical potential of any
battery chemicals. The numbers shown also represent a certain kind of testing,
general battery testing at low current draw compared to capacity. This is the kind
of testing that would be good for general use, or commonly for electric vehicle
use, but not for analyzing the possibilities of a battery being used for high current
draw pulsed power prime power source applications. As to the actual design
practice of thermal batteries, it has been ongoing for over 50 years. This has lead
to guidelines in each company of how cells should be designed for a desired
performance. The design methodology and philosophy is generally to base
designs off earlier work, which is well tested and proven. Various cells exist
which have different chemical amounts, pyrotechnic composition and topology,
and geometries that yield certain activation times, current capability, lifetimes,
etc. These previous works serve as a base for designing new batteries, when the

23
rare need arises, and were the basis of the currently existing battery designs.
Thermal batteries are composed of a number of these cells chosen and
configured to meet activation, life, power output, size, weight, and other
requirements. The companies over-engineer the products to guarantee the
batteries will meet the client’s power draw specifications. This, as mentioned
earlier, leads to a lack of information regarding the actual capabilities of thermal
batteries. Currently, work is being started to use modern computational
capabilities such as multiphysics modeling to overcome this limitation. The goal
of the companies is to develop models that predict performance as they have
already tested it. This would allow the computational development of future
batteries with high confidence that the built battery cells would perform in-line
with expectations. However, this modeling work is still in the earliest of stages
and so actual testing must be done to characterize specific thermal batteries as
to unique applications such as serving a pulsed power load.
Theory Behind the Test Stand
The testing apparatus would require some kind of load on the thermal
batteries. In order to expedite the initial stage of the project, a simple resistive
load was chosen. This would allow initial characterization when it was completely
unknown if the thermal batteries would have any applicability at all. It was unclear
if the thermal batteries would even survive power draws 5 – 10 times their design
specifications for pulse lengths also 5 – 10 times design specifications and
pulses repeated tens to hundreds of times instead of only several times. All of
that would present abnormally high Joule heating of the conductive elements

24
which could potentially cause shorting within the case either opening cell stacks
or shorting them between each other or the case, any of which could lead to case
rupture and expulsion of superheated noxious gases and molten electrolytes
including elemental lithium into the atmosphere. Because of this possible
outcome and uncertainty, it was deemed that a fast initial investigation would be
best suited to justifying subsequent research stages. Simplicity of design in a
resistive modular load bank that could be reconfigured to allow varying loads to
the system was therefore chosen.
The switch for the system presented special concerns since the 10
kilowatts or more of desired output power draw capability, from a battery rated at
100 Volts at the terminals, would represent currents around 100 Amps. Switching
this much current poses potential problems of arcing, etc. However, a suitably
rated switch was acquired to handle this portion of operation. Switching high
currents still poses other problems for a system of course. At high currents,
everything has inherent inductance. This was complicated by the fact that 1000
Watt resistors were desired to populate the load bank in such a way as to allow
the various operational configurations that would allow extensive testing options.
Such high-power resistors were only commonly available at a reasonable price
when the “wirewound” construction was chosen. In this construction the resistor
is constructed of a wire wrapped around a ceramic core and coated with an
insulative material, silicone in this case. The geometry of such a resistor
inherently has greater inductance, although for this project the “non-inductive”
winding option was purchased for a 50% cost premium. This lowered the
25
inductance by a factor of approximately 100. Still, the energy stored in the
magnetic field of the load bank would resist opening the switching relay and so a
flyback diode was included in the design to allow an alternate current path. The
diode was chosen to handle more that the maximum current expected to be seen
in the system and to have fast characteristics to suit its purpose.
Diagnostics were needed to interface the National Instruments (NI) Data
Acquisition Module (DAQ) to the system. The two critical measurements were the
battery terminal voltage and the system current. These, when sampled frequently
enough, would allow detailed analysis of the data. The sampling was done with a
rate of 500 samples per second for most of the actual data runs. Early test runs
had been sampled at 5000 samples per second, but since the experimental runs
could last considerably longer a higher sampling rate would result in more data
than could easily be processed with very little gain in value. At 500 samples per
second the sample interval was 2 milliseconds compared to a shortest pulse
width of 100 milliseconds, making sampling 50 times greater and easily
exceeding the Nyquist criteria. The limitations of the input device necessitated
diagnostics that would output a signal in the 0 – 10 Volt range have a low input
impedance. The voltage diagnostic was a simple resistive voltage divider with an
approximately 16x attenuation and 1070 Ohm total impedance in order to
represent a small impedance compared to the 144 kiloohm input impedance of
the NI DAQ. The classic principle behind the voltage divider can be seen in
Figure 6. Problems sometimes occur with such a device in high frequency

26
systems, but the top speeds of this initial investigative work were on the order of
only 10 Hertz and were so deemed to not present an issue.
Figure 6: Example of Voltage Divider Diagnostic Schematic & Equation
The overall resistance of the voltage divider, being on the order of 1070 Ohms,
meant a “leakage” current on the order of hundreds of microamps out of a
system operating current of hundreds of amps. It was therefore decided to
account for this in a very general way inside the data-script and not to extensively
pursue any precision measurement. In order to form a voltage signal
representation of the current, a precision resistor current shunt was used. In
order to accommodate the range of possible currents, as well as the thermal load
produced via Joule heating, a special heatsink system was constructed. This is
shown in Figure 7.

27
Figure 7: Photo of Current Shunt Diagnostic Mounted on Heatsink

28
Thermal calculations were based on the thermal resistance of the current shunts
of RTH < 0.56 K/W. Then the equation for thermal resistance, shown in Equation
1, gave the necessary heatsink requirement.
Equation 1: Thermal Resistance
𝑅𝐻𝑆 =∆𝑇
𝑃𝑇𝐻− 𝑅𝑆
The chosen heatsink had two fans installed, powered alongside the control
circuitry, to produce the desired cooling. Temperature readings of the current
shunts, via the Fluke IR gun, showed a temperature rise of only a few degrees
Fahrenheit. This was well within acceptable operating parameters.

29
CHAPTER 3 - DESIGN
Design of Load Bank
To reiterate, the goals of the load bank were to create a load capable of
handling 10 kilowatts of power from the source, that was quick to design and
implement, and was flexible to allow incremental testing up to maximum power. A
picture of the finished load modules can be seen in Figure 8. The first load
module can accommodate eight resistors while the second can accommodate
sixteen. These two load modules can be outfitted with any number of resistors up
to their maximum and then placed in series or parallel to create a wide range of
possible resistive values. The conductors of the module are sufficiently
conductive compared to the individual resistors to negate any practical location
balancing issues.
In seeking to create a variable load, a modular approach was chosen. This
would allow configuration of load modules with varying numbers of resistors.
These load modules could then be placed in series and parallel combinations to
further increase the permutations. Originally, five such modules were envisioned,
each to handle four individual resistors. These would allow a multitude of
combinations over and beyond the desired 10 kilowatt power level. It also meant
the output power was distributed such that the power rating of the individual
resistors could be lower, making them easier to acquire. At the same time, the

30
Figure 8: Photo of first Load Module with Power Resistors Mounted

31
resistive value had to be chosen to accommodate both the lithium polymer test
battery and the then unknown experimental thermal battery. Proposed thermal
battery voltages ranged from 40 – 170 Volts. For an output of 10 kilowatts, this
implied a resistance range of 0.16 – 3 Ohms. The proposed topologies are seen
in Figure 9. The parallel/series topology has a resistance equal to the individual
resistances and a power requirement for the resistors of one-sixteenth the total
or 625 Watts for 10 kilowatts total. The parallel topology has a resistance of one-
Nth the individual, dictating twenty 3 Ohm resistors to near 0.16 Ohms. The
power dissipated by each would then be 500 Watts. To add safety the power
requirements were upsized to 1000 Watts. The resistance of three (3) Ohms was
then chosen as a value that could be outfitted in parallel combination to extract
sufficient power from the low voltage lithium polymer batteries for system testing
and validation while then being reconfigured in series and parallel to handle the
thermal battery experiments. In order to handle that great a power the resistor
types were limited. In order to keep with the philosophy of simplicity and speed a
wirewound resistor was chosen over other types. Wirewound resistors can
handle large power dissipation without additional thermal management. A
wirewound resistor is literally a wire of special material wrapped around a
ceramic core and coated, in this case with silicone. The downside of a wire
resistor is that it has inductance due to the physical geometry of a wrapped
conductor. A “non-inductive” type was ordered to reduce this effect.

32
Figure 9: Sample of Possible Power Resistor Topologies
As a sense of scale, another component was a similar resistor for which
inductance did not matter and had a measured inductance of around 170
microhenries. The load bank resistors had a measured inductance of around 3
microhenries; a significant improvement. To verify that this inductance value
would not hinder the experiments, simulations were done in LTSpice
SwitcherCAD. The simulations were done with the possibility of a 170 Volt
thermal battery still a possibility. The inductance of the possible wirewound
resistors was estimated as 10 microhenries. This can be seen in the schematic
used for simulation in Figure 10. Calculations of the dominant frequency of a
rectangular pulse train indicated that even at 100 Hertz, the effect of the
inductance would be minimal compared to the individual resistor values. The
simulation was run for a rectangular pulse train with a 50% duty cycle at both 100
and 1000 Hertz. As can be seen in Figure 11, any inductive effect is negligible, to

33
the point of being unnoticeable. In Figure 12, the effect of the inductance is
evident. However, this frequency was beyond what was expected to be tested.
Further, the 10 microhenries inductance estimate was shown to be adequate
after buying and receiving the resistors which had a measured inductance of
approximately 3 microhenries across 10 to 100 Hertz.
The output calculations then showed a Li-poly of 25 Volts over twenty
parallel 3 Ohm resistors having a current of 167 Amps. The thermal battery
output was calculated as between 60 and 250 Amps, instantaneous, but with 200
Amps a more likely maximum as the lower voltage battery was already being
dismissed.
The flyback diode then had to be chosen based on the maximum current
above. In order to account for safety and expandability the performance of the
component diode was chosen to be around three times larger than necessary.
The reverse voltage of 600 Volts was more than sufficient for the needs of the
project. The reaction speed of the diode was also more than sufficient for the
expected switching frequencies of 10 Hz.
Design of Diagnostics
The diagnostic goals were to digitize data from the experiment for
analysis. This was done through a simple voltage divider for the voltage and a
series current shunt for the current. The voltage divider had to be designed to
accommodate the low input impedance of the National Instruments Data
Acquisition device.

34
Figure 10: Inductance Simulation Schematic
Figure 11: Inductance Simulation Result at 100 Hz

35
Figure 12: Inductance Simulation Result at 1000 Hz
The current shunt had to be designed to accommodate the varying levels of
current from the various testing and experimentation scenarios while outputting a
signal that was strong compared to noise and accurate to the DAQ while
maintaining thermal management to prevent overheating or destruction. Another
limitation was a part limit of 50 Amps, necessitating the use of several shunts for
current sharing. Then, a desired 20 Amps might be shared over two 100 milliohm
current shunts, resulting in a shunt power of 10 Watts and a voltage of one Volt.
However, the shunt power limit was 100 Watts, so 150 Amps would be shared
over four 50 milliohm shunts to produce 70 Watts in each shunt at a voltage of
1.9 Volts. The thermal requirements could be found from this and the current
shunt’s thermal resistance of less than 0.56 K/W and are shown in Equation 2.
Equation 2: Current Shunt Heatsink Requirement
𝑅𝐻𝑆 = 70 − 25 °𝐶
70 𝑊− 0.56
𝐾
𝑊= 0.08
𝐾
𝑊
A heatsink would then need to be matched to this, bearing in mind that this is a
constant on specification and that pulsed use would allow safety margin and
some overloading.
36
The voltage divider had to provide adequate attenuation for input to the
DAQ, while maintaining a diagnostic voltage level sufficiently above potential
noise levels, being small compared to the DAQ input impedance, being large so
as to not overly load the source battery, and having power dissipation
appropriate to the voltage levels. Keeping the resistances small would meet both
the DAQ input impedance requirement and the power dissipation requirement.
An overall resistance in the kiloohm range was desired to limit the current drain
on the source battery. From this an overall target of 1500 Ohms was chosen. An
attenuation of 15x was deemed reasonable for a maximum practical voltage of
120 Volts over a nominal 100 Volts from the thermal battery. Standard resistance
values of 68 and 953 Ohms were chosen as a first guess to meet the needs. This
resulted in an output of 8 Volts from 120 Volts and 1 Volt from 15 Volts, which
met the needs of the DAQ. The resistances would only draw milliamps from the
source battery while being very small compared to the 144 kiloohm input
impedance of the DAQ. The power requirements could then be estimated from
the voltage and resistances as 1 Watt and 10 Watts (with safety margin) for the
68 and 953 Ohm resistors, respectively. The practical values were slightly
different, but not overly so, and were measured and recorded for use in the data
analysis.
Design of Switching
The chosen switching element was an Omron relay. This met the needs of
design speed and simplicity as well as far surpassing the 100 Volt, 100 Amp
general requirements of the project. The Omron relay is capable of switching 400

37
Volts and 200 Amps over 3000 repetitions. The speed of the relay is nominally 4
milliseconds to release and 15 milliseconds to operate. The contact resistance is
typically 0.2 milliohms with a max of 30 milliohms and the open insulation was
rated as 1000 Megaohms.
Figure 13: Photo of Relay
Design of DAQ
The data acquisition goals were to get the data necessary to definitively
evaluate the performance of the batteries. This meant that the signals acquired
had to be strong, vis-à-vis noise, sampled frequently enough to define the signal
without oversampling which would result in data overload, within the capabilities

38
of the system to produce and the DAQ to acquire, and in a useable format for
data processing. In order to reject noise and keep with the project philosophy of
speed in implementation, the output signals were decided to be kept around and
above one (1) Volt in amplitude. At the same time, the limit of the National
Instruments Data Acquisition device was ten (10) Volts for maximum accuracy.
These dictated the design of the diagnostics in the forms of a voltage divider for
measuring voltage and a resistive series current shunt for measuring current.
The accuracy of the NI DAQ is listed as 14.7 mV [13], and was deemed to be
more than sufficient for the needs of the initial stage of the project. Again, the
preliminary nature of the investigation, to make a first determination of whether
the thermal batteries could even survive loading of a pulsed power level and
nature, aided the swift implementation of the test setup. At the same time the
modular nature of the test setup assured that while a $300 DAQ device was
sufficient for the initial stage, a more accurate (expensive) DAQ device could be
swapped into the system later if the need arose. The NI DAQ device also
presented a challenge of a relatively low input impedance of 144 kiloohms. This
necessitated an even lower impedance for the diagnostics. This was met through
design of the voltage divider to have an overall impedance nominally in the 1500
Ohm range, or one-percent of input impedance. This was then within the
capabilities of the system to produce. The current shunt also had to be
expandable to output a strong enough signal for low currents without being an
overload when testing large currents. A modular design to the current shunt then
met this goal. The sampling rate of the device was 48 kS/s [13]. With the top rate

39
of the switching relay around ten (10) Hertz, the DAQ was more than sufficient
and was set at a lower level to avoid data overload caused by oversampling. The
output of the NI DAQ software was a simple text file with columns of data that the
MATLAB data-script could easily read and use.
Figure 14: Photo of DAQ
Design of Control
The control system handled battery activation, system switching, and
safety aspects of the system. To this end, a microcontroller was chosen as the
system “brain” because a microcontroller can be programmed for a multitude of

40
input/output responses. The microcontroller could be, and was for some testing,
programmed with various switching scenarios in a single run. This allowed
testing of Li-poly batteries under various loads in a single run, rather than
reprogramming and retesting several times. The microcontroller could also use
preprogrammed series of events to control activation of the thermal batteries
prior to a test run. Lastly, the microcontroller I/O allowed implementation of a
safety system for the test stand.
Since a major part of this preliminary work was to determine if the thermal
batteries would even survive high current discharges, safety was a primary
concern from the outset. To this end, one of the first items to be implemented
was a manual, turn-key, switching mechanism to control system operation. This
would allow an operator, and only an authorized operator possessing a key, to
start system operation. Once operating, this mechanism also allowed an operator
to cease system operation on command. This would allow de-loading of the
thermal batteries should the data being acquired indicate a problem. Such a
problem was anticipated to be observed as a large shift in output voltage, outside
of a normal battery discharge curve. No such data were ever encountered and it
is believed that no internal battery faults occurred on the basis of the output data
being free of anomalies as seen in Figure 15.

41
Figure 15: Thermal Battery Data with no Apparent Anomalies
As part of the final control sequence, the key signaled the activation of the
thermal batteries. The thermal batteries were activated via a built-in bridgewire,
or resistive heating element. Applying the specified current across this precision
resistor for the specified time allowed the buildup of heat that melted the
electrolytes and began the chemical reactions. The activation requirements are
discussed later, suffice it to say that they were wholly unknown when the control
was being developed. Again, the microcontroller architecture allowed complete
flexibility where the activation was concerned. This is because the microcontroller
can read input and activate outputs as programmed. The practical side of this is
that most things can be implemented in such a way as to take a high-impedance
digital signal to operate, and this was how the activation circuit was tied into the

42
control circuitry. The microcontroller then took the “start” signal from the operator,
actuated the activation circuitry for the precise time desired, waited a precise
time as specified by the manufacturer for the battery chemical reactions to fully
begin, then started the system switching for the test.
The switching controlled by the microcontroller used a MOSFET to
interface a high-impedance output from the microcontroller to the switching relay.
The microcontroller had 64 KB of memory but only used around 550 bytes for the
final testing program. The amount of memory dictates how many switching
profiles could have been stored in the microcontroller. For testing of the Li-poly
batteries, as many as ten (10) switching profiles were run back-to-back for time
periods of thirty (30) seconds to a minute each. That particular test featured ever-
increasing switching speeds to determine the fastest practical switching speed of
the relay under high (100 Amp) loads. The programmable nature of the
microcontroller allowed varying frequencies and duty cycles or, as the final
thermal battery tests were conducted, individual pulses with long rest periods
compared to the pulse length.
Figure 16: Control System Schematic

43
Figure 17: Control System Photo
Design of Activation
The thermal batteries, as previously mentioned, are unique in that the
electrolytes are solids under normal conditions. This gives them the advantage of
a long shelf life, because they have no self-discharge, on the order of ten to
twenty years. This also makes them highly stable for transport and in terms of
shock, vibration, spin, or other stresses of duty. On the other hand, it does mean
that the thermal batteries need to be “activated,” which is to say that the
electrolytes need to be liquefied for the chemical reaction to produce energy, i.e.
electrical potential at the terminals. This activation is accomplished in various
ways depending on the specific battery. Generally, pyrotechnics are embedded
throughout the battery that will raise the electrolytes to a proper operating
temperature when set off. This highlights a reason why thermal batteries are one

44
time use. Aside from the electrolytes recombining, the limiting factor for thermal
battery operation is that there is only so much thermal energy stored in the
pyrotechnics. Once that is used to activate the battery, the chemical electrolytes
shed heat through the battery casing and re-solidify, ending the chemical
reaction. The activation of the pyrotechnics can be done with chemical means
and can be triggered by shock or acceleration in some applications. However,
the more stable method and the method implemented in the batteries tested, is to
use a bridgewire. A bridgewire is a low resistance, high temperature wire which
will reach the temperature necessary to ignite the pyrotechnics when a proper
current is passed through it. As a safety measure, low currents will not set off the
pyrotechnics because the bridgewire will not become hot enough. This ensures
that a purposeful ignition is accomplished and currents up to 1 Amp for 5 minutes
are insufficient for activation. The activation of the battery requires a current of
several amps for a period on the order of tens of microseconds to be placed
across the bridgewire. As mentioned, the logistics of this were handled by the
microcontroller, as interfaced through a MOSFET and solid-state relay, and
powered by an independent Li-poly source. The independent Li-poly source
ensured that the several amp current required would not come from the
microcontroller primary power source which could have caused a voltage drop
reset and system instability. The goal then was to properly activate the battery by
exceeding the activation specifications without overstressing the bridgewire to
the point of premature failure. The independent activation circuit accomplished
this. After finding the specification of the battery’s activation squib to be a one

45
Ohm bridgewire needing 3.5 Amps for 10 milliseconds, a resistor was chosen to
provide approximately 4 Amps through the bridgewire from the 16.8 Volt Li-poly
power source.
Figure 18: Activation System Schematic

46
CHAPTER 4 – TESTING (VERIFICATION)
Overall, the components of the system were tested before being brought
together. This allowed each component to be debugged and proven before
relying on it to function. As the components were proven they were integrated to
form the system and tested for overall system performance. These performance
tests were all performed with lithium-polymer batteries as the power source. This
was done because the Li-poly batteries could be reused, where the thermal
batteries, aside from not being available at the time, were one-time use and
costly.
Testing of Control
One of the first components of the system to be implemented was the
control. The control system handles the switching pattern as preprogrammed in
the microcontroller. It also allows activation and deactivation of the system at the
operator’s discretion. The testing needed to demonstrate that the microcontroller
could send the appropriate signals as output to the MOSFET that would tie in the
switching relay. There was also a matter of measuring the current drawn by the
control system to ensure that the control battery would last long enough to
complete any experimental run. Since the experimental runs could possibly last
for 30 minutes, a goal of twice that was considered necessary. Additionally, the
safety aspect of starting and stopping the switching needed to be tested. Testing

47
the output of the microcontroller was done by observing the output on an
oscilloscope.
The current was measured using a digital multimeter as 100 milliamps,
translating to a runtime of 22 hours from the 2200 milliamp-hour source Li-poly
batteries. Later addition of fans for thermal management of the current shunt
diagnostic raised the drawn current to 500 milliamps, requiring recalculation of
the runtime as 4.4 hours. This was deemed more than adequate for the possible
runtime needs of the experiment.
The safety mechanism was tested simply through application. When
powered on the control system set the switch to open. It was not until operator
activation that the switching began. After operator intervention the control system
stopped the switching mechanism, returning the system to an open state. These
were tested through observation on an oscilloscope.
Testing of Diagnostics
The diagnostics required testing to allow precise measurement of the
system output signals. The voltage shunt needed to have a known resistance in
order to properly scale the voltage signal. The current shunt needed to have a
known resistance to properly scale the current signal. These measurements were
made using a HP LCR meter. The meter itself needed to be verified and this was
done through cross-checking with another meter and using precision resistances.
While it would have been ideal to have a fully calibrated meter on hand, this was
not feasible. However, a second HP LCR meter was available and more than ten
(10) precision, 1-percent resistors valued at 1, 10, 50, and 100 milliohms were

48
available. Using the two meters and the numerous precision resistors, it is
believed that the meters are reading within the tolerance of the resistors and
represent enough precision to characterize the diagnostics for use. The voltage
divider diagnostic resistors were measured to be 67.0 and 1003 Ohms,
respectively. The individual precision resistors were all measured as their stated
value, to within the accuracy of the measuring equipment. This gave a voltage
attenuation factor of 16x, a current attenuation factor (depending on
configuration) of 80x, and a corresponding power attenuation factor of 1280x.
Testing of Load
The load was tested in several ways. The individual wirewound resistors
were tested with the HP LCR meter used previously. The results of this are
included in Table 3.
Table 3: Measured Load Resistor Values
Resistor Frequency (kHz) R (Ohms) L (uH)
0.1 2.95 1.7
I 1 2.95 1.7
10 2.95 1.66
0.1 3.01 0.6
II 1 3.01 1.7
10 3.01 1.7
0.1 3 2.2
III 1 3.01 1.8
10 3.01 1.72
0.1 3.01 2.1
IV 1 3.01 1.8
10 3.01 1.75
0.1 2.99 2.8
V 1 2.99 1.8
10 2.99 1.78
0.1 2.97 2.9

49
Resistor Frequency (kHz) R (Ohms) L (uH)
VI 1 2.97 1.8
10 2.97 1.76
0.1 3.01 2.6
VII 1 3.01 1.7
10 3.01 1.67
0.1 3.01 2.7
VIII 1 3.02 1.8
10 3.02 1.78
0.1 3.01 2.8
IX 1 3.01 1.8
10 3.01 1.79
0.1 2.99 2.9
X 1 2.99 1.8
10 2.99 1.78
0.1 3.01 3
XI 1 3.01 1.8
10 3.01 1.74
0.1 3 2.9
XII 1 3 1.8
10 3 1.75
0.1 2.97 3.1
XIII 1 2.98 1.8
10 2.98 1.76
0.1 2.98 2.9
XIV 1 2.99 1.8
10 2.99 1.78
0.1 2.99 2.8
XV 1 2.99 1.7
10 2.99 1.74
0.1 3.01 2.7
XVI 1 3.01 1.8
10 3.01 1.77
0.1 2.99 2.8
XVII 1 2.99 1.8
10 2.99 1.77
0.1 3.01 3.1
XVIII 1 3.01 1.8
10 3.01 1.8
0.1 3.01 1.9
XIX 1 3.01 1.8
10 3.01 1.77
0.1 3.02 3.2

50
Resistor Frequency (kHz) R (Ohms) L (uH)
XX 1 3.02 1.8
10 3.01 1.76
0.1 3.01 3.1
XXI 1 3.01 1.8
10 3.01 1.79
0.1 3 3
XXII 1 3 1.8
10 3.01 1.8
The load modules were tested along a single node and found to have a
resistance below the order of the LCR meter. This was expected as the half-inch
square copper bars used as conductors were expected to have a resistance on
the sub-milliohm order. Experiments were run with the Li-poly batteries that
allowed some measurement of the total load bank plus system resistance. The
system represents additional resistance through the current shunt, which is
known, and through the relay, which has a specification range of approximately
30 milliohms. To within the manufacturer’s specification of the relay resistance,
the system resistance was accurately read on test runs. This can be seen in
Figure 19. The Li-poly battery tests also provide an indication that the inductance
is not problematic at the speeds of the present preliminary system. This is
evident partly in the fact that noise on the voltage signal is filterable using a
sliding window. This can be seen in Figure 20, where the top half of the figure is
unfiltered and the bottom half has a random noise reducing filter applied.

51
Figure 19: System Resistance from MATLAB data-script
The other is the lack of disfiguration of the current and voltage waveforms as
seen in collected data. If the system were overly inductive, one would expect to
see corresponding disfiguration of the square pulses, but this is not found. An
example of this can be seen in Figure 21. Here, an inductive effect is not seen,
even at high currents, though the effect of the battery’s declining voltage can be
seen at the start of the pulse.

52
Figure 20: Unfiltered (top) vs. Filtered (Bottom) Voltage Signal

53
Figure 21: Demonstration of Square Form of Current Pulses
Testing of Switching
The primary focus of testing the relay was in determining the switching
speed capability. While the on and off state resistances might normally be of
interest, they are less important for this preliminary investigation. The reason is
that the off-state resistance need only be large enough to be an effective open to
the battery, which is to say large enough that the current and associated energy
loss are negligible to the experiment. Since the currents were desired to be in
excess of 50 Amps, 0.5% of this seemed an allowable leakage, and an open
resistance of 1 kiloohm would surpass that goal. More importantly, the open
resistance of the system was later shown to be greater than 10 kiloohms, as can
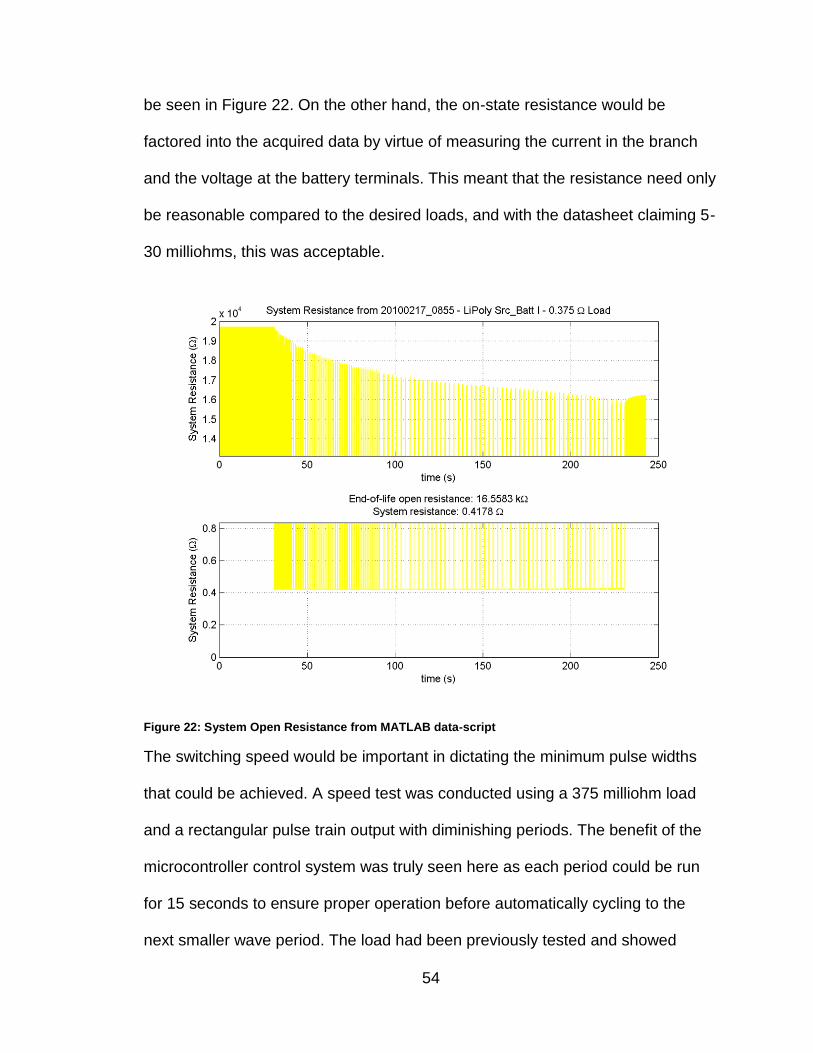
54
be seen in Figure 22. On the other hand, the on-state resistance would be
factored into the acquired data by virtue of measuring the current in the branch
and the voltage at the battery terminals. This meant that the resistance need only
be reasonable compared to the desired loads, and with the datasheet claiming 5-
30 milliohms, this was acceptable.
Figure 22: System Open Resistance from MATLAB data-script
The switching speed would be important in dictating the minimum pulse widths
that could be achieved. A speed test was conducted using a 375 milliohm load
and a rectangular pulse train output with diminishing periods. The benefit of the
microcontroller control system was truly seen here as each period could be run
for 15 seconds to ensure proper operation before automatically cycling to the
next smaller wave period. The load had been previously tested and showed

55
currents in the 45-55 Amp range, which was deemed sufficient for this relay
opening/closing test. The duty cycle was chosen as 65% based on the relay’s
datasheet information for opening and closing times. A table of the wave periods
used is shown in Table 4.
Table 4: Speed Test Trial Results
Period (ms) Time On (ms) Time Off (ms) Pass/Fail
400 260 140 Pass
300 195 105 Pass
250 162 88 Pass
200 130 70 Pass
175 113 62 Pass
150 97 53 Pass
125 81 44 Pass
100 65 35 Pass
75 48 27 Fail
50 32 18 Fail
40 26 14 Fail
30 19 11 Fail
The relay properly operated up to the 10 Hertz speed, shown in Figure 23, then
did not cycle open/closed at faster rates. This is due to the nature of the relay
and is a physical limitation. It was determined that the likely real-world application
load would involve a DC-DC converter operating at tens of kilohertz. This was
beyond what the system was envisioned to perform. However, a DC draw could
approximate that kind of loading in a very conservative way and this, the system
was capable of. Consultation with possible end users indicated that current draw
times would be on the order of a quarter-second. This was well within the ability
of the relay to perform.

56
Figure 23: Speed Test Stage 8, showing Fastest Viable Speed
Testing of Activation
The testing of the activation circuit was straight-forward. It was a simple
matter of placing a dummy load in place of the thermal battery’s pyrotechnics.
The activation circuitry can be seen in Figure 24. The dummy load needed to
handle the power involved, which should have a maximum of 25 Watts (5 Amps
max into 1 Ohm). The testing then utilized a Tektronix current probe which was
validated using the BK1692 power supply putting 15.2 Volts across one of the 3
Ohm resistors. This showed that the current probe was operating as expected.
The microcontroller was programmed to deliver 20 millisecond shots, which
should be at 4 – 4.5 Amps. The monitoring oscilloscope captured the ten test

57
shots and showed them to be in the 4 – 4.5 Amp range as expected. The shots
also had the correct timing of 20 milliseconds. Since the thermal battery
activation specification calls for 3.5 Amps for 10 milliseconds, confidence was
high that the activation circuitry would perform the function correctly.
Figure 24: Photo of Activation & Control Circuitry

58
CHAPTER 5 - RESULTS
Results of Setup
After verifying the performance of the individual components, the system
was combined to run the experiments. An overview of the system can be seen in
Figure 25.
Figure 25: Photo of Final Test Stand Configuration
After combining the system components, a 3 Ohm load was setup for the first
thermal battery run. This was chosen to ensure that the drawn current would be
within the expected survival range of the thermal battery. This was based on an
analysis of the internal conductors, without accounting for thermal loss to the
environment. This also meant that the battery could be fully drained to gauge the
total internal energy. The microcontroller was programmed for a rectangular
pulse train with a period of one second and a duty cycle of twenty percent. This

59
meant the approximately 30 Amp currents during pulsing would equate to
approximately 15 Amps RMS since the RMS value equals the peak multiplied by
the root of the duty cycle as in Equation 3.
Equation 3: RMS Equation for Rectangular Pulse Train
𝐼𝑅𝑀𝑆 = 𝐷𝐼𝑝𝑘
This related to an expected run time of over twenty minutes. Past data collection
over that time frame indicated that the sampling frequency should be 500 Hz to
avoid oversampling, which amassed more data than MATLAB could handle. This
was still a sufficient sampling rate for waveform reproduction at the desired
switching speeds. The setup was then tested using a Li-poly battery to ensure
overall performance before using one of the expensive, one-time-use thermal
batteries. The results can be seen below in Figure 26. Since the experiment went
well, the stage was set for the first thermal battery run. The procedure of first
testing the setup with a Li-poly battery to ensure performance was continued
throughout the experiments. This was done to ensure that each new
experimental setup was operating correctly before using up one of the thermal
batteries.

60
Figure 26: Li-poly Battery Results preceding Thermal Battery 1 Testing

61
Results of Thermal Battery I – Baseline Energy Test
The first thermal battery was run at currents in-line with its performance
specifications in order to ensure survival and to gauge the amount of internal
energy to guide future experimental setups. The load used was 3 Ohms and the
microcontroller was set for a rectangular pulse train with a period of one second
and a twenty percent duty cycle. The power sources were attached and the
control brought online. The LabView DAQ software was setup to start data
capture after the battery voltage rose above a certain level to indicate activation.
The battery was activated using the keyed switch and from a safe distance. The
computer showed data capture in the expected voltage and current ranges and
the experiment was monitored to completion. Additionally, this experiment
allowed the removal of a top safety plate since the experiment had been
designed to be within the safe operation of the thermal battery. This allowed
temperature readings of the battery contact tabs to be taken. This was done to
judge how hot the internal components of the battery would be operating. The
internals could be as hot as 400 – 500 degrees Celsius, however the tab
temperatures never rose above 300 degrees Fahrenheit. This meant that the
model used to gauge conductor failure was very conservative and this helped
guide future experimental setups. The results of the experiment run can be seen
in Figure 27.

62
Results of Thermal Battery II – Progressive Stress Test 1
Thermal battery two was run with more guidance on the desired final
result, which was to judge the viability of thermal batteries as a power source for
pulsed power applications. In this kind of application, it was determined that the
likely power profile would be a single short pulse for the envisioned end use. The
pulse width in mind was 250 milliseconds. Since this would be rather wasteful
from a battery use viewpoint, it was decided to code the microcontroller for 500
millisecond pulses with 10 seconds of rest in between. This was a departure from
the rectangular pulse train mindset, although that is, essentially, what was still
being performed. The chosen load was 1.2 Ohms. This related to an expected
power of 8.3 kilowatts, with a peak current of around 83 Amps and a RMS
current of around 18 Amps. This was within the performance specifications of the
test system. The results of the experiment run can be seen in Figure 28. This
experiment was actually terminated early due to acquiring the necessary info, but
this was not done again, in order to gather more complete information on battery
energy content.
Results of Thermal Battery III – Progressive Stress Test 2
The setup for thermal battery three used the same pulse specifications,
but changed the load to 800 milliohms. This corresponded to a expected power
of 12.4 kilowatts, a peak current of 124 Amps, and a RMS current of 27 Amps.
The results of the experiment run can be seen in Figure 29.

63
Results of Thermal Battery IV – Progressive Stress Test 3
Thermal battery four used a load of approximately 600 milliohms. This
relates to a expected power of 16.7 kilowatts, peak current of 167 Amps, and
RMS current around 36 Amps. The microcontroller setup was altered to gain a
new perspective on the data. There were two test profiles that were alternated
between. The first was to have 500 milliseconds of on-time, followed by 9.5
seconds of rest, the second used a cycling of 100 milliseconds on, 100
milliseconds off, alternating for one second, followed by nine seconds of rest.
These were alternated between for the duration of the experiment. The reason
this was done was to judge the difference between a long pulse loading of the
battery and short cycled pulse loading of the battery. Therefore the battery was
loaded for a half-second and allowed to rest followed by a cycled loading that
should have the same energy content (time “on”) as the previous profile and
similar overall rest time. Placing them alternating in the test run allowed more
direct comparison of similar battery states. The results of the experiment run can
be seen in Figure 30.

64
Figure 27: Thermal Battery 1 Results Showing Energy Content

65
Figure 28: Thermal Battery 2 Results Showing Higher Current Draw

66
Figure 29: Thermal Battery 3 Results Showing Higher Current Draw
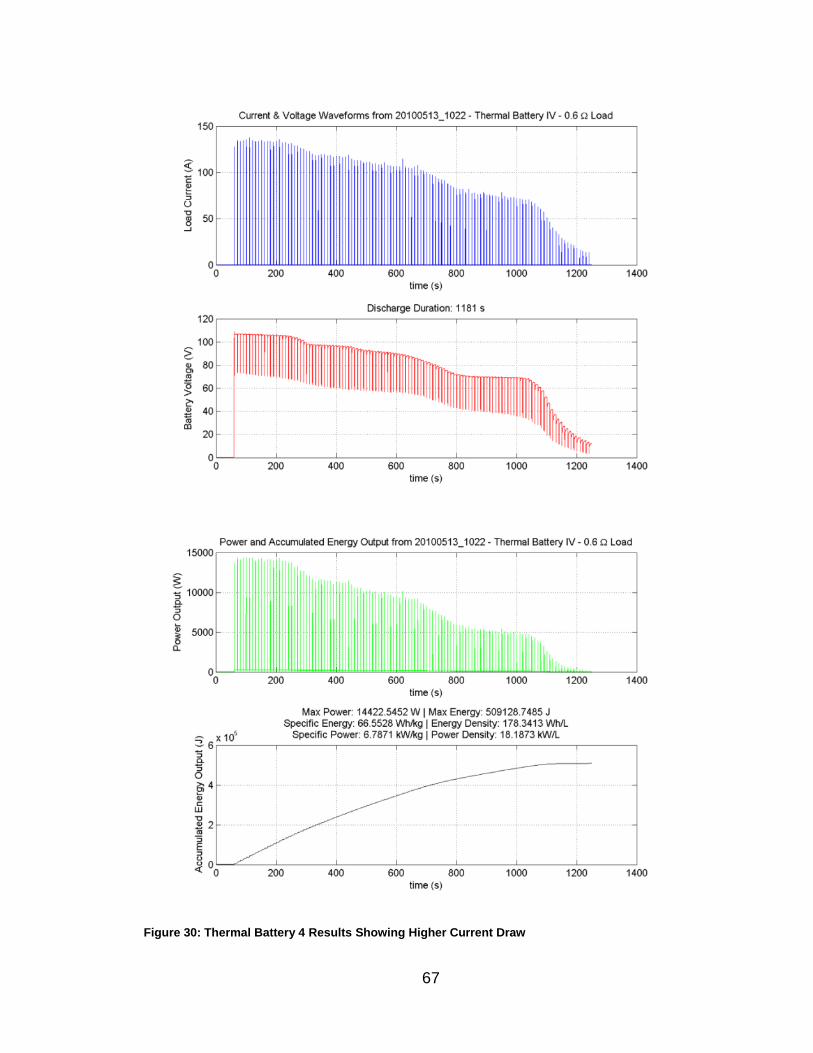
67
Figure 30: Thermal Battery 4 Results Showing Higher Current Draw

68
Results of Thermal Battery V – Final Stress Test
Thermal battery five was expected to be the last run, and so the
experiment was designed to run the system close to its limits. The load chosen
was 300 milliohms, partly because the previous experiment indicated a decline in
thermal battery performance at the high loading. The microcontroller used the
same setup as the last run. From this the peak current, which might have been
considered to be around 320 Amps, was actually considered to be around 80
percent of that, or 260 Amps. This relates to an RMS of around 60 Amps and a
peak power around 21 kilowatts. The RMS value was acceptable for system
components, but the peak current would actually stress the current shunts, albeit
for short periods. The load also would be stressed, but for short periods the
overload was allowed to be 5 times the rated load. Monitoring during the
experiment showed load thermal rise of approximately 70 degrees Fahrenheit,
which was acceptable. The thermal management of the current shunt diagnostic
had to be reviewed to ensure the shunt setup would accommodate this high
loading test. It was deemed acceptable for the 5% duty cycle since the RMS
current in each shunt would only be 15 Amps. Monitoring during the experiment
run indicated thermal rise of only 5 – 10 degrees Fahrenheit which was deemed
acceptable. It was also a concern that the battery would fail under this load, but
failure was not observed. The data collected closely mirrors that from other
experiments, indicating the internal conducting tabs did not cause failure under
this high loading. However, it is certain that the conducting tabs reached
progressively higher temperatures. It can be seen in Figure 31 that the “burn-tab”

69
(a temperature activated sticker that shows when a thermal battery has been
used) for batteries two though five shows incrementally more damage from the
experiments as more current was drawn. This damage is certainly the result of
harder loading causing greater internal conductor temperature which then
damaged the nearby burn-tab.
Figure 31: Photo of Progressively Charred & Melted Activation Tabs on Thermal Batteries
The results of the experiment run can be seen in Figure 32.
Results of Thermal Battery VI – Repeatability Test
While the remaining batteries were originally thought to be saved for future
work, it was decided to gather more data from them instead. The sixth run was a
repeat of the fifth to establish how performance might vary between batteries. It
was supposed that these carefully constructed and quality controlled batteries
would be very similar and this was seen in the results, shown in Figure 33.
Results of Thermal Battery VII – Unloaded Voltage Stability Test
The purpose of the seventh run was to examine how the voltage of the
battery might recover from the loaded state. This was done to support future
work in battery modeling. To this end the switching profile was adjusted to have

70
quarter-second pulses and two minute periods or a 250 millisecond pulse
followed by 119.75 seconds of rest time. The load was kept at 300 millliohms. It
was hypothesized that the short life of the thermal batteries would mean no
discernible voltage stabilization off-load, and that was seen in the results, as
shown in Figure 34.
Results of Thermal Battery VIII – Long Pulse Test
The purpose of the eighth run was to have longer pulses than previously.
This stressed the battery further and so was put off until the next to last test. The
load was kept at 300 milliohms, but the switching profile was adjusted. The new
pulse length was five seconds, or ten times longer than in test runs five and six.
The rest period was set at 85 seconds to keep the RMS current at an acceptable
level. The results are shown in Figure 35.
Results of Thermal Battery IX – Loaded Voltage Stability Test
The purpose of the ninth run was to examine how the battery voltage
might stabilize under load. This was done to support future work in battery
modeling. For this test the switching was set to a constant on condition. The load
then had to be adjusted to two (2) Ohms in order to keep the current within safe
limits for the system and battery. It was hypothesized that due to the short life of
the thermal battery, there would not be any voltage stabilization under load. This
was shown to be the case in the results, shown in Figure 36.

71
Figure 32: Thermal Battery 5 Results – Highest Current Draw & Power Exceeding Goals

72
Figure 33: Thermal Battery 6 Results – Repeatability of Test V

73
Figure 34: Thermal Battery 7 Results Showing no Unloaded Voltage Stabilization

74
Figure 35: Thermal Battery 8 Results – Long Pulses Exceeding Project Goals

75
Figure 36: Thermal Battery 9 Results Showing no Loaded Voltage Stabilization

76
CHAPTER 6 – ANALYSIS OF THERMAL BATTERY
PERFORMANCE
Looking at the thermal battery performance, for these purposes, is to
judge how feasible power extraction is and how thermal battery performance
compares to alternatives. For the purposes of this research, the goal was to
exceed 10 kilowatt bursts lasting a quarter-second. This would then set thermal
batteries on par with lithium-ion based batteries that were being explored for the
same purposes.
Thermal battery number one was run to examine the safety of operating
the battery and to judge approximately what energy would be available to guide
future experiments. To this end, a light load and larger duty cycle (20%) at short
intervals were used. This should minimize electrolyte loss due to thermal
shedding to the environment while not overloading the battery. The results,
shown in the previous section, demonstrate currents from 33 Amps down, over
approximately 20 minutes of life. The usable power levels occur over
approximately 1000 seconds with discernable plateaus noticeable. These
plateaus in the output are likely the cause of the battery’s internal chemical
reactions, possibly due to the internal structure, and are evident in all test runs.
The energy extracted from the battery is around 600 kilojoules. Since the end
purpose of the research is to judge the feasibility of a thermal battery as a prime
power source for a pulsed power device with a short lifetime, it is most useful to
examine the first power plateau, its level and duration. For thermal battery
number one, the first plateau is between 3500 and 3800 Watts, over the first 200

77
seconds of battery life. This three minute window can provide the basis for
examining future experimental runs. A comparison of the waveforms early and
late in this window can be seen in Figure 37. It can be seen that early-on, the
current waveform is a well-formed square pulse, while later in the window,
battery drop-off can be observed. This loss of output capability is the precursor to
the end of the plateau.
The second thermal battery tested had a discharge duration exceeding
1400 seconds, and was shut down early because the power output levels were
deemed below those of interest. The extended life is likely due to a combination
of lower duty cycle (~5%) operation and heavier loading providing more internal
thermal energy. In this run, the first three-minute window displays power output
at around 6500 Watts. For half-second pulses, this is very near the desired
outcome. This experiment running without incident gave confidence to the
feasibility of further runs. The output can be seen in Figure 38.
The third thermal battery continued the experiments with a smaller load
resistance to judge either the failure point or peak capability of the thermal
battery. Again, the thermal battery performed without indication of internal failure.
This run demonstrated some diminished capacity as the thermal battery’s output
was rather below the expected level. This is a function of the power output limits
of all batteries. The power output was measured between 7.5 and 8 kilowatts in
the early-life window. Output is in Figure 39.

78
Figure 37: Thermal Battery 1 Stages 1 & 2

79
Figure 38: Thermal Battery 2 Stages 1 & 2

80
Figure 39: Thermal Battery 3 Stages 1 & 2

81
The fourth thermal battery showed more of a gap between the expected
power output and the measured power output. This was seen as a limit of the
power output capability of the battery, but was later revisited as only a step closer
to that limit. There is a likelihood that the greater currents are causing internal
heating, evidenced by the disintegrating burn-off tabs mentioned earlier, which is
acting as a greater catalyst and reacting the electrolytes faster, using the
battery’s internal energy before it can be withdrawn. However, this can be
investigated in subsequent work while the focus here remains justifying thermal
batteries for a unique purpose. The power output over the first three minutes for
battery three ranges from 8000 to 9500 Watts. This is very close to the desired
output. The output can be seen as plotted in Figure 40.
The fifth thermal battery tested was loaded to try and get the most power
output possible, because it was perceived to be the last thermal battery that
would be tested. Once again, the plateau effect can be seen in a plot of the
power shown in Figure 41. The energy extracted is well below the first battery,
likely due to energy loss from quicker chemical recombination of the electrolytes
in the high-temperatures caused by high current loading. The life is similarly
diminished. However, the useful life of the initial three-minute window remains
and power output in this time frame ranges between 10 and 12 kilowatts. These
were for pulses of half-second length. This output exceeds the desired goal of 10
kilowatts for a quarter-second, verifying the validity of investigating thermal
batteries for pulsed power applications. The outputs of this test can be seen in
Figure 42, Figure 43, and Figure 44.

82
Figure 40: Thermal Battery 4 Stages 1 & 2

83
Figure 41: Thermal Battery 5 Power & Energy Graphs

84
Figure 42: Thermal Battery 5 Stages 0 & 1 Showing Power Exceeding Project Goals

85
Figure 43: Thermal Battery 5 Stages 2 & 3
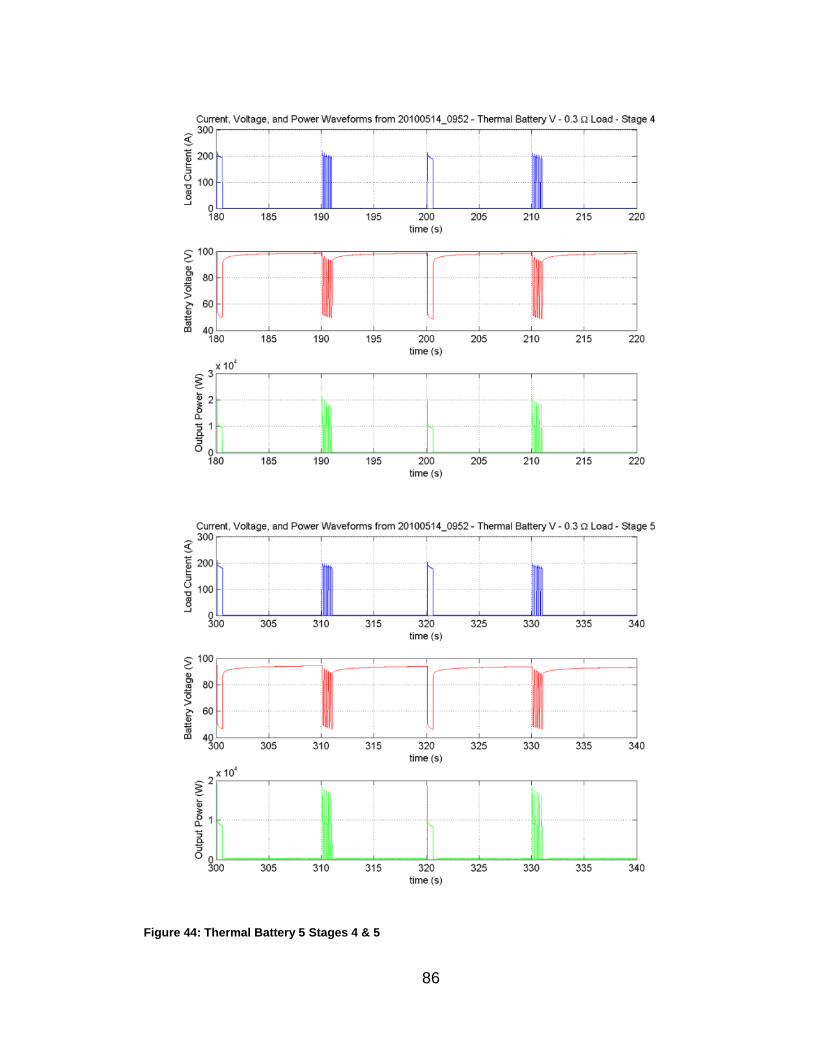
86
Figure 44: Thermal Battery 5 Stages 4 & 5

87
The sixth battery, being a repeat of the fifth run, has results very similar to
the fifth battery. The most important of which are shown in Figure 45.
The seventh thermal battery was used to support possible future modeling
efforts by examining the voltage behavior between pulses. The important results
is that thermal batteries, owing to their short life and large activated self-
discharge, do not demonstrate voltage stabilization between pulses. This can be
seen in Figure 46.
The eighth thermal battery was used to examine the effect of longer
pulses. The results demonstrate power output capability in excess of ten
kilowatts for a five second long pulse, both immediately after battery activation
and at 90 seconds after activation. This further demonstrates the feasibility of
using thermal batteries for pulsed power applications. Detailed results can be
seen in Figure 47.
The ninth thermal battery was also used to support possible future
modeling efforts. The constant on test was done to examine voltage behavior. It
was hypothesized that the nature of the thermal batteries, having a short life and
large self-discharge effect after activation, would result in no voltage stabilization.
This was seen in the results, as shown in Figure 48.

88
Figure 45: Thermal Battery 6 Stages 0 & 1 Showing Repeatability of Test V

89
Figure 46: Thermal Battery 7 Full Results Showing no Unloaded Voltage Stabilization

90
Figure 47: Thermal Battery 8 Stages 0 & 1 Showing Long Pulses Exceeding Goals

91
Figure 48: Thermal Battery 9 Stages 0 & 1 Showing no Loaded Voltage Stabilization
The power and energy densities of the experiments can be compared to
those previously published for thermal batteries. However, there is both little
information and wide discrepancy to these numbers. On one hand, the power
and energy densities have theoretical values [2,1.12] that are not achievable in
practice. Also, these values often are measured using methodologies biased
towards standard applications such as constant loading or relatively constant
loading. Very different results can be obtained when examining the kind of pulsed
loading done in these experiments. The design of the thermal battery can also
lead to altered parameters, as in [3] where a designed thermal battery with a goal
of 8 kW/kg over 5 minutes achieved 7.7 – 8.97 kW/kg over 5 minutes. The
specific powers and energies achieved under this thesis work are summarized in
Table 5.

92
Table 5: Thermal Battery Experiment Results of Peak Specific Powers & Energies
Thermal Battery Peak Specific Power (kW/kg) Peak Specific Energy (Wh/kg)
I 1.85 80.16
II 3.99 68.17
III 5.55 68.68
IV 6.79 66.55
V 11.8 56.30
VI 12.4 58.64
VII 10.5 60.41
VIII 11.4 51.41
IX 2.57 82.97
Typical specific powers and energies of lithium-ion and lithium polymer batteries
are shown in Table 6.
Table 6: Sample of Lithium-Ion Battery Specific Powers & Energies
Source Specific Power
kW/kg Specific Energy
Wh/kg
[14] 0.722 145
[14] 0.449 88
[14] 2.383 119
[14] 1.700 85
[14] 2.125 113
[2] N/A 150
[1] 1.500 64
[1] 1.350 70
[1] 0.300 144
[1] 0.315 155
Max 2.383 155
Min 0.300 64
Avg 1.205 113
StD 0.791 35
Again, direct comparison can be tricky since the numbers depend on the
discharge rate, however the results of several Li-poly batteries used during
various tests on the test stand can be seen summarized in Table 7.

93
Table 7: Sample of Lithium-polymer Experiment Results of Peak Specific Powers & Energies
Test Battery Load (milliohms) Peak Specific Power (kW/kg)
Peak Specific Energy (Wh/kg)
Operation Ctrl_Batt III 1500 0.857 58.0
Battery Src_Batt I 1500 0.932 91.3
Battery Src_Batt II 1500 0.921 95.1
Battery Ctrl_Batt III 375 3.57 144
Battery Ctrl_Batt III 375 3.68 130
Battery Ctrl_Batt III 375 2.96 133
Battery Src_Batt I 375 3.25 87.1
Battery Src_Batt II 375 3.32 94.0
Battery Src_Batt I 375 3.31 96.0
Battery Src_Batt II 375 3.31 98.2
Battery Src_Batt I 375 3.28 89.5
Battery Src_Batt II 375 3.32 91.1
Load Bank Src_Batt I 375 3.32 88.6
Load Bank Src_Batt II 375 3.33 87.3
Relay Speed Src_Batt I 375 3.33 84.2
Relay Speed Src_Batt II 375 3.31 89.9
High Current Src_Batt I 188 6.33 80.7
High Current Src_Batt II 188 6.43 79.9
High Current Src_Batt III 188 6.33 87.5
High Current Src_Batt I 188 6.26 88.1
High Current Src_Batt II 188 6.38 91.9
High Current Src_Batt III 188 6.44 104
TB I Prep Src_Batt III 3000 0.488 119
TB I Prep Src_Batt III 3000 0.486 24.5
TB I Prep Src_Batt III 3000 0.488 22.0
A more useful comparison would be between the Li-poly batteries and the
thermal batteries which were each used on the same load. From this it is
observed that the thermal batteries have performance values in excess of the
corresponding Lithium-polymer batteries in every case.
The end result is that thermal batteries were successfully investigated.
There were no evident failures of the batteries. The outputs indicate performance
in the target zone for certain pulsed power applications. The outputs also indicate

94
performance on par with or exceeding modern Lithium based batteries. The
advantage of shelf-life that thermal batteries have over Lithium-ion type batteries
then further justifies the continued investigation of thermal batteries for pulsed
power applications.

95
CHAPTER 7 – FUTURE WORK
There are a number of future steps that can be taken to expand upon this
preliminary investigation. Now that the feasibility of thermal batteries has been
shown, refinement will allow the engineering decisions of what battery provides
the best service in a given application. The test refinement could include
expanding the capabilities of the test stand to accommodate much greater
currents in order to gauge the maximum power available from a thermal battery
in a single shot before failure. Other alterations could include the design,
construction, and testing of a power semiconductor based load for the test stand.
This would replace the resistive load and allow constant current and constant
power discharge tests. A further continuation of that work would be the
development of a model similar to that formed for Lithium-ion batteries in [14]. In
that paper, a SPICE model was developed for Li-ion batteries through testing at
constant current discharges, with rest at multiples of 10% voltage levels. Some
alterations to that work would likely be necessary. For instance, those authors
reused a single battery for multiple constant current (CC) tests, and that would
not be possible with thermal batteries. Those authors stopped discharging the Li-
ion batteries to stabilize a rest voltage level at 10% multiples, but open-circuiting
the thermal battery is unadvisable. There could also be other issues that make
thermal batteries unsuited to the battery model used by those authors, but this
would have to be carefully examined. Thermal batteries then represent a number
of possible future investigations.

96
CHAPTER 8 - CONCLUSIONS
The primary goal of this investigative work was to gauge the feasibility of
thermal batteries as a prime power source for pulsed power applications. In this
regard the work was a success. Thermal batteries were observed to be capable
of outputting between 10 and 12 kilowatts for half-second pulse lengths, over the
first three minutes of thermal battery life.
Thermal batteries have a unique interest as portable pulsed power system
sources because of their theoretically high specific energy and their specific
power capability. Additionally, thermal batteries have no self-discharge when
stored, since the electrolytes are actually solid until the thermal battery is
activated via a heat energy source, leading to shelf-lives of ten to twenty years.
However, thermal batteries are not typically used for such high power operations
as pulsed power supplies require. Typically they are used for some constant light
loading and some overlaid millisecond scale pulses. Thermal batteries are also
designed to exceed the specifications of their end use, without trying to push the
performance envelope. This leads to a lack of information regarding exactly what
thermal batteries are capable of if tested to their limits. This necessitated testing
of some thermal batteries to determine the feasibility for the desired application.
In order to meet the goal, a test stand was devised, designed,
constructed, verified, and utilized. This was done with the goals of speed and
accuracy in mind. There was a chance that the thermal batteries would be unable
to go much beyond their traditional usage and power output. This is why speed of

97
design and implementation was desired; in order to quickly determine if the
thermal batteries would fail when stressed beyond their original usage profiles.
Fortunately, the thermal batteries acquired were able to be slightly modified to
allow greater current handling of the internal conductors and none of the tested
batteries failed.
The test stand was designed using simple components to aid the speed of
design and construction. The load was a simple resistive load and switching was
accomplished using a high power relay. While the relay was slow compared to
what might be used in a switching power supply, its DC pulse should be sufficient
for the initial feasibility investigation while allowing pulses to be short enough for
application approximation. The control was implemented through a
microcontroller that allowed great flexibility in loading test profiles. The
microcontroller also handled activation through an external power supply and
switching system. These subsystems were tested as they were built using
Lithium-polymer hobby batteries obtained for this purpose. The Li-poly batteries
were rechargeable and inexpensive, contrasting the expensive one-time use
thermal batteries which would not have been good verification test subjects. The
Li-poly batteries were also used to test and break-in the whole system before the
thermal battery tests.
The results were obtained for a number of thermal battery runs with
successively smaller load resistances. These tests showed the thermal batteries
to be capable of outputting the predetermined goal of 10+ kilowatts for at least a
quarter-second. The tests lead up to this with the thermal batteries showing no

98
signs of internal failure such as sudden voltage drops or current interruptions.
The final testing exceeded the goal with 10 – 12 kilowatts output for half-second
pulses over the first three minutes after battery activation. This result verifies the
feasibility of thermal batteries on a similar level to other tested Li-ion batteries.
From this point it is a matter of advanced investigations to better
determine the full potential of thermal batteries. This would include expanded test
stand capabilities to test the batteries to failure. It would also include a load
redesign to a power semiconductor load capable of constant current and
constant power profiles. This expansion might allow modeling of the thermal
batteries. However, since a thermal battery operates in subtly different ways than
traditional batteries, i.e. that it loses power once activated due to thermal loss
and resolidification of electrolytes, such a model would need extensive research.

99
References
[1] R. Dell and D. Rand, Understanding Batteries, 1st ed. Royal Society of Chemistry, 2001.
[2] D. Linden and T. B. Reddy, Handbook Of Batteries, 3rd ed. McGraw-Hill Professional, 2001.
[3] R. Guidotti, G. Scharrer, E. Binasiewicz, and F. Reinhardt, “Feasibility of a 8 kW/kg, 5 minute thermal battery,” in Conference Record of the Twenty-Third International Power Modulator Symposium (Cat. No. 98CH36133), pp. 267-270.
[4] J. Embrey, M. Williams, and K. Press, “Design studies for advanced thermal batteries,” in IEEE 35th International Power Sources Symposium, pp. 231-235.
[5] Ronald A Guidotti, Frederick A Reinhardt, and Gregory L Scharrer, “Development of a High-Power and High-Energy Thermal Battery,” United States. Dept. of Energy, 2000.
[6] Paul Butler, Cliff Wagner, Ron Guidotti, and Imelda Francis, “Long-life, multi-tap thermal battery development,” Journal of Power Sources, vol. 136, no. 2, p. 240, 2005.
[7] T. R. Crompton, Small Batteries. New York: Wiley, 1982.
[8] S. C. Levy, Battery Hazards and Accident Prevention. New York: Plenum Press, 1994.
[9] R. Jasinski, High-Energy Batteries. New York: Plenum Press, 1967.
[10] J. Wells and S. Brill, “Thermal battery performance demonstration for advanced tactical and strategic applications,” in Proceedings of the 34th International Power Sources Symposium, pp. 156-159.
[11] T. P. J. C. M. B. MRCS, Battery Reference Book, Third Edition, 3rd ed. Newnes, 2000.
[12] Ronald Guidotti and Patrick Masset, “Thermally activated ("thermal") battery technology,” Journal of Power Sources, vol. 161, no. 2, p. 1443, 2007.
[13] National Instruments, “User Guide and Specifications NI USB-6008/6009,” National Instruments, May-2008.

100
[14] A. M. Stux and K. Swider-Lyons, Survey of Commercial Small Lithium Polymer Batteries. 2007.
[15] M. Chen and G. Rincon-Mora, “Accurate Electrical Battery Model Capable of Predicting Runtime and I–V Performance,” IEEE Transactions on Energy Conversion, vol. 21, no. 2, pp. 504-511, 2006.